Embed Size (px)
Citation preview

Munich Personal RePEc Archive
The impact of deceptive advertising on
Customer loyalty: A case of
Telecommunication industry in Karachi,
Pakistan
Iqbal, Saira and Siddiqui, Dr. Danish Ahmed
Karachi University Business School
31 March 2019
Online at https://mpra.ub.uni-muenchen.de/93038/
MPRA Paper No. 93038, posted 01 Apr 2019 09:07 UTC
1 | P a g e
The Impact of Deceptive Advertising on Customer Loyalty: A case of Telecommunication
Industry in Karachi, Pakistan.
Saira Iqbal1
Research Scholar Karachi University Business School, University of Karachi, Pakistan
Dr. Danish Ahmed Siddiqui
Associate Professor Karachi University Business School, University of Karachi, Pakistan
ABSTRACT
This study examined the impact of deceptive advertising on customer loyalty in the telecommunication industry of Karachi, Pakistan. This research was quantitative in nature. The sample size was 250, questionnaires were distributed electronically and manually. Exploratory Factor Analysis (EFA) was used to analyze the data with the help of SPSS. Confirmatory Factor Analysis (CFA) and Structural Equation Modeling (SEM) using AMOS, conducted to ensure the model and testing the hypothesis. The outcome of the present study verifies that word of mouth has a strong significant influence on customer loyalty. Hence customer satisfaction and customer trust are causing word of mouth in a positive and significant way. So it shows that there is a positive and strongly significant influence of customer satisfaction and trust on customer loyalty with the mediation of word of mouth. On the other hand, deceptive ads are causing word of mouth in a negative way. Hence it is concluded that deceptive ads have a negative influence on customer loyalty with the mediation of word of mouth. This study suggested that in order to increase customer loyalty and build a long-term relationship with the customer's telecom companies should focus on accurate information and rendering the level of competitive services to their customers.
Keywords : Deceptive advertising, customer satisfaction, loyalty. word of mouth, customer trust.
1 Corresponding Author

2 | P a g e
1. INTRODUCTION
In today's competitive business environment no business can become a market leader unless they
spent millions of dollars in promotional purposes. The key purpose of advertisers is to achieve
valuable consumers by influencing their thoughts, knowledge and buying behavior.
There are various awareness modes of communication such as events, personal selling, public
relations, direct marketing, word of mouth marketing, and advertising ((Fill, 1999); (Kotler,
2010)). Personal selling is also known as face to face selling where one person (salesman) tries
to convince the customer in purchasing a product (Definition of 'Personal Selling'). Public
relations( PR) is the method individuals and companies communicate with the media and public.
A PR expert communicates with the target audience indirectly or directly hrough the media with
an aim to maintain a positive image and generate a strong connection with the audience
(PAHWA, 2018,). Direct marketing is the process of selling the product or service directly to the
people e.g.by telephone selling or by mail order (Outreach). Now a day's customer faces the
challenge of managing with these modes of marketing communications. Amongst all the above
modes of communication, advertising has the main impact on viewers mind and as a strategy, it
is the most important part of any business entity which is used to generate awareness about
product or service. The term advertising is derived from the Latin word' advertere' means to turn
the attention. The word 'advertisement' first emerge around 1665 A.D. Every part of advertising
endeavor to turns the attention of the readers or the listeners towards the product. Advertising is
the mean of informing as well as influencing the general public to buy a product or service. A
product or service is advertised to create awareness in the minds of potential buyers through
various advertising medium such as magazine, radio, television, billboards, web advertising,
newspaper, etc. Advertising usually provides information about the advertising firm, its service
qualities, its product and the place of availability (Singh, 1996).
An advertisement turns into misleading or false when untruthful or deceptive statements are used
in the ads to attract the customer towards the product or services. (M., 1975) has identified
deceptive advertising in 1975. As deceptive advertising begins when a firm or a company
support its product or services with the help of misleading, untrue of confusing statements. The
tricks e.g. using of Photoshop to change the appearance of the products are used by the advertiser
in order to deceive the customers and make their product look a lot diverse than the reality. So,
this kind of advertisement is unsafe for consumers as they are intentionally mislead by the

3 | P a g e
misrepresentation of quality, characteristics or the nature of the product or service offered by
various firms (Skool). This incorrect statement of the product leads the customers to make poor
decisions in result to which the customer end up wasting precious money on something which
won't meet their needs or resolve their problems (Taruna, September 2016).
According to (Lodhi, 2015) deceptive advertising is the utilize of misleading, false and wrong
advertising of a product which may negatively affect consumer's loyalty, deception can be
confirmed when a consumer individually consumes or experience the product or service. If
consumers are not being informed about the complete information or being revealed images that
oppose the real qualities of a product or service, they are unsure to compose the finest decisions
for themselves (Ray, 2018)
One's any company engages in misleading advertising it isn't a trustworthy company more as
both the new and existing customers may suffer deceive and switch to another company product
or services. The business may also get a terrible status as a deceptive organization, which means
declining business in the future. Moreover, in rising markets like Pakistan, it is more imperative
to determine whether the factors such as customer satisfaction, word-of-mouth, and trust also
affecting customer loyalty due to the continuous arrival of innovative players in potential
businesses. That is why businesses make superior relationships with their loyal customers, as
they buy their goods and services over again and again (Waheed Akhter A. S., 2011) and
however, this can be done when once trust is developed.
According to (Owais Hassan, 2014) the Pakistani customer is no different from the customers in
another marketplace in the world. Deceptive advertising is now also illegal in many other
countries (FTC Guides Against Deceptive Pricing, 2012). The United States of America was
the first to execute policies and rules about deceptive advertising. The United States Supreme
Court has lined that misleading or false advertising is not sheltered under the first adjustment
(Demaine, 2010). In this way, some of the agencies have been designed and created to
discourage service providers and manufacturers to use deceptive advertising in order to protect
the customers. According to the European Commission's instruction, false advertising is any
advertising which in any mean, counting in its presentation, is proficient of misleading the
person to whom it is concentrated, misrepresented their behavior and as a result, destruction the
interest of the customers (Official Journal of the European Union , 2005). As from China to
India to the United Kingdom, misleading advertising is banned. Not merely deception is banned

4 | P a g e
but it is also carefully be regulated. Most countries entail advertorials ads that are obtainable as
editorial, to be obviously marked as advertisements. The charge of breaking these laws can be
steeped both in humanitarian and financial consequences (Wakeman).
In order to enter into a particular market it is very significant to first get an insight about
the taste, customers’ needs, culture and demographics of that market, not only to propose a
product but also to build up its unique strategies. Since telecom operators present services for
all market segments, they utilize diverse promotion and marketing strategies for each of their
services. Being the element of the most competitive business each operator of telecom industry
of Pakistan aims to bring some unique and out of the box advertisement strategies in order to
satisfy their customers. As the service range of each operator is more or less similar to the thing
that can make a difference is the promotional and marketing strategies each operator uses to
make their customer base and image. They are doing advertising through television, internet,
newspaper, banners, sign boards, FM radio, and mobile vans. Among all Television, the
advertisement is the most essential source for effective branding of Telecom Industry. They
spend a lot of the money to run their TV's on numerous channels, while TV channels differ
according to the market standing and channel (TRP) rating. According to the MEDIA BANK
PAKISTAN statement of 2015, telecom industry obtained hold of 20% of shares of total
minutes of advertising and positioned 2nd in the top category list with, Mobilink, Ufone, and
Telenor being the most active telecom players. Internet and Social media also have become the
most vital medium to make a better position in the market and make the brand known in the
market. The Telecom operators of Pakistan are among the top brands on the internet. Each
operator not only has a special website but they are also pretty dynamic on all social media
platforms. Not only on Facebook but Twitter also is lead by the telecom sector (Rizwana, 2016).
1.2. PROBLEM STATEMENT
Advertisement plays a very significant role in influencing customer behavior in order to purchase
a product or services. With the passage of time customers are badly affected by different
marketing activities and deceptive advertising. Moreover, false advertising is a very responsive
issue because most customers are unable to understand and interpret advertisements. Some time's
the advertisers over exaggerate the product's benefits and advertise them in such a thoughtful
way, therefore customers should be very well aware of their purchase decision. After explaining

5 | P a g e
the deceptive advertising in detail, the research study will demonstrate how customers can
respond after getting deception in advertisements for the product or service they purchased.
Telecommunication industry is like the backbone for every country in the era of communication
and speediness industry in the current business environment. Pakistan Telecommunication
Business Limited has a very wide telecommunication network crosswise the country covering all
the main areas. Telecommunications in Pakistan explains the large environment for the growing
mobile telecommunications, internet and telephone markets in Pakistan. According to (Mittal,
2017) Pakistan's telecom sector appears as one of the fastest rising sectors across Asia and in
2008 it was the third -fastest rising sector in the world. The growth has continued unconstrained
till date and as of 2017 January, out of the population of almost 200 million 16 percent are active
on social media, 23 percent are active internet users, and 72 percent are mobile subscribers. The
telecom infrastructure in Pakistan is improving significantly with domestic and foreign
investments in mobile networks and in the fixed-line (WILSON, 2009). According to (Farooq,
2018) Pakistan telecom sector revenues through the first two-quarters FY(Financial year) 2017-
18 touched Rs. 235.5 billion, discovered the Economic Survey of the (2017-18).
Pakistan has been a country with a monopolistic market in the telecommunication sector but
from the past two decades, both international and national participant have modified its dynamics
for working business. As the bigger population volume of the country was a tantalizing factor for
telecom companies to penetrate the market (Mehnaz, 2016). With the passage of time, the
mobile-phone operators have appeared in every area of the world (Shaista Kamal N. S., 2015).
The occurrence of many operators in the marketplace gave way to competitive pricing and hard
competition. Given the strong competition, businesses resorted to deceptive ads in order to
exploit emotions, take profit from low literacy of the customers and as well as manipulate
customer psyche. The researcher also explained that the transmission of misleading information
in respect to telecommunication services and products may take any form, it may be through
television advertisements, brochures, billboards and banners, print media, advertisement on the
internet, short message services (SMS) offers. Telecom companies in Pakistan have somehow
engaged to deliver overstated statement to influence the consumers due to which customers lost
their money and get mental misery. As (Jeeva, 2016) said that misleading advertisements affect
consumer's choices concerning what they purchase. Such advertisements generate a belief about
the quality of the product and services which is not true and also create the wrong impression

6 | P a g e
about the product in the result to which customer preference will be distorted. The packages
offered such as SMS charges, connectivity charges, call rates, post, and prepaid connections are
always taking up extra charges for just subscribing, which the customers don't realize and have
not much awareness of this charged information, which ultimately irritates consumers which
trend the consumers for brand switching (Hasan, 2011).
1.3.RESEARCH GAP
(Mohammad Noorizzuddin bin Nooh, 2014) has explored the effect of unethical advertising
criteria that impact to the next creation. The study converse that misleading and inappropriate
advertising makes negative belief in the psyche of people particularly children or adults in
Malaysia. (Maicibi, 2013) have highlighted that false advertisements generate wrongly use of
customer loyalty in the organization in America. The research observes that organization should
generate a specific cost for the falsification and fraud in advertising in order to keep the
organization healthy and competitive. Further to it (Jeeva, 2016) have highlighted the impact of
misleading advertisement in Coonoor, India and explored that misleading advertisement has an
unfavorable effect on consumer interests.
Although, there are previous studies on the issue of deceptive advertising with reference to
telecommunication sector in Pakistan (Hasan, 2011), (Fayaz, 2015) and (Shaista Kamal Khan,
2015), but these studies mainly focus on defining the deceptive advertising and to some extent
imitate on its effect on the customer loyalty. As (Shaista Kamal Khan, 2015) observed that
consumer behavior is affected by, financial or emotional loss, misleading and incorrect
interpretation claim that trends to affect trust, consumer loyalty, and brand attitude. (Hasan,
2011) examined that deceptive or misleading elements are present in the ads which may affect
customer loyalty. (Fayaz, 2015) also conducted a study and observed that deceptive advertising
practices happen in mobile phone advertisement which affects customer loyalty. While none of
them directly spotted out the effect and relationship between the deceptive advertising and
customer loyalty. Moreover, these studies including studies done on Pakistan didn’t emphasize
on how deceptive advertisement interplays with trust and customers satisfaction to effect loyalty,
moreover, how words of mouth mediate this phenomenon. Therefore, explaining the effect of
deceptive advertisement on loyalty in the presence of trust and satisfaction through words of
mouth is still under research especially in the case of developing country like Pakistan. Hence,
7 | P a g e
there is an understandable research gap to study the relationship between customer loyalty and
deceptive advertising under the mediation of word of mouth. (Hasan, 2011) and (Jahanzeb,
2015) proved that deception in ads affecting customer behavior. But they mostly focus on
describing deceptive advertising and to some degree imitate on its impact on customer loyalty.
The originality of this paper is also to study the relationship between customer loyalty and
deceptive advertising under the mediation of word of mouth. The completion of this research
provides an essential benefit to the customers by informing them about the false or wrong
advertisements of a product or service which may negatively affect their loyalty.
This study also gives benefit to marketers in order to make them assure that now a day's
customers are more knowledgeable because of the technological era. So, it's very essential for
advertisers to provide truthful statements about the product or service they advertised.
1.4. RESEARCH OBJECTIVES
The scope of the research is to highlight the study on deceptive advertising that helps to
determine its effect on customer loyalty and also to know the increasing demand of
telecommunication industry in Pakistan. Most of the time, customer get disappointed from
advertising due to inappropriate execution and non-fulfillment, of particular commitment, the
study will help consumers to get aware of the false advertisements and its effect on their loyalty.
However, the study is conducted in Karachi city from people of diverse age group. Furthermore,
this study has examined how the customer reacts after deception in an advertisement. The
objectives of this research are:
To recognize the influence of deceptive ads on customer loyalty with the mediation of
word of mouth.
To recognize the influence of customer satisfaction on customer loyalty with the
mediation of word of mouth
To recognize the influence of customer trust on customer loyalty with the mediation of
word of mouth
To examine the influence of word of mouth on customer trust.
To recognize the influence of word of mouth on deceptive ads.

8 | P a g e
To identify the relationship between customer trust and customer loyalty and deceptive
advertisement.
To examine the influence of word-of-mouth on customer satisfaction.
1.5. RESEARCH QUESTIONS
This research attends to get answers to the following questions:
To what degree deceptive advertising effect on customer loyalty?
To what extent marketers make efforts to stimulate customer behavior?
How deceptive telecom ads affect customer satisfaction and trust?
How word of mouth mediates between the independent and dependent variable?
2. LITERATURE REVIEW
(Aydin, 2005) recognized the relationship between customer loyalty and brand image, service
quality, trust and switching cost, in the telecommunication industry of turkey as the results
revealed that all of these variables had a positive effect on customer loyalty. (Chen, 2011) did a
study in China as they concluded that brand image direct toward relationship quality, quality
directs toward relationship value, and customer loyalty mediates through relationship value. The
effect of company image and brand image was found insignificant. In another study, (Fornell,
2001) explained, when a company satisfies their customers, in a result the company can obtain
numerous benefits from the satisfied customer i.e. loyalty, build a positive company image,
lessen customer sensitivity and reduce the cost of generating new customers. According to
(Anwar, 2011) buyer trust and brand image have a strong influence on brand attitude, which can
be achieved through customer expectation and distinct service quality. (Alhabeeb, 2007) studied
loyalty and customer trust in the perspective of value. He declared that the value a business is
giving to a customer in the type of its product and services is vital in the assurance of trust. The
connection between the variables signifies that value and perception are positively related and
trust is positively interrelated to loyalty.
(Fayaz, 2015) have explored how deceptive ads affect customer loyalty, attitude, and behavior.
The analysis of the study found that deceptive advertising practices happen in mobile phone
advertisements which affect customer loyalty. The study also found that when the people

9 | P a g e
experiencing the mobile phone in real and fond some variation in the advertisement, because of
this experience, they start thinking that deception occurs in the ads, their faith started shaking
towards mobile phones before purchasing. In result to which people start negative word of mouth
with other customers whether they may loyal in the past. Similarly, (Hussain, 2015) found that
misleading information, stereotyping and unethical advertising is negatively associated with
customer purchasing behavior, while the word of mouth is negatively connected with customer
satisfaction. Further to it (Jeeva, 2016) have highlighted the impact of misleading advertisement
in Coonoor, India and discusses that misleading advertisement has an unfavorable effect on
consumer interests and must be coordinated by the legal provisions and institutional structure
that adjust misleading advertisement.(Maicibi, 2013) have explored that false advertisements
generate wrongly use of customer loyalty in the organization. The qualitative research approach
is the focus of the study in America. The research observes that organizations generate a cost for
the illegal's by falsification and fraud in advertising. (Mohammad Noorizzuddin bin Nooh,
2014) have explored that wrong and inappropriate advertising makes negative belief in the
psyche of people particularly adults or children. The qualitative research approach is used in the
study in Malaysia and converse that advertising negatively affects children's purchasing decision.
(Liepinyte, 2012) have examined that consumer's buying decision is ending up through
misleading practices in advertising at low quality and high prices. (John Cawley, 2013)
conducted research in the USA and found that exposure to deceptive advertising is connected
with a lesser possibility that women, and a higher possibility that men, used ( OTC) weight loss
products. The study suggests that better-educated women are better capable to differentiate fake
claims in advertising and is reliable with the allocate effectiveness of education in the creation of
health. (Shaista Kamal, 2015) has explored the relationship between deceptive marketing and
consumer behavior in Pakistan. The study shows that mainly all service provider is somehow
busy in false claims and exaggerations which is dishonesty and it appears that the advertisers,
who do not misinform to their customers, constantly enjoy market shares more than those who
exaggerate. It concludes that a higher level of experienced dishonesty was associated with the
smaller level of less favorable behaviors, less envying manners and perceived credibility towards
the brand, and reduced buying ratio towards the product. As this negative association is
against(Mehnaz, 2016) findings which show that false in advertising perceived by the
customers does not affect loyalty and trust in a negative way. The study focuses on the

10 | P a g e
qualitative approach with the sample size of 232 in Sweden. Further to it(Ali Raza, 2011) has
presented that there is a significant and positive association exist among deceptive beauty
advertising and the purchasing behavior of university students towards the beauty products, this
means that the consumption of beauty products raises with the rise in deception in the beauty
products. (Miluwi, 2011) have explored that advertisement does not essentially verify to be
more flourishing in affecting recall of fake claims in India. The result of the study discloses that
when both false and true claims are present in a similar advertisement, then true claims are
reminded more consistently than false claims. (Waheed Akhter, 2011) explored the key factors
which manipulate customer loyalty around the world and particularly in Pakistan. The results
indicate that there is a positive association between customer relation, trustworthiness, product
image, customer loyalty, and customer satisfaction. It also concludes that long-term sustainable
standing and success of a company based on customer loyalty.
(Jiana Daikh, 2015) has demonstrated that there is a significant positive relationship between
customer satisfaction and customer loyalty. The study focuses on quantitative research on the
sample size of 400 respondents. The study suggests that companies should be doing work hard as
because loyalty is a brief issue, therefore today's faithful customers could not be tomorrow's
loyal consumers.(Inamullah, 2012) did research in Pakistan that concludes that customer
satisfaction has a significant impact on customer loyalty on the other hand customer retention has
an insignificant impact on customer loyalty. The study suggests that an organization should well
manage their associations with the customers as a determined policy in the mobile telephone
market.(Muhammad Zaman Sarwar, 2012) have highlighted the effect of customer trust on
customer retention and customer loyalty. The findings of the study show that customer trust,
cause-related marketing, and customer loyalty have a positive association but there is a negative
association between customer trust and retention. The implication for the future study is that
service operators have need to visibly refine and reframe their procedures concerning religious
aspect and generating more easiness to recognized buying ways of the customers to retain them
for the long life. (Hilal Alhulail, 2018) have explored the relationship among word or mouth and
customer loyalty to social commerce websites. The study focuses on a quantitative research
approach having the sample size of 1000 respondents of social commerce websites consumers in
Australia, Factor analyses and SME model is used. The study shows that Word of mouth is the
most vital factor which influences customer loyalty.

11 | P a g e
2.1. THEORATICAL FRAMEWORK
In view of the literature discussed above, we originate the following research model for the
study.
The above model shows that deceptive advertsing as an independent variable and its sub
variables are customer satisfaction and customer Trust. Customer loyalty as a dependent variable
and word of mouth as a mediating variable.
Customer faced with a very huge numbers of advertisements every day in diverse media. This
makes the customer unable to judge the false nature of all such messages (Mustansar, 2015).
Here they mostly respond on word of mouth. According (Mustansar, 2015) in telecom sector,
people share their experiences with other people which some time happen to a strong perception
in other’s mind that may be transformed in faith towards services. Marketers, obviously
recognized the value of WOM, particularly with regard to its suggestion for trust and connected
outcomes (DeCarlo ,2007). If the customer has a positive experience with a brand or service
,they might mention it to their family member or a friend. This is because of customer's trust
each other's view on what products are worth their money and time and which ones isn't. When
the customer comes to know deception occurs in the ads, their believe started shaking towards
telecom service before buying ,this is because they experienced the services in real and get a

12 | P a g e
difference between advertisement and reality ,due to which they started bad word-of-mouth with
the people whether they are faithful in the past (Lodhi, 2015).
According to (Hussain, 2015) Misleading information has a negative but insignificant
correlation with customer satisfaction. Customer satisfaction is also measured as serious to
perform business in today’s competitive market and telecom companies are no exemption
(Ehigie, 2006) .This retention and possession of customers depend upon the customer’s
perceived value. As customers’ perceived value is the observation of customers about social
psychology, quality, compensation, money, and benefits associated with the firm or services. So,
if the customer's perceived value is positive then it will create the customer's satisfaction.
(Farrell, 2011) a further reminder that perceived unfilled and overstated commitment is
negatively related to customer satisfaction.
There are other factors that also affect customer loyalty. One of the significant factor is customer
trust. Trust is important to make a strong relationship. As relationship is constructed on trust the
most essential thing to consider about trust is that without it, one have no association. This
pertains to all human circumstances, not only just the customer service environment, for
customers to maintain long business with one and ones businesses, trust has to be earned, and it
does not occurs overnight. (Relationship Between Customer Satisfaction And Loyalty
Business Essay, 2016) .Trust is a promise of the company with their customers to fulfill their
expectation as it helps customer loyal to the brand and the company. Without the trust on
company customer can't enter in the loyalty set. To build a trust it’s essential for the customer to
asses and take the information from the product (Ahmed, 2014) . The prime issue that
demolishes customer trust is when a business breaks its assurance which will the reason
customers do not trust the company and even start search for a competitive business that will
offer better services (Eideh, 2016). It is very simple to promise brilliance but weakening to
deliver can hurt the relationship with the customers. According to (Ibanez, 2006) brand trust is
one of the considerable factors which influences brand loyalty. On the other hand (Darke, 2007)
has also proposed that deceptive advertising originates consumer's distrust. The reaction of
distrust caused by deceptive practices would create a perception of unfairness among consumers
that would lessen the chances of repurchases. An angry consumer may resort to other injurious
actions such as revealing a bad image of the company or refuse it.'

13 | P a g e
Another factor affecting loyalty is customer satisfaction .In today's marketplace satisfying
customer is a business challenge. Every of the company want to attract the customers and they
would have the high brand feeling about the product or the services. For this reason customer
satisfaction is essential factor that can move the customers towards it. From this point of view if
the consumers will satisfy with their definite brand they would make repeat purchases and
demonstrate commitment (Ahmed, 2014).Now businesses have recognize the importance to
understand, predict and meet customer needs. Customer satisfaction is explained as an overall
valuation based on the customer's total consumption and purchase experience with the product or
service over time. This overall satisfaction has a strong positive effect on customer loyalty
intentions across a wide range of product and service categories, including telecom services
(Eugene W. Anderson, 2004)
2.2 . RESEARCH HYPOTHESIS
The researcher has generated the following hypothesis for the purpose of final analysis:
H1: Deceptive ads have a positive influence on customer loyalty with the mediation of word of
mouth.
H2: Customer satisfaction is influenced customer loyalty with the mediation of word of
mouth.
H3: Customer satisfaction is influenced customer loyalty with the mediation of word of mouth.
H4: Word-of-mouth has no influence on customer loyalty.
3. METHODOLOGY
In this segment, the research study converse research design, research model, data collection
procedures, statistical techniques, sample size and operational procedures of variables employed
in the study.
3.2. RESEARCH DESIGN
The purpose of this research paper was to examine the impact of deceptive advertisement on
customer loyalty in the telecommunication industry of Karachi Pakistan. This paper adopts a
descriptive survey design. The targeted audience contains all the individual customers using

14 | P a g e
different telecommunication services in Karachi. The analysis of the study was done on the basis
of a quantitative research approach.
3.3. RESEARCH SOURCE
The main source together the data for this study is primary data which was collected through
questionnaires. Similarly, secondary data is also been used to obtain a little help through
different books and journals.
3.4 .QUESTIONNAIRE DESIGN
The questionnaire consists of two parts the first part includes personal questions about gender,
age, education, and income. These questions are intended to get background information about
the respondents which would help in descriptive statistics in the analysis part. The questions
would get responses on a five-point Likert scale. The points ranged from "1" meaning "strongly
agree" to "5" meaning "strongly disagree". The data type used in this research was quantitative
approach and all the questions in the questionnaire are closed-ended.
3.5. SAMPLE SIZE & SAMPLING TECHNIQUES
The sample size of the research paper was of 250. The questionnaire was used to collect
responses from different respondents like Students, Teachers, and officers with different age
groups. The answers were obtained both electronically and manually. On this bases, the
measures of the research are further been carried out.
3.6. STATISTICAL TECHNIQUES:
Exploratory Factor Analysis (EFA) was used to analyze the data with the help of SPSS.
Confirmatory Factor Analysis (CFA) and Structural Equation Modeling (SEM) using AMOS,
conducted to ensure the model and testing the hypothesis.
4.RESULTS
This chapter illustrates the empirical findings revealed from the data and gives information on
profiles of the respondents and descriptive statistics for items employed in the study.
4.2 . PROFILE OF RESPONDENTS
15 | P a g e
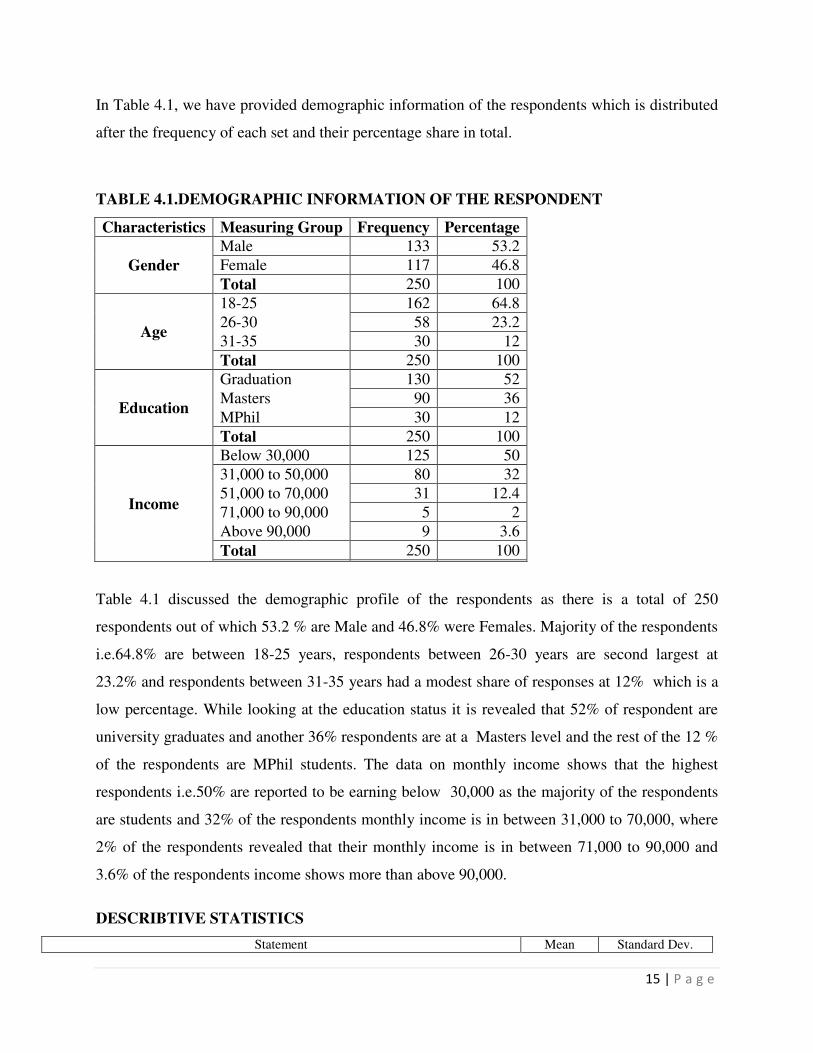
In Table 4.1, we have provided demographic information of the respondents which is distributed
after the frequency of each set and their percentage share in total.
TABLE 4.1.DEMOGRAPHIC INFORMATION OF THE RESPONDENT
Characteristics Measuring Group Frequency Percentage
Gender
Male 133 53.2
Female 117 46.8
Total 250 100
Age
18-25 162 64.8
26-30 58 23.2
31-35 30 12
Total 250 100
Education
Graduation 130 52
Masters 90 36
MPhil 30 12
Total 250 100
Income
Below 30,000 125 50
31,000 to 50,000 80 32
51,000 to 70,000 31 12.4
71,000 to 90,000 5 2
Above 90,000 9 3.6
Total 250 100
Table 4.1 discussed the demographic profile of the respondents as there is a total of 250
respondents out of which 53.2 % are Male and 46.8% were Females. Majority of the respondents
i.e.64.8% are between 18-25 years, respondents between 26-30 years are second largest at
23.2% and respondents between 31-35 years had a modest share of responses at 12% which is a
low percentage. While looking at the education status it is revealed that 52% of respondent are
university graduates and another 36% respondents are at a Masters level and the rest of the 12 %
of the respondents are MPhil students. The data on monthly income shows that the highest
respondents i.e.50% are reported to be earning below 30,000 as the majority of the respondents
are students and 32% of the respondents monthly income is in between 31,000 to 70,000, where
2% of the respondents revealed that their monthly income is in between 71,000 to 90,000 and
3.6% of the respondents income shows more than above 90,000.
DESCRIBTIVE STATISTICS
Statement Mean Standard Dev.

16 | P a g e
1 . According to you are deception in ads can be easy to identify? 2.38 1.167
2. Overpromising in ads affect customer believe 2.50 1.162
3. The Operator exaggerates the benefits and characteristics of its product and services 2.50 1.162
4. The operator uses misleading tactics to convince customers to buyer its product and services
2.98 1.002
5. When advertisements are found to be misleading, false, or unpleasant, it is necessary that customer should complain to appropriate bodies.
2.50 1.162
6.The operator ads are not entirely truthful about its product and services which may affect customer satisfaction
2.98 1.002
7. The higher the exposure of false in ads will lead to lower customer loyalty. 2.59 .978
8. Companies must fulfill their commitment with its customers to earn loyalty. 2.50 .995
9. Even my friends and family members recommend me another operator I will continue to using this one.
2.40 .986
10. Even if another operator is cheaper,I prefer using this one only. 2.22 .952
11.Trust has a positive significant influence on customer loyalty 1.82 .890
12. Even I trust on this operator after been deceipt 1.86 .890
13.The operators do care about its customers. 1.86 .875
14. This operators meets customer expectations 2.05 1.044
15. Customer satisfaction has often been regards as a major determinant of customer loyalty.
1.99 .789
16. If any product or service do not makes you satisfy you will be a loyal customer of that product or a service.
2.08 .926
17. Satisfied customer would say positive things about the product or service to other people.
2.22 .907
18. The operator ads mislead less satisfied customer 2.23 .958
19. Word-of-mouth communication is important for my buying decision. 2.12 .801
20. Companies must build good relations with its customers to earn their loyalty, and ensure their commitment
2.50 .995
21. Customer starts bad word-of-mouth with other people after experiencing the telecommunication ads due to deception occurs in it, whether they are loyal in past
2.04 .902
22. The Satisfied customer can attract new customer through word-of -mouth. 1.96 .803
23. The opinion of consumers, who have used the same service before, is important for me.
2.12 .849
24.Word of mouth has an influence on customer loyalty 2.16 .912
The above table illustrates the Descriptive statistic analysis which was used in order to know the
impact of deceptive advertising on customer loyalty. The descriptive statistic is used to organize,
summarize and simplify the data. They are techniques that take raw scores and summarize or
organize them in a form that is more manageable. Descriptive analysis enables us to present the
data in a more meaningful way and will permit a simpler interpretation of the data. The table
shows the mean and standard deviation of the variables that are deceptive ads, customer loyalty,
customer satisfaction, trust, and word-of-mouth. Mean is the most commonly used measure of
the center of the data and it also referred to as the arithmetic average. The standard deviation
shows the variation in data. If the data is close together, the standard deviation will be small. If
the data is spread out, the standard deviation will be large. The table shows the highest and

17 | P a g e
lowest mean and standard deviation that is 2.98 at the highest mean value with 1.002 standard
deviations and 1.82 at the lowest mean value with 0.890 standard deviations. The results show
that the standard deviation is smaller than the mean, as the mean might be representing the data
very well. Because whether standard deviation could be equal to one, it could be in the million,
or to be large and still, is considered small.
4.3 .FACTOR ANALYSIS
In this section, I will conduct a factor analysis, which is a method for identifying groups of
variables. Factor analysis helps to reduce a data set to be a more suitable size. In addition, factor
analysis makes it achievable to execute a cluster analysis.
Table 4. 2 :KMO AND BARTLETT'S TEST
Kaiser-Meyer-Olkin Measure of Sampling Adequacy.
.727
Bartlett's Test of Sphericity
Approx. Chi-Square 1127.217
Df 210
Sig. .000
The KMO and Bartlett's Test measures the strength of the relationship between the variables.
From the above table, we can say that the value of KMO test is .727. It means our sample size is
sufficient for running factor analysis. From the same table we can also see that Bartlett's Test of
Sphericity, the significance value is 0.000 which is less than 0.05. That means it is significant. So
it is confident to say that Factor analysis is suitable for this data.
Table 4.3. TOTAL VARIANCE EXPLAINED:
Component
Initial Eigenvalues
Extraction Sums of
Squared Loadings
Rotation Sums of
Squared Loadings
Total
% of Varian
ce Cumulative % Total
% of Varian
ce Cumulative % Total
% of Varian
ce Cumulative %
1 3.480 16.570 16.570 3.480 16.570 16.570 2.766 13.169 13.169
2 2.809 13.378 29.948 2.809 13.378 29.948 2.347 11.174 24.343
3 1.644 7.831 37.779 1.644 7.831 37.779 2.019 9.616 33.960
4 1.475 7.024 44.803 1.475 7.024 44.803 1.729 8.234 42.193
5 1.152 5.487 50.290 1.152 5.487 50.290 1.700 8.097 50.290
Extraction Method: Principal Component Analysis.

18 | P a g e
Table 4.4 :ROTATED COMPONENT MATRIX
Component
1 2 3 4 5
LOY1 .728
LOY2 .697
LOY3 .422
LOY4 .626
WOM1 .611
WOM2 .652
WOM3 .411
WOM4 .433
WOM5 .472
TR1 .667
TR2 .662
TR3 .654
TR4 .599
CS1 .708
CS2 .656
CS3 .624
CS4 .599
DADS1 .880
DADS2 .839
DADS3 .788
DADS4 .717
Extraction Method: Principal Component Analysis. Rotation Method: Varimax with Kaiser Normalization. a. Rotation converged in 7 iterations.
Table 4.3, indicates the total variance explained at 4 stages .4 factors were extracted out of 21
factors because of their eigenvalues greater than 1. When 4 factors were extracted, then 50.290
percent of the variance would be explained which is applicable
Table 4.4, shows the rotated factor matrix. (Fidell, 2001) confirmed that variable with factor
loadings more than 0.45 were selected in this study because loadings equal to 0.45 is measured
average, whereas loadings 0.32 is measured less good. After carrying out the Varimax Rotation
Method, Factor 1 comprised of 4 items with factor loadings ranging from 0.422 to 0.728. The
items in Factor 1 are LOY1, LOY2, LOY3, and LOY4. Factor 2 comprised of 5 items with factor
loadings ranging from 0.411 to 0.652. The items in Factor 2 are WOM 1, WOM 2, WOM 3,
WOM 4 and WOM 5. Factor 3 comprised of 4 items with factor loadings ranging from 0.599 to
0.667 and the items in Factor are TR1, TR2, and TR3 and TR4.

19 | P a g e
The items in Factor 4 are comprised of 4 items with factor loadings ranging from O.599 to 0.708.
The items in Factor 4 are CS1, CS2, CS3, and CS4. Factor 5 comprised of 4 items with factor
loadings ranging from 0.717 to 0.880 and the items in Factor 5 are DADS1, DADS2, DADS3,
and DADS4.
4.4.CONSTRUCT DEVELOPMENT:
A total of 21 items were selected for the following constructs, 4 items for Deceptive ads, 4 for
Customer Satisfaction, 4 Trust, 6, 5 for word of mouth and 4 Customer Loyalty. The items were
identified from conducting exploratory factor analysis (EFA) using principal component method
of extraction and Varimax with Kaiser Normalization. Factor loading were between 0.422 to
0.880 which indicated high correlations between the items and the corresponding constructs. The
following dimensions of positioning have been shortlisted.
Factor 1 Customer Loyalty (CL)
Factor 2 Word-of –Mouth (WoM)
Factor 3 Trust (TR)
Factor 4 Customer Satisfaction (CS)
Factor 5 Deceptive Ads (DADs)
4.5.CONFIRMATORY FACTOR ANALYSIS (CFA) :
After identifying the constructs and their respective explaining variables, confirmatory factor
analysis has been carried out to find the strength of variables in explaining the related construct
Confirmatory factor analysis (CFA) is a quantitative data analysis method that belongs to the
family of (SEM) structural equation modeling techniques. Confirmatory factor analysis is also
known as Covariance structure (McDonald, 1978). Confirmatory factor analysis is a theory -
testing procedure, where the researcher spells out the number of factors and the pattern of the
indicator-factor loadings in advance. Thus the researcher forces the variables to load only on
certain factors and observe the fit of that particular model. In CFA, the researchers can indicate
that which measured variable is related to which latent variable. It is the tool that is used to
authenticate or reject the measurement theory.

20 | P a g e
Figure 4.1 : Confirmatory Factor Analysis (CFA) Model with Standardized Estimates
The indices connected to the output factor structure are summarized in tables 4.6, where the
values of the acceptance criteria are also represented.
Figure 4.1 provides a complete specification of the Confirmatory factor analysis (CFA) model. It
is general to display confirmatory factor models as path diagrams in which squares symbolize
observed variables and circles signify the latent concepts. Furthermore, single-headed arrows are
used to entail a direction of assumed causal influence, and double-headed arrows are used to
signify covariance among two latent variables (Albright, 2006-2008). As there are five latent
constructs which are DADS, CS, TR, WOW and LOY. The DADS1-DADS4, CS1-CS4, TR1-
TR4, WOW1-WOM4, and LOY1-LOY4, represents the measured indicator variables. The e1-
e21 represents the errors associated with each measured item. The curved arrow among the
constructs signifies a correlation relationship between them after performing CFA, constructs
demonstrated good reliability with most factor loading scores. For confirmatory factor analysis,

21 | P a g e
the error of each item is drawn as unobserved variables in round circles and labeled e1 to e4 for
(DADS) deceptive ads, e5 to e8 for (CS) customer satisfaction, e9-e12 for (TR) trust, e13 to e17
for (WOM) word-of-mouth and e18-e21 for (LOY) loyalty. During the factor analysis, the
factors weight which is lower .25 is excluded but in my analysis all the variables are acceptable.
The curved arrow among the latent constructs such as DADS, CS, TR, WOW and LOY signifies
a correlation relationship between the entire construct.
4.6. MODEL FIT ANALYSIS SUMMARY
In Model Fit Analysis, the proposed research model will be modified and tested by
considering the goodness of fit of the model to the data.
TABLE 4.6: AMOS OUTPUT SHOWING MODEL FIT
Model NPAR X² DF P X²/DF
Default model 52 246.647 179 .001 1.378
Saturated model 231 .000 0
Independence model 21 1163.830 210 .000 5.542
The above table indicates the Value of X²(chi-square) ) is 246.647 and is small compared to the
value of the Independence model 1163.830. Hence the value is good. As it is also shown in the
table that X²/DF is 1.378(X²=246; DF=179) which is less than 5.0, suggesting acceptable model
fit.
Table. 4.7: REGRESSION WEIGHTS: (Group number 1 - Default model)
Estimate S.E. C.R. P Label
DADS4 <--- DADS 1.000
DADS3 <--- DADS 1.121 .145 7.724 ***
DADS2 <--- DADS 1.442 .159 9.043 ***
DADS1 <--- DADS 1.575 .173 9.115 ***
CS4 <--- CS 1.000
CS3 <--- CS .980 .177 5.522 ***
CS2 <--- CS 1.041 .185 5.639 ***
CS1 <--- CS 1.026 .171 5.990 ***
TR4 <--- TR 1.000
TR3 <--- TR 1.315 .253 5.205 ***
TR2 <--- TR 1.037 .215 4.816 ***
TR1 <--- TR .940 .197 4.760 ***
WOM5 <--- WOW 1.000
WOM4 <--- WOW .940 .183 5.147 ***
WOM3 <--- WOW .974 .180 5.398 ***

22 | P a g e
Estimate S.E. C.R. P Label
WOM2 <--- WOW .846 .182 4.653 ***
WOM1 <--- WOW .447 .143 3.123 .002
LOY4 <--- LOY 1.000
LOY3 <--- LOY .426 .181 2.348 .019
LOY2 <--- LOY 1.142 .249 4.595 ***
LOY1 <--- LOY 1.353 .295 4.583 ***
Table 4.7, presents Regression Weight Estimates and it includes estimates, standard error, critical
ratio, and P- value. These estimates will tell us whether the construct and their measuring
variables have an interrelationship and significant value or not .. AS the interrelationship
between DADS and DADS1 is positive and significant (standardized estimates = 1.575, CR=
9.115and P = . ***). AS the interrelationship between CS and CS1 is positive and significant
(standardized estimates = 1.026, CR= 5.990 and P = . ***). AS the interrelationship between TR
and TR1 is positive and significant (standardized estimates = .940, CR= 4.760 and P = . ***).
AS the interrelationship between WOW and WOM1 is positive and significant (standardized
estimates = . .447, CR= 3.123 and P = . 002). AS the interrelationship between LOY and LOY1
is positive and significant (standardized estimates = . . 1.353, CR= 4.583 and P = ***). The
results indicate a very strong and significant interrelationship between the construct and their
measuring variables.
Table 4.8.CORRELATIONS: (Group number 1 - Default model)
Estimate
CS <--> TR .432
TR <--> WOW .698
LOY <--> WOW .191
CS <--> WOW .648
LOY <--> CS .350
LOY <--> DADS -.112
LOY <--> TR .300
DADS <--> CS .066
DADS <--> TR .064
DADS <--> WOW -.003
Table 4.8, presents the simple correlation estimates between the variables DADS, CS TR, WOW
and. There is a positive correlation between the variables such as CS and TR (Estimate=.432)
,TR and WOM (Estimate=.698),LOY and WOW (Estimate=.191),CS and WOW

23 | P a g e
(Estimate=.648), LOY and CS(Estimate=.350),LOY and TR (Estimate=.300),DADS and
CS(Estimate=.066) ,DADS and TR(Estimate=.064) but on the other hand there is a negative
correlation between LOY and DADS(Estimate=-.112) ,DADS and WOW(Estimate=-.003) .
4.7. STRUCTURE EQUATION MODELING (SEM) ANALYSIS
It is the combination of factor analysis and multiple regression analysis, it is used to evaluate the
structural relationship between latent and measured variables. SEM is also used to show the
causal relationship among variables. The relationships are shown in the SEM characterize the
hypothesis of the researchers. Structural equation modeling (SEM) refers to a family of statistical
methods such as confirmatory factor analysis, structural regression models, path analysis that
investigate the relationship between a set of variables. SEM presents several advantages as it
allows the researchers to approximate the effects of hypothetical or theoretical constructs, which
is commonly called latent variables (Raykov, 2000). In SEM, a number of measured variables
can be utilized to estimate the effects of a latent variable. As the analysis of latent variables are
both conceptually and statistically appealing and it allows the researcher to recognize a priori
models and to evaluate the degree to which the data fits in the specified model. Possibly the most
considerable advantage of SEM is that it permits researchers to model the t, indirect, direct, and
total effects of a system of variables. Consequently, SEM permits researchers to test for and
model mediation within the models. A mediator variable is a “middle man,” an intervening
variable that clarifies the relationship between a dependent variable and a predictor variable
(Baron, 1986). An indirect effect refers to the relationship between two variables that is mediated
by one or more intervening variables (Raykov, 2000). Structural Equation Model permits the
researcher to test a covariance matrix of variables for fit with an earlier hypothesized model. If it
fits, it lends confirmation to that model, if it is not fit fine, there may be main missing factors or a
diverse model is needed.The SEM model is present in Figure 6.3 with unstandardized estimates
and Figure 6.4 with standardized estimates.
4.6. STRUCTURE EQUATION MODELING (SEM) MODEL

24 | P a g e
Figure 4.2 : Structure Equation Model with Unstandardized Estimates
Figure 4.3 : Structure Equation Model with Standardized Estimates
4.7. MODEL FIT ANALYSIS SUMMARY
In Model Fit Analysis, the proposed research model will be modified and tested by
considering the goodness of fit of the model to the data.
Table 4.8.AMOS OUTPUT SHOWING MODEL FIT
Model NPAR X² DF P X²/DF
Default model 49 255.338 182 .000 1.403
Saturated model 231 .000 0
Independence model 21 1163.830 210 .000 5.542

25 | P a g e
The above table indicates the Value of X²(chi-square) ) is 255.338 and is small compared to the
value of the Independence model 1163.830. Hence the value is good. As it is also shown in the
table that X²/DF is 1.403 (X²=255; DF=182) at P=0.00 which is less than 5.0, suggesting
acceptable model fit.
Table. 4.9. FIT INDICES OF THE STRUCTURAL EQUATION MODEL
Fit Statistics Values
GFI(Goodness of fit index) .919
AGFI(Adjusted Goodness of Fit Index) .896
NFI(Normed Fit Index) .788
RFI(Relative Fit Index) .751
CFI(Comparative Fit Index) .929
IFI(Incremental Fit Index) .931
TLI(Tucker Lewis Index) .917
RMSEA(Root mean Square Error of Approximation) .039
RMR(Root Mean Square Residual) .055
Table 4.9 presents the fit indices of the structural Equation model. The Goodness of Fit Index
(GFI) obtained is 0.919, Adjusted Goodness of Fit Index (AGFI) is 0.896, Normed Fit Index
(NFI), Relative Fit index (RFI), Comparative Fit Index (CFI), Tucker-Lewis Index (TLI),and
Incremental Fit Index (IFI) are 0.788, 0.751, 0.929, 0.931 and, 0.917.As the RMSEA is 0.039
which is below then the recommended limit of 0.05, and Root Mean Square Residual (RMR) is
0.055. The Structure Equation Model showed an acceptable overall model fit. Hence it is
concluded that the proposed research model fits the data reasonably.
4.10. STANDARDIZED REGRESSION WEIGHTS: (Group number 1 - Default model)
Estimate
WOM <--- DADS -.081
WOM <--- CS .456
WOM <--- TR .531
LOY <--- WOM .315
Table 4. 10, presents the standardized regression estimates which are used to allow the researcher
to evaluate directly the relative cause of each independent variable on the dependent variable
(Anderson 2006).T he results shows that all the variables WOM and CS, WOM and TR, LOY
and WOM represents a positive standardized estimates ( .456, .531, .315 ) .On the other hand,
WOM and DADS show negative standardized estimates ( -.081).

26 | P a g e
Table 4.11: CORRELATIONS: (Group number 1 - Default model)
Estimate
DADS <--> CS .063
TR <--> CS .434
TR <--> DADS .062
Table 4.11, presents the simple correlation estimates between the variables DADS, CS and TR.
As there is a correlation between DADS and CS is 0.63. Moreover, the correlation between TR
and CS is 0.434 as well as the correlation between TR and DADS is 0.062.
Table 4.12: REGRESSION WEIGHTS: (Group number 1 - Default model)
Estimate S.E. C.R. P Label
WOM <--- DADS -.025 .024 -1.010 .313
WOM <--- CS .188 .073 2.586 .010
WOM <--- TR .238 .091 2.626 .009
LOY <--- WOM 1.048 .444 2.357 .018
DADS4 <--- DADS 1.000
DADS3 <--- DADS 1.114 .144 7.718 ***
DADS2 <--- DADS 1.437 .159 9.060 ***
DADS1 <--- DADS 1.578 .173 9.136 ***
CS4 <--- CS 1.000
CS3 <--- CS 1.002 .184 5.436 ***
CS2 <--- CS 1.088 .194 5.607 ***
CS1 <--- CS 1.039 .177 5.858 ***
TR4 <--- TR 1.000
TR3 <--- TR 1.312 .254 5.159 ***
TR2 <--- TR 1.051 .219 4.804 ***
TR1 <--- TR .951 .200 4.744 ***
WOM1 <--- WOM 1.000
WOM2 <--- WOM 1.894 .631 3.000 .003
WOM3 <--- WOM 2.100 .665 3.157 .002
WOM4 <--- WOM 2.111 .675 3.125 .002
WOM5 <--- WOM 2.238 .718 3.117 .002
LOY1 <--- LOY 1.000
LOY2 <--- LOY .779 .179 4.355 ***
LOY3 <--- LOY .285 .124 2.293 .022
LOY4 <--- LOY .645 .153 4.227 ***
DISCUSSION OF THE RESULT

27 | P a g e
According to the projected research model, there are four hypotheses representing the proposed
relationships between the research variables. Structural equation modeling (SEM) using AMOS
is employed to test the hypothesis. Table 4.12, presents Regression Weight Estimates and it
includes estimates, standard error, critical ratio, and P- value. These estimates will tell us
whether the null hypothesis is rejected or supported. Furthermore for the hypothesis testing the
interpretation of the tables 4.9. is illustrated below:
H0: Deceptive ads have a negative influence on customer loyalty with the mediation of word of
mouth.
H2: Deceptive ads have a positive influence on customer loyalty with the mediation of word of
mouth.
In the First Hypothesis, deceptive ads have a positive influence on customer loyalty with the
mediation of word of mouth. Consequently, the observed output shows that the path between the
variables DADS and WOW is negative and insignificant (standardized estimates = -.025, and P
= .313). This negative standardized estimates and insignificant P value indicates that there is no
evidence to support the positive influence between the DADS & WOW on LOY. On the other
hand, this negative and insignificant values support the null hypothesis and indicates
that deceptive ads have a negative influence on customer loyalty with the mediation of word of
mouth. Hence hypothesis 1 is rejected. As this negative association is against (Mehnaz, 2016)
findings that perceived deception has a significant positive effect on customer loyalty. Futher to
it this negative association is related to the findings of (Hussain, 2015) that service providers
who are occupied in minor levels of deception enjoy higher market share. Customers are more
loyal to the telecommunication companies that are not concerned with higher levels of deceptive
ads. Added to it (Fayaz, 2015) signifies that deceptive advertisement as a barrier to customer
loyalty and indicates that deceptive advertisement affects customer loyalty, though they didn't
state the strength of the effect and feasible relationship between the variables.
H0: Customer satisfaction is not influenced customer loyalty with the mediation of word of
mouth.
H2: Customer satisfaction is influenced customer loyalty with the mediation of word of mouth.
In the second Hypothesis, customer satisfaction is influenced customer loyalty with the
mediation of word of mouth. Accordingly, the observed output shows that the path between the

28 | P a g e
variables CS and WOW is positive and strongly significant (standardized estimates
= .188 C.R. = 2.586 and P = .010 ). This positive and strongly significant value gives evidence
to reject the null hypothesis and indicates that customer satisfaction is causing word of mouth
does it means that customer satisfaction is influenced customer loyalty with the mediation of
word of mouth, thus this strong association helps to accept the Hypothesis 2. This positive
association is related to previous studies (Ali Kazemi, 2013) indicates that customer satisfaction
influence word of mouth positively. Further to it,((Bahareh Aliabadi, 2013), (Inamullah, 2012) ,
(Ahmed, 2014) and (Waheed Akhter, 2011)) findings that there is a positive and significant
relationship between customer satisfaction and customer loyalty. As a result, it can be said that
customer satisfaction is influence customer loyalty in customer's point of views the more the
satisfaction, the better the loyalty
H0: Customer trust is not influenced customer loyalty with the mediation of word of mouth.
H3: Customer satisfaction is influenced customer loyalty with the mediation of word of mouth.
In the third Hypothesis, customer trust is influenced customer loyalty with the mediation of word
of mouth. Consequently, the observed output shows the path between the variables TR and
WOW is positive and strongly significant (standardized estimates = .238, C.R. = 2.626 and P =
.009). Moreover, this positive standardized estimates, the high critical ratio(CR) and strongly
significant P value gives evidence to reject the null hypothesis and indicates that customer trust
is causing word of mouth, does it means that customer trust is influenced customer loyalty with
the mediation of word of mouth. Hence the association is strongly significant and with respect to
it, Hypothesis 3 is accepted. This positive and significant association is related to the earlier
studies (Mehnaz, 2016), (Bahareh Aliabadi, 2013) and (Ahmed, 2014)) findings that there is a
positive and strong relationship between customer trust and customer loyalty. As a result, it can
be said that trust influence loyalty, in customer point of views; the more the trust, the better the
loyalty. It means that customer loyalty increases with an increase in customer trust.
H0: Word-of-mouth has an influence on customer loyalty.
H4: Word-of-mouth has no influence on customer loyalty
`
In the fourth Hypothesis word of mouth has an influence on customer loyalty. Accordingly, the
output shows the path between the variables, WOW and LOY which is positive and strongly
significant (standardized estimates = . 1.048, C.R. = 2.357 and P = .018). Moreover, this

29 | P a g e
strongly positive standardized estimates, the high critical ratio(CR) and strongly significant P
value gives evidence to reject the null hypothesis and indicates that word of mouth is causing
loyalty, does it means that word of mouth has a strong influence on customer loyalty. Hence
this strong connection helps to accept Hypothesis 4. This positive and significant association is
related to previous studies (Ali Kazemi, 2013) findings that customer loyalty is significantly
influenced by word of mouth.
The findings indicates that deceptive ads have a negative influence on customer loyalty with the
mediation of word of mouth. Because the mediation entails that deception or false perceived by
customer influences word of mouth before it affects customer loyalty. Word of mouth has a
significant influence on customer loyalty .The findings also entails that customer satisfaction
and customer trust has a positive and significant influence on customer loyalty through word of
mouth.
CONCLUSION
This study was conducted to spell out the impact of deceptive advertising on customer loyalty.
The knowledge gap recognized by us in research gap section evidences that there are very few
studies (Hasan, 2011) (Jahanzeb, 2015) and (Fayaz, 2015) were conducted in the area of
deceptive advertising and its impact on customer loyalty under the mediation of word of mouth
while none of them point out the effect and relationship between the variables. Deceptive
advertising is the use of misleading, false and wrong advertising of a product which may
unhelpfully affect customer's moral. Respectively deception or misleading can be confirmed
when the customer personally consumes or experience the product or service.
Exploratory Factor Analysis (EFA) on SPSS, Structural Equation Modeling (SEM) and
Confirmatory factor analysis (CFA) using AMOS also attended to testing the hypothesis and
under the lights of fit guides that the projected model has a good fit.
First of all, our findings revealed that deceptive ads have a negative influence on customer
loyalty with the mediation of word of mouth. As this negative association is against (Mehnaz,
2016) findings that perceived deception has a significant positive effect on customer loyalty.
Further to it, this negative association is related to the findings of (Hussain, 2015) that service
providers who are occupied in minor levels of deception enjoy higher market share.
30 | P a g e
Secondly, the results also demonstrated that customer satisfaction has a positive and significant
influence on customer loyalty with the mediation of word of mouth. This positive association is
related to previous studies (Ali Kazemi, 2013) indicates that customer satisfaction influence
word of mouth positively. Further to it,((Bahareh Aliabadi, 2013), (Inamullah, 2012), (Ahmed,
2014) and (Waheed Akhter, 2011)) findings that there is a positive and significant relationship
between customer satisfaction and customer loyalty. As a result, it can be said that customer
satisfaction is influence customer loyalty in customer's point of views the more the satisfaction,
the better the loyalty. Customer trust is influenced customer loyalty with the mediation of word
of mouth. This positive and significant association is related to the earlier studies (Mehnaz,
2016), (Bahareh Aliabadi, 2013) and (Ahmed, 2014)) findings that there is a positive and strong
relationship between customer trust and customer loyalty. As a result, it can be said that trust
influence loyalty, in customer point of views; the more the trust, the better the loyalty. It means
that customer loyalty increases with an increase in customer trust.
Word of mouth has a strong significant influence on customer loyalty. This positive and
significant association is related to previous studies (Ali Kazemi, 2013) findings that customer
loyalty is significantly influenced by word of mouth. It means that when a customer have a
positive experience with a product or service they start positive word of mouth with their
friends and family .Similarly When the customer comes to know deception occurs in the ads,
their believe started shaking towards telecom service before buying ,this is because they
experienced the services in real and get a difference between advertisement and reality ,due to
which they started bad word-of-mouth with the people whether they are faithful in the past
(Lodhi, 2015). The results oncluded deceptive ads have a negative influence on customer loyalty
with the mediation of word of mouth. Because the mediation entails that deception or false
perceived by customer influences word of mouth before it affects customer loyalty. Word of
mouth has a significant influence on customer loyalty. The findings also entail that customer
satisfaction and customer trust has a positive and significant influence on customer loyalty
through word of mouth.
IMPLICATIONS OF THE RESULTS
This study aims to find out the impact of deceptive advertising on customer loyalty and also
checked the mediation of word of mouth between deceptive ads, customer satisfaction, customer

31 | P a g e
trust and customer loyalty in telecommunication industry of Pakistan. On the bases of the above
findings, this study also has some particle implications. As it is recognized that in order to
increase customer loyalty and build a strong relationship with the customer, the
telecommunication companies avoid lifting exaggerations and false claims in their ads. Because
telling a lie to a customer is wrong and unethical as it will be revealed earlier or later.
Based on the study telecom managers are advised to satisfy and better manage their relationships
by providing accurate information and quality services to the customers. Further to it, Customer
should be alert to obtain all the information regarding the product or service that what service is
represented in what price and how many benefits it carries this will makes the customer less
lying.
LIMITATIONS AND FUTURE RESEARCH:
This study is carried out in the Telecommunication industry only, the future researchers can look
into diverse sectors. Moreover, this research can be done further perfectly with more sample size
because of the scarcity of time and loads of burden this study was limited to Karachi city.
The people who are willing to choose this topic for further research should conduct a survey of
other cities of Pakistan such as Islamabad, Lahore or with the different time frame. This study
worked on two variables of customer trust and customer satisfaction. There is a need for further
research to explore the other variables i.e., company image, service quality that could further
explain the relationship between deceptive advertising and customer loyalty. The significance of
customer loyalty and the persistent nature of deceptive ads in our daily life make this topic
attractive and important.
32 | P a g e
BIBLIOGRAPHY
Bahareh Aliabadi, B. a. (2013). Design and explain the factors affecting customer loyalty in
online banking. International Research Journal of Applied and Basic Sciences , 2782-2791.
Fayaz, N. (2015). Deceptive Advertising Practices and Customer Loyalty A Case of Mobile
Phones in Karachi, Pakistan. European Journal of Business and Management , 83-88.
Hussain, N. U. (2015). Impact of Unethical Advertising, Misleading Information or Deceptive
Advertising on Customer Purchasing Intention withMediating Effect of Word of Mouth: Case of
Pakisan. International Journal of Innovation and Economic Development , 49-69.
Jeeva, C. ( 2016). Impact of Misleading Advertisements: Issues and Remedies. Bonfring
International Journal of Industrial Engineering and Management Science, , 155-157.
John Cawley, R. A. (2013). The Effect of Deceptive Advertising on Consumption of the
Advertised Good and its Substitutes: The Case of Over-the-Counter Weight Loss Products.
Institute of Labor Economics , 1-46.
Taruna, A. S. (September 2016). A study on impact of misleading advertisement on customer
preference for soft drinks. International Journal of Multidisciplinary Research and Development
, 356-360.
Waheed Akhter, A. S. (2011). Factors affecting customer loyalty in Pakistan. African Journal of
Business Management , 1167-1174.
Ahmed, Z. (2014). Effect of brand trust and customer satisfaction on brand loyalty in
Bahawalpur. Journal of Sociological Research , 306-326.
Ali Raza, F. A. (2011). ATTRACTION OF STUDENTS TOWARDS BEAUTY PRODUCTS.
Australian Journal of Business and Management Research , 104-108.
Cho, J.-Y. (2016). The Regulations of Deceptive Labeling and Advertising in
S.Korea:Controversial Issues and Alternatives. International Journal of u- and e- Service,
Science and Technology , 91-102.

33 | P a g e
Inamullah, k. (2012). Impact of Customers Satisfaction And Customers Retention on Customer
Loyalty. International Journal of Scientific & Technology Research , 106-110.
Liepinyte, R. D. (2012). Interrelation Of Misleading Advertising And Solutions Of
Consumers:Legal Regulation And Institutional Background In Lithuania. European Integration
StudieS. , 192-201.
Miluwi, J. O. (2011). Consumerismand Deceptive Advertisement Claim :An Experimental
Investigation. International Journal of Information Technology and Knowledge Management ,
181-185.
Rajput, 1. I. (2014). Impact of Deceptive Advertising on Customer Behavior and
Attitude:Literature Viewpoint. Middle-East Journal of Scientific Research , 244-248.
Yimin Chen, N. J. (2015). Misleading Online Content: Recognizing Clickbait as “False News”.
ResearchGate , 1-6.
Alhabeeb, M. J. (2007). On consumer trust and product loyalty. International Journal of
Consumer studies , 609–612.
Anwar, A. G. (2011). Impact of brand image, trust and affect on consumer brand extension
attitude: the mediating role of brand loyalty. International Journal of Economics and
Management Sciences , 73–79.
Eideh, C. (2016). The importance of trust to the customer experience. Digital CX Conversations
by Eptica .
Eugene W. Anderson, C. F. (2004). Customer Satisfaction and Shareholder Value. Journal of
Marketing , 172-185.
Farooq, M. (2018). Economic Survey 2017-18 Telecom sector revenues . Pakistan today profit .
Fornell, C. (2001). A National Customer Satisfaction Barometer: The Swedish Experience.
Journal of Marketing , 6-21.
Lodhi, N. F. (2015). Deceptive Advertising Practices and Customer Loyalty A Case of Mobile
Phones in Karachi, Pakistan. International Journal of Scientific and Research Publications , 469-
474.
Ray, L. (2018). What Is the Worst Thing About Deceptive Advertising? azcentral .

34 | P a g e
Sweeney, J. &. (2008). The effects of brand credibility on customer loyalty. Journal of Retailing
and Consumer Services , 179-193.
Waheed Akhter, A. S. (2011). Factors affecting customer loyalty in Pakistan . African Journal of
Business Management , 1167-1174.
WILSON, J. (2009). TELECOM REGULATORY &POLICY ENVIRONMENT INPAKISTAN:
RESULTS OF THE 2008 TRE SURVEY. LIRNEasia. , 1-35.
Aydin, S. a. (2005). "The analysis of antecedents of customer loyalty in the Turkish
mobiletelecommunication market". European Journal of Marketing , 910-92.
Chen, C.-F. &. (2011). Brand equity, relationship quality, relationship value, and customer
loyalty: Evidence from the telecommunications services. Total Quality Management & Business
, 957–974.
Hasan, S. A. (2011). Effects of Deceptive Advertising on Consumer Loyalty in
Telecommunication Industry of Pakistan. Information Management and Business Review , 261–
264.
Jahanzeb, S. F. (2015). An empirical analysis of customer loyalty in Pakistan’s
telecommunication industry. Journal of Database Marketing & Customer Strategy Management ,
5-15.
Mustansar, N. U. (2015). Impact of Unethical Advertising, Misleading Information or Deceptive
Advertising on Customer Purchasing Intention with Mediating Effect of Word of Mouth: Case of
Pakistan. International Journal of Innovation and Economic Development , 49 – 69.
Ali Kazemi, 1. M. (2013). Impact of Brand Identity on Customer Loyalty and Word of Mouth
Communications, Considering Mediating Roleof Customer Satisfaction and Brand Commitment
a case Study: Customers of Mellat Bank in Kermanshah). International Journal of Academic
Research in Economics and Management Sciences , 2226-3624.
Mehnaz, M. S. (2016). The Influence of Deceptive Advertisingon Customer Trust and Loyalty:A
Study of Telecom Sector in Pakistan. Umeå School of Business and Economics , 1-5
Darke, P. R. (2007). The Defensive Consumer: Advertising Deception, Defensive Processing,
and Distrust. Journal of Marketing Research, 44, , 114-127.
35 | P a g e
Ehigie. (2006).
Farrell, C. J. (2011). Effects of retail employees’behaviours on customers’service evaluation.
International Journal of Retail & Distribution Management , 203-217.
Ibanez, V. A. (2006). Antecedents of customer loyalty in residential energy markets: service
quality, satisfaction, trust and switching costs. The service industries journal , 633-650.
Relationship Between Customer Satisfaction And Loyalty Business Essay. (2016). ukessays
trusted by student since 2003 , 8.
Fill, C. (1999). Marketing communications: contexts, contents and strategies. London: Prentice-
Hall , (2. ed.).
Kotler, P. &. (2010). Principles of marketing. global edition , (13. ed.).
Definition of 'Personal Selling'. (n.d.). Economic Times .
PAHWA, A. (2018,). What Is Public Relations? PR Functions, Types, & Examples.
Feedough.com .
Outreach, N. (n.d.). Direct Marketing – Everything You Need To Know.
Skool, M. (n.d.). Deceptive Advertising. Marketing and Strategy Terms .
Owais Hassan, S. (2014). The Pakistani Consumer: Dumb or Dumber? International conference
on marketing , 1-21.
FTC Guides Against Deceptive Pricing. (2012). Federal Trade Government, .
Demaine. (2010). False or misleading advertising.
Official Journal of the European Union . (2005). DIRECTIVE 2005/29/EC OF THE
EUROPEAN PARLIAMENT AND OF THE COUNCIL .
Wakeman, O. (n.d.). What Is Considered Illegal Marketing in Other Countries?
smallbusiness.chron.com .
Rizwana, K. (2016). Pakistani Telcos: Who is the King of the Marketing Ring? Phone world .
Mittal, T. (2017). The Pakistan telecom story: will the promise of growth hold? Your story .
Mohammad Noorizzuddin bin Nooh, K. F. (2014). The criteria and challenges of unethical
advertising. American Journal of Business,Economics and Management , 88-93.

36 | P a g e
Maicibi, N. A. (2013). Criminal and Unethical Behavioursin Organisations: Misuse of Assets
and False or Misleading Advertising. Global Journal of HUMAN SOCIAL SCIENCE Political
Science , 1-9.
Jiana Daikh, J. a. (2015). The Relationship between Customer Satisfaction and Consumer
Loyalty. The Alan Shawn Feinstein Graduate School , 1-15.
Muhammad Zaman Sarwar, K. S. (2012). The Effect of Customer Trust on Customer Loyalty
and Customer Retention: A Moderating Role of Cause Related Marketing. Global Journal of
Management and Business Research , 27-39.
Raykov, T. &. (2000). A first course in structural equation modeling. Mahwah, NJ: Erlbaum .
Hilal Alhulail, M. D. (2018). The Influence of Word-of-Mouth on Customer Loyalty to Social
Commerce Websites. International Conference on Information Resources Management .
Albright, J. J. (2006-2008). Confirmatory Factor Analysis using Amos,LISREL, and Mplus. The
Trustees of Indiana University .
Baron, R. M. (1986). The moderator-mediator varivariable distinction in social psychological
research: Conceptual,strategic, and statistical considerations. Psychological Bulletin , 1173–1182.