Embed Size (px)
Citation preview
WP/16/237
The Impact of Demographics on Productivity and Inflation in Japan
by Yihan Liu and Niklas Westelius
IMF Working Papers describe research in progress by the author(s) and are published
to elicit comments and to encourage debate. The views expressed in IMF Working
Papers are those of the author(s) and do not necessarily represent the views of the IMF, its
Executive Board, or IMF management.
© 2016 International Monetary Fund WP/16/237
IMF Working Paper
Asia and Pacific Department
The Impact of Demographics on Productivity and Inflation in Japan
Prepared by Yihan Liu and Niklas Westelius
Authorized for distribution by Luc Everaert
December 2016
Abstract
Is Japan’s aging and, more recently, declining population hampering growth and reflation
efforts? Exploiting demographic and economic variation in prefectural data between 1990
and 2007, we find that aging of the working age population has had a significant negative
impact on total factor productivity. Moreover, prefectures that aged at a faster pace
experienced lower overall inflation, while prefectures with higher population growth
experienced higher inflation. The results give strong support to the notion that demographic
headwinds can have a non-trivial impact on total factor productivity and deflationary
pressures.
JEL Classification Numbers: E31, J11, O4
Keywords: Aging, Population Growth, Inflation, and Productivity
Author’s E-Mail Address: [email protected]; [email protected]
IMF Working Papers describe research in progress by the author(s) and are published to
elicit comments and to encourage debate. The views expressed in IMF Working Papers are
those of the author(s) and do not necessarily represent the views of the IMF, its Executive Board,
or IMF management.
2
Contents ........................................................... Page
Abstract ......................................................................................................................................1
I. Introduction ............................................................................................................................3
II. Linking Demographics with TFP Growth and Inflation .......................................................5
A. Demographics and Total Factor Productivity ...........................................................5
B. Demographics and Inflation ......................................................................................6
C. Secular Stagnation Debate ........................................................................................7
III. Methodology ........................................................................................................................7
IV. Data ......................................................................................................................................9
V. Results .................................................................................................................................10
VI. Conclusion .........................................................................................................................15
Figures
1. Aging and TFP Growth in G7 Countries ...............................................................................4
2. Aging and Inflation in G7 Countries .....................................................................................4
3. Prefectural Variation and Trends in Demographic and Economic Variables ......................10
4. Contributions from Changes in Age Distribution of Working Age Population to TFP
Growth, 1995–2035 .................................................................................................................14
5. Deflationary Pressures from Aging and Population Growth, 1995–2035 ...........................14
Tables
1. Macroeconomic and Demographic Outcomes for G7 Economies, 1990–2007 ....................3
2. Impact of Aging and Population Density on Total Factor Productivity ..............................11
3. Effect of Aging and Population Growth on Inflation ..........................................................13
References ................................................................................................................................16
3
I. INTRODUCTION
Japan is at the frontier of the global demographic transition. The working age population has
been declining since the early 1990s and total population peaked in 2010 at 127 million.
According to UN projections, the overall population is expected to reach 119 million by
2030, the same level as in 1984. Japan is also aging at an unprecedented speed. The old age
dependency ratio has more than doubled since 1990 and is expected to exceed 50 percent by
2030. These demographic headwinds have progressively caught the attention of
policymakers, particularly in light of Japan’s prolonged state of economic stagnation and low
inflation.
To some extent, Japan’s stagnant growth performance should not be surprising given that a
shrinking working age population reduces the availability of labor. Indeed, relative to its G7
peers Japan is outlier both in terms of economic performance and demographics. However,
even when measuring economic growth in output per worker, Japan stands out. As shown in
Table 1, the slow growth in labor productivity appears to be rooted in depressed total factor
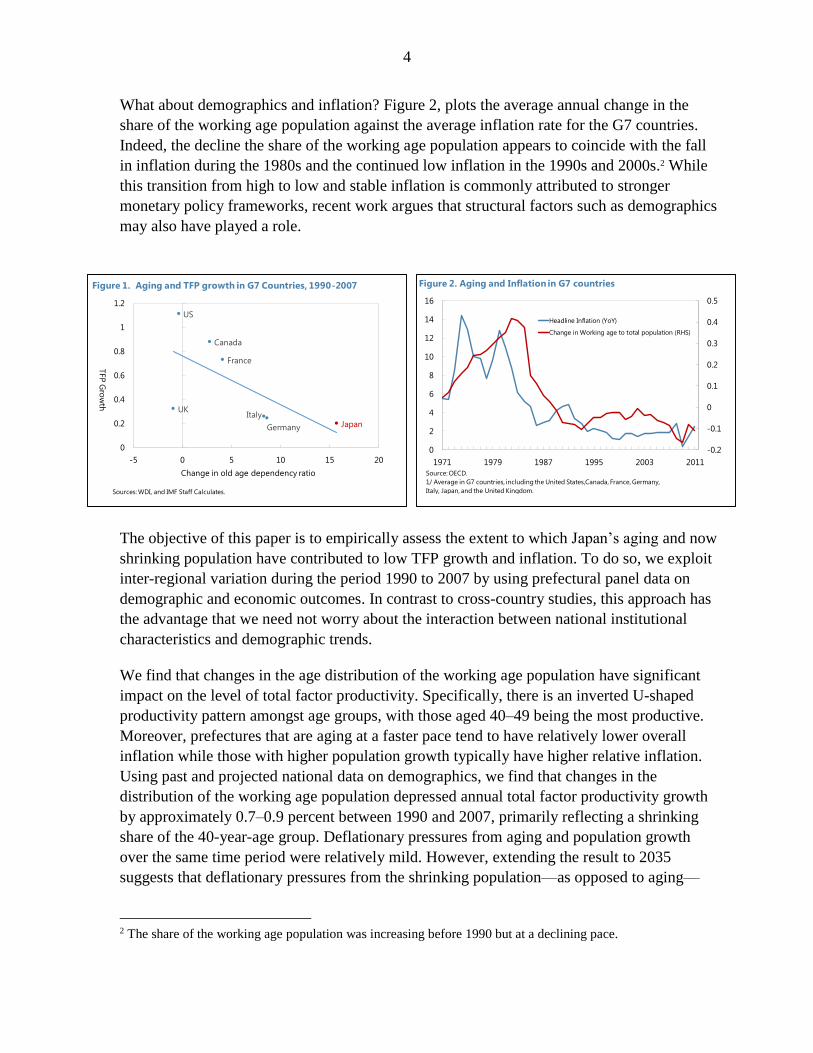
productivity (TFP) growth as opposed to capital accumulation.1 Interestingly, when plotting
TFP growth against aging for the G7 countries a strong negative relationship emerges – with
Japan at the extreme end – suggesting that demographics could be a contributing factor (see
Figure 1).
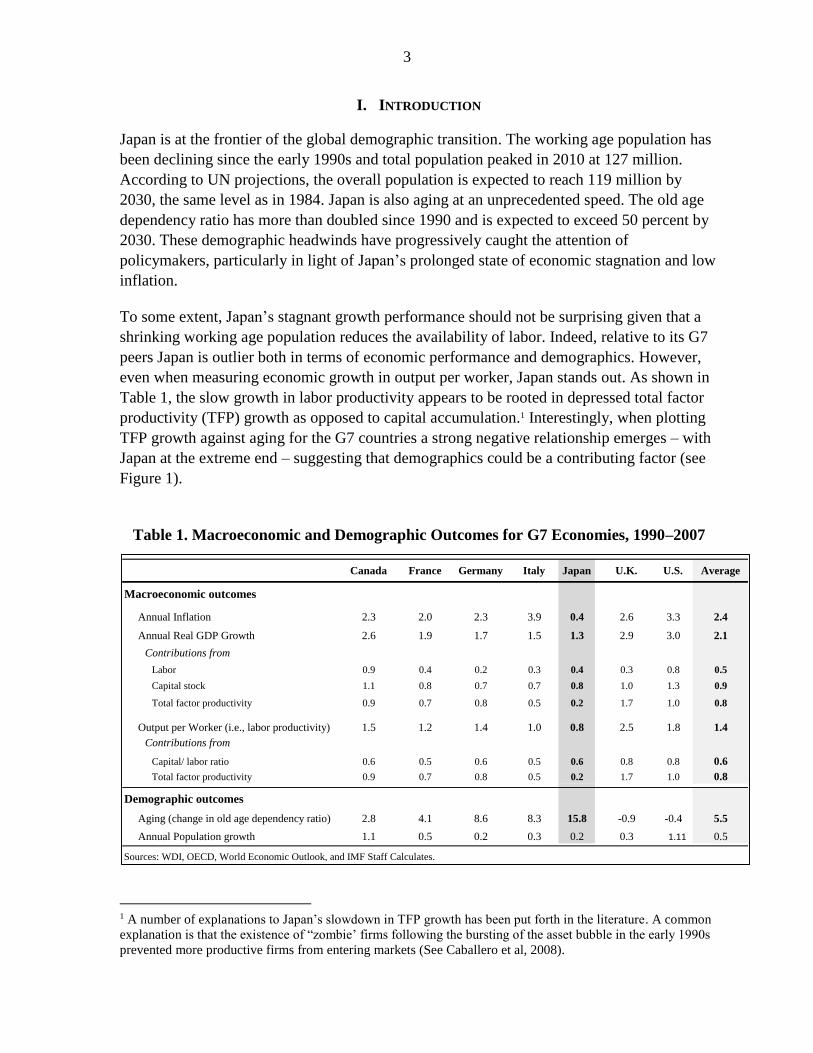
Table 1. Macroeconomic and Demographic Outcomes for G7 Economies, 1990–2007
1 A number of explanations to Japan’s slowdown in TFP growth has been put forth in the literature. A common
explanation is that the existence of “zombie’ firms following the bursting of the asset bubble in the early 1990s
prevented more productive firms from entering markets (See Caballero et al, 2008).
Table 1. Macroeconomic and Demographic Outcomes for G7 Economies, 1990-2007
Canada France Germany Italy Japan U.K. U.S. Average
Macroeconomic outcomes
Annual Inflation 2.3 2.0 2.3 3.9 0.4 2.6 3.3 2.4
Annual Real GDP Growth 2.6 1.9 1.7 1.5 1.3 2.9 3.0 2.1
Contributions from
Labor 0.9 0.4 0.2 0.3 0.4 0.3 0.8 0.5
Capital stock 1.1 0.8 0.7 0.7 0.8 1.0 1.3 0.9
Total factor productivity 0.9 0.7 0.8 0.5 0.2 1.7 1.0 0.8
Output per Worker (i.e., labor productivity) 1.5 1.2 1.4 1.0 0.8 2.5 1.8 1.4
Contributions from
Capital/ labor ratio 0.6 0.5 0.6 0.5 0.6 0.8 0.8 0.6
Total factor productivity 0.9 0.7 0.8 0.5 0.2 1.7 1.0 0.8
Demographic outcomes
Aging (change in old age dependency ratio) 2.8 4.1 8.6 8.3 15.8 -0.9 -0.4 5.5
Annual Population growth 1.1 0.5 0.2 0.3 0.2 0.3 1.11 0.5
Sources: WDI, OECD, World Economic Outlook, and IMF Staff Calculates.
4
What about demographics and inflation? Figure 2, plots the average annual change in the
share of the working age population against the average inflation rate for the G7 countries.
Indeed, the decline the share of the working age population appears to coincide with the fall
in inflation during the 1980s and the continued low inflation in the 1990s and 2000s.2 While
this transition from high to low and stable inflation is commonly attributed to stronger
monetary policy frameworks, recent work argues that structural factors such as demographics
may also have played a role.
The objective of this paper is to empirically assess the extent to which Japan’s aging and now
shrinking population have contributed to low TFP growth and inflation. To do so, we exploit
inter-regional variation during the period 1990 to 2007 by using prefectural panel data on
demographic and economic outcomes. In contrast to cross-country studies, this approach has
the advantage that we need not worry about the interaction between national institutional
characteristics and demographic trends.
We find that changes in the age distribution of the working age population have significant
impact on the level of total factor productivity. Specifically, there is an inverted U-shaped
productivity pattern amongst age groups, with those aged 40–49 being the most productive.
Moreover, prefectures that are aging at a faster pace tend to have relatively lower overall
inflation while those with higher population growth typically have higher relative inflation.
Using past and projected national data on demographics, we find that changes in the
distribution of the working age population depressed annual total factor productivity growth
by approximately 0.7–0.9 percent between 1990 and 2007, primarily reflecting a shrinking
share of the 40-year-age group. Deflationary pressures from aging and population growth
over the same time period were relatively mild. However, extending the result to 2035
suggests that deflationary pressures from the shrinking population—as opposed to aging—
2 The share of the working age population was increasing before 1990 but at a declining pace.
Canada
France
Germany
ItalyJapan
UK
US
0
0.2
0.4
0.6
0.8
1
1.2
-5 0 5 10 15 20
Sources: WDI, and IMF Staff Calculates.
TFP
Gro
wth
Figure 1. Aging and TFP growth in G7 Countries, 1990-2007
Change in old age dependency ratio
-0.2
-0.1
0
0.1
0.2
0.3
0.4
0.5
0
2
4
6
8
10
12
14
16
1971 1979 1987 1995 2003 2011
Headline Inflation (YoY)
Change in Working age to total population (RHS)
Figure 2. Aging and Inflation in G7 countries
Source: OECD.
1/ Average in G7 countries, including the United States,Canada, France, Germany,
Italy, Japan, and the United Kingdom.
5
will become more prominent in the future. In sum, our empirical results give strong support
to the notion that Japan’s demographic headwinds have and will play an important role with
respect to total factor productivity and deflationary pressures.
The remainder of the paper is structured as follows. Section II discusses the theoretical and
empirical links between demographics and macroeconomic outcomes. Section III and IV
describes the empirical methodology and data sources, and section V presents the results.
Section VI concludes.
II. LINKING DEMOGRAPHICS WITH TFP GROWTH AND INFLATION
A. Demographics and Total Factor Productivity
Several potential links between aging and productivity have been highlighted in the
literature. First, older workers may enjoy higher productivity due to the accumulation of
work experience while younger workers benefit from better health, higher processing speed
and ability to adjust to rapid technological changes, and greater entrepreneurship leading to
more innovation. These two counterforces may produce an inverted U-shaped pattern
between age and productivity.3 Second, aging is likely to increase the relative demand for
services (e.g., health care service), causing a sectorial shift towards the more labor intensive
and less productive service sector. Third, the size or density of the population may also
impact productivity as it spurs technological change, create positive agglomeration and
network effects, and stimulate learning by doing and innovative activity.
Surprisingly, there are relatively few empirical macroeconomic studies attempting to
quantify the relationship between demographics and aggregate productivity. A frequent
reference is Feyrer (2007) who examines the link between the age distribution of the
workforce and productivity using a cross-country panel on OECD and low income countries.
Consistent with some microeconomic studies, he finds an inverted U-shaped relationship
between the age distribution and total factor productivity, with the age-group 40–49 being the
most productive. Aiyar et al (2016) uses a similar methodology but looks at the effect of
workforce aging on the growth rate of productivity. Using data on European countries, they
find that an increase in the share of workers aged 55–64 leads to a significant and permanent
increase in TFP growth. Mestas et al (2016) use a panel on U.S. states to estimate the
realized impact of the old age dependency ratio on GDP per capita. They find that two-thirds
of the impact is due to slower productivity across the entire age distribution and one-third is
due to slower labor force growth. Empirical studies on the link between population
size/density and productivity stems primarily from growth theory. For instance, trying to
estimate agglomeration effects in selected European countries, Ciccone and Hall (1996) and
3 Looking at Nobel prize winners and great inventors, Jones (2010) not only finds an inverted U shaped
relationship between age and innovation, but also that the peak age of innovation has been increasing over time.
6
Ciccone (2002) find a strong positive relationship between productivity and employment
density.
B. Demographics and Inflation
There is little consensus about the link between demographics and inflation. While higher
population growth increases demand for goods and services, it also boosts overall supply due
to greater availability of labor. Of course, inflationary pressures may arise depending on how
fast supply can respond to the increased demand (e.g., land, housing, and natural resources
etc). 4 Masaaki Shirakawa, a former governor of the Bank of Japan, suggests that there may
also exist an expectations channel. Specifically, he postulates that as agents gradually realize
that demographic headwinds will lower future growth, and thus their expected permanent
income, they cut back on current consumption and investment which leads to deflationary
pressures.5 Aging in itself may also impact inflation. For instance, Juselius and Takátsin
(2015) argue that while aging constrains production through its impact on the availability of
labor, dissaving by retirees keeps demand relatively stable, thus leading to excess demand
and inflationary pressure. However, Andersson, Botman and Hunt (2014) show – using a
theoretical framework – that in the case of Japan this effect is likely to be more than offset by
a currency appreciation due to the repatriation of foreign savings by retirees.
An important counter argument to all these channels is that central banks should be able to
offset any demographic-induced disturbances to the inflation path. However, there are at least
two potential reasons for why this may not hold in the case of Japan. First, with monetary
policy in a liquidity trap, it is harder to offset deflationary pressures by stimulating the
economy. Second, older age groups—who prefers lower inflation in order to increase the real
return on their savings—are likely to gain increased political influence as their population
share grows, and thereby indirectly effect monetary policy outcomes (Bullard et al, 2012).
Empirical studies on the link between inflation and demographics are scarce, most likely
reflecting the conventional wisdom that inflation is primarily a monetary phenomenon, at
least over the long-term. However, in light of persistently low inflation in advanced countries
following the global financial crisis, there appears to be a growing interest in exploring the
impact of aging and population growth on inflation. The results from this limited empirical
literature are mixed. On the one hand, based on a OECD cross-country analysis, Yoon et al
(2014) find that a declining and aging population has a significant deflationary impact. In
contrast, Juselius and Takats (2015) find based on a panel of 22 advanced countries that a
larger share of dependents is associated with higher inflation, while a larger share of working
age cohorts is associated with lower inflation. Interestingly, a key driving force behind these
4 It is also possible that a larger population leads to greater economies of scale and more competition, putting
downward pressure on prices.
5 See opening remarks by Mr. Masaaki Shirakawa at the 2012 BOJ-IMES Conference, hosted by the Institute
for Monetary and Economic Studies, at the Bank of Japan, Tokyo, 30 May 2012.
7
diverging results seem to be whether an older population is associated with a higher price
level or with a higher inflation level.
C. Secular Stagnation Debate
The secular stagnation hypothesis, first put forth by Hansen (1938) and recently revived by
Summers (2013), provides another channel through which adverse demographics can lead to
both low inflation and low growth. The gist of the argument is that structural excess savings
due to lack of investment and high saving rates lead to such a low real neutral interest rate
that monetary policy can no longer stimulate the economy, causing the economy to operate
below potential and thus keeping inflation below the central bank’s inflation target. To the
extent that demographic factors reduce the propensity to invest and increase the propensity to
save, they may play an important role in the secular stagnation theory. For instance, aging
combined with stagnant or negative population growth may reduce the willingness of
corporates to invest in a shrinking and less productive economy. Moreover, while savings
should decrease with age, increased longevity, higher uncertainty with respect to public debt
dynamics and future social security payments, and greater bequest incentives due to lack of
future opportunities for younger generations may increase savings.6
III. METHODOLOGY
To assess the impact of aging and population density on total factor productivity we use a
similar methodology to Feyrer (2007). Specifically, the following model is considered:
𝑙𝑜𝑔 𝑇𝐹𝑃𝑟,𝑡 = 𝛼1𝑊20𝑟,𝑡 + 𝛼2𝑊30𝑟,𝑡 + 𝛼3𝑊50𝑟,𝑡 + 𝛼4𝑊60𝑟,𝑡 + 𝛽1𝑂𝐴𝐷𝑅𝑟,𝑡 +
β2 𝑙𝑜𝑔 𝐷WA𝑟,𝑡 + β3 𝑆𝐸𝑅𝑟,𝑡 + 𝛿𝑟 + 𝜃𝑡 + 𝑢𝑟,𝑡 (1)
The level of total labor force productivity for prefecture 𝑟 at time 𝑡 is denoted as 𝑇𝐹𝑃𝑟,𝑡. The
variables 𝑊20, 𝑊30, 𝑊50, and 𝑊60 represent the share of 10-year age groups of the
working age population—defined as the population between the ages 20 and 69—in
prefecture 𝑟 at time 𝑡.7 The age group 𝑊40 is the reference age group and therefore excluded
from the regression. The coefficients 𝛼𝑖 measures the effect on total factor productivity
relative to the age group 𝑊40. The old age dependency ratio, 𝑂𝐴𝐷𝑅, is defined as the
population aged 70 or above as a share of the working age population, and 𝐷𝑊𝐴 measures
the density of the working age population (i.e., number of people per unit of area). The model
also includes time invariant fixed effects, 𝛿𝑟, a time trend common to all prefectures, 𝜃𝑡, and
6 Gagnon et al (2016) argues that changes in U.S. population growth, family composition, life expectancy, and
labor market activity accounted for a 1.25 percentage point decline in the equilibrium real interest rate since
1980 in the U.S.
7 It is common to specify the working age population as ages 15 to 64. However, as a large share of 15–19 year
olds are attending school and men and women tend to exit the labor force at 70 and 67, respectively, we choose
to define the working age population as those aged between 20 and 69.
(continued…)
8
the size of the service sector in each prefecture, 𝑆𝐸𝑅𝑟,𝑡, expressed as a share of nominal
prefectural GDP. The latter is important given that total factor productivity tends to be lower
in the service sector than in the manufacturing sector.8
There are several potential issues when estimating equation (1). First, as highlighted by
Feyrer (2007), it is quite reasonable to assume that the error terms are serially correlated
(especially since annual data is used) or that total factor productivity may follow a unit root
process. To address this, we estimate equation (1) in first differences as well as by including
a lagged dependent variable.9 Standard errors are made robust to heteroskedasticity and
clustered for each prefecture. Second, in contrast to other studies, our specification uses the
age distribution of the working age population instead of the workforce. While this prevents
us from capturing changes in the age distribution of the workforce due to changes in labor
force participation rates, it has the added advantage of ensuring that the estimation is not
exposed to the potential endogeneity problem arising from the fact that labor force
participation rates for various age cohorts may react differently to productivity shocks.10
When investigating the relationship between inflation and demographic trends, we are
primarily interested in population growth and the old age dependency ratio. Accordingly, the
following model is estimated:
𝜋𝑟,𝑡 = 𝛼1 ∆𝑂𝐴𝐷𝑅𝑟,𝑡 + 𝛼 2∆𝑙𝑜𝑔𝑃𝑜𝑝𝑟,𝑡 + 𝛽 𝑂𝑃𝐺𝑟,𝑡 + 𝛾𝜋𝑟,𝑡−1 + 𝛿𝑟 + 𝜃𝑡 + 𝑢𝑟,𝑡 (2)
Annual inflation for prefecture 𝑟 at time 𝑡 is denoted as 𝜋𝑟,𝑡. As before, 𝑂𝐴𝐷𝑅, is the old age
dependency ratio in prefecture 𝑟 at time 𝑡, while 𝑃𝑜𝑝 is the prefectural population, and 𝑂𝑃𝐺,
is the prefectural output gap intended to capture regional excess demand dynamics.11 The
8 As mentioned earlier, aging may be a driver of this trend. Indeed, regressing the change in the size of the
service sector on the change in the old age dependency ratio and population density (with year fixed effects)
indicate a significant positive relationship, explaining about 21 percent of the variation across prefectures and
32 percent within prefectures.
9 Including a lagged dependent variable together with fixed effects makes the standard estimators inconsistent.
To address this issue we apply the Arellano-Bond GMM estimator which uses lagged values of predetermined
and potentially endogenous variables as instruments.
10 Our model may still be subject to an endogeneity problem and upward bias of the coefficients if inter-
prefectural migration flows are driven by prefectural productivity differentials (e.g., reflected in interregional
wage differentials) and are large enough to shift the working age population towards younger age groups.
However, between 1990 and 2007, net migration as a percent of prefectural population between 1990 to 2007
averaged between 0.1 and 0.4 percent across prefectures. Moreover, only about 18–19 percent of migrants
between 1996–2006 said they moved for work related reasons. Also note that the lagged dependent model is
estimated using the Arellano-Bond GMM estimator, which uses lagged levels of dependent variables as
instruments, potentially mitigating endogeneity problems arising from migration.
11 The output gap is derived using HP-filtered real prefectural output.
(continued…)
9
lagged inflation rate, 𝜋𝑟,𝑡−1, is included to capture the high degree of inflation persistence.12
As in equation (1), 𝛿𝑟 is the time-invariant fixed effect and, 𝜃𝑡, represents a common time
trend across prefectures.13 To examine how aging and population growth affects relative
prices, equation (2) is also estimated for each of the sub components of the CPI basket.
IV. DATA
Both models are estimated over the sample period 1990 to 2007 to capture the period
between the bursting of the domestic asset price bubble at the end of the 1980s and early
1990s and the Global Financial Crisis in 2008. Yearly data on prefectural real growth, capital
stock, and labor input (measured in hours worked) is taken from the Regional-Level Japan
Industrial Productivity (R-JIP). The prefectural total factor productivity is derived through
simple growth accounting following the same methodology as Kyoji, Tatsuji and Joji (2015).
Data on prefectural inflation and its components and annual prefectural age distributions are
taken from the Portal Site of Official Statistics of Japan. While the population data is
available in 5-year age groups, 10-year age groups are used to more clearly separate age
brackets and their potential impact on productivity.
There is significant inter-prefectural variation in terms of demographic. For instance, Akita in
northern Japan experienced a drop in the working age population by over 13 percent and an
increase in the old age dependency ratio by 20 percentage points between 1990 and 2007. In
contrast, the Saitama prefecture saw its working age population rise by 16 percent and the old
age dependency ratio only increased by 9 percentage points. The TFP and consumer price
trends also vary substantially across prefectures. In Kagoshima, TFP grew by 23 percent
between 1990 and 2007 while it contracted by 11 percent in Nara, and Aomori prefecture
experienced a rise in the CPI level of 14 percent over the sample period while the Saga
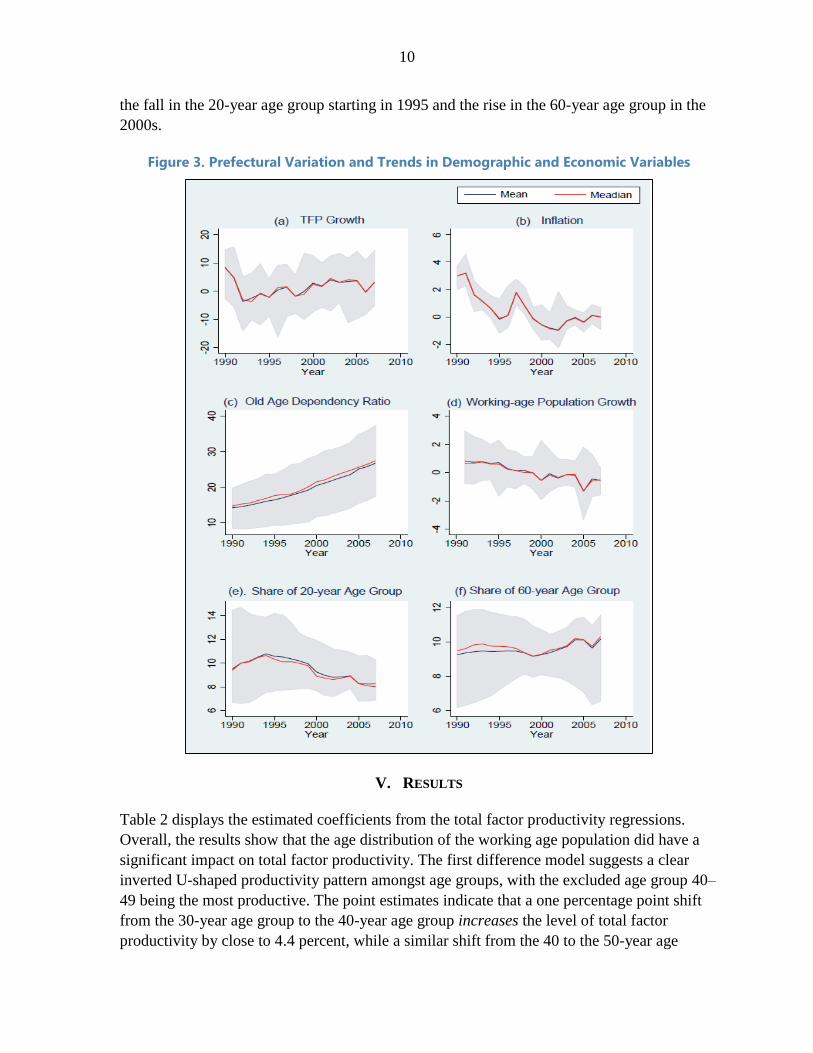
prefecture only saw consumer prices rise by 4 percent. Figure 3, shows the data variation
across prefectures and over time for TFP growth, inflation, old-age dependency ratio,
population growth, and the aging of the working age population. The shaded areas reflect the
minimum and maximum values and show significant variation across prefectures over time
for all variables. There is no significant skewness in the data with the median and average
measures closely following each other. The median prefectural inflation rate shows a general
downward trend with temporary episodes of deflation. The spike in inflation in 1997 reflects
the consumption tax hike. As is well documented, TFP growth came down significantly in
the early 1990s, registering negative growth, but then returned to positive growth in the
2000s. Meanwhile the old age dependency ratio steadily increased across prefectures while
population growth slowed. Indeed, a number of prefectures experienced negative population
growth for extended periods of time. Finally, the shift in the age distribution is reflected by
12 Equation (2) can also be interpreted as a regional Phillips curve with purely backward looking inflation
expectations and where the intercept is dependent both on national level time fixed effects as well as prefectural
demographic variations.
13 Like the lagged dependent variable specification of eq. (1), eq. (2) is estimated using the Arellano-Bond
GMM estimator. The standard errors are made robust to heteroskedasticity and clustered for each prefecture.
10
the fall in the 20-year age group starting in 1995 and the rise in the 60-year age group in the
2000s.
Figure 3. Prefectural Variation and Trends in Demographic and Economic Variables
V. RESULTS
Table 2 displays the estimated coefficients from the total factor productivity regressions.
Overall, the results show that the age distribution of the working age population did have a
significant impact on total factor productivity. The first difference model suggests a clear
inverted U-shaped productivity pattern amongst age groups, with the excluded age group 40–
49 being the most productive. The point estimates indicate that a one percentage point shift
from the 30-year age group to the 40-year age group increases the level of total factor
productivity by close to 4.4 percent, while a similar shift from the 40 to the 50-year age
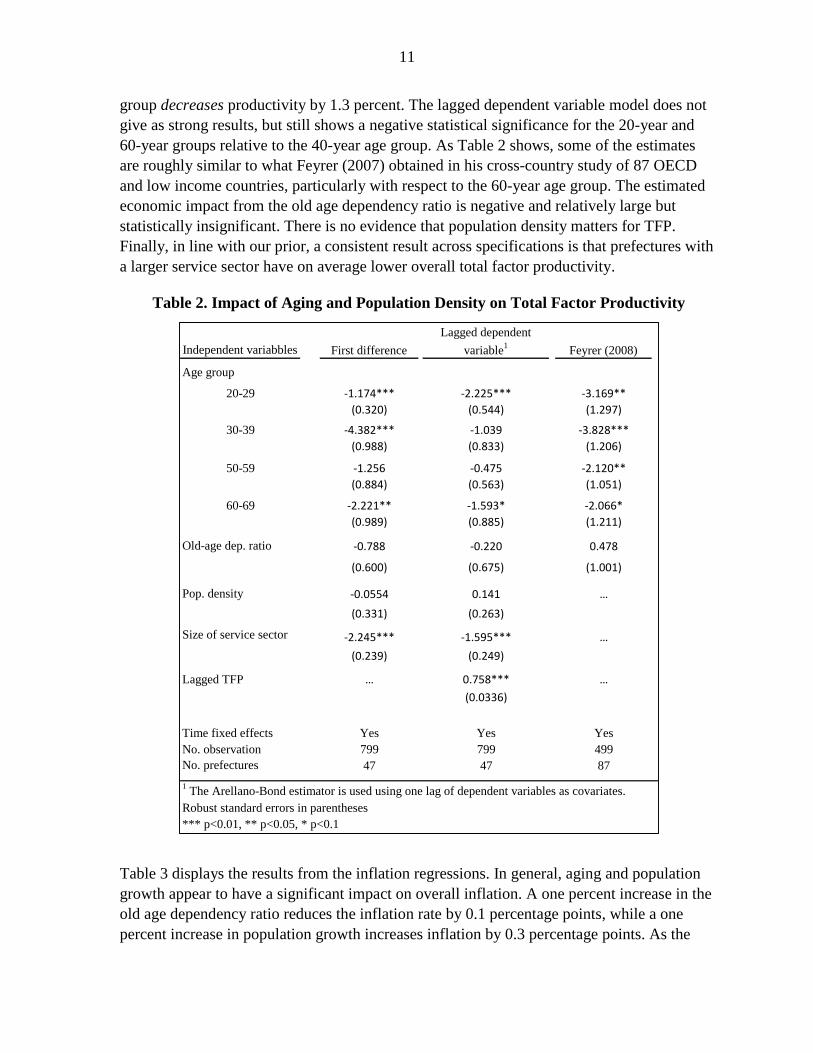
11
group decreases productivity by 1.3 percent. The lagged dependent variable model does not
give as strong results, but still shows a negative statistical significance for the 20-year and
60-year groups relative to the 40-year age group. As Table 2 shows, some of the estimates
are roughly similar to what Feyrer (2007) obtained in his cross-country study of 87 OECD
and low income countries, particularly with respect to the 60-year age group. The estimated
economic impact from the old age dependency ratio is negative and relatively large but
statistically insignificant. There is no evidence that population density matters for TFP.
Finally, in line with our prior, a consistent result across specifications is that prefectures with
a larger service sector have on average lower overall total factor productivity.
Table 2. Impact of Aging and Population Density on Total Factor Productivity
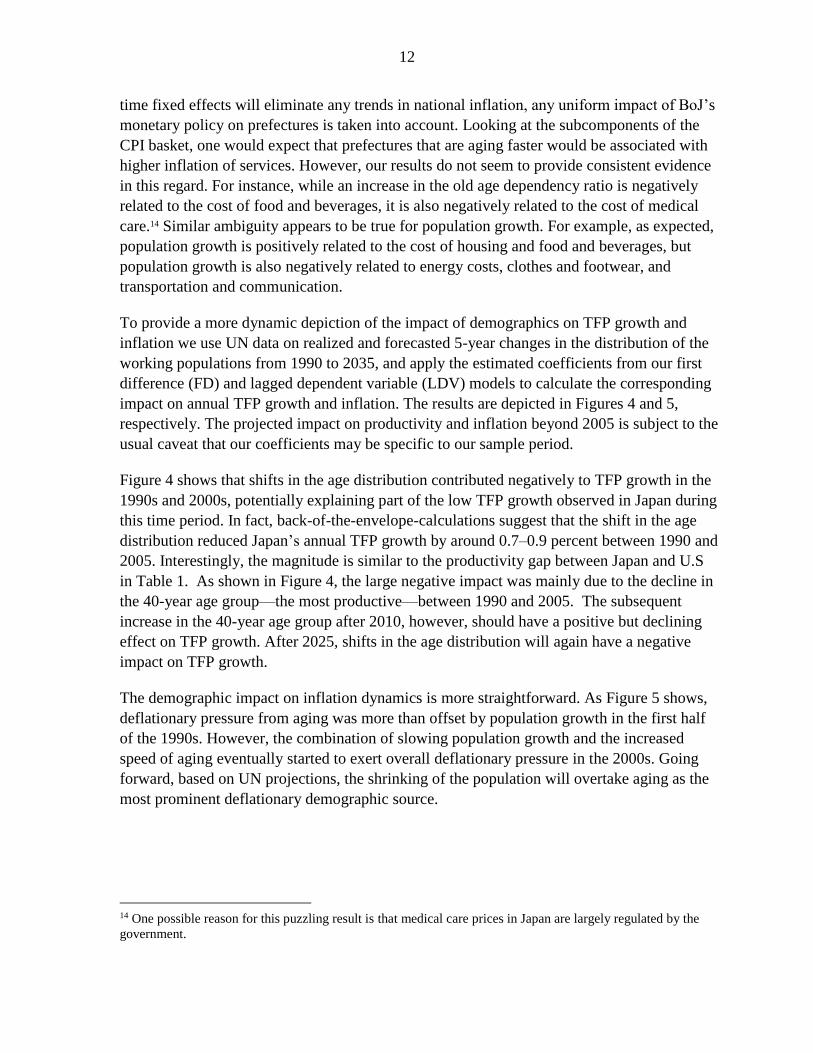
Table 3 displays the results from the inflation regressions. In general, aging and population
growth appear to have a significant impact on overall inflation. A one percent increase in the
old age dependency ratio reduces the inflation rate by 0.1 percentage points, while a one
percent increase in population growth increases inflation by 0.3 percentage points. As the
Table 2: Impact of Aging and Population Density on Total Factor Productivity
Independent variabbles
Age group
20-29 -1.174*** -2.225*** -3.169**
(0.320) (0.544) (1.297)
30-39 -4.382*** -1.039 -3.828***
(0.988) (0.833) (1.206)
50-59 -1.256 -0.475 -2.120**
(0.884) (0.563) (1.051)
60-69 -2.221** -1.593* -2.066*
(0.989) (0.885) (1.211)
Old-age dep. ratio -0.788 -0.220 0.478
(0.600) (0.675) (1.001)
Pop. density -0.0554 0.141 …
(0.331) (0.263)
Size of service sector -2.245*** -1.595*** …
(0.239) (0.249)
Lagged TFP … 0.758*** …
(0.0336)
Time fixed effects Yes Yes Yes
No. observation 799 799 499
No. prefectures 47 47 87
1 The Arellano-Bond estimator is used using one lag of dependent variables as covariates.
Robust standard errors in parentheses
*** p<0.01, ** p<0.05, * p<0.1
First difference Feyrer (2008)
Lagged dependent
variable1
12
time fixed effects will eliminate any trends in national inflation, any uniform impact of BoJ’s
monetary policy on prefectures is taken into account. Looking at the subcomponents of the
CPI basket, one would expect that prefectures that are aging faster would be associated with
higher inflation of services. However, our results do not seem to provide consistent evidence
in this regard. For instance, while an increase in the old age dependency ratio is negatively
related to the cost of food and beverages, it is also negatively related to the cost of medical
care.14 Similar ambiguity appears to be true for population growth. For example, as expected,
population growth is positively related to the cost of housing and food and beverages, but
population growth is also negatively related to energy costs, clothes and footwear, and
transportation and communication.
To provide a more dynamic depiction of the impact of demographics on TFP growth and
inflation we use UN data on realized and forecasted 5-year changes in the distribution of the
working populations from 1990 to 2035, and apply the estimated coefficients from our first
difference (FD) and lagged dependent variable (LDV) models to calculate the corresponding
impact on annual TFP growth and inflation. The results are depicted in Figures 4 and 5,
respectively. The projected impact on productivity and inflation beyond 2005 is subject to the
usual caveat that our coefficients may be specific to our sample period.
Figure 4 shows that shifts in the age distribution contributed negatively to TFP growth in the
1990s and 2000s, potentially explaining part of the low TFP growth observed in Japan during
this time period. In fact, back-of-the-envelope-calculations suggest that the shift in the age
distribution reduced Japan’s annual TFP growth by around 0.7–0.9 percent between 1990 and
2005. Interestingly, the magnitude is similar to the productivity gap between Japan and U.S
in Table 1. As shown in Figure 4, the large negative impact was mainly due to the decline in
the 40-year age group—the most productive—between 1990 and 2005. The subsequent
increase in the 40-year age group after 2010, however, should have a positive but declining
effect on TFP growth. After 2025, shifts in the age distribution will again have a negative
impact on TFP growth.
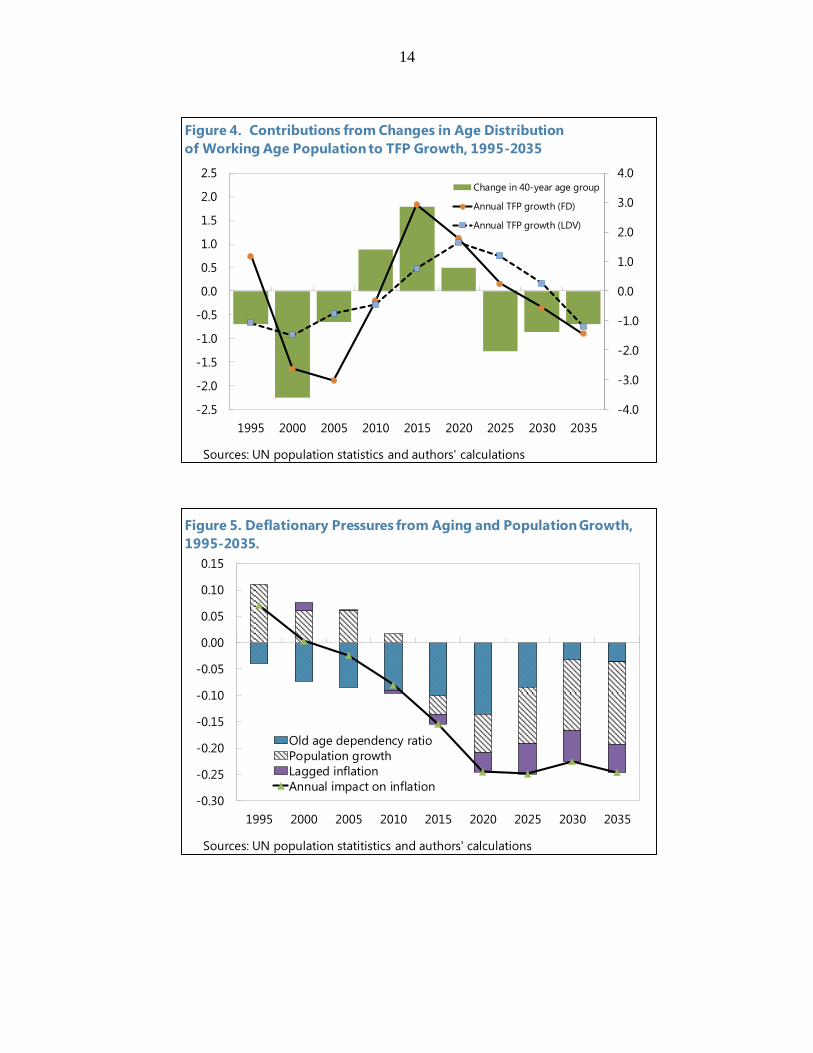
The demographic impact on inflation dynamics is more straightforward. As Figure 5 shows,
deflationary pressure from aging was more than offset by population growth in the first half
of the 1990s. However, the combination of slowing population growth and the increased
speed of aging eventually started to exert overall deflationary pressure in the 2000s. Going
forward, based on UN projections, the shrinking of the population will overtake aging as the
most prominent deflationary demographic source.
14 One possible reason for this puzzling result is that medical care prices in Japan are largely regulated by the
government.
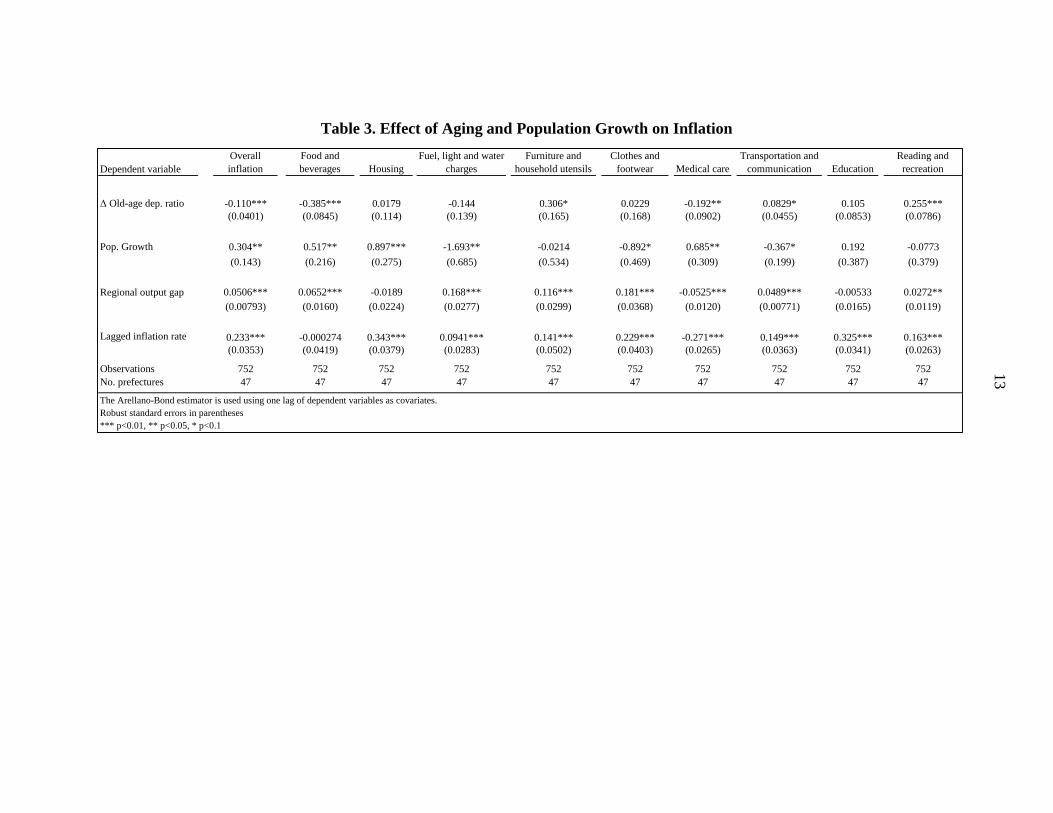
Table 3. Effect of Aging and Population Growth on Inflation
Dependent variable
Overall
inflation
Food and
beverages Housing
Fuel, light and water
charges
Furniture and
household utensils
Clothes and
footwear Medical care
Transportation and
communication Education
Reading and
recreation
Δ Old-age dep. ratio -0.110*** -0.385*** 0.0179 -0.144 0.306* 0.0229 -0.192** 0.0829* 0.105 0.255***
(0.0401) (0.0845) (0.114) (0.139) (0.165) (0.168) (0.0902) (0.0455) (0.0853) (0.0786)
Pop. Growth 0.304** 0.517** 0.897*** -1.693** -0.0214 -0.892* 0.685** -0.367* 0.192 -0.0773
(0.143) (0.216) (0.275) (0.685) (0.534) (0.469) (0.309) (0.199) (0.387) (0.379)
Regional output gap 0.0506*** 0.0652*** -0.0189 0.168*** 0.116*** 0.181*** -0.0525*** 0.0489*** -0.00533 0.0272**
(0.00793) (0.0160) (0.0224) (0.0277) (0.0299) (0.0368) (0.0120) (0.00771) (0.0165) (0.0119)
Lagged inflation rate 0.233*** -0.000274 0.343*** 0.0941*** 0.141*** 0.229*** -0.271*** 0.149*** 0.325*** 0.163***
(0.0353) (0.0419) (0.0379) (0.0283) (0.0502) (0.0403) (0.0265) (0.0363) (0.0341) (0.0263)
Observations 752 752 752 752 752 752 752 752 752 752
No. prefectures 47 47 47 47 47 47 47 47 47 47
The Arellano-Bond estimator is used using one lag of dependent variables as covariates.
Robust standard errors in parentheses
*** p<0.01, ** p<0.05, * p<0.1
Table 3. Effect of Aging and Population Growth on Inflation
13
14
-4.0
-3.0
-2.0
-1.0
0.0
1.0
2.0
3.0
4.0
-2.5
-2.0
-1.5
-1.0
-0.5
0.0
0.5
1.0
1.5
2.0
2.5
1995 2000 2005 2010 2015 2020 2025 2030 2035
Change in 40-year age group
Annual TFP growth (FD)
Annual TFP growth (LDV)
Figure 4. Contributions from Changes in Age Distribution
of Working Age Population to TFP Growth, 1995-2035
Sources: UN population statistics and authors' calculations
-0.30
-0.25
-0.20
-0.15
-0.10
-0.05
0.00
0.05
0.10
0.15
1995 2000 2005 2010 2015 2020 2025 2030 2035
Old age dependency ratio
Population growth
Lagged inflation
Annual impact on inflation
Figure 5. Deflationary Pressures from Aging and Population Growth,
1995-2035.
Sources: UN population statitistics and authors' calculations
15
VI. CONCLUSION
A number of advanced countries are or will be facing declining and aging populations. These
trends present a potentially daunting economic challenge in terms of their impact on growth,
resource scarcity, and fiscal stability. However, empirical research trying to estimate realized
macroeconomic effects from demographic changes has been relatively scarce. Japan
constitutes in many ways the perfect candidate for such empirical analysis because of its
prolonged experience with demographic and economic headwinds.
To this end, this paper sheds some light on whether the age composition of Japan’s working
age population can help explain the low TFP growth between 1990 and 2007 and whether the
sharp increase in the speed of aging and slow population growth have contributed to
deflationary pressures. In both cases, our empirical results give an affirmative answer. While
it is true that monetary policy should in principle be able to offset such effects on national
inflation, the fact that short-term nominal interest rates were close to or at their lower
effective bound during this period severely constrained the Bank of Japan’s ability to
stimulate the economy. Moreover, to the extent aging and a slower population growth
lowered the real neutral interest rate, these demographic forces have further hampered the
ability of monetary policy to reflate the economy.
The results suggest that policies designed to push the Japanese economy out of its the current
muddle-through status quo must address underlying demographic headwinds. Hence, it is
reassuring that the structural reform agenda under Prime Minister Abe’s administration gives
demographics a high priority. To enhance these efforts further, more research is needed to
identify and better understand the mechanism through which demographic factors affect
productivity and inflation.
16
REFERENCES
Anderson, Derek, Dennis Botman, and Ben Hunt, 2014, “Is Japan’s Population Aging
Deflationary?” IMF Working Paper WP14/139.
Bullard, James, Carlos Garriga, and Christopher J. Walker, 2012, “Demographics,
Redistribution, and Optimal Inflation,” Federal Reserve Bank of St. Louis Review,
November/December 2012, 94(6), pp. 419–39.
Caballero, Ricardo J.; Hoshi, Takeo; and Kashyap, Anil K, 2008, "Zombie Lending and
Depressed Restructuring in Japan." American Economic Review, Vol. 98, No. 5, pp.
1943–77
Ciccone, Antonio, and Robert E. Hall, 1996, “Productivity and the Density of Economic
Activity,” American Economic Review, March 1996, 86(1), pp. 54–70.
———, 2002, “Agglomeration Effects in Europe,” European Economic Review, 46 (2002)
213–227.
Feyrer, J. 2007, “Demographics and Productivity,” The Review of Economics and Statistics
89(1):100–109.
Gagnon, Etienne, Benjamin K. Johannsen, and David Lopez-Salido, 2016, “Understanding
the New Normal: The Role of Demographics,” Finance and Economics Discussion
Series, Division of Research and Statistics and Monetary Affairs, Federal Reserve
Board, Washington D.C.
Hansen, Alvin, 1938. “Full recovery or stagnation,” New York: W.W. Norton & Co.
Aiyar, Shekhar, Christian Ebeke, and Xiaobo Shao, 2016, IMF Working Paper, forthcoming.
Jones, Benjamin F. 2010, “Age and Great Invention,” Review of Economics and Statistics,
Vol. 92, No. 1: 1–14
Juselius, Mikael, and Előd Takáts, 2015, “Can demography affect inflation and monetary
policy?” Bank for International Settlements Working Paper, No. 485.
Kyoji, Fukao, Makino Tatsuji, and Tokui Joji, 2015, “Regional Factor Inputs and
Convergence in Japan: A macro-level analysis, 1955–2008,” RIETI Discussion Paper
Series 15-E-123.
Maestas, Nicole, Kathleen J. Mullen, and David Powell, 2016, “The Effect of Population
Aging on Economic Growth, the Labor Force and Productivity”, NBER Working
Paper No.22452.

17
Summers H, Lawrence, 2013, Crises yesterday and today. Remarks by Larry Summers at
14th Annual IMF Research Conference, Nov 8 2013.
Yoon, Yong-Won, Jinill Kim, and Jungjin Lee, 2014, “Impact of Demographic Changes on
Inflation and the Macroeconomy,” IMF Working Paper, WP/14/210.