Embed Size (px)
Citation preview
Unemployment, Inflation, and Productivity
Measuring MacroeconomicPerformance continued
Unemployment
• Unemployment Rate Dating Exercise
• Why do we care?– Human Factors
• Self Esteem• Crime
– Economic Factors• Loss of Output• Idle resources
Defining andMeasuring Unemployment
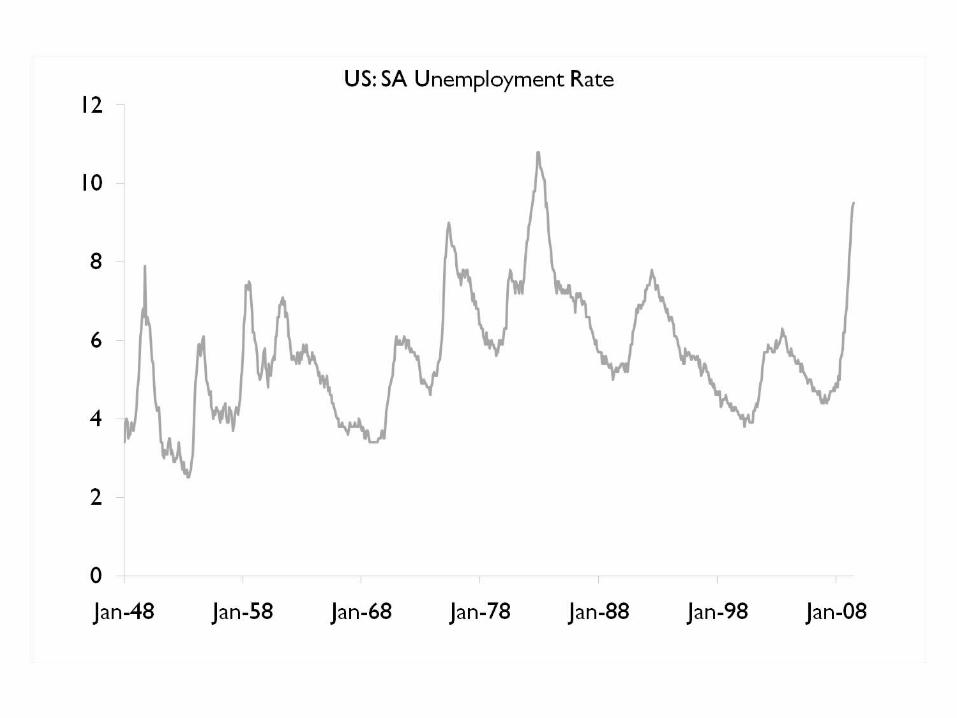
• The most frequently discussed symptom of a recession is unemployment.
• An employed person is any person 16 years old or older:
1. who works for pay, either for someone else or in his or her own business for 1 or more hours per week,
2. who works without pay for 15 or more hours per week in a family enterprise, or
3. who has a job but has been temporarily absent, with or without pay.
Defining andMeasuring Unemployment
• An unemployed person is a person 16 years old or older who:
1. is not working, 2. is available for work, and3. has made specific efforts to find work during
the previous 4 weeks.
• A person who is not looking for work, either because he or she does not want a job or has given up looking, is not in the labor force.
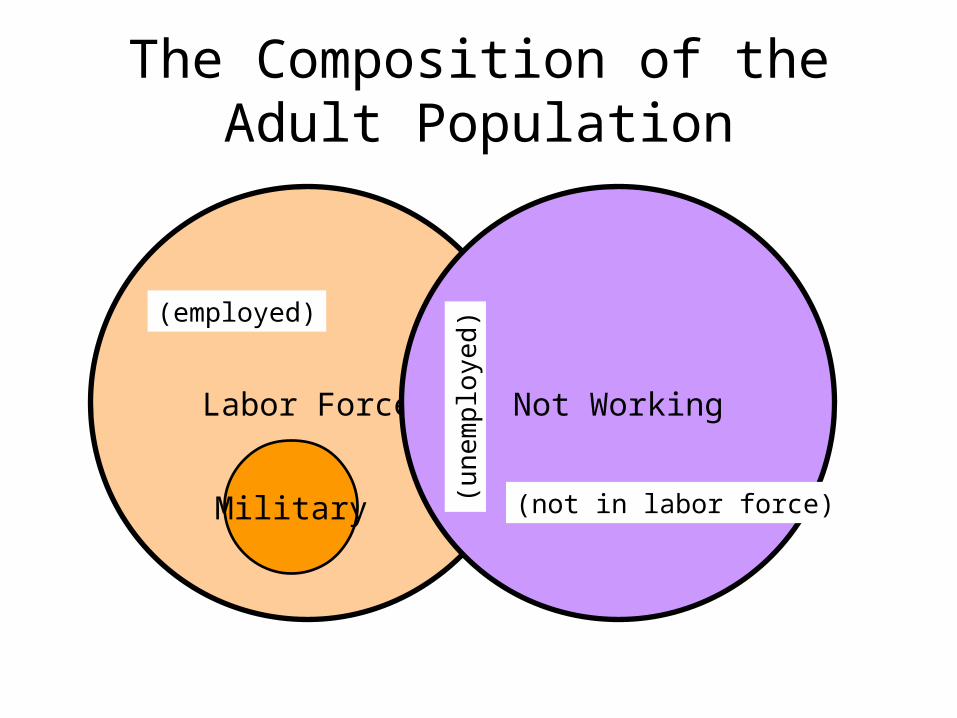
The Composition of the Adult Population
Labor Force Not Working
Military (not in labor force)
(une
mpl
oyed
)
(employed)
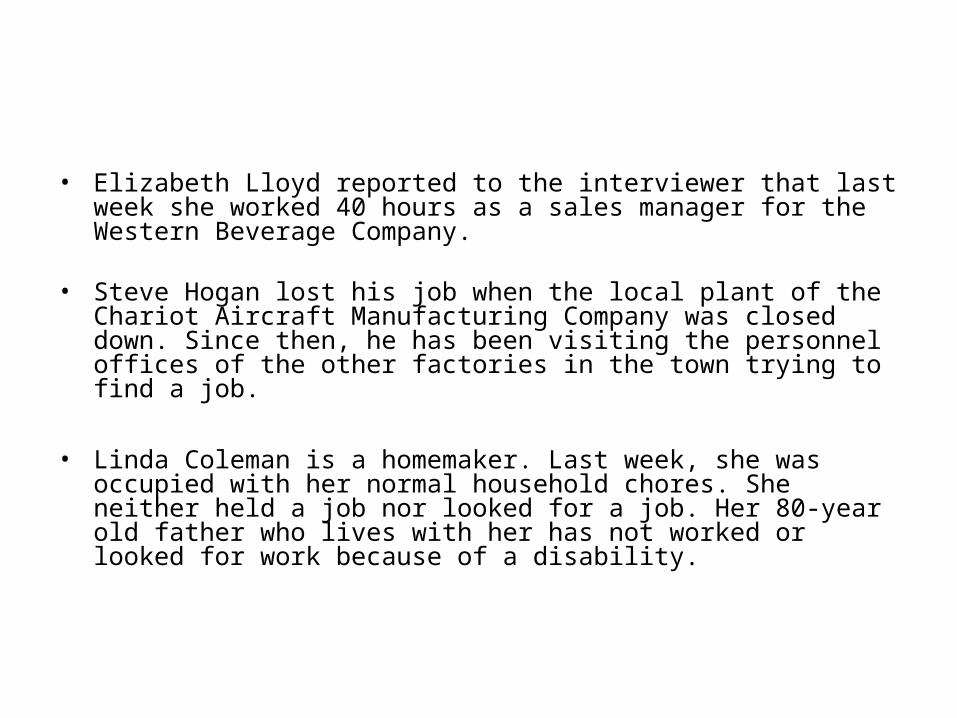
• Elizabeth Lloyd reported to the interviewer that last week she worked 40 hours as a sales manager for the Western Beverage Company.
• Steve Hogan lost his job when the local plant of the Chariot Aircraft Manufacturing Company was closed down. Since then, he has been visiting the personnel offices of the other factories in the town trying to find a job.
• Linda Coleman is a homemaker. Last week, she was occupied with her normal household chores. She neither held a job nor looked for a job. Her 80-year old father who lives with her has not worked or looked for work because of a disability.
Defining andMeasuring Unemployment
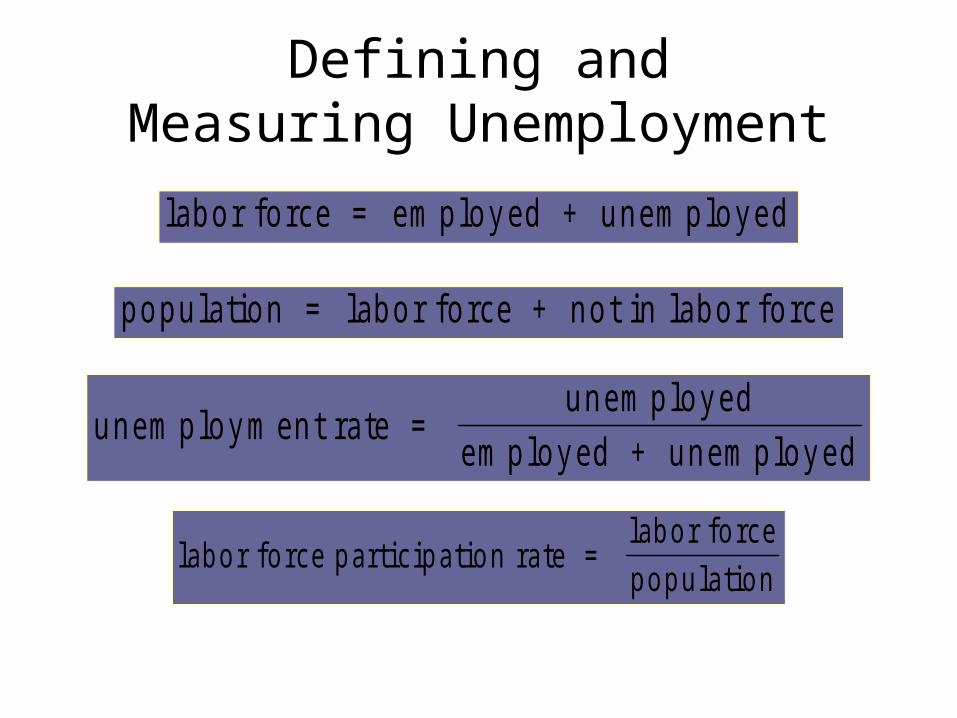
u n em p lo y m en t ra te = u n em p lo y ed
em p lo y ed + u n em p lo y ed
lab o r fo rc e = em p lo y ed + u n em p lo y ed
p o p u la tio n = lab o r fo rce + n o t in lab o r fo rce
lab o r fo rce p artic ip a tio n ra te = lab o r fo rce
p o p u la tio n
Defining andMeasuring Unemployment
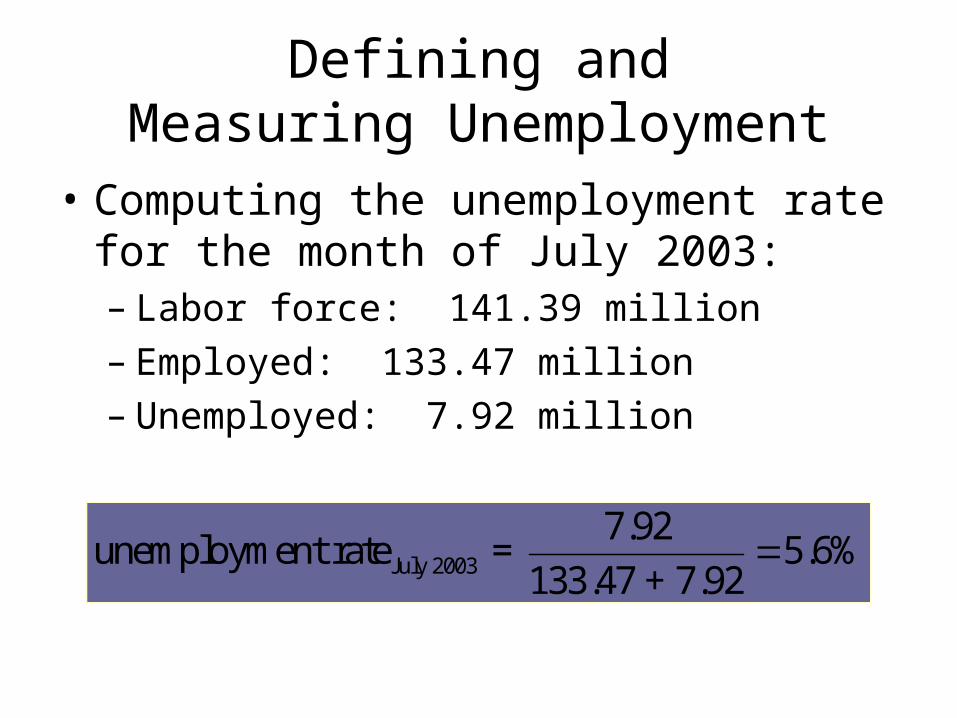
• Computing the unemployment rate for the month of July 2003:– Labor force: 141.39 million– Employed: 133.47 million– Unemployed: 7.92 million
July 2003
7.92unemployment rate = 5.6%
133.47 + 7.92
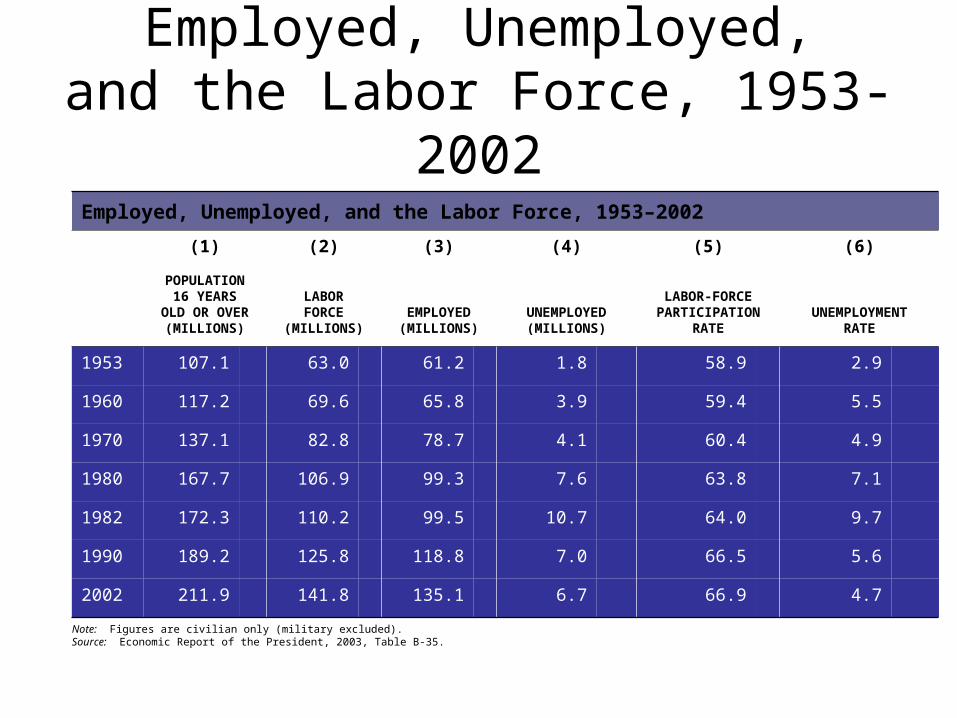
Employed, Unemployed,and the Labor Force, 1953-2002
Employed, Unemployed, and the Labor Force, 1953–2002
(1) (2) (3) (4) (5) (6)
POPULATION16 YEARS
OLD OR OVER(MILLIONS)
LABORFORCE
(MILLIONS)EMPLOYED(MILLIONS)
UNEMPLOYED(MILLIONS)
LABOR-FORCEPARTICIPATION
RATEUNEMPLOYMENT
RATE
1953 107.1 63.0 61.2 1.8 58.9 2.9
1960 117.2 69.6 65.8 3.9 59.4 5.5
1970 137.1 82.8 78.7 4.1 60.4 4.9
1980 167.7 106.9 99.3 7.6 63.8 7.1
1982 172.3 110.2 99.5 10.7 64.0 9.7
1990 189.2 125.8 118.8 7.0 66.5 5.6
2002 211.9 141.8 135.1 6.7 66.9 4.7
Note: Figures are civilian only (military excluded).Source: Economic Report of the President, 2003, Table B-35.
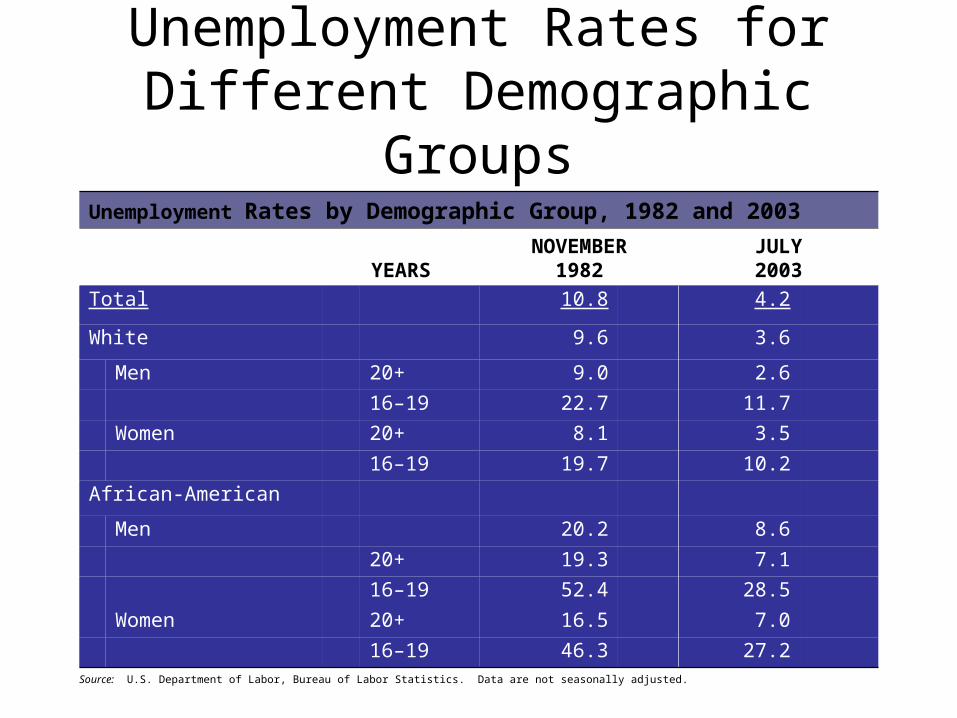
Unemployment Rates forDifferent Demographic Groups
Unemployment Rates by Demographic Group, 1982 and 2003
YEARSNOVEMBER
1982JULY2003
Total 10.8 4.2
White 9.6 3.6
Men 20+ 9.0 2.6
16–19 22.7 11.7
Women 20+ 8.1 3.5
16–19 19.7 10.2
African-American
Men 20.2 8.6
20+ 19.3 7.1
16–19 52.4 28.5
Women 20+ 16.5 7.0
16–19 46.3 27.2Source: U.S. Department of Labor, Bureau of Labor Statistics. Data are not seasonally adjusted.
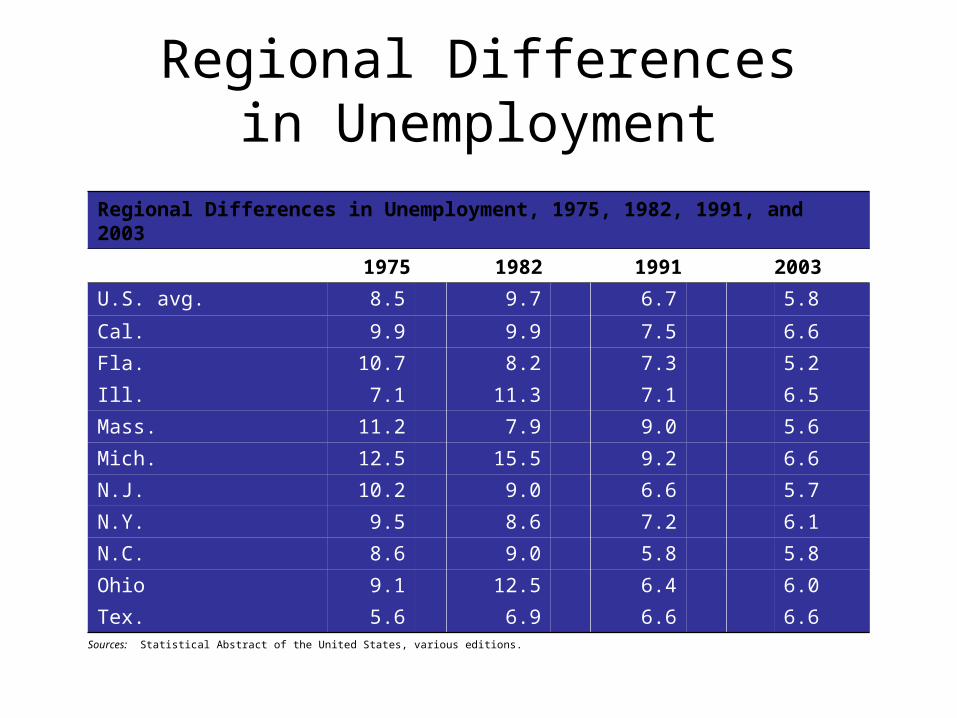
Regional Differencesin Unemployment
Regional Differences in Unemployment, 1975, 1982, 1991, and 2003
1975 1982 1991 2003
U.S. avg. 8.5 9.7 6.7 5.8
Cal. 9.9 9.9 7.5 6.6
Fla. 10.7 8.2 7.3 5.2
Ill. 7.1 11.3 7.1 6.5
Mass. 11.2 7.9 9.0 5.6
Mich. 12.5 15.5 9.2 6.6
N.J. 10.2 9.0 6.6 5.7
N.Y. 9.5 8.6 7.2 6.1
N.C. 8.6 9.0 5.8 5.8
Ohio 9.1 12.5 6.4 6.0
Tex. 5.6 6.9 6.6 6.6Sources: Statistical Abstract of the United States, various editions.
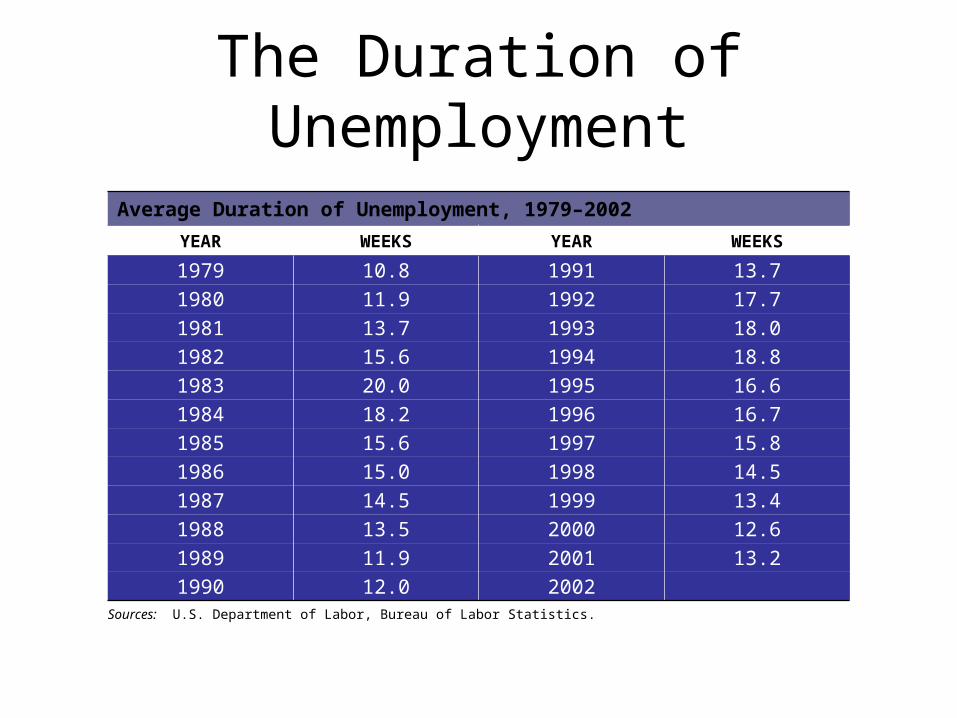
The Duration of Unemployment
Average Duration of Unemployment, 1979–2002
YEAR WEEKS YEAR WEEKS
1979 10.8 1991 13.71980 11.9 1992 17.71981 13.7 1993 18.01982 15.6 1994 18.81983 20.0 1995 16.61984 18.2 1996 16.71985 15.6 1997 15.81986 15.0 1998 14.51987 14.5 1999 13.41988 13.5 2000 12.61989 11.9 2001 13.21990 12.0 2002
Sources: U.S. Department of Labor, Bureau of Labor Statistics.
Current Data
• United States– The National Unemployment Rate for August 2009 is 9.7%.– http://stats.bls.gov/news.release/empsit.nr0.htm
• Industrialized Countries– http://www.stls.frb.org/publications/iet/– http://www.cia.gov/cia/publications/factbook/
Types of Unemployment
• Frictional unemployment is the portion of unemployment that is due to the normal working of the labor market; used to denote short-run job/skill matching problems.
Types of Unemployment
• Structural unemployment is the portion of unemployment that is due to changes in the structure of the economy that result in a significant loss of jobs in certain industries.– Geographical based mismatch– Skills based mismatch
Types of Unemployment
• Cyclical unemployment is the increase in unemployment that occurs during recessions and depressions.
Seasonal Unemployment
• Seasonal unemployment is caused by seasonal shifts in labor supply and demand– Examples: construction, agriculture,
Life Guards
Full Employment
• Full employment is the level of employment when there is no cyclical unemployment
• Full employment does not necessarily imply zero unemployment (due to frictional, structural, and seasonal unemployment)
• A 5-6% unemployment rate is considered full employment?
Types of Unemployment
• The natural rate of unemployment is the unemployment that occurs as a normal part of the functioning of the economy. Sometimes taken as the sum of frictional unemployment and structural unemployment.
Unemployment Insurance
• Temporary income provided to unemployed workers who actively seek employment and who meet other qualifications
• Research on UI
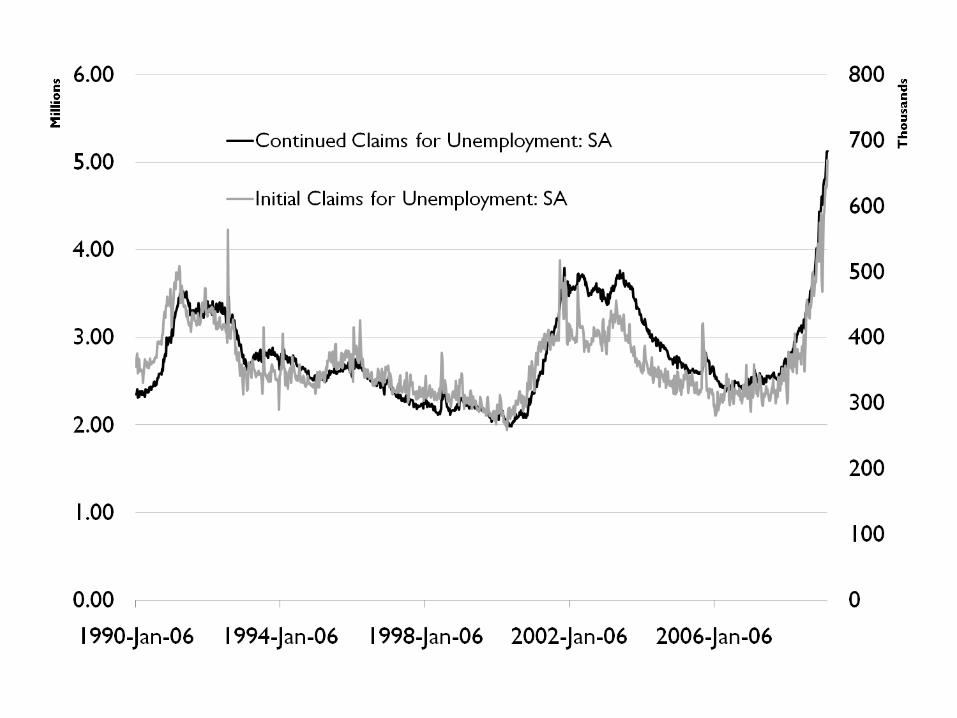
Problems with Official Unemployment Stats
• Sources of Understatement– Discouraged Workers– Underemployment
• Sources of Overstatement– Unemployment insurance– Welfare programs
• On Net we believe the official measure understates the problem
The Discouraged-Worker Effect
• The discouraged-worker effect lowers the unemployment rate.
• Discouraged workers are people who want to work but cannot find jobs.
Inflation
• Inflation Dating Exercise
Inflation
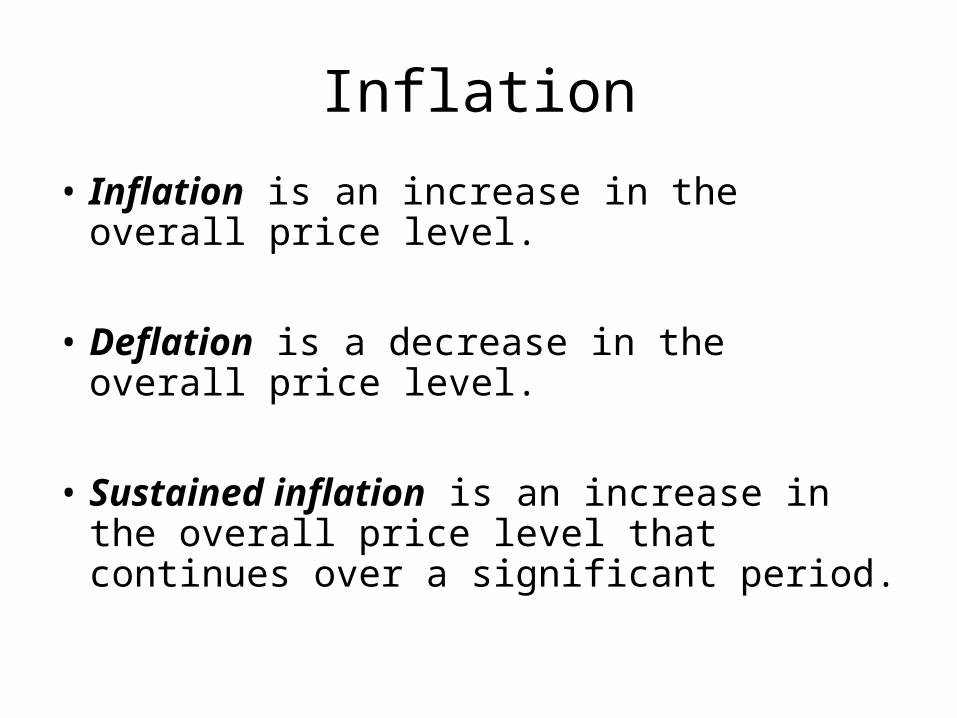
• Inflation is an increase in the overall price level.
• Deflation is a decrease in the overall price level.
• Sustained inflation is an increase in the overall price level that continues over a significant period.
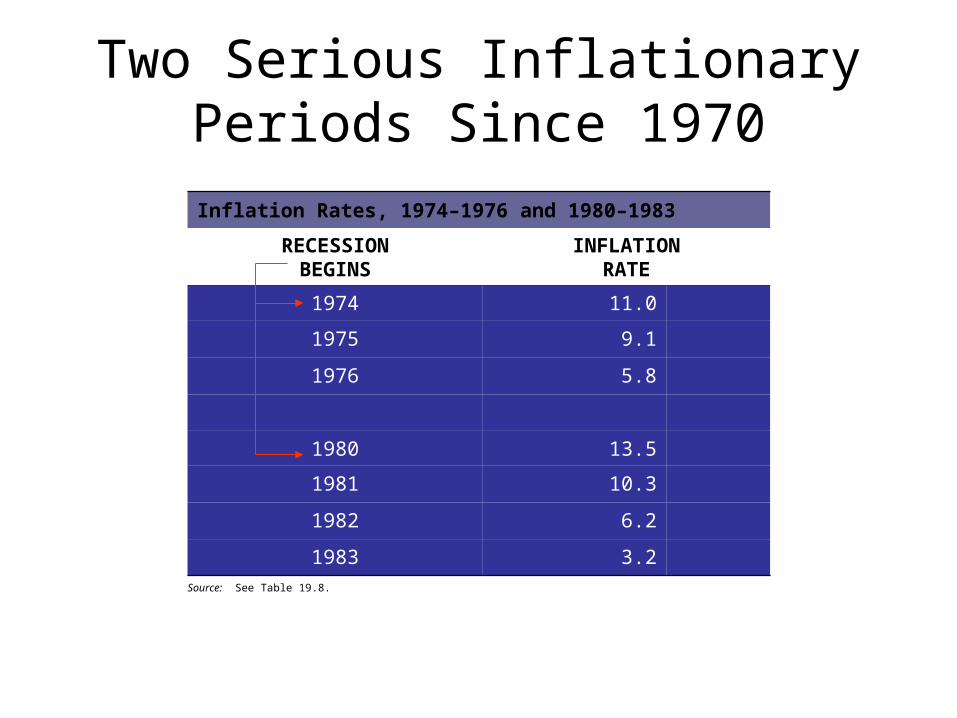
Two Serious InflationaryPeriods Since 1970
Inflation Rates, 1974–1976 and 1980–1983
RECESSIONBEGINS
INFLATIONRATE
1974 11.0
1975 9.1
1976 5.8
1980 13.5
1981 10.3
1982 6.2
1983 3.2Source: See Table 19.8.
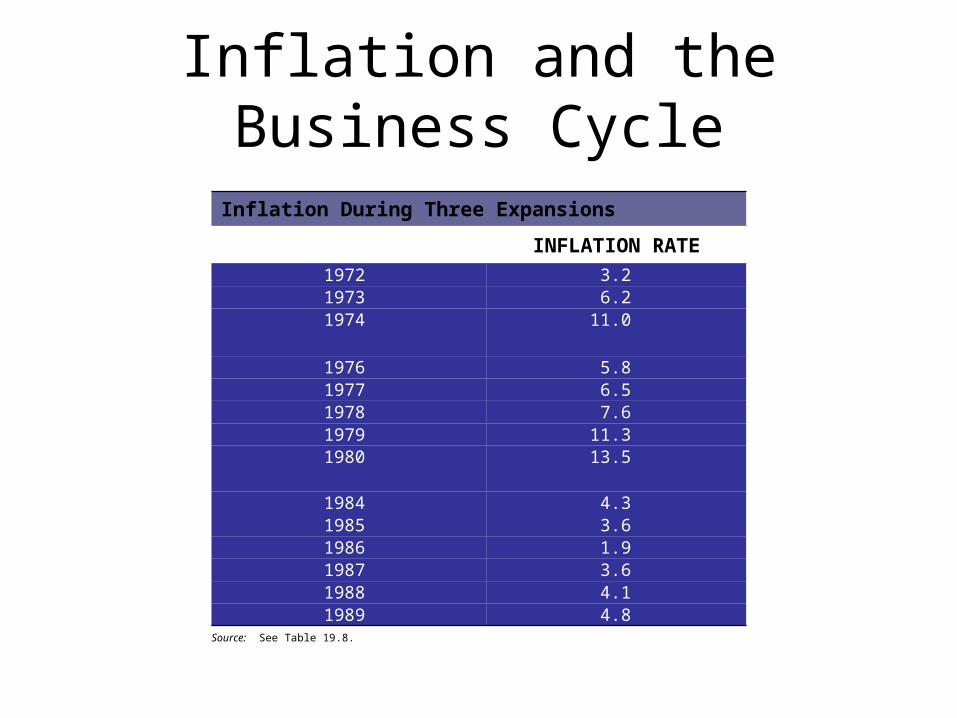
Inflation and the Business Cycle
Inflation During Three Expansions
INFLATION RATE1972 3.21973 6.21974 11.0
1976 5.81977 6.51978 7.61979 11.31980 13.5
1984 4.31985 3.61986 1.91987 3.61988 4.11989 4.8
Source: See Table 19.8.
The Benefits of Recessions
• Recessions may help to reduce inflation.
• Some argue that recessions may increase efficiency by driving the least efficient firms out of business and by forcing surviving firms to trim waste and manage their resources better.
• Also, a recession leads to a decrease in the demand for imports, which improves a nation’s balance of payments.
Cost of Living
• If you were offered a job in Minneapolis making $50,000 a year, and your boss here what to match the offer by providing you the same purchasing power here. What would you want to know about La Crosse and Minneapolis?
• If you were to guess how much less would your boss have to pay you to live here?
How do we Measure Inflation?
• Consumer Price Index– Bureau of Labor and Statistics (BLS)
• http://www.bls.gov• conduct surveys
• Producer Price Index
• GDP Deflator
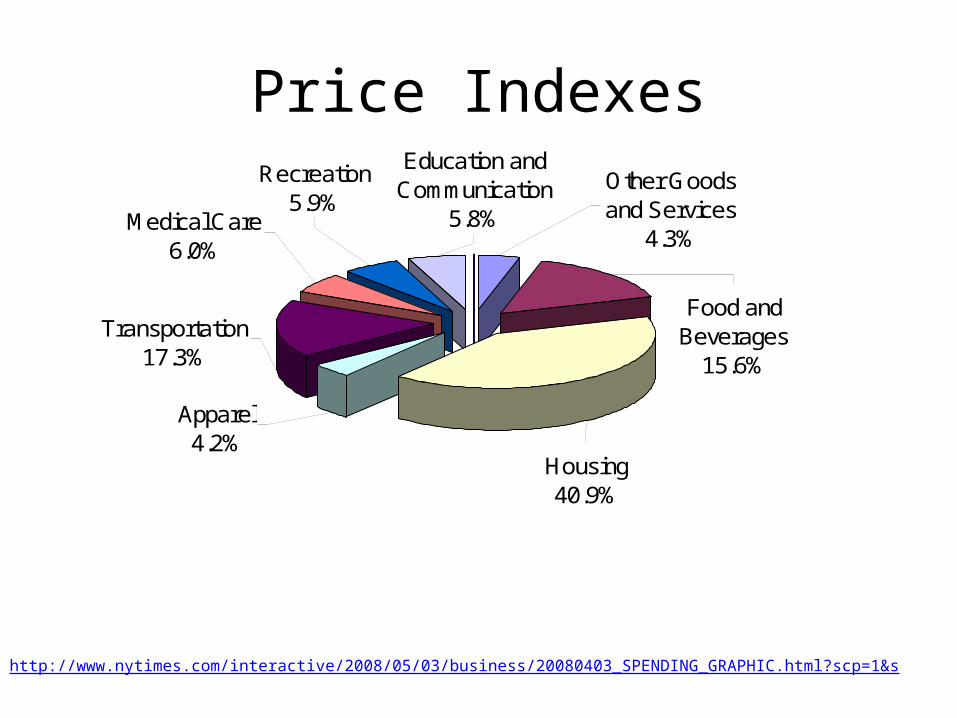
Price Indexes
Food and Beverages
15.6%
Other Goods and Services
4.3%
Apparel4.2%
Housing40.9%
Transportation17.3%
Medical Care6.0%
Education and Communication
5.8%
Recreation5.9%
http://www.nytimes.com/interactive/2008/05/03/business/20080403_SPENDING_GRAPHIC.html?scp=1&s
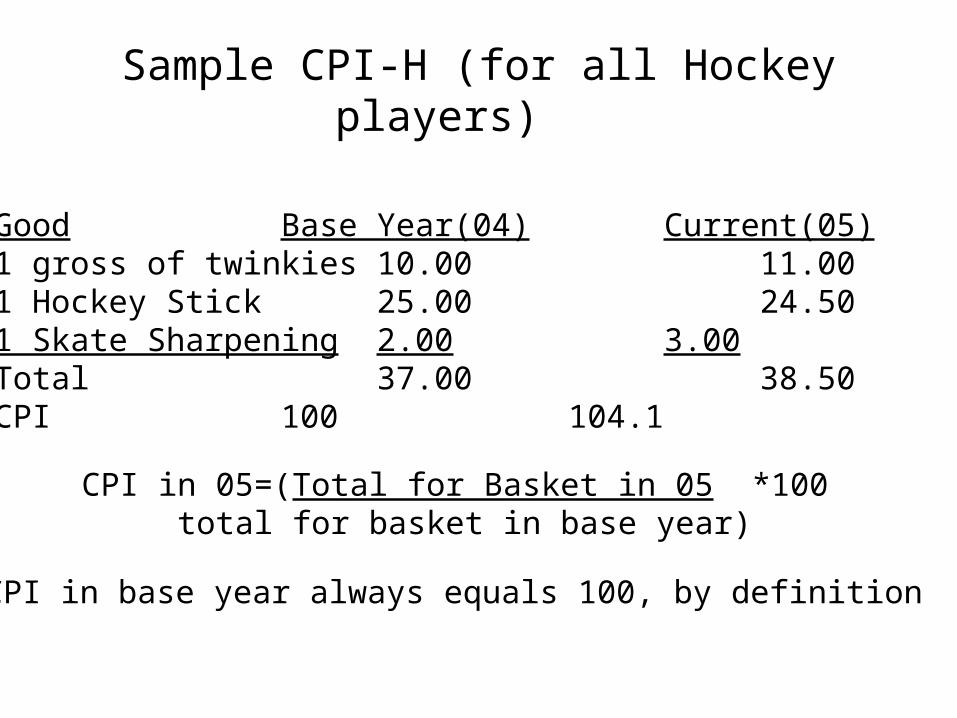
Sample CPI-H (for all Hockey players)
Good Base Year(04) Current(05)1 gross of twinkies 10.00 11.001 Hockey Stick 25.00 24.501 Skate Sharpening 2.00 3.00Total 37.00 38.50CPI 100 104.1
CPI in 05=(Total for Basket in 05 *100total for basket in base year)
CPI in base year always equals 100, by definition
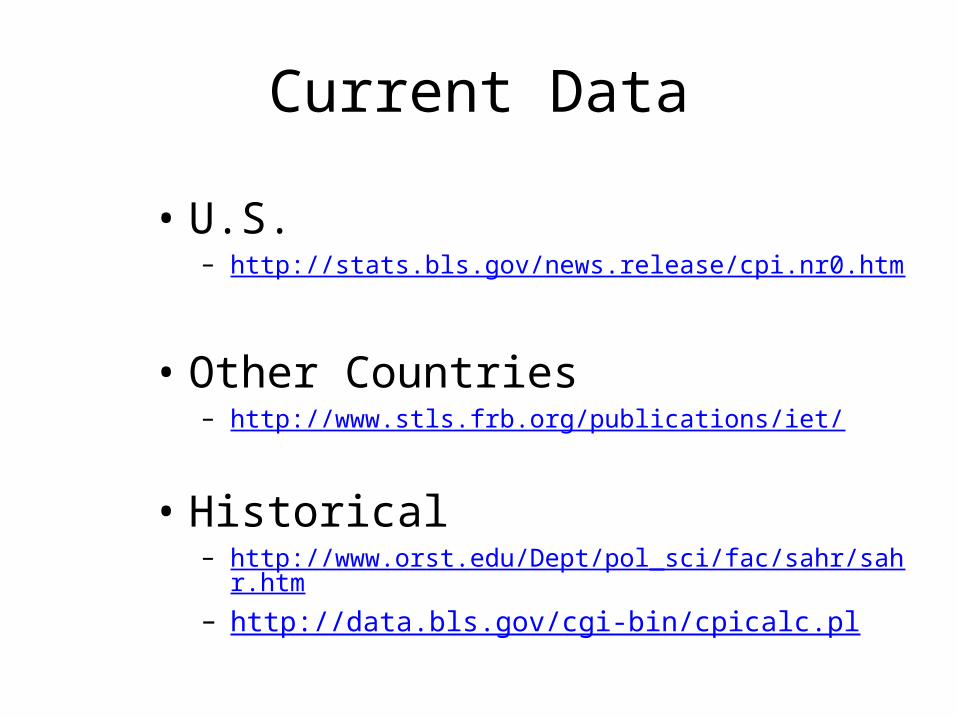
Current Data
• U.S.– http://stats.bls.gov/news.release/cpi.nr0.htm
• Other Countries– http://www.stls.frb.org/publications/iet/
• Historical– http://www.orst.edu/Dept/pol_sci/fac/sahr/sahr.htm– http://data.bls.gov/cgi-bin/cpicalc.pl
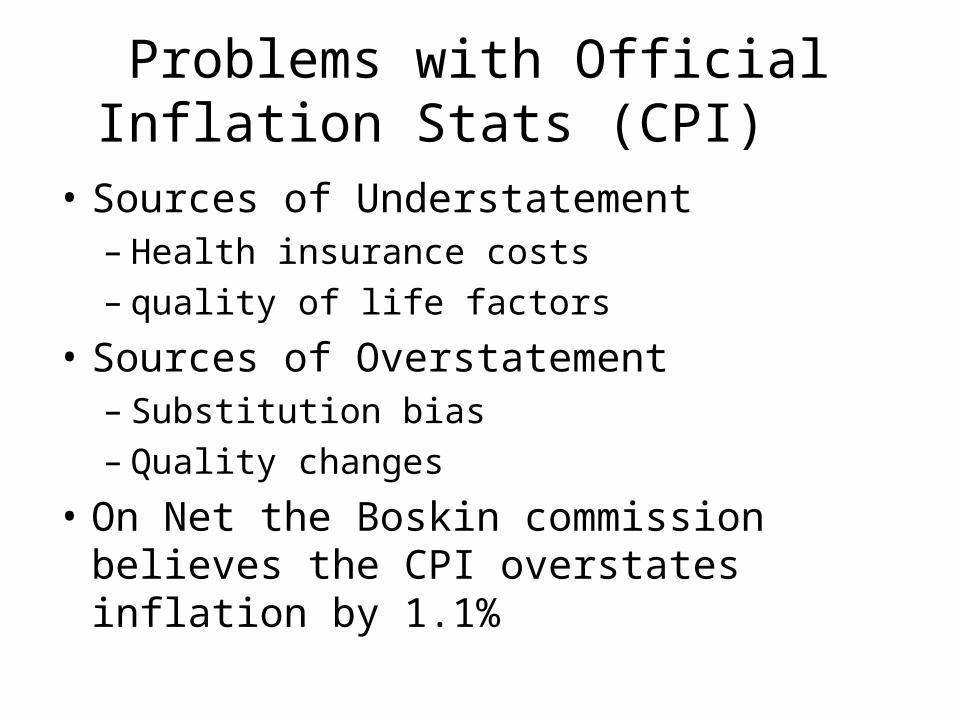
Problems with Official Inflation Stats (CPI)
• Sources of Understatement– Health insurance costs– quality of life factors
• Sources of Overstatement– Substitution bias– Quality changes
• On Net the Boskin commission believes the CPI overstates inflation by 1.1%
Why is Inflation So Unpopular?
• As an economic problem, inflation is widespread since it affects everyone
• Workers’ wages may not keep up with inflation
• Those on fixed incomes are seriously affected
• Long-term contracts are difficult to negotiate
• Menu Costs
Inflation Costs
• Inflation redistributes income and wealth
• Inflation increases transactions costs– (shoe leather costs)
• Inflation increases uncertainty– Hard to distinguish between relative price changes
The Costs of Inflation
• Unanticipated inflation—an inflation that takes people by surprise—can hurt creditors.
• Inflation that is higher than expected benefits debtors; inflation that is lower than expected benefits creditors.
• The real interest rate is the difference between the interest rate on a loan and the inflation rate.
Inflation and Interest Rates
• Inflation creates a difference between real and nominal interest rates
• Real rate = nominal rate - inflation rate
• Inflation risk makes some lenders offer adjustable-rate home loans
enr
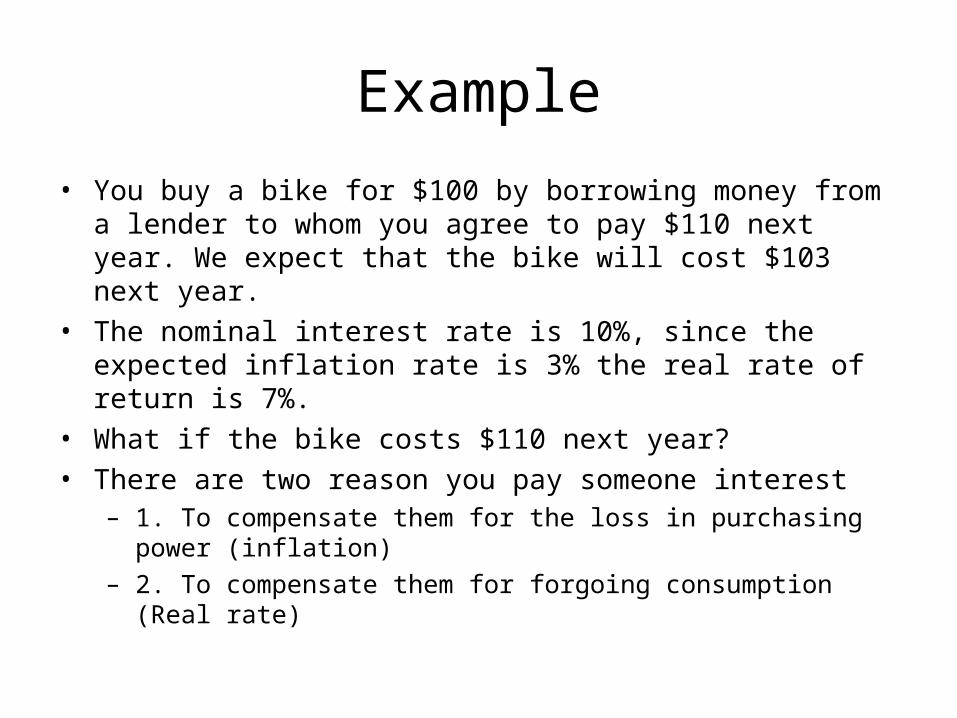
Example• You buy a bike for $100 by borrowing money from a lender to whom
you agree to pay $110 next year. We expect that the bike will cost $103 next year.
• The nominal interest rate is 10%, since the expected inflation rate is 3% the real rate of return is 7%.
• What if the bike costs $110 next year?• There are two reason you pay someone interest
– 1. To compensate them for the loss in purchasing power (inflation)– 2. To compensate them for forgoing consumption (Real rate)
What is the optimal inflation rate?
• Low vs. high inflation
• Stable vs. variable inflation
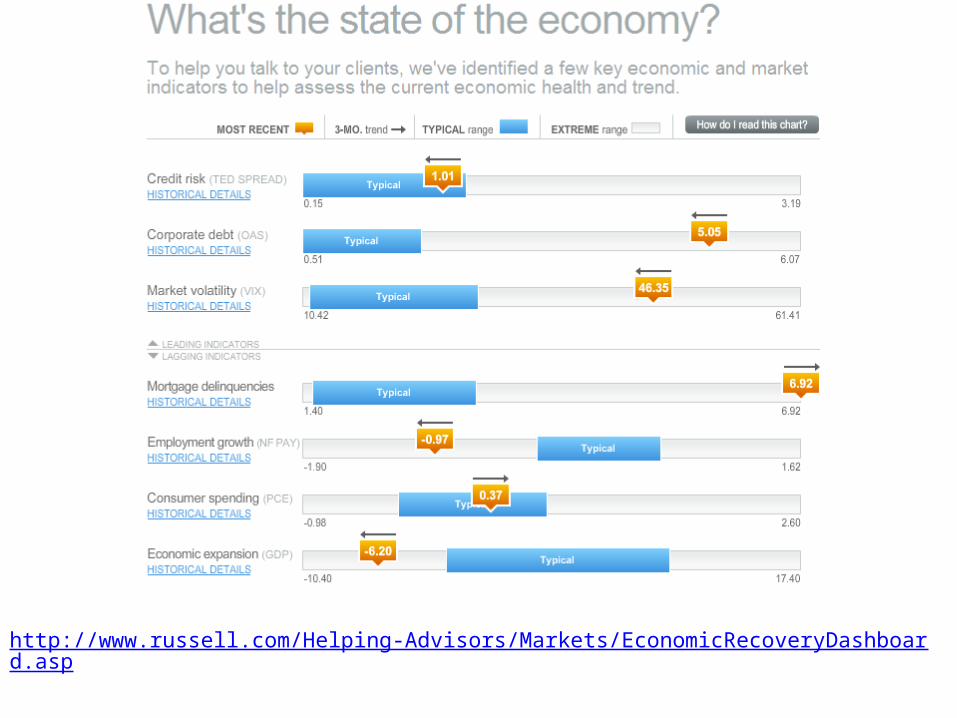
http://www.russell.com/Helping-Advisors/Markets/EconomicRecoveryDashboard.asp

http://www.google.com/finance/domestic_trends

Appendix
• Slides after this point will most likely not be covered in class. However they may contain useful definitions, or further elaborate on important concepts, particularly materials covered in the text book.
• They may contain examples I’ve used in the past, or slides I just don’t want to delete as I may use them in the future.
Review Terms and Concepts
consumer price index (CPI)consumer price index (CPI)
cyclical unemploymentcyclical unemployment
deflationdeflation
depressiondepression
discouraged-worker effectdiscouraged-worker effect
employedemployed
frictional unemploymentfrictional unemployment
inflationinflation
labor forcelabor force
labor-force participation ratelabor-force participation rate
natural rate of unemploymentnatural rate of unemployment
not in the labor forcenot in the labor force
producer price indexes (PPIs)producer price indexes (PPIs)
real interest ratereal interest rate
recessionrecession
structural unemploymentstructural unemployment
sustained inflationsustained inflation
unemployedunemployed
unemployment rateunemployment rate
The Labor Force Participation Rate
• The proportion of adults who are in the labor force
• The civilian unemployment rate is the unemployment rate calculated excluding the military from the labor force
Some Employment Facts
• Today 60% of working-age women are in the work force, compared to 40% three decades ago
• Unemployment rates are significantly higher among blacks and teenagers
• Recent employment statistics place unemployment duration at an average of 19.0 weeks with a median of 9.4
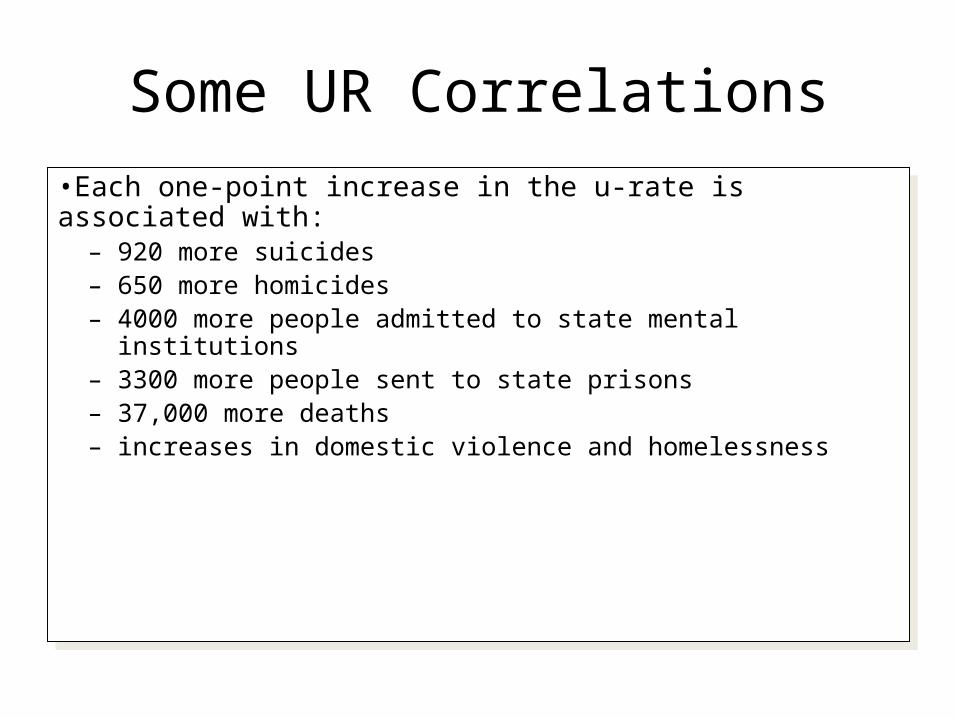
Some UR Correlations
•Each one-point increase in the u-rate is associated with:– 920 more suicides– 650 more homicides– 4000 more people admitted to state mental institutions– 3300 more people sent to state prisons– 37,000 more deaths– increases in domestic violence and homelessness
•Each one-point increase in the u-rate is associated with:– 920 more suicides– 650 more homicides– 4000 more people admitted to state mental institutions– 3300 more people sent to state prisons– 37,000 more deaths– increases in domestic violence and homelessness
Price Indexes
• The consumer price index (CPI) is the most popular fixed-weight price index.
• One version of the CPI is the “Chained Consumer Price Index,” which uses changing weights.
• The CPI differs from the GDP deflator in important ways.
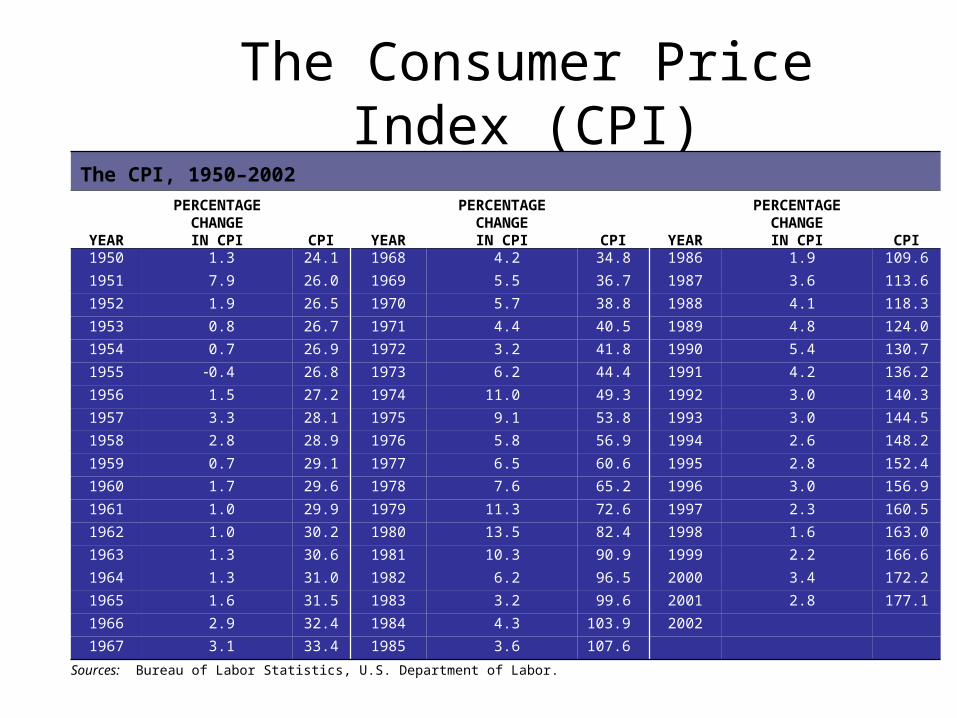
The Consumer Price Index (CPI)The CPI, 1950–2002
YEAR
PERCENTAGECHANGEIN CPI CPI YEAR
PERCENTAGECHANGEIN CPI CPI YEAR
PERCENTAGECHANGEIN CPI CPI
1950 1.3 24.1 1968 4.2 34.8 1986 1.9 109.6
1951 7.9 26.0 1969 5.5 36.7 1987 3.6 113.6
1952 1.9 26.5 1970 5.7 38.8 1988 4.1 118.3
1953 0.8 26.7 1971 4.4 40.5 1989 4.8 124.0
1954 0.7 26.9 1972 3.2 41.8 1990 5.4 130.7
1955 0.4 26.8 1973 6.2 44.4 1991 4.2 136.2
1956 1.5 27.2 1974 11.0 49.3 1992 3.0 140.3
1957 3.3 28.1 1975 9.1 53.8 1993 3.0 144.5
1958 2.8 28.9 1976 5.8 56.9 1994 2.6 148.2
1959 0.7 29.1 1977 6.5 60.6 1995 2.8 152.4
1960 1.7 29.6 1978 7.6 65.2 1996 3.0 156.9
1961 1.0 29.9 1979 11.3 72.6 1997 2.3 160.5
1962 1.0 30.2 1980 13.5 82.4 1998 1.6 163.0
1963 1.3 30.6 1981 10.3 90.9 1999 2.2 166.6
1964 1.3 31.0 1982 6.2 96.5 2000 3.4 172.2
1965 1.6 31.5 1983 3.2 99.6 2001 2.8 177.1
1966 2.9 32.4 1984 4.3 103.9 2002
1967 3.1 33.4 1985 3.6 107.6
Sources: Bureau of Labor Statistics, U.S. Department of Labor.
Recessions, Depressions,and Unemployment
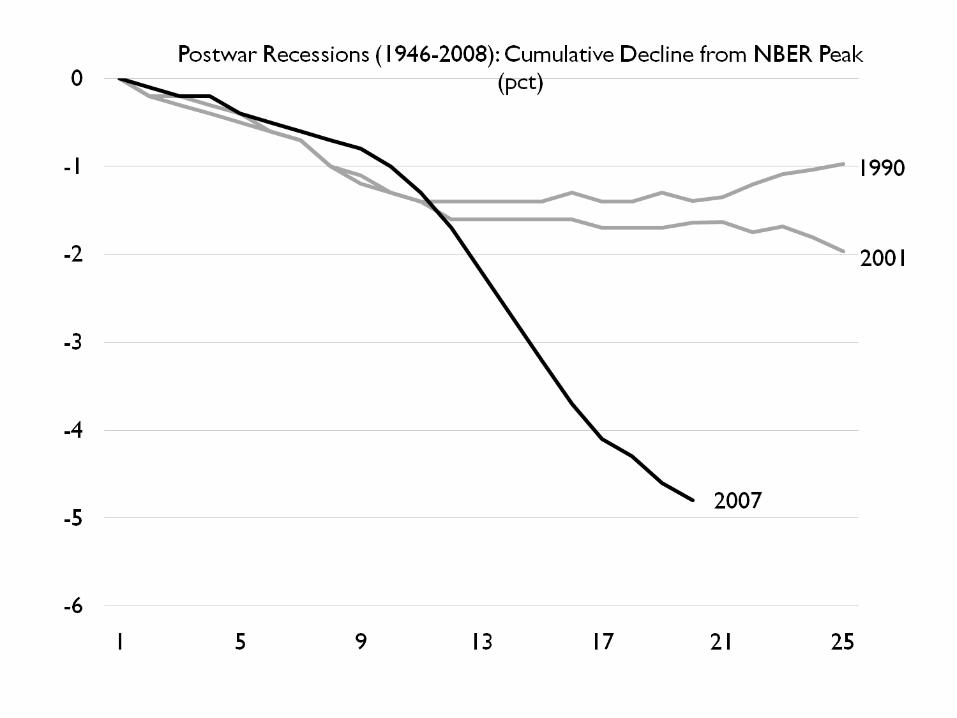
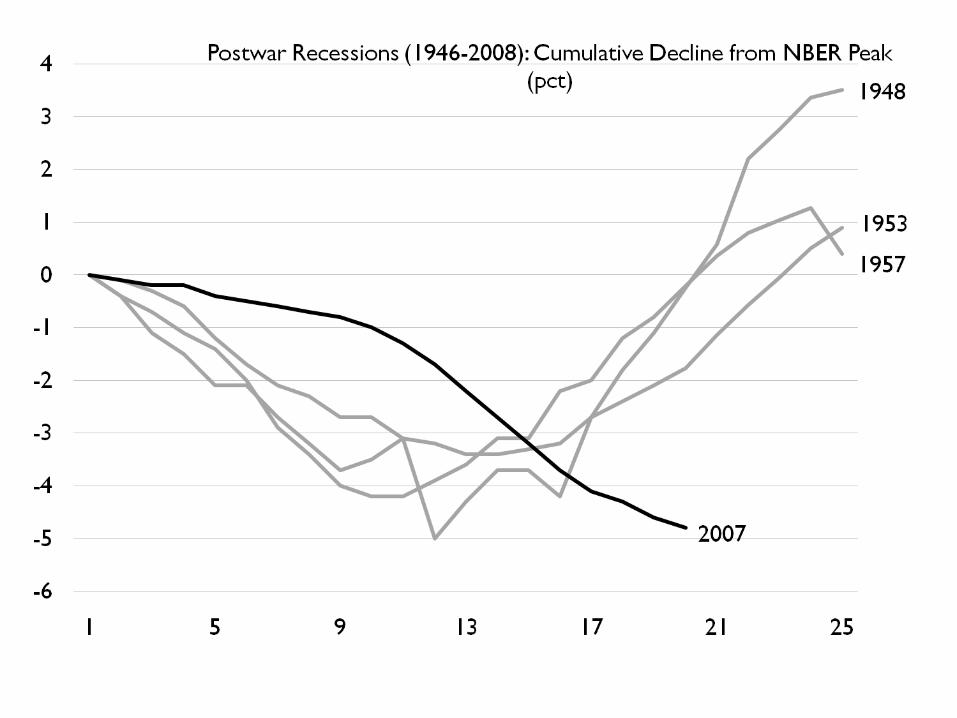
• The business cycle describes the periodic ups and downs in the economy, or deviations of output and employment away from the long-run trend.
• A recession is roughly a period in which real GDP declines for at least two consecutive quarters. It is marked by falling output and rising unemployment.
Recessions, Depressions,and Unemployment
• A depression is a prolonged and deep recession. The precise definitions of prolonged and deep are debatable.
• Capacity utilization rates, which show the percentage of factory capacity being used in production, are one indicator of a recession.
Price Indexes
• Price indexes are used to measure overall price levels. The price index that pertains to all goods and services in the economy is the GDP deflator.
• The consumer price index (CPI) is a price index computed each month by the Bureau of Labor Statistics using a bundle that is meant to represent the “market basket” purchased monthly by the typical urban consumer.
Price Indexes
• Other popular price indexes are producer price indexes (PPIs), which measure price changes for products at all stages in the production process.
• The three main categories are:
– finished goods,– intermediate materials, and– crude materials.
Long-Run and Short-Run Concerns
Growth, Productivity, Unemployment, and Inflation
Long-Run Outputand Productivity Growth
• An ideal economy is one in which there is:– rapid growth of output per worker,– low unemployment, and– low inflation.
Long-Run Outputand Productivity Growth
• The average growth rate of output in the economy since 1900 has been about 3.4 percent per year.
• An area of economics called “growth theory” is concerned with the question of what determines this rate.
Long-Run Outputand Productivity Growth
• There are a number of ways to increase output. An economy can:– Add more workers– Add more machines– Increase the length of the workweek– Increase the quality of the workers– Increase the quality of the machines
Long-Run Outputand Productivity Growth
• Output per worker hour is called “labor productivity.”
• For the 1952-2000 period, labor productivity exhibits:– an upward trend, and– fairly sizable fluctuations around that trend.
• The growth rate was much higher in the 1950s and 1960s than it has been since the early 1970s.
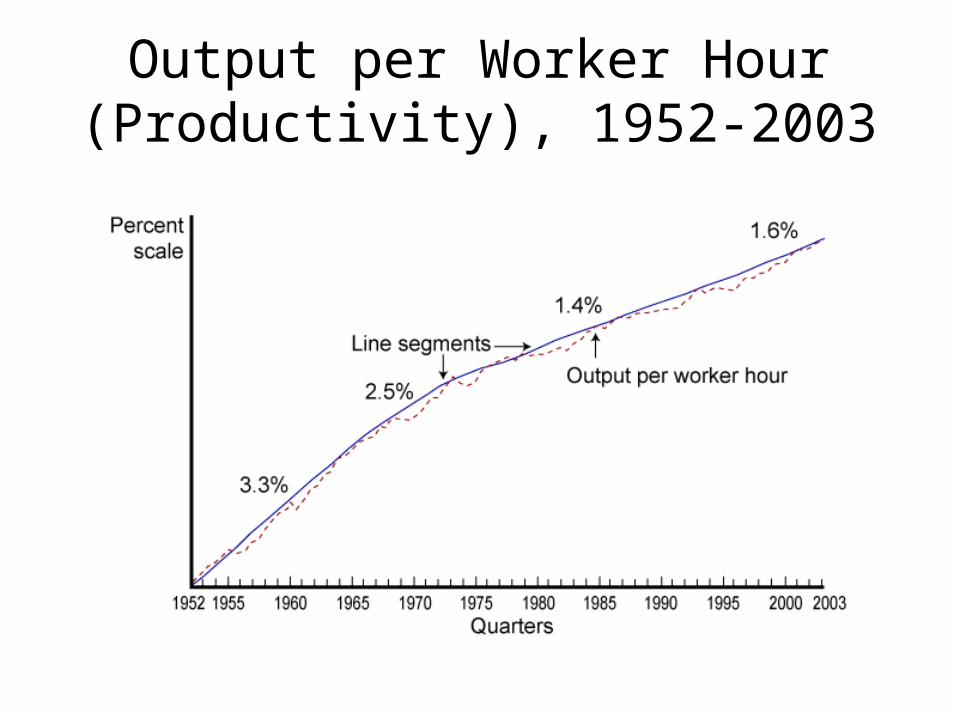
Output per Worker Hour(Productivity), 1952-2003
Long-Run Outputand Productivity Growth
• Part of the reason for the upward trend in productivity is an increase in the amount of capital per worker. With more capital per worker, more output can be produced per year.
• The other reason productivity has increased is that the quality of labor and capital has been increasing.
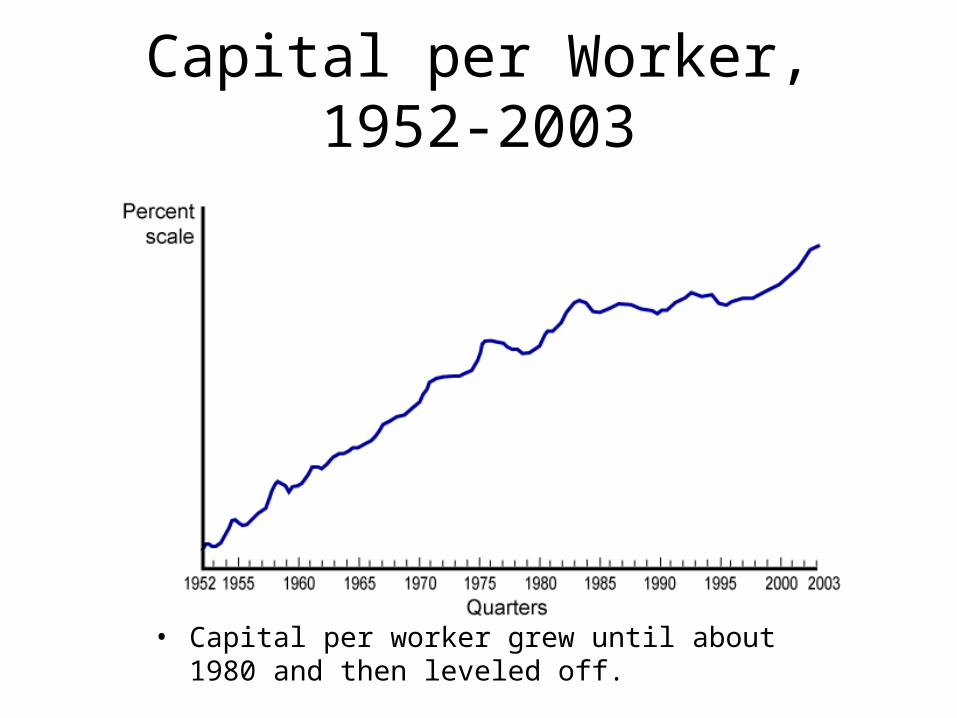
Capital per Worker, 1952-2003
• Capital per worker grew until about 1980 and then leveled off.
Long-Run Outputand Productivity Growth
• A harder question to answer is why has productivity grown more slowly since the early 1970s.
• The growth of the Internet, which brings about an increase in the quality of capital, should lead to a “new age” of productivity growth.
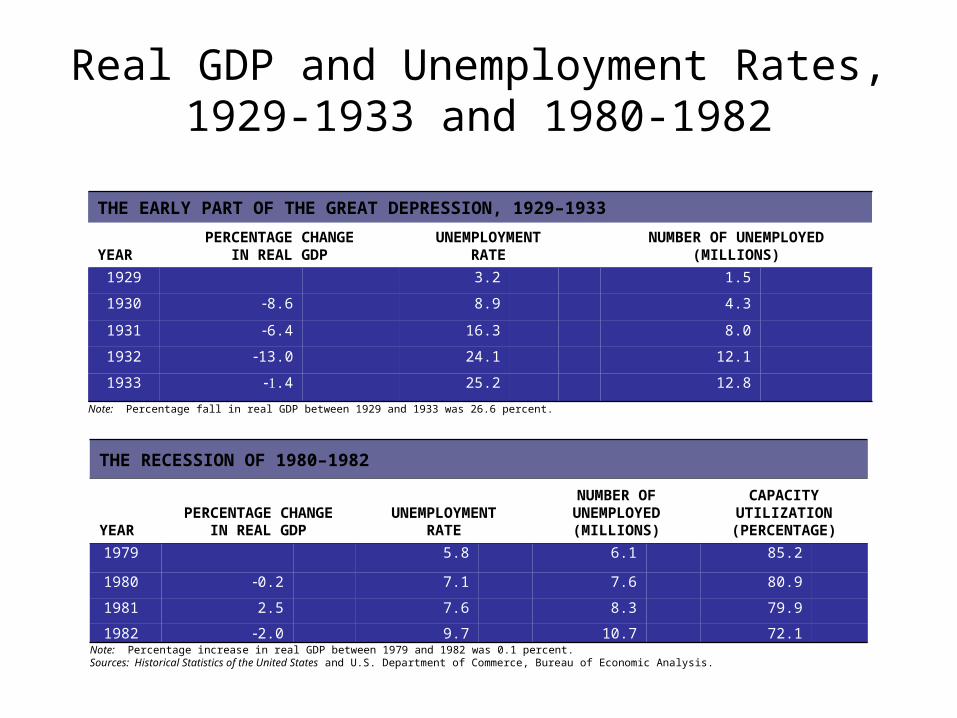
Real GDP and Unemployment Rates,1929-1933 and 1980-1982
THE EARLY PART OF THE GREAT DEPRESSION, 1929–1933
YEARPERCENTAGE CHANGE
IN REAL GDPUNEMPLOYMENT
RATENUMBER OF UNEMPLOYED
(MILLIONS)
1929 3.2 1.5
1930 8.6 8.9 4.3
1931 6.4 16.3 8.0
1932 13.0 24.1 12.1
1933 .4 25.2 12.8
Note: Percentage fall in real GDP between 1929 and 1933 was 26.6 percent.
THE RECESSION OF 1980–1982
YEAR
PERCENTAGE CHANGE
IN REAL GDPUNEMPLOYMENT
RATE
NUMBER OFUNEMPLOYED
(MILLIONS)
CAPACITYUTILIZATION
(PERCENTAGE)
1979 5.8 6.1 85.2
1980 0.2 7.1 7.6 80.9
1981 2.5 7.6 8.3 79.9
1982 2.0 9.7 10.7 72.1Note: Percentage increase in real GDP between 1979 and 1982 was 0.1 percent.Sources: Historical Statistics of the United States and U.S. Department of Commerce, Bureau of Economic Analysis.