Embed Size (px)
Citation preview

ABSTRACT
Title of Document: THE IMPACT OF HIGHER EDUCATION ON POLICE OFFICER ATTITUDES REGARDING ABUSE OF AUTHORITY
Cody Webb Telep, Master of Arts, 2008 Directed By: Professor David Weisburd
Department of Criminology and Criminal Justice
This study examines whether officers who receive a college education (four-year
degree) prior to entry into the police service have attitudes that are less supportive of the
abuse of police authority. This research also explores whether level of higher education
and the timing of degree completion alter this potential attitudinal impact of a bachelor’s
degree. Using data from a nationally representative survey sample, I find that officers
with a pre-service bachelor’s degree hold attitudes that are less supportive of abuse of
authority. These effects remain regardless of when officers receive their degree and
across varying levels of higher education (i.e. associate’s degree, attending some
college). Postsecondary education does not have a statistically significant impact on
officer ratings of the seriousness of hypothetical abuse of authority scenarios. These
findings suggest that higher education has some beneficial impacts for policing, although
these benefits are not only associated with completing a four-year degree.

THE IMPACT OF HIGHER EDUCATION ON POLICE OFFICER ATTITUDES REGARDING ABUSE OF AUTHORITY
By
Cody Webb Telep
Thesis submitted to the Faculty of the Graduate School of the University of Maryland, College Park, in partial fulfillment
of the requirements for the degree of Master of Arts
2008 Advisory Committee: Professor David Weisburd, Chair Professor Jean M. McGloin Professor Charles F. Wellford

© Copyright by Cody Webb Telep
2008
ii
ACKNOWLEDGMENTS
I would like to thank the members of my advisory committee, Professor David
Weisburd, Professor Jean McGloin, and Professor Charles Wellford, for all of their
assistance, suggestions, and feedback. I also want to thank Professor Weisburd for
providing me access to the Police Foundation dataset. In addition, I thank Professor
Laura Dugan and Professor David Kirk for their help in the early stages of this thesis.
Thank you also to Ráchael Wyckoff, Melissa Rorie, and Amber Stoesser for their
invaluable support throughout the master’s process. Finally, I want to thank the South
Campus Commons Shop for being a constant source of fountain soda and caffeine.

iii
TABLE OF CONTENTS
ACKNOWLEDGMENTS .............................................................................................. ii TABLE OF CONTENTS............................................................................................... iii LIST OF TABLES......................................................................................................... iv LIST OF FIGURES ........................................................................................................ v
CHAPTER I: RESEARCH GOALS AND OBJECTIVES ............................................... 1 CHAPTER II: REVIEW OF RELEVANT LITERATURE .............................................. 4
Police Abuse of Authority .......................................................................................... 4 The Importance of College Education ........................................................................ 5 College Education and Policing.................................................................................. 9 College Education and Police Use of Force ............................................................. 12 Police Attitudes and Use of Force ............................................................................ 17 Limitations of Prior Research ................................................................................... 22
HYPOTHESES............................................................................................................. 24
CHAPTER III: DATA AND METHODS ....................................................................... 26 Description of the Data ............................................................................................. 26 Sampling Procedure .................................................................................................. 28
RESEARCH METHODOLOGY.................................................................................. 29 Dependent Variables................................................................................................. 29 Main Independent Variable....................................................................................... 37 Control Variables ...................................................................................................... 41 Additional Statistical Procedures.............................................................................. 46
CHAPTER IV: RESULTS............................................................................................... 50 CHAPTER V: DISCUSSION.......................................................................................... 64
Implications for Policy and Practice ......................................................................... 69 Limitations of the Study and Future Research.......................................................... 71 Conclusions............................................................................................................... 74
APPENDICES .................................................................................................................. 75 APPENDIX A: AUTHORITY SCALE QUESTIONS................................................. 75 APPENDIX B: FULL-TEXT OF SCENARIOS .......................................................... 76 APPENDIX C: DESCRIPTIVE STATISTICS ............................................................ 77 APPENDIX D: MISSING DATA ANALYSIS ........................................................... 80
REFERENCES ................................................................................................................. 81

iv
LIST OF TABLES
Table 1: Component loadings for principal components analysis of scenario questions . 35 Table 2: OLS results for testing the impact of an officer earning at least a pre-service bachelor’s degree on the authority scale........................................................................... 52 Table 3: OLS results for testing the impact of an officer earning at least a pre-service bachelor’s degree on the scenario component .................................................................. 54 Table 4: OLS results for testing the impact of an officer earning at least a bachelor’s degree (either pre-service or while an officer) on the authority scale .............................. 56 Table 5: OLS results for testing the impact of an officer earning at least a bachelor’s degree (either pre-service or while an officer) on the scenario component...................... 57 Table 6: OLS results for testing the impact of varying pre-service, postsecondary education levels on the authority scale ............................................................................. 59 Table 7: OLS results for testing the impact of various pre-service, postsecondary education levels on the scenario component..................................................................... 60 Table 8: OLS results for testing the impact of various current, postsecondary education levels on the authority scale.............................................................................................. 62 Table 9: OLS results for testing the impact of various current, postsecondary education levels on the scenario component ..................................................................................... 62

v
LIST OF FIGURES
Figure 1: Distribution of authority scale scores…..……….……………………………..32 Figure 2: Distribution of scenario component scores……..…………………….……….36

1
CHAPTER I: RESEARCH GOALS AND OBJECTIVES
Scholars have frequently emphasized education and the obtainment of a four-year
college degree, in particular, as a means of improving police attitudes and performance
(Roberg & Bonn, 2004). Unfortunately, empirical research on the impact of education
has been limited, weak methodologically, and often contradictory. The Committee to
Review Research on Police Policy and Practices (National Research Council, 2004: 141)
found “the available evidence inadequate to make recommendations regarding the
desirability of higher education for improving police practice.” One area where research
has been particularly limited and postsecondary education could have an impact is police
abuse of authority. If a college education makes officers more receptive to serving the
community, more ethical and moral, and more tolerant, as predicted (Carter & Sapp,
1990; Goldstein, 1977), then college-educated officers would be expected to be less
supportive of the abuse of police authority and more supportive of following proper rules
and regulations. This research will attempt to answer key research questions about the
relationship between police officer level of education and attitudes and beliefs about
police abuse of authority. First, does officer higher education have a differential impact
on beliefs and attitudes regarding abuse of authority and abuse of force? Second, do
these attitudes have an impact on predicted behaviors in hypothetical situations? For
example, do officers with a higher level of education recognize questionable officer
tactics described in scenarios as more serious situations that require intervention? Third,
if higher education does have an impact on attitudes, does this impact only appear when
an officer has acquired at least a bachelor’s (four-year) degree. Fourth, if college
education does have an impact on attitudes, does this impact only appear when an officer

2
obtains a bachelor’s degree prior to hiring? Factors that may impact police use of force
are important to consider. Worden (1996: 46) makes the point that even though police
rarely abuse authority, deaths from commercial airline flights are equally infrequent. The
rarity, however, does not mean that research should not examine how to make these
incidents even more scarce.
To complete these objectives, this study uses data from a 1998 Police Foundation
survey (Weisburd et al., 2001) to assess the impact a college education has on officer
beliefs and attitudes regarding police use of force and abuse of authority. The data have
the major advantage of being one of the few nationally representative samples of officers
and the only to examine police use of authority. Although using excessive force is just
one way police officers can abuse their authority, most of the questions asked of officers
in this survey focus specifically on the use of physical force against suspects or other
civilians. Thus, I use the terms “excessive use of force” and “abuse of authority” nearly
interchangeably throughout the rest of this study, while recognizing that this study does
not explicitly address all possible abuses of police authority. I will use multiple
regression methods to examine two different outcomes. First, I will construct an
authority scale that combines four factors to examine: whether officers with a pre-service
four-year degree (or higher) are less supportive of 1) police abuse of authority, 2) the
code of silence, 3) violating departmental rules, and 4) calls for reduced attention to
police brutality. Second, I will analyze officer responses to hypothetical situations to
determine whether these officers recognize abuse of authority scenarios as more serious
situations that require intervention. Multiple individual level officer attributes (e.g. race,

3
gender, years of experience) and departmental level (size, location) controls will be
included in the final model, in addition to an educational achievement indicator.
The next chapter reviews the literature related to education and police abuse of
authority including a general description of police deviance, background information on
college education and policing, and studies that have examined issues specifically related
to the impact higher education has on use of force and abuse of authority. I then list the
hypotheses of the present study. The third chapter describes the dataset used for analysis,
includes a description of the independent, dependent, and control variables, and outlines
the statistical methodology for analysis. In chapter four, I present the results of the
analyses. Chapter five includes a discussion of these results, implications of the findings,
limitations of the study, and concluding remarks.

4
CHAPTER II: REVIEW OF RELEVANT LITERATURE
Police Abuse of Authority
Police deviant activity can take multiple forms. Barker and Carter (1994)
separate police deviance into two subsections: occupational deviance, which includes
corruption, sleeping on the job, and accepting bribes, and abuse of authority, the focus of
the present study. Barker and Carter (1994: 7) define police abuse of authority as, “any
action by a police officer without regard to motive, intent, or malice that tends to injure,
insult, trespass upon human dignity, manifest feelings of inferiority, and/or violate an
inherent legal right of a member of the police constituency in the course of performing
‘police work.’” They divide abuse of authority into three distinct areas. First, officers
can abuse their authority by using excessive force or engaging in brutality. Second,
officers can discriminate or abuse their authority through verbal attacks. Finally, officers
can engage in legal abuse by violating the constitutional rights of citizens. For example,
an illegal search would constitute legal abuse. The ability to use coercive force is a
distinguishing characteristic of the police (Klockars, 1985), which makes the study of
how this force can be used improperly an important arena for research. The questions in
the data used in this study pertain mostly to physical abuse and excessive use of force;
thus, the focus of most of the subsequent research reviewed will be physical abuse of
authority.
Researchers usually provide three different kinds of explanations for the causes of
police use of force and abuse of authority: psychological, sociological, and
organizational (Terrill, 2001; Worden & Catlin, 2002). Sociological explanations focus
on situational factors that influence the decision to engage in force or abusive behavior,

5
organizational factors focus on police culture and departmental policies and
administration, and psychological research focuses on officer characteristics and
outlooks. Because the present study is focused on officer postsecondary educational
attainment and attitudes, the psychological perspective is most relevant. The research
specifically examining the impact of higher education on attitudes or behaviors related to
the use of force will be detailed later in the chapter. First, it is necessary to explore
theoretically why college education is expected to be important.
The Importance of College Education
In researching the impact higher education has on policing, this study first will
explore the mechanism potentially linking college education to attitudinal change. Emile
Durkheim’s works are some of the most prominent for assessing the value of education.
Durkheim (1956: 72) stressed that education is a necessity for promoting a moral society,
and as he notes education “creates in man a new being.” The educational process is not
important just for the individual, but in essence, it allows society to continue, because
students are taught to instill the culture and values of society. For Durkheim (1961),
morality is composed of three elements: discipline, which consists of consistent conduct
and responding to authority; attachment to the group, which implies actions are oriented
towards the good of society; and autonomy, which suggests individuals must act with
knowledge of the consequences of different actions. These aspects of morality are
closely related to the issue in this study. If college education does instill morality, we
would expect more educated officers to have attitudes supportive of consistently lawful
conduct that does not violate departmental or legal standards. A moral education is
particularly relevant to policing, because officers have a great deal of discretion that

6
forces them to act autonomously, but in ways that benefit and protect the general public.
The broad nature of bachelor’s degree programs should also be beneficial. Specialized,
technical education, like the police academy, may not provide an individual the means to
adequately deal with “human issues outside his professional pale” (Lear, 1961: 201). As
Durkheim (1956: 137) notes in regards to proficiency in a specialized area, “the same
mind may be free on one point, while on another it remains in servitude.” A college
education has the potential to free the entire mind, and thus produce police officers better
able to deal with the various interpersonal situations that cannot be adequately covered in
a training academy.
Durkheim’s writing provides a theoretical base, but he was not writing
specifically about a college education, so it is also important to consider theoretical and
empirical research in the field of education to understand if and how a college education
makes a difference. Pascarella and Terenzini (1991, 2005) have completed two extensive
reviews of the higher education literature, focusing particularly on the impact of college.
Their work guides this examination of the education literature. A lengthy review of the
theories of educational change is beyond the scope of this study, but to generalize,
developmental theories in education tend to focus on how change occurs and what
changes are occurring as a result of the college experience (Pascarella & Terenzini,
2005). This theoretical framework sees college as a key stage in the development of the
self and “several theories take the view that growth in self-awareness during the college
years and the emergent understanding of an appreciation for the roles of other people and
obligations to them are central features of development” (Pascarella & Terenzini, 2005:
48). Feldman and Newcomb (1994) echo this idea of a new conception of self, viewing

7
the college experience as a re-socialization process brought upon by the diversity of new
ideas, new friends, and new beliefs that cause individuals to become more cognizant and
concerned about the world around them. Thus, the college experience helps serve as a
means of learning how to effectively interact with others.
Empirical assessments have found positive impacts of higher education that could
be potentially related to less favorable attitudes towards abuse of authority for college-
educated police officers. Research has found that attaining a college degree is associated
with more humanistic values (Pascarella & Terenzini, 2005). These include more liberal
attitudes towards ending inequality, greater political and social tolerance, and reductions
in racial prejudice (Astin, 1977; Nichols, 1967). Acquiring a college degree is also
associated with beliefs and behaviors related to morality. Pascarella and Terenzini
(2005) conclude that college has a positive net impact on principled moral reasoning.
Principled moral reasoning comes from the work of Kohlberg (1981, 1984), and is a
three-level process. Individuals move from being pre-conventional and highly egocentric
(Level I) to acting conventional and being concerned with following the rules to avoid
punishment (Level II) to being postconventional and concerned with more universal
conceptions of morality (Level III). Individuals at the postconventional state make an
effort to avoid violating the rights of others and engage in principled moral reasoning. In
their synthesis of the research of the 1990s, Pascarella and Terenzini (2005) find that
senior undergraduates have a principled moral reasoning level that is 0.77 standard
deviations (28 percentile points) higher than freshmen students. They conclude this
change over the course of college is a move from conventional moral reasoning to
principled moral reasoning (see also Trevino, 1992). These effects tend to remain in the

8
years following graduation, although recent longitudinal research is limited. Principled
moral reasoning has also been linked positively to moral actions/behavior in areas such as
workplace ethics (Arnold & Poneman, 1991), resistance to cheating (Cummings et al.,
2001), and, importantly for policing, whistle blowing on corruption (Brabeck, 1984).
Although principled moral reasoning is not the only link to principled moral action, these
associations indicate that the change caused by college education should lead to more
moral behavior. The exact reason why college leads to higher-level moral reasoning is
not totally evident:
Part of the explanation may be that college provides a relatively challenging and stimulating environment that leads students to overhaul and rethink the fundamental ways in which they form moral judgments. College may do this in large measure because it encourages students to think about the larger social contexts of history, institutions, and broad intellectual and cultural trends—many of which involve moral and ethical issues (Pascarella & Terenzini, 2005: 349; see also Rest 1994; Rest & Narvaez, 1991). Thus, college could potentially impact abuse of authority behavior by instilling
more tolerant attitudes and promoting moral behavior. Based on the work of Durkheim
and theoretical and empirical research from studies of higher education, it seems very
likely that college education has a real effect on individuals. Increased morality and a
greater recognition of the rights of others would logically lead to police officers who
abuse their authority less. Enhanced moral reasoning and behavior therefore serves as a
potential mechanism linking college education and attitude change. Policing scholars
have made similar arguments on why higher education could potentially improve
policing, although as will be seen in the next section, these benefits were supported more
by intuition than empirical knowledge.

9
College Education and Policing
Scholars have examined the impact that education has on police practice and
performance for nearly 100 years (Finckenauer, 2005). August Vollmer, police chief in
Berkeley, California from 1905 to 1932, became the foremost advocate of increased
educational standards (Wilson, 1953). He believed that additional education would make
officers more effective in serving the community, and he hoped that all police
departments would require a bachelor’s degree for police recruits (Carte & Carte, 1975).
He noted in a letter that if this occurred, “Do you not believe that the entire [police]
service in America would be measurably improved?” (Carte & Carte, 1975: 69). A
college degree would most effectively allow officers to act independently to meet the
array of needs in their beat. Since Vollmer expected all officers to be the “chief” of their
beat, they needed to have the educational skills to serve the community (Carte & Carte,
1975). Several national panels echoed Vollmer’s idea, beginning with the Wickersham
Commission (1931). In their report on policing, which Vollmer largely wrote, they
argued rampant misconduct in policing was largely a result of poorly educated and
trained patrol officers and chiefs. The Commission report lamented the current state of
police education, noting, for example, that over half of Los Angeles officers did not even
have a high school diploma (Wickersham Commission, 1931). To follow through on
these recommendations, Vollmer helped develop the first school of criminology at the
University of California, he was a professor at the University of Chicago, and he
influenced and encouraged nearly a dozen schools on the west coast to start teaching
police and criminology courses (Wilson, 1953). Despite this push for increased
education from Vollmer, most departments continued to use minimal educational
requirements, rarely requiring more than a high school diploma (Paoline & Terrill, 2007).
10
The report of the President’s Commission on Law Enforcement and Administration of
Justice (1967: 279) even more explicitly called for increased standards for police officer
education, making the recommendation that “the ultimate aim of all police departments
should be that all personnel with general enforcement powers have baccalaureate
degrees.” Similar recommendations were made by the National Advisory Commission
on Criminal Justice Standards and Goals (1973). As the Commission notes (1973: 327),
“twenty years ago the high school diplomas was a significant educational achievement; it
is not today. To continue recruiting at this level of education is to invite mediocrity; it
may lead to the detrimental belief that almost anyone can be a policeman.” The
Commission argued that all police officers should have a college degree by 1982, and
advanced graduate degrees should be required for those with command positions. Also in
1973, the American Bar Association’s Advisory Committee on the Urban Police Function
echoed Saunders’ (1970: 82-83) reasons for supporting higher education for police:
The qualities which law enforcement leaders claim to look for in recruits are the very ones which liberal education is believed to nurture: knowledge of changing social, economic, and political conditions; understanding of human behavior; and the ability to communicate; together with the assumption of certain moral values, habits of mind, and qualities of self-discipline which are important in sustaining a commitment to public service.
The conclusions of these national commissions were based on intuitive logic that
college-educated officers would be better officers, but these reports cited little empirical
evidence to show that a college education made a difference.
Despite the paucity of research findings, Congress even became involved in
pushing for more educational opportunities for police officers through the creation of the
Law Enforcement Education Program (LEEP) in 1968. LEEP provided grants for current
officers to increase their education and loans for pre-service officers interested in

11
attending college (Carter & Sapp, 1990). However, Sherman and the National Advisory
Commission on Higher Education for Police Officers (1978) expressed disappointment at
the state of police education and found that LEEP funding was inadequate for a
residential liberal arts college experience. Instead, police education at the collegiate level
was too specialized and focused on police science courses vastly similar to the offerings
at the police training academy. The number of police education programs skyrocketed
after the creation of LEEP, because of the large supply of government funded students,
but the Commission found that most of these programs had poor or non-existent faculty
and were much more focused on vocational or industrial education than on a broad-based
liberal arts curriculum. The Commission (1978: 190) also recommended moving from
“educating the recruited” to “recruiting the educated.” For education to have a positive
impact on policing, they believed officers needed to enter the force with a pre-service
baccalaureate degree.
LEEP was eventually phased out, and without federal funding, many low quality
police education programs quickly closed down. (Roberg & Bonn, 2004). Since the
1960s and 1970s, there has been little emphasis on the national level on police
educational standards. As a result, educational requirements for police have not
increased dramatically in recent decades. The Bureau of Justice Statistics 2003 survey of
police departments (Hickman & Reaves, 2006) indicates that the vast majority of
departments still require only a high school diploma for applicants. Nine percent of
departments require a two-year degree and one percent require a four-year degree.
Larger departments are more likely to require some level of college with 18 percent of
departments serving more than one million people requiring some college education. As

12
a result, nearly one third of officers work for a department with some college education
requirement, a major increase from 10 percent in 1990. Despite this increase, a high
school diploma remains the norm for education entry-level requirements in most
departments.
In sum, advocates for higher educational standards for policing believe that
increased education will in some way improve the performance and attitudes of officers.
Education is supposed to add a humanistic element (i.e. a concern for human welfare) to
policing (Carlan & Byxbe, 2000; Roberg & Bonn, 2004) that makes officers “appreciate
the role of police in a democratic society” and “be more tolerant of people different from
themselves” (Worden, 1990: 566). In particular, educated officers are expected to have a
much stronger relationship with the community they serve (Carter & Sapp, 1990;
Goldstein, 1977). It seems likely that more humanistic police officers would be less
likely to hold attitudes supportive of abuse of authority. These intuitive arguments
provided by policing scholars seem to be in line with the empirical research on college
education and moral reasoning reviewed above.
College Education and Police Use of Force
Little research has directly examined whether officers with a higher level of
education have different attitudes and engage in different behavior related to the use of
force. There are some notable exceptions however. Two studies have used department
records to examine the impact education has on use of force incidents. Sherman and
Blumberg (1981) analyzed department records in Kansas City from 1972 to 1978 to
determine if college education had an impact on how frequently officers fired their gun.
They found that officers with a college degree did not differ from other officers in the

13
frequency of shooting their weapon in justified and non-justified situations. They note,
however, that their study was limited by the rarity of older and more experienced college
educated officers. Only six percent of officers in the department had a college degree in
1972, and there were only eight college-educated officers in the study with more than one
year of experience. More recently, Williams and Hester (2004) examined the use of force
records of 499 officers in the Polk County Sheriff’s Department, again finding no
relationship between an officer’s level of education and involvement in reported use of
force incidents. They also note that 21 percent of the sample had a four-year degree and
college graduates were evenly distributed across age ranges, so the sample included
older, college-educated officers. Fyfe (1988) also used departmental records, but did not
directly examine education. Using an IQ analysis of officers, he found that shootings by
“dull” officers (officers with an IQ below 90) were more than two times as likely to be
condemned by the department as shootings by normal or bright-normal officers (IQ of
90-124). However, the highest department shooting condemnation rate came from the
really bright officers (IQ 124-133), because these officers were usually in high ranking
positions where they did not have legitimate reasons for using their service weapon. Fyfe
notes that this issue is significant for educational research as well, because the impact of
educational attainment can be confounded by assignment.
Using observational data from the Police Services Study of 24 departments in
three metropolitan areas, Worden (1996) found that officers with a college degree were
more likely to use reasonable force, but no educational difference was found in an
examination of excessive force. In more recent research, Terrill and Mastrofski (2002)
analyzed systematic social observations of 638 officers in two departments, finding that

14
officers with more education were less likely to use force. They used an eight-level
ordinal variable to measure education, so they were unable to isolate specifically the
impact of a college degree. They still concluded that increasing educational standards for
hiring may be beneficial in reducing police use of excessive force. In an extension of this
work, Paoline and Terrill (2007) reaffirmed this recommendation. They more directly
assessed the impact of a college degree by dividing education into high school diploma
only, some college, and a four-year bachelor’s degree. They found that officers with any
college were less likely to use verbal force (threats and commands) in encounters with
citizens compared to officers with just a high school degree. However, only officers with
a four-year degree were significantly less likely to use physical force. As Paoline and
Terrill note (2007: 192) “it appears that simply attending college is not enough when it
comes to less reliance on physical force. In this respect, actually completing a 4-year
program is most beneficial.” In addition, they found that more experienced officers also
used less force. The interaction term between education and experience was statistically
nonsignificant, indicating that education provided no extra benefit for experienced
officers in terms of reducing use of force behavior.
Several studies have indirectly studied the impact education has on the abuse of
authority by looking at the relationship between officer education and number of citizen
complaints. Citizen complaints are not ideal for examining use of force behavior, but the
data are easier to collect and analyze than in observational studies. Citizens, however,
likely never report the majority of abuse of force incidents (Worden & Catlin, 2002).
Terrill and McCluskey (2002) find support for the idea that officers with more complaints
are truly “bad apples” but they also find evidence that “more productive” officers who
15
make more arrests and interact more with the public are also likely to have more
complaints. As Worden and Catlin (2002) point out, citizen complaints are a reflection of
not only the officer’s behavior (and potential misbehavior), but also the citizen’s likely
biased view of what occurred during the police-citizen encounter. Still, it seems
reasonable to look at rates of civilian complaints against officers to see if they vary by
education level.
Kappeler, Sapp, and Carter (1992) examined founded complaints filed against 120
officers over a five-year period. They found that officers without college degrees had
significantly more citizen-initiated complaints than officers with a college degree. The
29 percent of officers who did not have a college degree were responsible for 67 percent
of the officers who had three or more citizen complaints. Wilson (1999) examined 500
officers over a ten-year period and found that officers with a college degree tended to
have fewer complaints than officers without a degree. Officers without any degree had a
significantly higher mean number of complaints, on average (2.68), compared to officers
with a degree (2.03). Lersch and Kunzman (2001) found very similar results in a study of
700 officers in a large sheriff’s office, as did Cascio (1977) in his study of officers in
Florida. Cunningham (2006) examined disciplinary cases handled by the state
commission between 1992 and 2002 in Florida. He found that officers with just a high
school diploma made up 58 percent of officers, but were involved in 75 percent of the
disciplinary cases. Conversely, officers with a four-year degree made up 24 percent of
officers, but were involved in only 11 percent of disciplinary actions. Palombo’s (1995)
research of the Los Angeles Police Department found that officers with no college had
significantly more citizen complaints than officers with some college, and as a group,

16
officers with a bachelor’s degree had the lowest average number of citizen complaints.
Davis and Rostow (2003) found that officers with more education were significantly less
likely to be fired because of disciplinary problems or complaints. Cohen and Chaiken’s
(1973) study of 521 officers in the New York Police Department found that officers with
a high school diploma were significantly more likely to receive civilian complaints than
officers with some college (since there were so few college graduates in the dataset,
officers with any college education were combined in the analysis).
The research is not entirely uniform in this area, however. Pate and Fridell (1993)
collected the first national-level data on police use of force policy. In their analysis of
data from 1,111 departments, they found an inconsistent relationship between education
and citizen complaints. For example, in sheriff’s departments, college-educated officers
were underrepresented among officers receiving a complaint (a positive outcome). But in
city departments, officers with a bachelor’s degree made up 19.3 percent of all officers
and 18.3 percent of officers receiving a complaint, indicating a weak or nonexistent
relationship between education and complaints. In their analysis of excessive use of
force complaints of 800 officers, Brandl, Stroshine, and Frank (2001) found education to
be a statistically insignificant predictor of the number of complaints received. In general,
most of the research indicates that college-educated officers have less citizen complaints,
which makes it seem probable that these officers are abusing their authority less
frequently. In sum, research in the area is somewhat mixed, although the most recent
observational data and most of the research using departmental complaint data support
the conclusion that college-educated officers abuse their authority less.

17
Police Attitudes and Use of Force
Since the present study will examine the impact education has on attitudes, it is
important to also consider attitudinal research on police use of force. Research
specifically examining higher education and officer attitudes related to the use of force is
also limited. In general, research indicates that officer attitudes are not necessarily
strongly linked to officer behavior (Worden, 1989). This seems counterintuitive at first,
because “to maintain that people act in ways that are inconsistent with their attitudes
seems patently absurd” (Worden, 1989: 670). Indeed, some scholars have created
typologies of officers, based on attitudes, and then have used direct observation (if the
typologies were tested at all) to show that these attitudinal typologies were linked to
specific behaviors. (see for example Muir, 1977; White, 1972). These results are based
more on the impressions of the observers than on quantitative data. The social
psychology literature, however, consistently indicates that attitudes do not directly
correspond to behaviors (Fazio, 1986). Most research finds that the link between
attitudes and behaviors is weak, particularly when using general attitudes to predict single
behaviors (Ajzen & Fishbein, 1977; Wicker, 1969). However, researchers find higher
correlations between attitudes and behavior when using general attitudes to predict
aggregate behavior or when using a specific attitude to predict a specific behavior (Ajzen
& Fishbein, 2005). The current study will use both general attitudes on abuse of
authority that should correspond to abuse of authority behaviors and specific questions
related to use of force scenarios that should correlate with specific behavior in use of
force situations. These correlations will not be perfect, in part because of situational
pressures that may impact behavior. In policing, these situational pressures would
include departmental policies and peer influences, which can dramatically affect behavior

18
(Engel & Worden, 2003). In use of force situations, research has indicated that
situational factors are more important than attitudes (Worden, 1996), but attitudes have
not been studied frequently or effectively (Lester, 1996). Frequently, just one question is
used to assess attitudes, and better measures of attitudes may show a closer link to
behavior (National Research Council, 2004: 136). It also seems plausible that abuse of
authority situations are times when individual officer attitudes may be particularly salient.
Departmental policies, for example, will not be supportive of abusing authority, so if
higher education positively influences officer attitudes, it seems more likely that these
attitudes would translate into positive behaviors, since the “pressure” from the
department to not abuse authority would coincide with officer beliefs. In one of the few
(if not only) assessments of use of force attitudes and use of force behavior, Worden
(1996) found that officers with more positive attitudes towards the use of force did use
improper force more frequently. This effect, however, was only marginally significant
and explained little of the variation in use of force. Although there is not a perfect link
between attitudes and behaviors, scholars agree that attitudes are an important avenue for
study (Ajzen & Fishbein, 2005), and attitudinal study seems particularly relevant for a
serious and rare event such as the abuse of police authority. In addition, it seems logical
that attitudes could impact not only behavior but also departmental culture if less
supportive attitudes regarding abuse of authority could weaken the undesirable
characteristics of the subculture often associating with policing, such as looking the other
way when fellow cops engage in deviance (Kappeler, Sluder, & Alpert, 2005). This
impact would not be reflected in behavior, but this additional potential change in

19
organizational climate makes attitudes important to examine (see Paoline, Myers, &
Worden, 2000).
Research related to college education, attitudes, and use of force has been indirect
for the most part, exploring the impact education has on attitudes related to the abuse of
police authority. Still, a few studies have more directly assessed how education impacts
attitudes on use of force. Smith and Ostrom (1974) found a weak relationship between
years of college and officer acceptance of limits on the use of force in their study of 712
officers from 29 different departments. Officers with more years of college were more
likely to disagree with the statement that patrolmen in tough neighborhoods could reduce
serious crime problems more effectively if there were fewer use of force restrictions, but
the results were only marginally significant. Officers with some college experience,
however, were more supportive of Supreme Court decisions, such as Miranda vs.
Arizona, which limited police authority. While more than 60 percent of respondents
found the decisions to be harmful, years of college education was significantly related to
answering that the decisions were helpful for policing. Worden (1990) found that
officers with a college degree were more likely to have a positive attitude towards legal
restrictions on police use of force in his analysis of 1,417 officers from 24 police
departments in three metropolitan areas. He measured legal restrictions by summing
answers to questions about whether officers should have to worry about “probable
cause,” whether police officers would be more effective with fewer restrictions on use of
force (the same question used by Smith and Ostrom) and whether only officers should be
allowed to judge other officers in use of force cases. The effect of education, however,
20
was not highly significant, and the coefficient indicated education only had a small
impact on attitudes.
Additional studies have assessed how college education impacts attitudes and
beliefs related to police abuse of authority. Roberg (1978) studied 118 officers, finding
that officers with a college degree were less dogmatic and more open-minded. This
research confirmed the results of Guller (1972) and Smith, Locke, and Fenster. (1970).
Guller found that policing students about to finish college were significantly less
dogmatic and less punitively oriented than a comparable group of students about to begin
undergraduate studies in policing. Smith and colleagues found that a group of 39
college-educated officers was much less authoritarian than an equivalent group of non-
college educated officers. These results are consistent with the more general
postsecondary education literature, which finds that authoritarianism and dogmatism
decline fairly dramatically over the course of college (Pascarella & Terenzini, 1991).
Open-mindedness does not directly assess an officer’s likeliness of abusing their
authority, but less dogmatic officers will presumably be more likely to follow proper
departmental rules and regulations and will be more tolerant towards others (Rokeach,
1954). Similarly Shernock’s (1992) study of 177 officers in 11 police departments found
that officers with a college education were more likely to place a high value on ethical
conduct. However, education level was not significantly associated with intolerance
towards the misconduct of other officers.
Not all research has found an impact of education on police officer attitudes. In
his 1974 study of 396 police officers, Weiner concluded that educational level had no
impact on police officer attitudes. He found that officers with more education were no

21
more tolerant or less cynical than other officers, arguing that education could have no
impact because attitudes are deeply rooted in the police role. Parker and colleagues
(1976) took issue with these conclusions and pointed out that 25 of the 75 relationships
Weiner (1974) examined were statistically significant, indicating, at the very least, a
modest impact of education on attitudes. Weiner (1974) does make the important point
that the findings of studies such as Smith, Locke, and Fenster (1970) are problematic,
because of the “predisposition factor.” College-educated officers may have different
attitudes because people who make the decision to attend college are different. Thus,
these officers would be different, regardless of whether they actually attended college or
not. Parker et al. (1976) respond to this by noting the findings of Guller’s (1972) study,
which did indicate attitude change over the course of college. More recently, Paoline
(2001) analyzed the attitudinal and cultural outlooks of 611 officers from two
departments, finding seven different cultural clusters. The most educated officers were
found in two of these clusters, Traditionalists and Lay-Lows. As the names indicate,
these groups both have “less than admirable attitudinal orientations” (Paoline, 2001:
125). Traditionalists tend to have negative views of legal restrictions and the general
public, and they tend to be in favor of aggressive law enforcement, all attitudes that
would seem to promote the abuse of police authority. Lay-Lows do not reject legal
restrictions on force and have more favorable views towards citizens, but they tend to do
the bare minimum amount of law enforcement and avoid contact with citizens. Although
these attitudes are not particularly positive for effective policing, particularly community
policing, Lay-Lows would be unlikely to be involved in abuse of authority situations,
because these situations could lead to unwanted attention and confrontations with

22
supervisors. Still, Paoline’s (2001) overall findings do not show evidence of a strong
beneficial impact of college education on attitudes.
Bowker’s (1980: 17) conclusion that “all other things being equal, there is a linear
relationship between degree of exposure to college education and effects on police
attitudes” seems overstated in light of the research on this issue, but there is some
evidence that a college education can impact officer attitudes. In general, research
related to education and attitudes associated with police use of force is limited, although
there seems to be some evidence that a college degree may be beneficial for creating
attitudes conducive to the proper use of police authority. The present study will help
clarify the extant literature by more conclusively determining if this is the case.
Limitations of Prior Research
As noted before, research on the impact higher education has on police officers
attitudes and beliefs has been limited and inconclusive. This study will attempt to
address some of the shortcomings of prior research to arrive at a more definitive answer
regarding the impact a college degree has on police officer attitudes and beliefs regarding
use of force and abuse of authority. First, most studies focus on a small number of
officers or a small number of departments, or both. The Project on Policing
Neighborhoods produced an incredibly rich dataset that has allowed for several analyses
of the impact of education on use of force (e.g. Paoline & Terrill, 2007; Terrill &
Mastrofski, 2002). The data, however, came from officers in only two cities:
Indianapolis, IN and St. Petersburg, FL, raising questions about the representativeness of
findings using this data. The Weisburd et al. (2001) data utilized in the current study

23
have the major advantage of being a nationally representative sample of officers, making
it possible to generalize the results to the entire United States.
Second, as mentioned above, police attitude measurement with a single indicator
makes it difficult to tap into multidimensional attitudes accurately. The current data
include an extensive set of questions designed to explore fully officer beliefs and
attitudes regarding police abuse of authority. The authority scale described in the next
chapter includes nine different indicators of officer abuse of authority attitudes. The data
also have the advantage of asking about officer reactions to hypothetical situations, which
will provide additional information on officer attitudes and potentially some insight into
officer behavior.
Third, most prior research has used a limited number of control variables to assess
the impact of education. Demographic controls usually are limited to age, years of
experience, gender, and sometimes race. As detailed in the next chapter, the current
study will include these variables, while also controlling for officer job satisfaction,
officer rank, martial status and number of young children, involvement in community
policing and prior training in diversity, interpersonal skills, and ethics. In addition, since
this study employs a multiple department sample, department size and geographic
location can also be controlled for.
Finally, prior research on education has suffered from multiple flaws. Hudzik
(1978) notes two main problems. First, as mentioned earlier, there is an issue with
extraneous or predispositional variables. Very few studies have effectively isolated these
variables to determine if college is actually making a difference or if people who go to
college are different, even without attending college. Unfortunately, the current data do

24
not adequately address this issue, because of a lack of extensive data on an officer’s life
situation prior to joining the police force. This could lead to model misspecification
issues, because important pre-service variables, such as family background, may be
omitted. For example, if high childhood socioeconomic status was actually driving
attitudinal change, completing a bachelor’s degree could appear to be having an impact
on attitudes, when in reality that finding would be a reflection of omitted variable bias
due to the high correlation between socioeconomic status and attending college. I discuss
this issue further in the final chapter. No research in this area has yet included all
potentially relevant pre-college and pre-service variables.
Second, there is a problem isolating what component variables are important parts
of “college.” These component variables include the duration of college, the college
environment, and the curriculum. The emphasis on the completion of a bachelor’s
degree, detailed in the next chapter, is a way of at least partially addressing what type of
higher education should have an impact. Hudzik (1978) makes some excellent points
about the need to measure the impact of education more effectively, and 30 years after his
article, it is disappointing to not find any studies that have effectively incorporated all of
his recommendations. Still, the current research will address the limitations of prior
research by using a nationally representative creating a scale with multiple attitudinal
measures, incorporating multiple control variables, and partially assessing the important
component variables in college education.
HYPOTHESES
This thesis will test several related hypotheses that follow from the research
questions outlined at the outset of the study and the literature reviewed in this chapter.

25
Hypothesis 1. I hypothesize that officers with at least a four-year bachelor’s degree will
differ from officers with less education in attitudes about police use and abuse of
authority. More specifically, I hypothesize the following:
Hypothesis 1a. I predict officers with a college degree will disagree more with
statements supportive of unreasonable extensions of police authority, statements
supportive of the code of silence, statements supportive of breaking the rules to
get the job done, and statements about outsiders being overly concerned with
police brutality.
Hypothesis 1b. In examining hypothetical abuse of authority situations, I predict
officers will view the situation as more serious and be more supportive of
reporting fellow officers who engage in the abuse of authority.
. The impact of education is expected to remain even when a variety of demographic and
departmental factors are controlled for.
Hypothesis 2. I hypothesize that officers who obtain a college degree before they are
hired will differ from officers who have acquired a college degree while on the job. An
attitudinal change for college-educated officers is predicted to occur only for pre-service
college degrees, because once a recruit has become an officer, police culture and
departmental factors could diminish the impact of any additional education.
Hypothesis 3. I predict that these differences will appear most strongly for officers who
have obtained at least a bachelor’s degree. A pre-service college degree is expected to
have a differential and more beneficial impact compared to some college or even an
associate’s degree.

26
CHAPTER III: DATA AND METHODS
Description of the Data
This research uses data from a 1998 Police Foundation survey of police officers’
attitudes regarding abuse of authority (Weisburd et al., 2001). A nationally
representative sample of 925 officers was surveyed using questions covering a variety of
issues related to police use of authority. The survey included four sections: policing
issues, police response to citizen behavior, the impact of community-oriented policing,
and police officer information. The policing issues section includes questions about an
officer’s view of police use of force, the response to citizen behavior section includes two
scenarios regarding use of force situations and follow-up questions, and the impact of
community policing section examines the officer’s experience with community policing.
The police officer information section was used to gather extensive demographic
information about officers that will be used in the construction of the independent and
control variables discussed below. This dataset has the major advantage of being the first
national study ever of this subject area, and it is just the second survey ever to use a
random, nationally representative sample of police officers. The first, conducted by
LeDoux and Hazelwood (1985), concerned only police officer attitudes towards issues
related to rape. Survey data are advantageous for this study, because effective field
research is difficult to conduct, since police officers use force so infrequently and when it
does occur, determining when force has been abused is a highly subjective process
(Adams, 1996). Thus, examining police performance to determine how behaviors related
to use of force varied by educational level would be costly and time consuming and may
not produce sufficient analyzable data. In addition, some officers may never be involved

27
in a use of force situation and thus would be excluded from any study relying only on
observational measures. Survey data provide a unique opportunity to assess multiple
officers’ beliefs and attitudes about use of force without time-consuming observation of
officers in the field.
The target population of interest for this study is United States police officers.
Much policing research focuses on officers in a small number of departments (or often
just one department), which makes generalizing to the larger population exceptionally
difficult. A major benefit of this dataset was the creation of a much wider initial
sampling frame, which greatly enhances external validity. The sampling process had two
major steps. First, the Police Foundation needed to create an accurate listing of all
eligible police departments in the U.S. Second, after using probability sampling
techniques to choose departments and agencies, the Police Foundation needed to obtain a
list of officers from each selected department to randomly sample from. To compile a list
of all eligible agencies, the Police Foundation drew on the work of Maguire and
associates (1998) who attempted to compile a comprehensive list of U.S. law
enforcement agencies. Maguire and his colleagues combined data from the Uniform
Crime Report collected by the FBI, the Directory Survey of Law Enforcement Agencies
conducted by the U.S. Census Bureau, and grant applications submitted to the Office of
Community Oriented Policing Services. This list was narrowed by instituting certain
minimum eligibility criteria for agencies. Departments had to have at least 10 full-time
sworn officers, the agency needed to have primary responsibility for policing a residential
population (e.g. no special police forces), and the department had to be a municipal or
county agency. Sheriff offices, federal agencies, and state police were assumed to have

28
too many duties outside of policing residential populations. The final sampling frame of
agencies was 5,042 police departments that included between 91.6 and 94.1 percent of
the full-time sworn police officers in local police departments in the U.S. These
departments employed an estimated 350,000 officers (Weisburd et al., 2001: 6).
Sampling Procedure
The Police Foundation used multistage cluster sampling with stratification to
obtain a representative sample of police officers. The unit of analysis for this research is
the individual police officer. The departments were divided into three strata based on
department size. The nine largest departments in the nation were in the certainty stratum,
the midsize stratum consisted of departments with 25 or more full-time sworn officers
(but less than the nine largest) and the small stratum included departments that had at
least 10 officers but less than 25. Within each stratum, departments were organized by
geographic region (Northeast, South, North Central, or West)1. Probability proportional
to size (PPS) methods were used to randomly sample within each stratum. The nine
largest departments had a probability of 1.0 of being included in the sample and every
other department was ranked and assigned a probability based on size. Random sampling
produced 84 departments from the midsize category and 28 from the small department
category. These 121 departments were contacted and asked to provide a roster with the
name and rank of all full-time sworn officers, a phone number and address at the 1 States were classified in the following way: Northeast: Connecticut, Maine, Massachusetts, New Hampshire, New Jersey, New York, Pennsylvania, Rhode Island, and Vermont. South: Alabama, Arkansas, Delaware, District of Columbia, Florida, Georgia, Kentucky, Louisiana, Maryland, Mississippi, North Carolina, Oklahoma, South Carolina, Tennessee, Texas, Virginia, and West Virginia. North Central: Illinois, Indiana, Iowa, Kansas, Michigan, Minnesota, Nebraska, North Dakota, Ohio, South Dakota, and Wisconsin. West: Alaska, Arizona, California, Colorado, Hawaii, Idaho, Montana, Nevada, New Mexico, Oregon, Utah, Washington, and Wyoming.

29
department for each officer, and a badge or employee number for each officer. A total of
113 departments agreed to participate for a 93.4 percent agency response rate.
Departments in all three strata declined. The total participating agency sample consisted
of eight of the nine certainty departments (89 percent response rate), 78 of the 84 midsize
departments (93 percent response rate), and 27 of the 28 small departments (96.5 percent
response rate).
For each of the 113 departments, random sampling was used to generate a sample
of 1,112 potential respondents. For the certainty departments, the number of officers
chosen was based on the proportion of total officers that department represented, for
midsize departments 10 officers were sampled, and for small departments, an average of
4.5 officers were surveyed (half were randomly selected to have 4 officers surveyed and
the other half had 5 surveyed). Sixty of those originally chosen were ineligible for
various reasons (e.g. were not full-time sworn officers), leaving a final sample size of
1,060 officers. Of these officers, a total of 925 completed the survey for a response rate
of 87.3 percent. When the department response rate and the individual officer response
rate are combined, the overall response rate for the entire project is 81.5 percent, which is
above acceptable standards for social science research (Babbie, 1990). The survey was
administered by telephone while the officer was at work and took about 25 minutes to
complete.
RESEARCH METHODOLOGY
Dependent Variables
Two related dependent variables will be examined based on attitudinal data about
police use of force. The first dependent variable is a scale combining answers to nine

30
questions regarding an officer’s beliefs on police use of authority. These questions all
use Likert responses (strongly agree, agree, disagree, strongly disagree). The scale uses
questions in four broad categories. First, three questions assess an officer’s beliefs
regarding how much force is acceptable. These questions ask the officer to respond to
the following statements: “police officers are not permitted to use as much force as is
often necessary in making arrests,” “police officers should be allowed to use physical
force in response to verbal abuse,” and “it is sometimes acceptable to use more force than
is legally allowable to control someone who physically assaults an officer.” Second, two
questions ask about an officer’s beliefs regarding department rules and following the
rules. The officer responded to these two statements: “police department rules about the
use of force should not be any stricter than required by law” and “always following the
rules is not compatible with getting the job done.” Third, two questions ask officers about
their level of agreement with the police code of silence. The code of silence is frequently
seen as a key component of the police culture that stresses never reporting another
officer’s mistakes and rule violations (Kappeler et al., 2005). Officers responded with
their level of agreement to these two statements: “the code of silence is an essential part
of the mutual trust necessary to good policing” and “whistle blowing is not worth it.”
Finally, two questions asked officers to express their opinion about how outsiders view
police brutality. These two statements are: “the public is too concerned with police
brutality” and “the newspapers and TV in this country are too concerned with police
brutality.”
To construct the dependent variable, these nine items will be summed and divided
by nine to create an average score for each officer. The Cronbach’s alpha for the nine

31
items is 0.7007, which is acceptable for a reliability test (Nunnally & Bernstein, 1994).
Each survey question has four possible answers and values ranging from 1 to 4 with 1
corresponding to “strongly disagree” and 4 corresponding to “strongly agree.” This
average score is a continuous variable with a theoretical range of 1.0 to 4.0 and an actual
range of 1.11 to 3.67. The mean is 2.37 with a standard deviation of 0.37. If higher
education has a beneficial impact on attitudes, then college-educated officers should be
more likely to answer “strongly disagree” to all of these questions. This approach has the
major benefit of creating one continuous dependent variable that can be analyzed using
an ordinary least squares (OLS) regression model. I present the means and standard
deviations for each of the nine questions used in the scale in Appendix A. In Figure 1, I
show the distribution of the authority scale. This dependent variable appears close to
normally distributed, which will make hypothesis testing with OLS acceptable and
appropriate, since a normally distributed dependent variable will lead to normally
distributed residuals. This is confirmed using the skewness statistic. The scale has a
skewness statistic of -.054, which indicates a slight negative skew, but the value is less
than twice the value of the standard error of the skewness statistic (.083), so there are no
major concerns about normality.

32
Figure 1: Distribution of authority scale scores with comparison to normal curve
020
4060
8010
0Fr
eque
ncy
1 2 3 4Authority Scale Value
Distribution of Authority Scale
I will measure the second dependent variable with questions from the police
response to citizen behavior portion of the survey. These questions ask respondents to
provide their opinions to two different scenarios in which hypothetical officers use
potentially excessive force in scenarios. Two different versions of the first scenario were
used, and one half of the officers randomly received each version. Both are similar in
that an officer approaches a group of youth who are standing on a street corner and
proceeds to throw them up against a wall and use demeaning language towards them after
they refuse to leave the area. In the second scenario, a suspect in handcuffs in the police
station spits in the face of the officer, and the officer responds by pushing the suspect in
the face, causing the suspect to fall out of his chair onto the floor. Full text of the
scenarios is available in Appendix B. For each of the two scenarios, two questions will
be of interest. The first question asked “how serious do you consider the officer’s
behavior to be?” and participants gave one of five possible responses: not serious at all,
not very serious, moderately serious, quite serious, or very serious. The second question

33
asks officers “do you think you would report a fellow officer who engaged in this
behavior?” and possible response categories are: definitely not, probably not, possibly
yes, or definitely yes. The scenarios are useful to analyze because they present situations
that are not clear instances of police excessive force, which creates a good amount of
variation in responses. For example, for the second scenario, responses were distributed
such that every response category for “how serious do you consider the officer’s behavior
to be” had at least 15 percent of officers.
There are multiple possible methods for analysis of the second dependent
variable. The most appropriate method will be the use of principal components analysis
(PCA). PCA is beneficial because it can minimize the number of variables while also
maximizing the amount of information presented in the analysis (Gorsuch, 1974).
Although this approach will make interpretation less intuitive, unlike the first dependent
variable, it will not be appropriate to sum the two items for each scenario to create a
scenario scale. The seriousness questions range in value from 1 to 5 and the likelihood of
turning an officer in questions range in value from 1 to 4, and since there are two
different metrics, the seriousness questions would be disproportionately represented in a
summed or averaged scale.
An additional potential analytic strategy would be to examine each of the four
questions related to the scenarios separately in an ordered logit model, also known as an
ordinal regression model (McKelvey & Zavoina, 1975). Ordered regression models have
the benefit of not assuming that the distance between every two categories in the ranking
is equal. However, this method assumes the covariates described below would have a
differential impact on each of the four scenario questions, since a different model would

34
estimated for each question. This seems illogical, since the four questions are actually
two questions asked of each of two similar scenarios. The Cronbach’s alpha for the four
questions is 0.7342, indicating the four questions do share similarities. In addition, the
correlations between the four questions range from 0.22 to 0.62, which makes
significance tests of each question problematic since the variables have some overlap,
resulting in potentially biased p-values (Gorsuch, 1974: 323). In addition, the ordinal
regression model makes the assumption of proportional odds (or parallel regression), and
this assumption is usually difficult to meet in practice (Long, 1997). Thus, use of PCA
seems to be most appropriate. For the first dependent variable, factor analysis or PCA
will not be used since each of the nine questions use the same metric, the Cronbach’s
alpha is sufficiently high, and interpretation will be easier using an averaged scale.
Thus, PCA was used as a data reduction method to combine the four authority
scale questions and create a component score for each officer. It should be noted that
factor analysis is an alternative approach for data minimization and factor analysis and
PCA are distinctly different methods. Factor analysis, however, would not be appropriate
for the current study, because the method does not make it possible to calculate scores for
each observation (Costello & Osborne, 2005; Fabrigar et al., 1999; Velicer & Jackson,
1990). These component scores are necessary to produce the second dependent variable
for regression analysis. PCA led to the extraction of one retained component with an
Eigen value of 2.26. The other extracted components all had Eigen values of less than
1.0 and were dropped from the analysis. This component explains just over 56 percent of
the variance in the four scenario questions. The component loadings for each of the four
questions are presented in Table 1. Each of the loadings exceeds the conventional

35
standard of .40. In addition, the Kaiser-Meyer-Olkin test of sampling adequacy produced
an overall value of .53, which exceeds the conventional standard of .50, but not by much.
The chi square value for Bartlett’s test of sphericity is over 1100, which means I can
reject the null hypothesis that the correlation matrix for the four variables is an identity
matrix. Thus, I can be confident that there the four variables are correlated, which
confirms the earlier reported correlations. This principal PCA meets all conventional
standards, but I would ideally extract a higher percentage of the variance from these four
questions. I will use the PCA results in the analyses for the next chapter to maintain
parsimony in my presentation of results, but I will also conduct sensitivity analyses using
multinomial logistic models (Long, 1997) with each of the four questions used in this
PCA to examine whether results differ. Multinomial logistic regression has less
restrictive assumptions than ordinal regression.
Table 1: Component loadings for principal components analysis of scenario questions Question Component
Loading Communalities
(Variance Explained) Seriousness of officer’s behavior (Scen. A) .675 .455 Would you report officer? (Scen. A) .763 .582 Seriousness of officer’s behavior (Scen.B) .712 .506 Would you report officer? (Scen. B) .844 .712 N = 905
The predicted component scores were calculated for each officer. These scores
will be used as the dependent variable to test how education impacts officer answers to
the abuse of authority scenario questions. The component scores have a mean of 0, a
standard deviation of 1 and a range of -2.52 to 1.72. I present the distribution of the
scenario component in Figure 2. The data appear reasonably normal, which will allow
for acceptable hypothesis testing using OLS. The data, however, are more skewed than
the authority scale. The skewness statistic of -.195 is greater than double the standard

36
error of the skewness statistic (.081), but it is not substantially greater, and in addition,
the median (-.0059) differs only slightly from the mean of 0. Thus, these data are
somewhat negatively skewed, but the departure from normality should not be too large to
generate any problems with hypothesis testing.
Figure 2: Distribution of scenario component scores with comparison to normal curve
020
4060
80Fr
eque
ncy
-3 -2 -1 0 1 2Scenario Component Score
Distribution of Scenario Component
In terms of the validity of these two dependent variables, there is a significant
level of face validity. All of the questions ask about issues related to abuse of authority
or use of force and its consequences. There also is evidence of content validity. Use of
force and abuse of authority are fairly broad topics, but by creating two scales that assess
attitudes in four different areas and responses to two scenarios, several different aspects
of this concept are being tapped. The second dependent variable, while still assessing
attitudes, makes an effort to get at behaviors by asking officers how they would act in a
particular situation. This method has been viewed as helpful, because it “partly bridges
the gap between attitudes towards excessive force in the abstract and behavior on the
street” (Guller & Toch, 1996: 315). The use of these two vignettes is also beneficial

37
because use of force and abuse of authority behavior is difficult to ask about directly,
since officers, even when they know a survey is confidential, are unlikely to report their
own inappropriate activity (Klockars et al., 2000). The vignette method is becoming
increasingly common in policing research as a way to present officers with realistic
situations about sensitive areas in a non-threatening way (Hickman et al., 2001). The
scenarios in the current study differ from typical vignettes because they do not directly
ask the officer what he or she would do in a similar situation. Also, the survey used only
two scenarios, so as a result, the measure of hypothetical behavior is somewhat limited.
Still, the scenario component is a useful complement to the authority scale because the
later focuses on more global attitudes about abuse of authority, while the former gets at
more situational specific attitudes. Although these situational assessments are limited by
the use of only two scenarios, they are useful for providing a fuller picture of officer
attitudes. Since the data have never been subject to analysis using scales, there is no
means of using exact prior measures for index construction, which is a threat to internal
validity. Theoretically, the scales were created in an effort to combine related topics to
maximize construct validity. In the first scale, the four categories were created based on
distinctions used by Weisburd and associates (2001) in their presentation of the data. For
the second scale, all the questions about officer attitudes related to the scenarios were
included.
Main Independent Variable
The key independent variable of interest is the officer’s level of education. The
survey asks two questions about officer’s level of education: level of education achieved
before the respondent became an officer and current level of education. As noted in the

38
previous chapter, a pre-service bachelor’s degree is expected to have the greatest impact
on attitudes. Officers who acquire a pre-service bachelor’s degree may differ from those
who obtain a degree while already employed as an officer. Officers who acquire a degree
in-service likely have already formed opinions and attitudes regarding police use of
authority and thus any impact education could have would potentially be diminished
(Worden, 1990). Using pre-service educational obtainment will avoid confounding the
impact of education with the impact of work environment, colleagues, and training. This
original pre-service education question has a significant number of missing values (valid
n = 786 out of 925 surveys). The missing data problem, however, can be largely solved
with available data using deductive imputation (Brick & Kalton, 1996). Every single
officer who had a missing value for pre-service education level had a current highest
education level of high school graduate or less. Thus, these missing values can be
recoded as high school graduates, since officers who had only a high school education at
the time of the survey certainly had no more than a high school education before entering
the police service. When the missing values are recoded, there are 924 valid responses
for pre-service education. Pre-service education is measured by asking respondents
“what level of education did you complete before becoming a police officer?” Education
is an eight-level ordinal variable with the following values: some high school, high
school graduate/GED, some college, associate’s degree, bachelor’s degree, some
graduate or professional school, master’s degree and doctoral degree/law degree
(although no respondents acquired a doctoral or law degree prior to employment). The
current education question asks officers “what is the highest level of school that you’ve
completed?” and has the same answer choices. The data indicate about 24 percent of

39
officers surveyed had received at least a bachelor’s degree prior to hiring and about 31
percent had received at least a four-year degree at the time of the survey.
For this study, the primary research question is whether officers with at least a
bachelor’s degree prior to hiring differ in their attitudes towards police use of authority
compared to officers with less than a four-year degree, so just examining the impact of
level of education will be insufficient. The acquisition of a four-year degree is a
significant educational achievement that is distinctly different from completing some
college or even an associate’s (two-year) degree, and the impact of education is
hypothesized to be different for those with a four-year degree or higher (Hudzik, 1978;
Sherman et al., 1978; Shernock, 1992). Thus, education will be recoded, creating a
binary variable where 0 refers to those with less than a college degree (some high school,
high school graduate/GED, some college, and associate’s degree) and 1 corresponds to
those with at least a four-year degree (bachelor’s degree, some graduate or professional
school, master’s degree, doctor degree, law degree, Ed.D.).
The final model will be re-run using the current education level variable to test
Hypothesis 2 and see if any differences emerge. This comparison will help get at the
“predisposition issue” mentioned issue (Weiner, 1974). It could be that officers who
receive a college degree before they join the police force are different even before
attending college, so that a college degree is actually confounded with unmeasured pre-
college characteristics, such as family background, wealth, and intelligence. A
comparison between pre-service college graduates and officers who receive their degree
while already employed with the police will shed light on the issue. If there are no

40
differences between these two groups, then this provides evidence contrary to Weiner’s
(1974) argument about predisposition.
A third analysis will examine whether officers who completed any college are
distinctly different in attitudes from those with just a high school diploma. In this
analysis, I will use three binary variables, one for officers that attended some college (but
did not complete a degree), one for officers who received an associate’s degree, and one
for officers who earned at least a bachelor’s degree. An associate’s degree is not
hypothesized to have as powerful an impact as a four-year degree because many two-year
programs are more vocational than academic in nature and are not expected to have a
major effect on police attitudes (Worden, 1990). Goldstein (1977: 295) points out that
four-year programs, compared to two-year programs, provide a broader curriculum that
has some background in the liberal arts with a much higher quality of faculty. Four-year
programs also usually provide the benefits of “intermixture on a college campus.”
Sherman and associates (1978) echo Goldstein’s (1977) concerns about the quality of
two-year programs, and note that the two-year terminal police education degree should be
phased out because community college programs decrease student aspirations for further
learning and reinforce police work as paraprofessional. As mentioned above, these
differences make four-year programs distinctly different and their breadth,
comprehensiveness, and higher-quality instruction all make it seem likely that attitude
change would be more likely to occur. Like earning an associate’s degree, attending
some college, but not receiving a degree, is not expected to have the impact on attitudes
as acquiring a four-year bachelor’s degree. The regression analysis using these three

41
dummy variables will provide a test of Hypothesis 3 by examining whether a bachelor’s
degree has a more substantial impact on attitudes.
Control Variables
Officer Demographic Variables
This study will include other independent variables in the final model as control
variables. Age, gender, and race/ethnicity all may have an impact on officer’s education
and attitudes and are necessary controls. Although previous research has indicated that
police use of force is largely unrelated to an officer’s personal characteristics such as
gender, age, and ethnicity (Adams, 2005), this research is not entirely conclusive and has
usually not examined attitudes, which is why I will include these variables in the model.
In addition, these factors may be related to educational achievement. Gender differences
are now largely nonexistent in education, but minorities may still face obstacles in
obtaining a college degree. The possible exclusion of substantial numbers of minority
recruits is a major concern of increasing educational standards (Decker & Huckabee,
2002). The proportion of Americans who receive a college degree continues to increase,
so that younger officers may be more likely to have received a college degree (Roberg &
Bonn, 2004). Gender is a binary variable indicating whether the respondent is male or
female. Race will be assessed with two binary variables that indicate whether or not the
respondent is black and whether or not the respondent is a race other than white or black
(Asian, American Indian or Alaskan Native, Native Hawaiian or Pacific Islander, other,
or mixed race). Thus, white respondents will be used as the reference group. For
ethnicity, a binary variable will be used to denote whether the respondent is of Hispanic,

42
Latino, or Spanish origin (race and ethnicity were asked about in separate questions).
Age is measured in years with a range of 22 to 66.
Officer Family Variables
I will also control for two family variables: whether the respondent has dependent
children under the age of 18 and whether the respondent is married. These family
variables may have an impact on attitudes towards police authority. For example, an
officer who is married with children may be less supportive of police use of force,
because he or she places a higher value on human life. In a related way, married officers
may be less aggressive and violent, because marriage can serve as a stabilizing life event
enhancing social bonds (Sampson, Laub, & Wimer, 2006). Number of dependent
children ranges from 0 to 5 and was measured by asking the question “how many
children do you have who are under 18 that are dependent on you?” It is not realistic to
expect each additional child to have an incremental impact, so the variable will be
recoded as a binary to indicate whether the respondent has children or not. Marital status
was measured by asking officers “are you now…” with possible responses of married,
living with someone as married, widowed, divorced, separated, or never been married.
Two different binary variables will be constructed to get at the possible influence of
marriage. First, a binary variable that indicates whether the respondent is currently
married (or living with someone as married) or not (not married includes never married,
divorced, widowed, and separated) will be used to determine if there is any impact of
current marriage that needs to be controlled for. A related binary variable of whether an
officer has ever been married will be substituted to determine if current marriage has a
different impact than ever having been married. Thus, this second binary variable will be
43
coded with never been married as one category and all other marriage responses as the
other. To avoid colinearity issues, the final model will only include one of the marriage
variables.
Officer Work Experience Variables
Three individual-level variables about the respondent’s experience as a police
officer will be included. First, I will include the officer’s years of experience as a police
officer measured in years, measured by asking officers “how long have you been a sworn
police officer?” This variable is highly correlated with age (r = .88), so it may be
necessary to eliminate one in the final model to avoid colinearity issues. Since years of
experience is on its face more substantively related to policing, age will be excluded from
the final model if necessary. Second, a binary variable that indicates whether the
officer’s rank is patrol officer or not will be included. Officers who are not patrol
officers have higher ranks (e.g. corporal, captain, deputy chief). The original question
asked was “what is your current rank?” and produced 11 different responses with slightly
more than half of respondents indicating their rank as patrol officer. Finally, I will use a
binary variable that indicates whether the officer responded that they were satisfied or
dissatisfied with their job using answers to the question “considering all aspects of the
job, are you satisfied or dissatisfied with your current assignment?” These individual
level characteristics are important as some have argued that any impact of education will
disappear when rank and experience are controlled for (National Research Council, 2004;
Paoline & Terrill, 2007). Bayley and Bittner (1997), for example, note that experience in
the field is considered paramount within police organizations, and they point to multiple
benefits of increased experience such as learning tactical choices and departmental

44
norms. That is, a relationship between education and improved attitudes or performance
could be spurious and really a result of either officers with more experience or a higher
rank (or both) being “better” police officers. Rank is an important control, because
research indicates officers with more education tend to receive more promotions (Polk &
Armstrong, 2001; Truxillo, Bennett, & Collins, 1998;) and do better on promotional
exams (Whetstone, 2000), and higher ranking officers may be less supportive of police
abuse of authority. Job satisfaction is an important control, because it could influence
attitudes about the work environment, and could be related to education. Some have
predicted that college-educated officers will be less satisfied with their job because
policing does not adequately allow them to use their skill set (Trojanowicz & Nicholson,
1976).
Additional Officer Training Variables
I will also include three variables about the respondent’s additional training. Each
of these variables is binary and reflect three areas of additional training and instruction
that could impact attitudes about police use of authority. Officers were asked “in your
academy training or since becoming a police officer, have you taken any classes in
interpersonal skills or interpersonal relations?” and similar questions asking whether they
had received courses in ethics or in human diversity/cultural awareness. One way
education is hypothesized to affect police performance by making officers more ethical
(Worden, 1990; Shernock, 1992), so it is important to control for additional ethics
training. Classes on diversity and interpersonal skills would likely make officers more
tolerant and respectful of the community they serve and less likely to hold attitudes

45
supporting the abuse of authority (Shusta et al., 1995), so all of these variables serve both
as important potential predictors of attitudes and as controls for the impact of education.
Departmental Variables
Finally, three variables about the department the respondent works in will be used
as controls. The department-wide data provide some methodological issues for this
research. Officers surveyed in this study are nested in departments in cities and various
factors in the department and city could have an impact on attitudes about force. In an
effort to ensure the confidentiality of responses, identifying information that linked a
respondent to a particular department was destroyed by the research company hired to
administer the survey (Mathematica Policy Research Inc. of Princeton, NJ). This is a
major benefit for ethical concerns. Officers were revealing potentially sensitive
information about their views regarding citizens and the use of authority, and thus, the
fact that no responses can be traced directly to an officer likely made officers more
candid in interviews. Since a separate company collected the data and destroyed
identifiers upon presenting the data to the Police Foundation, results are both confidential
and anonymous. Unfortunately, this makes it difficult to control for potentially important
macro-level characteristics that could influence an officer’s attitudes (and possibly
education). I can control for three relevant characteristics of the department with the
available data. First, the size of the respondent’s department is measured as small,
midsize, or certainty (large). Small departments are those with 10 to 24 full-time, sworn
officers, midsize departments are those with 25 or more officers, and large departments
are eight of the nine largest departments in the country. Two binary variables will be
used that measure whether the department is small or not and whether the department is
46
midsized or not. Second, the geographic location of the department can be assessed and
is coded as North Central, Northeast, South, or West. Weisburd and associates (2001)
found a differential impact in opinions on use of authority only between Western
departments and all others, but to ensure that geographic region is fully explored in the
model, three binary variables will be used that indicate whether or not the department is
in the South, whether or not the department is in the West, and whether or not the
department is in the Northeast. The North Central region will thus serve as the reference
category. Finally, a binary variable will measure whether officers responded that their
departments were involved in community-oriented policing. Departments that embrace
community-oriented policing may have officers with less supportive attitudes regarding
abuse of authority, since community policing is intended, in part, to improve service to
and build partnerships with community residents (Cordner, 2005; Greene, 2000). I
present a table of descriptive statistics for the independent, dependent, and control
variables in Appendix C.
Additional Statistical Procedures
As a result of the two-stage stratified cluster sampling approach, two additional
statistical procedures are needed. First, a statistical correction is needed for weighting the
responses of each officer. Mathematica developed this weighting procedure to account
for differences in the probability of officers being chosen to complete the survey, and
response rates at the departmental level and the individual officer level (Weisburd et al.,
2001: 189-190). First, each department was assigned a weight representing the inverse of
the probability of selection since probability proportional to size methods were used.
Then, adjustments were made to account for non-response at the department level so that

47
each department’s final weight reflected its share of the population. Third, each officer
was given an initial weight that corresponded to the product of the department’s final
weight and the inverse of the probability of selection for each officer given their
particular department. This weight was adjusted for non-response at the officer level to
provide a final weight for each observation. Since random sampling was used, officers
from the same department have the same final weight2.
In addition, I need to use a correction to account for the clustered nature of the
data and the stratification of departments by size. Since multiple officers were sampled
from each department (cluster), there will be a correlation within clusters, because
officers from the same department will likely share some similarities. Fortunately, Stata
9.0 can address both of these concerns. The survey regression commands can be used
both to add the appropriate final weight for each observation and to create standard errors
that account for the clustering. Taylor linearized standard errors will be used which
provide a consistent and unbiased estimator of the variance that accounts for the
correlations inherent in clustering (Binder, 1983; Williams, 2000). The survey regression
procedures also account for the stratification by size, which makes it unnecessary and
inappropriate to also include binary variables for department size in the final model.
When department size is excluded from the model, however, it becomes impossible to
determine if department size has a significant impact on officer attitudes. Thus, the
models will first be estimated using the size binary variables to examine significance. If
the variables are statistically nonsignificant, the survey regression with stratification
2 Because the weights were constructed by an outside statistician, I was unable to make any adjustments based on missing data in the final results. The results in Chapter 4 were re-run without any weight adjustments and the substantive findings were unchanged, so the weights used are not biasing the final results.
48
methods will then be used to produce the most accurate estimates of the standard errors.
If the department size variables are statistically significant, then I will include them in the
final model. I will still weight each observation and adjust the standard errors for
clustering. These estimates will use robust standard errors, instead of Taylor linearized
standard errors. Adjustments for stratification actually lower the standard errors
typically, because units within a stratum tend to be more similar than units in another
stratum (i.e. small departments will be more similar to each other than they are to the nine
largest departments in the U.S.). Thus, the Taylor linearized standard errors will produce
the most accurate estimate of the standard errors, but not adjusting for stratification will
not unfairly bias the results and will only make them more conservative. These survey
data correction methods in Stata can be applied to all the regression models used in this
study.
Missing Data
As can be seen in Appendix C, the authority scale has a fairly substantial number
of missing values using standard listwise deletion techniques. When combining the nine
questions about abuse of authority, only 861 of the 925 total respondents provided an
answer to all nine questions. To address this issue, I employed a missing value multiple
imputation technique in Stata (Royston, 2005). The missing values for the authority scale
were filled in based on patterns in the data from each of the nine questions that made up
the scale. After the imputation, values for the authority scale were available for all 925
respondents. The distribution of the data did not change dramatically after the imputation
process. The scale has a mean of 2.36 (compared to 2.37 in the original scale) and the
standard deviation remains 0.37. The minimum and maximum values also remained

49
unchanged with the imputed data ranging from 1.11 to 3.67. The authority scale models
discussed in the next chapter will be re-run using the imputed data, but it appears likely
that the results will not be changed dramatically since the imputed authority scale is
similar to the original scale. Thus, if results are not substantively different, I will use the
non-imputed data because this provides more conservative estimates that rely solely on
the actual available data. In addition, although missing data lead to the removal of 64
officers from the sample using listwise deletion, the final sample of 861 for the first
dependent variable still represents over 93 percent of the total sample. I examined
missing data patterns by department and it does not appear that missing responses are
clustered in particular departments. Of the 113 departments in the study, only two
departments had over two missing data points. These two midsize departments each had
three officers who did not answer all nine questions used in the scale.

50
CHAPTER IV: RESULTS This chapter presents the results of the analyses testing the hypotheses described
at the end of the second chapter. As noted in the previous chapter, these analyses all use
ordinary least squares (OLS) regression. The results for the test of the first hypothesis,
that officers with a pre-service bachelor’s degree will have less supportive attitudes
regarding the abuse of authority, are presented in Table 2. Negative beta coefficients
indicate a movement towards “strongly disagree” on the nine questions in the authority
scale. This is a desirable result, so the variable for college degree is hypothesized to have
a significant negative impact on the authority scale. I used two-tailed hypothesis tests for
all of the independent and control variables in the following analyses to ensure I can
adequately identify any statistically significant effects, even those that were contrary to
my hypotheses. A pre-service college degree does have a statistically significant impact
in the expected direction. Officers that have a pre-service bachelor’s degree are expected
to decrease their authority scale value by .0566 (move .0566 units towards strongly
disagree) holding all else constant. Using a y-standardized coefficient, having at least a
pre-service bachelor’s degree results in an expected decrease of .1528 standard deviations
in the authority scale value holding all else constant. Thus, while the impact of a four-
year degree is statistically significant, the magnitude of the effect is not particularly
sizable. Three of the control variables also are statistically significant. Officers who are
satisfied with their job on average have an authority score that is .1417 units lower
holding all else constant. Patrol officers and officers who have received training in
interpersonal skills have higher authority scale scores on average. The finding for
interpersonal skills is surprising, because it seems logical that officers that have training

51
in interacting with citizens would hold less supportive attitudes regarding abuse of
authority. These control variables all have larger y-standardized coefficients than the
pre-service college education indicator. It is important to note that the model only
explains 9.79 percent of the variance in the authority scale. I discuss the possible reasons
for rather low variance explained in all of these models in the next chapter.
The results in Table 2 reflect the removal of age from the final model. As noted
in the previous chapter, age was highly correlated with years of experience (r = 0.88), and
an examination of variance inflation factors (VIF) and tolerance levels indicated that age
and years had a tolerance of about 0.2 and a VIF of almost 5. These levels suggested the
possibility of multicolinearity problems, so age was removed. With the removal of age,
no variable had a VIF over 2 or a tolerance level below 0.5. The correlations between all
variables remaining in the model were all under .50. This model also includes the
currently married control variable. The model was re-run using the alternate marriage
variable (have you ever been married?) and the results were similar and less variance was
explained, so the currently married variable was chosen. In addition, I employed the
survey regression feature in Stata. When the small and midsize departmental size
controls were included in an initial model, both were statistically insignificant. The
survey regression feature adjusts the standard errors downward by taking advantage of
the greater homogeneity within department size strata compared to across strata. As
noted in the previous chapter, survey regression also allows each officer to be properly
weighted and accounts for the clustering of officers within departments. Thus, the
linearized standard errors in the final model are adjusted for spatial autocorrelation.
Standard tests of heteroscedasticity cannot be calculated when observations are weighted,

52
but the analysis was re-run without probability weights and using both a Breush-Pagan
test (p = .542) and a White’s test (p = .402) for heteroscedasticity, I failed to reject the
null hypothesis that the data are homoscedastic. Thus, there appear to be no major
problems with the OLS assumption of homoscedasticity.
Table 2: OLS results for testing the impact of an officer earning at least a pre-service bachelor’s degree on the authority scale
Variable Beta Linearized Std. Error
p-value
PreCollege -.0566 .0269 .037** Male -.0232 .0397 .560 Black .0155 .0516 .765 Other .0897 .0598 .136 Hispanic .0648 .0556 .246 Kids -.0045 .0255 .861 MarriedNow -.0347 .0328 .293 Years -.0006 .0018 .743 Patrol .1102 .0291 .000*** Satisfied -.1417 .0401 .001*** Interpersonal .1109 .0349 .002*** Diversity -.0263 .0336 .435 Ethics .0385 .0254 .133 West -.0195 .0395 .623 Northeast .0129 .0389 .740 South .0529 .0409 .199 COP -.0610 .0518 .242 Constant 2.4876 .0983 .000*** * p < .10 ** p < .05 *** p < .01 N = 845; R2 = .0979; F = 4.26 (p = .0000) The analysis in Table 2 was re-run using the imputed dataset, which resulted in no
missing data for the dependent variable and a final sample of 886 due to missing data
from the independent and control variables. I provide these results in Appendix D.
There are no substantive differences using the imputed sample. All the same variables
are statistically significant at the p < .05 level. Thus, the non-imputed sample will be
considered the final model because these estimates are more conservative and based on
actually observed data. The final sample for the analysis in Table 2 of 845 still represents

53
over 91 percent of the original data. In addition, I ran a logistic regression using whether
or not an observation was missing for the authority scale as the dependent variable. None
of the independent or control variables in the model were significant predictors at the
p < .10 level and the model itself was not statistically significant (F = .51, p = .9430),
indicating that none of the covariates used appear to be affecting the likelihood that a
respondent would fail to answer all the questions used for the authority scale. Missing
data were less of a problem for the second dependent variables (valid n = 905), so the
original non-imputed sample will be used for all reported analyses.
In Table 3, I report the analysis used to test the second part of the first hypothesis,
that officers with at least a pre-service bachelor’s degree will be more likely to see
potential abuse of authority scenarios as more serious situations that require intervention.
Higher component scores indicate the officer was more likely to answer that they viewed
these scenarios as serious, and they were more likely to report a fellow officer who
engaged in these behaviors, although the specific coefficient values are not easily
interpretable. As Table 3 indicates, there is not support for this hypothesis. The pre-
service college variable is statistically insignificant (p = .418). In this model, I did not
use the survey regression function, because in the initial model the binary variable for
small departments was statistically significant. The analysis presented still includes
probability weights and adjusts for clustering within departments. However, no
adjustment to the standard errors were made for stratification. Five of the control
variables were statistically significant at the .05 level. As in the previous model, the
binary variables for patrol officers and job satisfaction were both statistically significant.
Patrol officers were more likely to see the scenarios as less serious and were less likely to

54
view intervention as necessary compared to officers with a higher rank. Those officers
who were satisfied with their jobs had the opposite reaction to the scenarios. Officers
that were currently married had significantly higher scores on the scenario component, as
did officers who had received prior training in diversity. Officers from small departments
had higher component scores compared to officers from the largest departments (the
reference group). A Wald test comparing small and midsize departments was statistically
significant (F = 11.98; p = .0008), indicating that officers from small departments were
significantly more likely to think the scenarios involved serious officer misconduct that
should be reported compared to officers in larger departments.
Table 3: OLS results for testing the impact of an officer earning at least a pre-service bachelor’s degree on the scenario component
Variable Beta Robust Std. Error
p-value
PreCollege -.0668 .0821 .418 Male -.1724 .1117 .126 Black .1930 .1334 .151 Other -.2427 .1540 .118 Hispanic .1093 .1219 .372 Kids -.0618 .0789 .433 MarriedNow .2935 .0742 .000*** Years .0084 .0047 .074* Patrol -.2781 .0772 .000*** Satisfied .2996 .1202 .014** Interpersonal -.0038 .0767 .961 Diversity .2703 .0940 .005*** Ethics -.0345 .0694 .620 Small .4175 .1419 .004*** Midsize .0572 .1255 .649 West .0589 .1356 .665 Northeast -.0607 .1088 .578 South .0698 .1068 .515 COP .0834 .1125 .460 Constant -.4370 .2417 .073* * p < .10 ** p < .05 *** p < .01 N = 883; R2 = .0990; F = 6.16 (p = .0000)

55
As noted in the previous chapter, because I only extracted 56 percent of the
variance in the scenario questions using the one principal component, I also used separate
analyses of each question with multinomial logistic regression (Long, 1997). I
constructed eight different multinomial logistic regression models using each of the four
scenario questions in models with either pre-service bachelor’s degree or current
bachelor’s degree predictors. The college variable was only statistically significant in the
two models for the seriousness of officer conduct question in Scenario A. In both cases,
the significant findings indicate officers with at least a bachelor’s degree had greater odds
of answering that the hypothetical behavior was not very serious or moderately serious
compared to not serious, quite serious, or very serious. I do not deem this one set of
significant findings to be of great substantive interest and believe the component scores
provide an accurate assessment of the results.
To test Hypothesis 2, I replaced the pre-college variable with a current level of
education variable. Thus, this college binary variable included both officers who earned
a pre-service degree and officers who received a bachelor’s degree (or higher) while
already employed as a police officer. I hypothesized that this variable would not be
statistically significant or if there was a significant impact, I believed it would be smaller
in magnitude than the pre-service college education variable. The results for the impact
of this new college variable on the authority scale are presented in Table 4. The results
are contrary to Hypothesis 2, because having at least a bachelor’s degree remains a
statistically significant predictor of officer attitudes. Officers with at least a four-year
degree have a scenario scale value that is .0626 lower compared to less educated officers,
holding all else constant. Indeed, not only is the significant effect contrary to predictions,

56
the magnitude of the beta coefficient for the current college education variable is higher
than the pre-service college education variable, although the magnitudes are not
significantly different (F = 0.18, p = .6742) . The y-standardized coefficient is also larger
(-.1690). I discuss possible reasons for this unexpected finding in the next chapter. The
control variables for patrol officers, job satisfaction, and interpersonal skills training
remain statistically significant with the same sign and similar magnitude.
Table 4: OLS results for testing the impact of an officer earning at least a bachelor’s degree (either pre-service or while an officer) on the authority scale
Variable Beta Linearized Std. Error
p-value
College -.0626 .0255 .016** Male -.0224 .0402 .579 Black .0119 .0515 .818 Other .0919 .0606 .132 Hispanic .0630 .0557 .261 Kids -.0064 .0258 .805 MarriedNow -.0329 .0331 .323 Years -.0002 .0018 .893 Patrol .1052 .0293 .001*** Satisfied -.1407 .0397 .001*** Interpersonal .1081 .0347 .002*** Diversity -.0279 .0340 .415 Ethics .0368 .0254 .151 West -.0182 .0401 .650 Northeast .0146 .0390 .709 South .0521 .0414 .210 COP -0601 .0523 .253 Constant 2.4923 .0909 .000*** * p < .10 ** p < .05 *** p < .01 N = 845; R2 = .1000; F = 4.32 (p = .0000) In Table 5, I present the results testing Hypothesis 2 for the scenario component.
As before with the authority scale, I hypothesized that whatever impact college education
had on answers to the scenario questions would decrease with the use of current college
degree status. The college education variable in Table 5 is marginally statistically
significant and the coefficient actually indicates an undesirable impact of education. This

57
finding should not be overstated, since the p-value is very close to .10, but the coefficient
does indicate that officers who had at least a bachelor’s degree at the time of the survey,
actually saw the scenarios as less serious officer behavior and they were on average less
likely to think fellow officers should be reported for such behavior. Table 5 along with
Table 3 certainly suggest no beneficial impact of a four-year degree in terms of the
scenario questions. The control variables for being currently married, working in patrol,
job satisfaction, diversity training, and small departments all remained statistically
significant with similar coefficients when using the current college education variable.
Years of service was marginally statistically significant was officers with more years of
service more likely to have higher scores on the scenario component.
Table 5: OLS results for testing the impact of an officer earning at least a bachelor’s degree (either pre-service or while an officer) on the scenario component
Variable Beta Robust Std. Error
p-value
College -.1190 .0709 .096* Male -.1727 .1122 .127 Black .1842 .1339 .172 Other -.2387 .1536 .123 Hispanic .1010 .1225 .412 Kids -.0649 .0796 .417 MarriedNow .2957 .0738 .000*** Years .0087 .0046 .061* Patrol -.2904 .0776 .000*** Satisfied .2996 .1196 .014** Interpersonal -.0082 .0767 .915 Diversity .2669 .0937 .005*** Ethics -.0366 .0693 .598 Small .4104 .1411 .004*** Midsize .0645 .1255 .608 West .0632 .1344 .639 Northeast -.0567 .1077 .600 South .0703 .1057 .507 COP .0817 .1136 .473 Constant -.4101 .2419 .093* * p < .10 ** p < .05 *** p < .01 N = 883; R2 = .1012; F = 6.31 (p = .0000)

58
To test Hypothesis 3, I recoded the education variables to examine the impact of
varying levels of postsecondary education. I used three binary variables: one for officer’s
that had received at least a pre-service bachelor’s degree, one for officer’s that received a
pre-service associate’s degree, and one for officer’s that attended some college prior to
joining the police service, but had no degree. These categories are thus mutually
exclusive and high school graduates are the reference group. I present the impact these
three variables have on the authority scale in Table 6. Based on my hypotheses, I
predicted that the pre-service bachelor’s degree would have the greatest impact. The
results show that a pre-service bachelor’s degree (or higher) is a significant predictor of
officer abuse of authority attitudes. The pre-service any college variable, however, is
also statistically significant. These comparisons are to officers with just a high school
education. Wald tests indicate that I cannot reject the null hypothesis that the pre-service
bachelor’s degree and pre-service any college variables are the same in magnitude. The
bachelor’s degree variable is marginally significantly different from the pre-service
associate’s degree variable in magnitude (F = 3.79, p = .054), although the pre-service
associate’s degree variable is statistically insignificant. Both statistically significant
college variables indicate that college education has a desirable impact on attitudes
regarding abuse of authority. These results are confirmed by the y-standardized
coefficients. Officers with at least a pre-service bachelor’s degree compared to officers
with only a high school diploma are expected to have an authority scale score that is
.2712 standard deviations less holding all else constant. As in previous models using the
authority scale, the patrol, job satisfaction, and interpersonal skills training variables are
all statistically significant. The y-standardized coefficients indicate, however, that the

59
magnitudes of the statistically significant education variables are more comparable to the
control variables in this model than in previous models. The y-standardized coefficient
for patrol, for example, is just slightly larger in magnitude (although in the opposite
direction) than pre-service bachelor’s degree (.2752 compared to .2712). This indicates
that officer higher education level is just as important a predictor of officer attitudes as
rank in this model.
Table 6: OLS results for testing the impact of varying pre-service, postsecondary education levels on the authority scale
Variable Beta Linearized Std. Error
p-value
PreBachelor’s -.1005 .0309 .001*** PreAssociate’s -.0211 .0354 .552 PreAnyCollege -.0992 .0303 .001*** Male -.0323 .0390 .408 Black .0246 .0511 .631 Other .0936 .0502 .123 Hispanic .0626 .0561 .267 Kids -.0027 .0241 .911 MarriedNow -.0322 .0325 .324 Years -.0013 .0018 .478 Patrol .1020 .0288 .001*** Satisfied -.1310 .0407 .001*** Interpersonal .1083 .0347 .002*** Diversity -0310 .0336 .358 Ethics .0313 .0256 .109 West -.01433 .0389 .713 Northeast .0086 .0387 .825 South .0487 .0413 .241 COP -.0604 .0538 .264 Constant 2.5484 .0962 .000*** * p < .10 ** p < .05 *** p < .01 N = 845; R2 = .1090; F = 3.81 (p = .0000) In Table 7, I use the same three binary variables to examine their impact on the
scenario component. As in previous models, higher education is not a statistically
significant predictor of scenario component scores. The same set of statistically

60
significant control variables from previous scenario models (married now, patrol officer,
job satisfaction, diversity training, small department) remain significant in this model.
Table 7: OLS results for testing the impact of various pre-service, postsecondary education levels on the scenario component
Variable Beta Robust Std. Error
p-value
PreBachelor’s -.1293 .1046 .219 PreAssociate’s -.0895 .1085 .411 PreAnyCollege -.1080 .0995 .280 Male -.1842 .1115 .101 Black .1963 .1361 .152 Other -.2367 .1539 .127 Hispanic .0983 .1235 .427 Kids -.0591 .0785 .453 MarriedNow .2966 .0745 .000*** Years .0073 .0048 .130 Patrol -.2866 .0756 .000*** Satisfied .2956 .1214 .016** Interpersonal -.0107 .0763 .889 Diversity .2683 .0944 .005*** Ethics -.0320 .0692 .645 Small .4062 .1379 .004*** Midsize .0566 .1234 .647 West .0673 .1347 .618 Northeast -.0675 .1082 .534 South .0615 .1065 .565 COP .0853 .1122 .449 Constant -.3450 .2447 .161 * p < .10 ** p < .05 *** p < .01 N = 883; R2 = .1008; F = 7.09 (p = .0000) To combine Hypotheses 2 and 3, the three education level binary variables were
used with the current level of education data. The results for the authority scale are
presented in Table 8. I only provide the beta coefficients for the education variables.
None of the control variable coefficients or significance levels were substantively
different from the model using pre-service education data. Using the current level of
officer education, all three of the binary variables are statistically significant. Thus,
61
compared to officers with just a high school education, officers with any level of higher
education have less favorable attitudes towards the abuse of police authority. The
magnitude of the beta coefficient for bachelor’s degree is largest, and it is marginally
significantly larger than the coefficient for associate’s degree (F = 3.01, p = .085). These
findings stand in contrast to the pre-service education analysis in Table 6, where the
variable for associate’s degree was not statistically significant. The reason for this
difference is not immediately clear.
The coefficient magnitudes are larger than the model using pre-service education,
as are the y-standardized coefficients. Acquiring a bachelor’s degree at any time
compared to only having a high school education is expected to decrease the authority
scale value by .4197 standard deviations holding all else constant. This is the largest y-
standardized coefficient in magnitude in the entire model, surpassing even job
satisfaction (-.4011), which had been the largest in all previous models analyzing the
authority scale. Using, the unstandardized bachelor’s degree beta coefficient of -.1556, if
we had a hypothetical high school educated officer who was at the mean on the authority
scale (2.3653), then a hypothetical officer with a bachelor’s degree would be expected, on
average, to have an authority scale value of 2.2097 holding all else constant. This
represents about a 6.5 percent decrease in the authority scale value, which indicates a
notable attitudinal difference.

62
Table 8: OLS results for testing the impact of various current, postsecondary education levels on the authority scale
Variable Beta Linearized Std. Error
p-value
Bachelor’s -.1556 .0351 .000*** Associate’s -.0900 .0393 .024*** Any College -.1356 .0352 .000*** * p < .10 ** p < .05 *** p < .01 N = 845; R2 = .1133; F = 4.36 (p = .0000) The analyses from Table 8 were replicated using the scenario component. I
present these in Table 9. As in previous models, none of the postsecondary education
variables were statistically significant.
Table 9: OLS results for testing the impact of various current, postsecondary education levels on the scenario component
Variable Beta Robust Std. Error
p-value
Bachelor’s -.1674 .1168 .155 Associate’s -.1126 .1145 .328 Any College -.0309 .1177 .793 * p < .10 ** p < .05 *** p < .01 N = 883; R2 = .1023; F = 6.28 (p = .0000) In sum, there was mixed support for this study’s hypotheses. As hypothesized,
officers with at least a pre-service bachelor’s degree did have attitudes that were less
favorable towards abusing their authority. However, I did not find this impact with the
questions about abuse of authority scenarios. In addition, the impact of college education
on the authority scale attitudes was not limited exclusively to pre-service four-year
degrees. Contrary to predictions, officers with a four-year degree earned at any point had
more desirable attitudes, as did officers who attended some college, but did not earn a
degree. A pre-service associate’s degree was not significantly related to authority
attitudes, but when I included officers who completed an associate’s degree at any point,

63
there was a statistically significant impact. I discuss possible reasons for these findings
in the next chapter.

64
CHAPTER V: DISCUSSION This study examined how higher education, and particularly the obtainment of a
four-year degree, impacts police officer attitudes regarding abuse of authority. Prior
research in this area has been somewhat limited, and the current study had the benefit of
using survey data from a nationally representative sample of 925 officers from 113 police
departments. I found that higher education does have an impact on at least certain
attitudes regarding police abuse of authority, although the findings, as noted in the prior
chapter, do not fully support the hypotheses of this study. There are three important
issues to discuss related to these findings. First, I will explore why higher education at all
levels impacted the attitude scale. Second, I will suggest reasons why higher education at
any level did not have a significant impact on the scenario component. Finally, I will
discuss the relevance of the control variables.
Contrary to my hypotheses, a pre-service four-year degree was not the only
educational outcome that impacted attitudes. Based on prior research, I predicted that
officers who received their college degree while they became officers would be
influenced by the police culture and would not be as subject to any potential attitude
change associated with college. Instead, when officers who had a four-year degree
acquired at any point were lumped together, the effect of college on officer attitudes
became slightly stronger. Therefore, it appears that post-service college education can
also have an effect on attitudes. Officers may receive financial assistance from their
department to acquire a degree (although the presence of assistance or incentives was not
measured in this dataset). Thus, officers who receive a college degree after joining the
police force may be individuals that wanted to attend college, but did not have the

65
financial resources to do so previously. As a result, these officers may be more
susceptible to the potential positive influences of the college experience. This brings up a
selection issue, because officers self-select to work towards a college degree after
employment. Like the predispositional issues discussed previously (Hudzik, 1978), the
officers that choose to attend college while a part of the police force may be different,
regardless of whether they attend college or not. That is an issue I cannot properly
address with the current data. Still, the results indicate that the impact of college
education may be able to withstand the effects of police culture, workplace pressures, and
other occupational influences. Although this finding was unexpected, it is encouraging in
that it appears a college degree earned at any point can make a difference.
What was more surprising was the finding that any college experience and a
currently held associate’s degree had a positive impact on attitudes when comparing these
officers to those with just a high school diploma. The associate’s degree variable was not
statistically significant for pre-service, but did become statistically significant when I
examined everyone who had received an associate’s degree at any point. The coefficients
for the bachelor’s degree and any college were consistently larger than the coefficient for
associate’s degree. It could be that those officers who attended some college did so in
four-year programs. Thus, the bachelor’s degree experience may have impacted their
attitudes, even though they did not complete a four-year degree. This is just speculation,
because I have no data on the college experiences of those who answered “some college.”
The associate’s degree did not prove to be as powerful a predictor of attitudes as a four-
year degree, but the large magnitude of the impact of attending some college was
unexpected. One-third of officers answered that they had attended “some college,” so

66
future research should unpack this vague concept and get an idea of the educational
experiences of these officers. The results analyzing the authority scale show fairly strong
evidence that postsecondary education has a beneficial impact on abuse of authority
attitudes compared to just a high school diploma. This is significant because
approximately 82 percent of police departments still require just a high school education
(Hickman & Reaves, 2006). The results from Table 8 in particular indicate that any type
of postsecondary education requirement could lead to more desirable abuse of authority
attitudes from officers.
Second, contrary to my hypotheses, officers with a pre-service bachelor’s degree
did not see abuse of authority scenarios as more serious situations that require reporting
the hypothetical officer involved. I also had null findings for other levels of education,
but this was inline with my hypotheses. In fact, if anything, college education had a
small undesirable impact on attitudes and hypothetical behavior in the scenario
component, because the coefficients, while not statistically significant, were negative. It
is not totally clear why the findings differed between the authority scale and the scenario
question component. I am more confident in the results using the authority scale,
however. The scale was made up of nine questions that held together well and tapped
into multiple aspects of abuse of authority. The scenario component, on the other hand,
was made up of two questions each from just two scenarios. The goal of this second
dependent variable was to assess hypothetical behavior, but this variable may not have
done this very effectively. The questions in the scenario component did not ask how the
officer would have acted; instead, they focused on the officer’s assessment of the
seriousness of the scenario behavior and whether he or she would report a fellow officer

67
who engaged in such behavior. Thus, it could be that I used a poor measure of
hypothetical behavior, and additional scenarios with more extensive questions could have
been helpful. It also could be that college education is not strongly related to behaviors
associated with the abuse of authority, which necessitates future research discussed
below. Although I cannot ignore the null findings of the scenario component, because of
its somewhat questionable ability to tap into behavior and its use of fewer attitudinal
questions, the results using the scenario component should not overshadow the consistent
positive results found using the authority scale.
Third, although not the primary focus of this study, some of the findings related to
the control variables merit further discussion. As we might expect, officer rank and job
satisfaction were consistently related to attitudes. It seems logical that officers who are
satisfied with their job would have more desirable attitudes. It also makes sense that
patrol officers would have less desirable attitudes than more highly ranked officers. We
would anticipate that more highly ranked officers earned these promotions because they
avoided abuse of authority situations, and these officers do less work on the streets and
spend more time developing policy, so they may be more likely to express more idealistic
views of policing. Officers who attend college may be doing so in part because they
think it will aid them in receiving a promotion and a higher rank. It is possible then that
education is serving as a proxy for officer desire for success. Still, this drive for success
may be difficult to measure for departments, so in terms of recruitment strategies,
recruiting those with a college education may be one way to identify individuals striving
to be successful (this issue is revisited below). The marriage variable was statistically
significant only for the scenario component, which lends some tentative support to the

68
idea that marriage may serve as a kind of calming influence that assuages attitudes
conducive towards abuse of authority. It is also not clear why officers in small police
departments had significantly higher scenario component scores. It is possible that the
situations in the scenarios are particularly rare in small departments, and officers find
such potential abuses of authority to be more serious. The department size variables did
not have a statistically significant impact on the attitude scale. Diversity training also
proved to have a desirable impact on the scenario component, although there was no
effect on the attitude scale. In contrast, interpersonal skills training appears to have had a
backfire effect, causing significantly less desirable attitudes on the authority scale. This
could also be a result of officers with “bad” attitudes being forced to attend interpersonal
skills training. The question, however, asked about whether officers received
interpersonal skills training at the academy or in-service, so it is difficult to determine
exactly when officers received their training. Police training in general, is incredibly
understudied, so future research should further examine how training may impact these
attitudes (National Research Council, 2004). The latest Bureau of Justice Statistics data
on police training show that 83 percent of training academies use interpersonal skills
training or mediation training, 98 percent use ethics training, and 95 percent have
diversity training (Hickman, 2005). This is in stark contrast to the 18 percent of
departments that require an educational requirement beyond a high school diploma
(Hickman & Reaves, 2006). Only diversity training had any sort of beneficial impact in
this study, so departments may want to further evaluate their training programs and
potentially consider higher education requirements as an additional policy that appears to
be just as effective or more effective than specialized training.

69
Implications for Policy and Practice
The results of the analyses from the previous chapter are relevant to both criminal
justice policy and practice. Results indicate that higher education at any level has some
beneficial impact on abuse of authority attitudes. These findings are not conclusive
evidence that departments need to increase educational standards or require a four-year
degree prior to hiring. Still, there is no evidence from these results that increased
educational standards are unwarranted. Indeed, higher education proved to be just as an
important predictor of attitudes, if not more important than specialized training.
Avoiding abuse of authority situations tends to be a key priority of police agencies.
Complaints about the abuse of authority or excessive use of force strain police-
community relations and can be costly in terms of legal fees to defend civil cases and
budget cuts caused by decreased government trust in the police (Worden, 1996). The
results here make no claim that higher education can reduce abuse of authority behavior
or cut legal costs for police agencies. Nevertheless, there is some promise here for
postsecondary education.
Despite the positive impact of education on the authority scale, the educational
attainment variables all failed to reach statistical significance when examining the
questions related to the abuse of authority scenarios. Roberg and Bonn (2004), however,
make the interesting argument that even if education does not have a proven statistical
impact on officer performance, it may still be useful to increase educational standards,
because a college education is so highly valued in U.S. society and because more
Americans continue to earn postsecondary degrees. Even if performance is not altered,
increased educational standards may bring greater prestige and respect to the field.
Goldstein (1977) notes that a college education requirement would help erase the

70
misconception that being a police officer involves simple tasks that anyone could do.
Similarly Bittner (1970: 83) argues in regards to degree requirements, “the main
objective…is to abolish permanently the idea that is all too prevalent in our society that if
one does not want to take the trouble of becoming something worthwhile, he can always
become a cop.” These arguments are not based on statistically significant regression
coefficients, but instead rely on the general prestige attached with professions. As Fyfe
and colleagues (1997) point out, police have a great deal of discretion and frequently
work unsupervised, much like teachers, and they also make decisions that affect the lives
of citizens, much like prosecutors and judges. Yet, while these professions require a
college degree (and an advanced degree for law), policing lags behind. Fyfe et al. (1997:
287) lament that police, as public servants, are often “lumped together with firefighters
and sanitation workers.” The authors point out that policing requires much more higher-
level thinking and “the only real similarities between them and policing are irregular
hours, danger, and uniforms.” These arguments do not mean that empirical research is
not necessary, but it is important to consider these other issues relevant to police
educational requirements. While the findings here do not point to the necessity of
requiring postsecondary education for police officers, they do point to one area where
such a requirement may have some quantifiable benefits, in addition to the more general
potential benefits for the profession noted above. Even if departments decide not to
require higher education, these results indicate that recruiting potential officers with more
education may be advantageous in terms of bringing in officers with less supportive
attitudes regarding abuse of authority.

71
Finally, this study has a theoretical contribution to make as well. By assessing
whether officers who received a college education have less supportive attitudes towards
the abuse of police authority, this study served as a partial test of Durkheim’s (1961)
theory of moral education. Durkheim was not writing in particular about college
education, but his arguments on morality are applicable to understanding how college
education may impact police officer attitudes. The results presented in the previous
chapter give some credence to Durkheim’s belief that education plays an important role
in instilling morality in society. I do not want to overstate my ability to assess
Durkheim’s arguments with this study, but the results do indicate that the attitudes of
officers with higher education are more likely to be in accord with Durkheim’s (1961)
conception of morality.
Limitations of the Study and Future Research
This study does suffer from some limitations. The major concern is that there are
likely important omitted variables in the model not included in the dataset. This is
especially likely since none of the models included in the previous chapter explained
much more than 10 percent of the variance in each of the dependent variables. As
mentioned before, I was unable to control for potentially important departmental level
variables, because the data linking a respondent to a particular department were
destroyed. Thus, possibly important factors that could influence an individual officer’s
attitudes, such as department policies on the use of force and city demographic factors,
cannot be controlled for. Since officers are nested within departments, additional
departmental data would be ideal to allow for the use of multilevel modeling techniques,
such as hierarchical linear modeling (Raudenbush & Bryk, 2002). In addition, as noted

72
earlier, the predisposition issue remains a concern (Hudzik, 1978). Individuals who
attend college may be different regardless of whether they go to college or not. Evidence
suggests that college itself does have a distinct impact on moral reasoning and moral
behavior (Pascarella & Terenzini, 2005), but I have no extensive pre-college data to
examine what college-educated officers were like before they went to school. It is
important to consider Worden’s (1990: 569) reminder that, “if college-educated recruits
differ in the expected ways from other officers, the source of the difference is irrelevant
for some policy purposes; whatever the reasons for the differences, it might be desirable
to recruit college graduates.” In other words, departments cannot recruit or hire based on
a predisposition, but a college degree is a tangible way for departments to assess these
potential benefits, even if the benefits were not caused directly by attending college. I
also do not have extensive data on the higher education experience of officers. That is, I
do not know where the officers attended school, if they were full-time or part-time
students, if they lived on campus, and what kind of classes they took. The results in this
study seem to indicate, however, that these factors may not be particularly relevant. For
example, results did not vary between pre-service (which was more likely full-time) and
during service education (which likely was part-time). Still, it is possible that the
components of the college experience have an impact on attitudes. Thus, omitted
variable bias is a concern that could be causing model misspecification. Still, the
analyses presented here include all possible relevant controls based on the data and these
controls are more extensive than most prior research. Finally, with the current data, I
cannot determine if the attitudes officers express in the survey translate to specific
behaviors related to the use of force. Since situational factors affect officer use of force
73
behavior (Worden, 1996), questions that assess general attitudes may not effectively tap
into the situational aspect of force use. Still, attitudes are an important avenue for study
and are much easier to assess than officer abuse of authority behavior.
These limitations provide an impetus for future research in this area. As noted in
the second chapter, the literature on the impact of higher education is mixed and
somewhat limited, particularly studies that examine attitudes regarding abuse of
authority. Future research should endeavor to continue to study the impact of higher
education using more extensive data that will address some of the issues noted in the
previous paragraph. In particular, future datasets should include questions regarding the
college experience for college-educated officers. The more we know about what college
was like for an officer, the more successful we will be at isolating factors that may matter
most. In addition, we need data on pre-education background characteristics of officers.
These would include family socioeconomic status, parental occupations, and parental
educational backgrounds. Questions that examined why an individual did or did not
attend college would be very beneficial. An ideal study would also use this survey or
interview data on background characteristics and attitudes and combine it with behavioral
measures, such as direct observation or analysis of official complaint data. A multi-
method study would provide a better assessment of the impact of education (and other
potentially relevant factors) on both attitudes and behavior. Thus, future research should
strive to better address the predisposition issue associated with all prior research on
college education in policing, and should make efforts to better link attitudes and
behaviors in exploring how postsecondary education does (or does not) affect police
abuse of authority. Continued efforts should be made to use large samples of officers

74
from multiple departments when possible. While survey research is a promising avenue
for the future, a randomized experiment is also potentially possible. Officers could be
randomly assigned to receive subsidized education while employed in the police service.
An experimental design, while not likely an easy sell to police departments, would
address many of the predisposition issues noted above.
Conclusions
The findings here suggest that higher education does have some positive impact
on police officer attitudes regarding police abuse of authority. The results do not point to
a particular type of education or a particular time of degree acquirement that completely
explains this impact, although it does appear that a bachelor’s degree has more of an
effect than an associate’s degree. This result appeared for more general attitudes related
to abuse of authority, but not for questions about specific hypothetical scenarios. The
somewhat mixed findings and limitations noted above make clear the need for future
research in this area. Nonetheless, this study has the major benefit of using a nationally
representative sample that asked a variety of questions about police use of authority.
These findings are generalizable to the universe of United States police officers. No
other police education or abuse of authority sample has produced findings that generalize
so widely. I was also able to examine different educational outcomes, different times of
degree acquirement, and a variety of demographic and work-related controls. The results
here are not entirely conclusive and future empirical research is needed to further explore
how higher education affects police officer attitudes and the policing profession more
generally. Still, this study is an important addition to the very limited literature on how
higher education impacts police officer attitudes associated with abuse of authority.

75
APPENDICES
APPENDIX A: AUTHORITY SCALE QUESTIONS
Questions used to create the authority scale (all questions had the following possible answer choices: strongly agree, agree, disagree, strongly disagree) For all questions, possible values range from 1-4. 1 corresponds to “strongly disagree” and 4 corresponds to “strongly agree.”
Question Observations Mean Std. Dev. “Police officers are not permitted to use as much force as is often necessary in making arrests.”
912 2.2851 0.7043
“Police officers should be allowed to use physical force in response to verbal abuse.”
920 1.8152 0.5545
“It is sometimes acceptable to use more force than is legally allowable to control someone who physically assaults an officer.”
912 2.0724 0.7343
“Whistle blowing is not worth it.” 904 2.1571 0.6569 “Police department rules about the use of force should not be any stricter than required by law.”
915 2.7049 0.6191
“Always following the rules is not compatible with getting the job done.”
919 2.3906 0.6850
“The code of silence is an essential part of the mutual trust necessary to good policing.”
905 2.0055 0.6159
“The public is too concerned with police brutality.” 918 2.6612 0.7411 “The newspapers and TV in this country are too concerned with police brutality.”
920 3.1554 0.7484

76
APPENDIX B: FULL-TEXT OF SCENARIOS
Full-text of the scenarios presented to officers in the second section of the survey is presented below. Officers were randomly assigned to hear one of the versions of the first scenario and all heard the same second scenario. Responses to these surveys are used to create the scenario component for the second dependent variable. First Scenario, Version A While patrolling his beat, an officer notices several youths standing on a corner smoking cigarettes and talking to one another. The officer tells the youths to break it up and leave the area. The youths say, “We’re not doing anything. Why are you hassling us?”. The officer gets out of the car and orders the youths to place their hands up against the wall of a building. They refuse. The officer throws them against the wall and searches them. Finding nothing, the officer uses demeaning language, tells them that this “will teach you to respect the law” and “I’d better not see you here again,” and gets in his patrol car and drives off.” First Scenario, Version B In a community meeting, citizens told police that they were very concerned about groups of rowdy youths hanging out on street corners. After the meeting, an officer who participated in the meeting notices several youths standing on a corner smoking cigarettes and talking to one another. The officer tells the youths to break it up and leave the area. The youths say, “We’re not doing anything. Why are you hassling us?”. The officer gets out of the car and orders the youths to place their hands up against the wall of a building. They refuse. The officer throws them against the wall, and searches them. Finding nothing, the officer uses demeaning language, tells them that this “will teach you to respect the law” and “I’d better not see you here again,” and gets in his patrol car and drives off. Second Scenario An officer has a handcuffed suspect sitting at his desk while he fills out the necessary paperwork. With no provocation from the officer, the suspect suddenly spits in the face of the officer. The officer immediately pushes the suspect in the face, causing the suspect to fall from the chair onto the floor.

77
APPENDIX C: DESCRIPTIVE STATISTICS
Table of descriptive statistics for independent, dependent, and control variables Variable # of Obs. Mean Std. Dev. Minimum Maximum Main Independent Variables PreCollege 924 0.2359 0.4248 0 1 College 924 0.3344 0.4720 0 1 PreBachelor’s 924 0.2359 0.4248 0 1 PreAssociate’s 924 0.1461 .3534 0 1 PreAnyCollege 924 0.2825 .4504 0 1 Bachelor’s 924 0.3344 0.4720 0 1 Associate’s 924 0.1883 0.3912 0 1 AnyCollege 924 0.3279 0.4697 0 1 Dependent Variables Authority 861 2.3653 0.3704 1.1111 3.6667 Scenario 905 0 1 -2.5160 1.7176 Scenario ?s: Serious A 920 3.8239 1.0024 1 5 Report A 912 2.8794 0.9731 1 4 Serious B 914 2.9726 1.2785 1 5 Report B 914 2.5908 1.1110 1 4 Control Variables Male 924 0.9177 0.2749 0 1 Black 921 0.1020 0.3029 0 1 Other 921 0.0858 0.2802 0 1 Hispanic 922 0.0911 0.2879 0 1 Age* 922 37.7299 8.7187 22 66 Kids 920 0.5708 0.4952 0 1 EverMarried 922 0.8622 0.3448 0 1 MarriedNow 922 0.7397 0.4390 0 1 Years 924 12.8561 8.4570 0 38 Patrol 924 0.5563 0.4971 0 1 Satisfied 923 0.9155 0.2783 0 1 Interpersonal 919 0.7421 0.4377 0 1 Diversity 923 0.8797 0.4377 0 1 Ethics 917 0.6314 0.4827 0 1 Small 925 0.1232 0.3289 0 1 Midsize 925 0.7059 0.4559 0 1 West 925 0.1978 0.3986 0 1 Northeast 925 0.2541 0.4356 0 1 South 925 0.3416 0.4745 0 1 COP 921 0.9316 0.2526 0 1
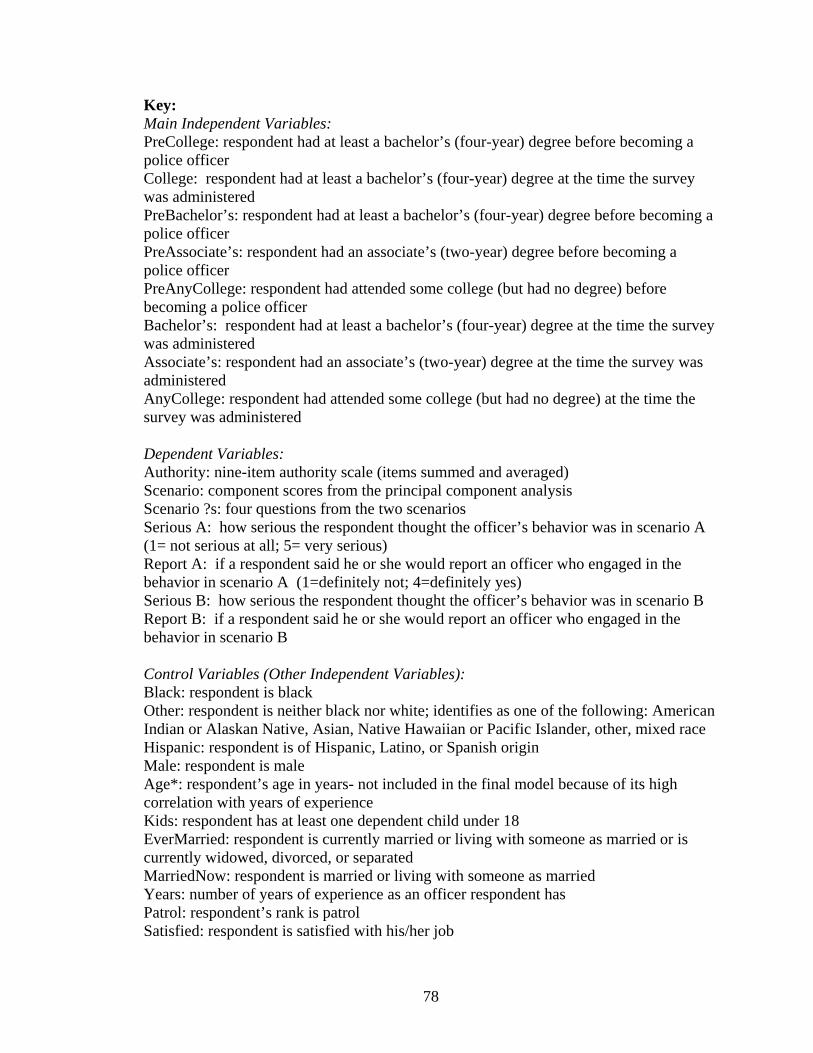
78
Key: Main Independent Variables: PreCollege: respondent had at least a bachelor’s (four-year) degree before becoming a police officer College: respondent had at least a bachelor’s (four-year) degree at the time the survey was administered PreBachelor’s: respondent had at least a bachelor’s (four-year) degree before becoming a police officer PreAssociate’s: respondent had an associate’s (two-year) degree before becoming a police officer PreAnyCollege: respondent had attended some college (but had no degree) before becoming a police officer Bachelor’s: respondent had at least a bachelor’s (four-year) degree at the time the survey was administered Associate’s: respondent had an associate’s (two-year) degree at the time the survey was administered AnyCollege: respondent had attended some college (but had no degree) at the time the survey was administered Dependent Variables: Authority: nine-item authority scale (items summed and averaged) Scenario: component scores from the principal component analysis Scenario ?s: four questions from the two scenarios Serious A: how serious the respondent thought the officer’s behavior was in scenario A (1= not serious at all; 5= very serious) Report A: if a respondent said he or she would report an officer who engaged in the behavior in scenario A (1=definitely not; 4=definitely yes) Serious B: how serious the respondent thought the officer’s behavior was in scenario B Report B: if a respondent said he or she would report an officer who engaged in the behavior in scenario B Control Variables (Other Independent Variables): Black: respondent is black Other: respondent is neither black nor white; identifies as one of the following: American Indian or Alaskan Native, Asian, Native Hawaiian or Pacific Islander, other, mixed race Hispanic: respondent is of Hispanic, Latino, or Spanish origin Male: respondent is male Age*: respondent’s age in years- not included in the final model because of its high correlation with years of experience Kids: respondent has at least one dependent child under 18 EverMarried: respondent is currently married or living with someone as married or is currently widowed, divorced, or separated MarriedNow: respondent is married or living with someone as married Years: number of years of experience as an officer respondent has Patrol: respondent’s rank is patrol Satisfied: respondent is satisfied with his/her job

79
Interpersonal: respondent has taken a class in interpersonal skills or interpersonal relations in the training academy or sometime since becoming a police officer Diversity: respondent has taken a class in human diversity, cultural differences, cultural awareness, or ethnic sensitivity in the training academy or sometime since becoming a police officer Ethics: respondent has taken a separate class in ethics in the training academy or sometime since becoming a police officer Small: respondent’s department is small (10-24 full time officers) Midsize: respondent’s department is midsized (25 or more full time officers, but not among the nine largest in the nation) West: respondent’s department is located in the Western United States (see footnote 2 for a list of states by region) South: respondent’s department is located in the Southern United States Northeast: respondent’s department is located in the Northeastern United States COP: respondent’s department is involved in community-oriented policing

80
APPENDIX D: MISSING DATA ANALYSIS
Missing data analysis using imputed dataset to examine whether the impact of a pre-service bachelor’s degree varies with a larger set of observations. The N in this analysis increased to 886 (from 845 in Table 2). However, the coefficients were not greatly altered. Two variables (other race and ethics training) reached marginal statistical significance, but the substantive findings did not change. OLS results for testing the impact of a pre-service bachelor’s degree on the authority scale using imputed data
Variable Beta Linearized Std. Error
p-value
PreCollege -.0604 .0250 .017** Male -.0203 .0379 .593 Black .0182 .0490 .710 Other .0983 .0578 .092* Hispanic .0656 .0541 .228 Kids .0031 .0242 .900 MarriedNow -.0434 .0318 .174 Years -.0002 .0018 .896 Patrol .1212 .0288 .000*** Satisfied -.1337 .0380 .001*** Interpersonal .1053 .0333 .002*** Diversity -.0246 .0322 .446 Ethics .0428 .0241 .078* West -.0178 .0406 .662 Northeast .0181 .0375 .630 South .0575 .0409 .154 COP .0301 .0301 .321 Constant 2.3943 .0621 .000*** * p < .10 ** p < .05 *** p < .01 N = 886; R2 = .1014

81
REFERENCES Adams, Kenneth. 1996. Measuring the prevalence of police abuse of force. In Police violence: Understanding and controlling police abuse of force, eds. William A. Geller and Hans Toch, New Haven, CT: Yale University Press, 52-93. Adams, Kenneth. 2005. What we know about police use of force. In Critical issues in policing: Contemporary readings, eds. Roger G. Dunham and Geoffrey P. Alpert, Long Grove, IL: Waveland, 451-67. Arnold, Donald F. Sr., and Lawrence A. Poneman. 1991. Internal auditors’ perceptions of whistle-blowing and the influence of moral reasoning: An experiment. Auditing: A Journal of Practice & Theory 10:1-15. Astin, Alexander W. 1977. Four critical years: Effects of college on beliefs, attitudes, and knowledge. San Francisco: Jossey-Bass. Azjen, Icek, and Martin Fishbein. 1977. Attitude-behavior relations: A theoretical analysis and review of empirical research. Psychological Bulletin 84:888-918. Azjen, Icek, and Martin Fishbein. 2005. The influence of attitudes on behavior. In The handbook of attitudes, eds. Dolores Albarracín, Blair T. Johnson, and Mark P. Zanna, Mahwah, NJ: Lawrence Erlbaum, 173-222. Babbie, Earl. 1990. Survey research methods. Belmont, CA: Wadsworth.
Barker, Thomas, and David Carter. 1994. A typology of police deviance. In Police deviance, eds. Thomas Barker and David Carter, Cincinnati: Anderson, 3-12. Binder, David A. 1983. On the variances of asymptotically normal estimators from complex surveys. International Statistical Review / Revue Internationale de Statistique 51:279-92. Bittner, Egon. 1970. The functions of the police in modern society. Washington, DC: National Institute of Mental Health. Bowker, Lee H. 1980. A theory of the educational needs of law enforcement officers. Journal of Contemporary Criminal Justice 1:17-24. Braback, Mary. 1984. Ethical characteristics of whistle blowers. Journal of Research in Personality 18:41-53. Brandl, Steven G., Meghan S. Stroshine, and James Frank. 2001. Who are the

82
complaint-prone officers? An examination of the relationship between police officers’ attributes, arrest activity, assignment, and citizens’ complaints about excessive force. Journal of Criminal Justice 29:521-29. Brick, J. Michael, and Graham Kalton. 1996. Handling missing data in survey research. Statistical Methods in Medical Research 5:215-38. Carlan, Philip E., and Ferris R. Byxbe. 2000. The promise of humanistic policing: Is higher education living up to societal expectation. American Journal of Criminal Justice 24:235-46. Carte, Gene E., and Elaine H. Carte. 1975. Police reform in the United States: The era of August Vollmer, 1905-1932. Berkeley, CA: University of California Press. Carter, David L., and Allen D. Sapp. 1990. The evolution of higher education in law
enforcement: Preliminary findings from a national study. Journal of Criminal Justice Education 1:59-85.
Cascio, Wayne F. 1977. Formal education and police officer performance. Journal of Police Science and Administration 5:89-96. Cohen, Bernard, and Jan M. Chaiken. 1973. Police background characteristics and performance. New York: Rand Corporation. Costello, Anna B., and Jason W. Osborne. Best practices in exploratory factor analysis: Four recommendations for getting the most from your analysis. Practical Assessment, Research & Evaluation 10:1-9. Cordner, Gary W. 2005. Community policing: Elements and effects. In Critical issues in policing: Contemporary readings, eds. Roger G. Dunham and Geoffrey P. Alpert, Long Grove, IL: Waveland, 401-18. Cummings, Rhonda, Lynn Dyas, Cleborne D. Maddux, and Art Kochman. 2001. Principled moral reasoning and behavior of preservice teacher education students. American Educational Research Journal 38:143-158. Cunningham, Scott. 2006. The Florida research. The Police Chief 73:20. Decker, Lisa K., and Robert G. Huckabee. 2002. Raising the age and educational requirements for police officers: Will too many women and minority candidates be excluded? Policing: An International Journal of Police Strategies and Management 25:789-802. Durkheim, Emile. [1922] 1956. Education and sociology. Glencoe, IL: Free Press. Durkheim, Emile. [1925] 1961. Moral education. Glencoe, IL: Free Press.

83
Engel, Robin Shepard, and Robert E. Worden. 2003. Police officers’ attitudes, behavior and supervisory influences: An analysis of problem solving. Criminology 41:131- 66. Fabriger, Leandre R., Duane T. Wegener, Robert C. MacCallum, and Erin J. Strahan. 1999. Evaluating the use of exploratory factor analysis in psychological research. Psychological Methods 4:272-99. Fazio, Russell H. 1986. How do attitudes guide behavior? In Handbook of motivation and Cognition: Foundations of social behavior, eds. Richard M. Sorrentino and Edward Tory Higgins, New York: Guildford Press, 204-43. Feldman, Kenneth A., and Theodore M. Newcomb. 1994. The impact of college on students. New Brunswick, NJ: Transaction. Finckenauer, James O. 2005. The quest for quality in criminal justice education. Justice Quarterly 22:413-26. Fyfe, James. 1988. Police use of deadly force: Research and reform. Justice Quarterly 5:165-205. Fyfe, James J., Jack R. Greene, William F. Walsh, Orlando W. Wilson, and Roy C. McLaren. 1997. Police administration. New York: McGraw-Hill. Geller, William A., and Hans Toch. 1996. Understanding and controlling police abuse of force. In Understanding and controlling police abuse of force, eds. William A. Geller and Hans Toch, New Haven, CT: Yale University Press, 52-93. Goldstein, Herman. 1977. Policing a free society. Cambridge, MA: Ballinger. Gorsuch, Richard L. 1974. Factor analysis. Philadelphia: W.B. Saunders. Greene, Jack R. 2000. Community policing in America: Changing the nature, structure, and function of police. In Criminal justice 2000, volume 3: Policies, processes, and decisions of the criminal justice system, ed. Julie Horney, Washington, DC: National Institute of Justice, US Department of Justice, 299-370. Guller, Irving B. 1972. Higher education and policemen: Attitudinal differences between
freshman and senior police college students. The Journal of Criminal Law, Criminology, and Police Science 63:396-401.
Hickman, Matthew J. 2005. State and local law enforcement training academies, 2002. Washington, DC: Bureau of Justice Statistics, US Department of Justice. Hickman, Matthew J., and Brian A. Reaves. 2006. Local police departments, 2003.

84
Washington, DC: Bureau of Justice Statistics, US Department of Justice. Hickman, Matthew J., Alex R. Piquero, Brian A. Lawton, and Jack R. Greene. 2001. Applying Tittle’s control balance theory to police deviance. Policing: An International Journal of Police Strategies and Management 24:497-519. Hudzik, John K. 1978. College education for police: Problems in measuring component and extraneous variables. Journal of Criminal Justice 6:69-81. Kappeler, Victor E., Allen D. Sapp, and David L. Carter. 1992. Police officer higher education, citizen complaints and departmental rule violations. American Journal of Police 11:37-54. Kappeler, Victor E., Richard D. Sluder, and Geoffrey P. Alpert. 2005. Breeding deviant conformity: The ideology and culture of the police. In Critical issues in policing:
Contemporary readings, eds. Roger G. Dunham and Geoffrey P. Alpert, Long Grove, IL: Waveland, 231-57.
Klockars, Carl B. 1985. The idea of police. Beverly Hills, CA: Sage. Klockars, Carl B., Sanja Kutnjak Ivkovich, William E. Harver, and Maria R. Haberfeld. 2000. The measurement of police integrity. Washington, DC: National Institute of Justice Research in Brief, US Department of Justice. Kohlberg, Lawrence. 1981. Essays on moral development. The philosophy of moral development: Moral states and the idea of justice. San Francisco: Harper & Row. Kohlberg, Lawrence. 1984. Essays on moral development. The psychology of moral development: The nature and validity of moral stages. San Francisco: Harper & Row. Lear, Elmer N. 1961. Emile Durkheim as educator. Journal of Educational Sociology 34:193-204. LeFoux, John C., and Robert R. Hazelwood. 1985. Police attitudes and beliefs towards rape. Journal of Police Science and Administration 13:211-21. Lersch, Kim M., and Linda L. Kunzman. 2001. Misconduct allegations and higher education in a southern sheriff’s department. American Journal of Criminal Justice 25:161-72. Lester, David. 1996. Officer attitudes toward police use of force. In Police violence:
Understanding and controlling police abuse of force, eds. William A. Geller and Hans Toch, New Haven, CT: Yale University Press, 180-90.
Long, J. Scott. 1997. Regression models for categorical and limited dependent variables.

85
Thousand Oaks, CA: Sage. Maguire, Edward R., Jeffrey B. Snipes, Craig D. Uchida, and Margaret Townsend. 1998. Counting cops: Estimating the number of police departments and police officers in the USA. Policing: An International Journal of Police Strategies and Management 21:97-120. McKelvey, Richard D., and William Zavoina. 1975. A statistical model for the analysis of ordinal level dependent variables. Journal of Mathematical Sociology 4:103- 20. Muir, William K. 1977. Police: Streetcorner politicians. Chicago: University of Chicago Press. National Research Council. 2004. Explaining police behavior: People and situations. In Fairness and effectiveness in policing: The evidence. Committee to Review Research on Police Policy and Practices, eds. Wesley Skogan and Kathleen Frydl. Committee on Law and Justice, Division of Behavioral and Social Sciences and Education, Washington, DC: The National Academies Press, 109-54. Nichols, Robert C. 1967. Personality change and the college. American Educational Research Journal 4:173-90. Nunnally, Jum C., and Ira H. Bernstein. 1994. Psychometric theory. New York: McGraw-Hill. Palombo, Bernadette J. 1995. Academic professionalism in law enforcement. New York: Garland. Paoline, Eugene A. 2001. Rethinking police culture: Officers’ occupational attitudes. New York: LFB Scholarly. Paoline, Eugene A., and William Terrill. 2007. Police education, experience, and use of force. Criminal Justice and Behavior 34:179-96. Paoline, Eugene A., Stephanie A. Myers, and Robert E. Worden. 2000. Police culture, individualism, and community policing: Lessons from two police departments. Justice Quarterly 17:575-605. Parker, L. Craig, Martin Donnelly, David Gerwitz, Joan Marcus, and Victor Kowalewski. 1976. Higher education: Its impact on police attitudes. The Police Chief 43:33-5. Pascarella, Ernest T., and Patrick T. Terenzini. 1991. How college affects students: Findings and insights from twenty years of research. San Francisco: Jossey-Bass.

86
Pascarella, Ernest T., and Patrick T. Terenzini. 2005. How college affects students. Volume 2, a third decade of research. San Francisco: Jossey-Bass. Pate, Anthony M., and Lorie A. Fridell. 1993. Police use of force: Official reports, citizen complaints, and legal consequences, volume 1. Washington, DC: Police Foundation. Polk, O. Elmer, and David A. Armstrong. 2001. Higher education and law enforcement career paths: Is the road to success paved by degree? Journal of Criminal Justice Education 12:77-99. Raudenbush, Stephen W., and Anthony S. Bryk. 2002. Hierarchical linear models: Applications and data analysis methods. 2nd ed. Thousand Oaks, CA: Sage. Rest, James. 1994. Background: Theory and research. In Moral development in the professions: Psychology and applied ethics, eds. James Rest and Darcia Narvaez, Hillsdale, NJ: Erlbaum, 1-25. Rest, James, and Darcia Narvaez. 1991. The college experience and moral development. In Handbook of moral behavior and development, eds. William M. Kurtines and Jacob L. Gewirtz, Hillsdale, NJ: Erlbaum, 229-45. Roberg, Roy R. 1978. An analysis of the relationships among higher education, belief systems, and job performances of patrol officers. Journal of Police Science and Administration 6:336-44. Roberg, Roy, and Scott Bonn. 2004. Higher education and policing: Where are we now? Policing: An International Journal of Police Strategies & Management 27:469- 86. Rokeach, Milton. 1954. The nature and meaning of dogmatism. Psychological Review 70:304-09. Royston, Patrick. 2005. Multiple imputation of missing values: Update. The Stata Journal 5:1-14. Sampson, Robert J., John H. Laub, and Christopher Wimer. 2006. Does marriage reduce crime? A counter-factual approach to within-individual causal effects. Criminology 44:465-508. Sherman, Lawrence W., and the National Advisory Commission on Higher Education for Police Officers. 1978. The quality of police education. Washington, DC: Police Foundation. Sherman, Lawrence W., and Mark Blumberg. 1981. Higher education and police use of deadly force. Journal of Criminal Justice 9:317-31.

87
Shernock, Stanley K. 1992. The effects of college education on professional attitudes among police. Journal of Criminal Justice Education 3:71-92. Shusta, Robert M., Deena R. Levine, Philip R. Harris, and Herbert Z. Wong. 1995. Multicultural law enforcement: Strategies for peacekeeping in a diverse society. Upper Saddle River, NJ: Prentice Hill. Smith, Alexander B., Bernard Locke, and Abe Fenster. 1970. Authoritarianism in policemen who are college graduates and non-college police. Journal of Criminal Law, Criminology, and Police Science 61:313-16. Smith, Dennis C., and Elinor Ostrom. 1974. The effects of training on police attitudes and performance: A preliminary analysis. In The potential for reform of criminal justice, ed. Herbert Jacob, Beverly Hills, CA: Sage, 45-81. Terrill, William. 2001. Police coercion: Application of the force continuum. New York: LFB Scholarly. Terrill, William, and Stephen D. Mastrofski. 2002. Situational and officer-based determinants of police coercion. Justice Quarterly 19:215-48. Terrill, William, and John McClusky. 2002. Citizen complaints and problem officers: Examining officer behavior. Journal of Criminal Justice 30:143-55. Trevino, Linda, K. 1992. Moral reasoning and business ethics: Implications for research, education, and management. Journal of Business Ethics 11:445-59. Trojanowicz, Robert C., and Thomas G. Nicholson. 1976. Comparison of behavioral styles of college graduate police officers with non-college going police officers. The Police Chief 43:56-9.
Truxillo, Donald M., Suzanne R. Bennett, and Michelle L. Collins. 1998. College education and police job performance: A ten-year study. Public Personnel Management 27:269-80. Vellicer, Wayne F., and Douglas N. Jackson. 1990. Component analysis versus common factor analysis: Some further observations. Multivariate Behavioral Research 25:97-114. Weiner, Norman L. 1974. The effect of education on police attitudes. Journal of Criminal Justice 2:317-28. Weisburd, David, Rosann Greenspan, Edwin E. Hamilton, Kellie A. Bryant, and Hubert Williams. 2001. The abuse of police authority: A national study of police officers’ attitudes. Washington, DC: Police Foundation.

88
Whetstone, Thomas S. 2000. Getting stripes: Educational achievement and study strategies used by sergeant promotional candidates. American Journal of Criminal Justice 24:247-57. White, Susan O. 1972. A perspective on police professionalization. Law & Society Review 7:61-86. Wickersham Commission. 1931. Wickersham report on police. The American Journal of Police Science. 2:337-48. Wilson, Hugh. 1999. Post-secondary education of the police officer and its effect on the frequency of citizens [sic] complaints. Journal of California Law Enforcement 33:3-10. Wilson, Orlando W. 1953. August Vollmer. The Journal of Criminal Law, Criminology, and Police Science 44:91-103. Williams, Jimmy J., and Gary Hester. 2003. Sheriff law enforcement officers and the use of force. Journal of Criminal Justice 31:373-81. Williams, Rick L. 2000. A note on robust variance estimation for cluster-correlated data. Biometrics 56:645–46. Worden, Robert E. 1989. Situational and attitudinal explanations of police behavior: A theoretical reappraisal and empirical assessment. Law & Society Review 23:667- 711. Worden, Robert E. 1990. A badge and a baccalaureate: Policies, hypotheses, and further evidence. Justice Quarterly 7:565-92. Worden, Robert E. 1996. The causes of police brutality: Theory and evidence on police use of force. In Police violence: Understanding and controlling police abuse of force, eds. William A. Geller and Hans Toch, New Haven, CT: Yale University Press, 23-51. Worden, Robert E., and Shelagh E. Catlin. 2002. The use and abuse of force by police. In Policing and misconduct, eds. Kim Michelle Lersch and Maria L. Dantzker, Upper Saddle River, NJ: Pearson Education, 85-120.