Embed Size (px)
Citation preview
STOCKHOLM SCHOOL OF ECONOMICS
DEPARTMENT OF ACCOUNTING
MASTER‟S THESIS
The Impact of Intrinsic Value on the Investment Decision
An empirical study of Swedish equity funds with ethical restrictions
Abstract
This study examines the impact of intrinsic value in fund managers‟ decision making. The study
focuses on restricting factors that limit or influence the fund manager‟s investment decisions of
Swedish equity funds with ethical restrictions. The ethical profile is examined and we investigate
how it affects the impact of intrinsic value in particular.
We have performed a series of mini case-studies on seven funds. We have interviewed five fund
managers, one equity analyst and two ethical analysts. We have also used the quarterly data of the
funds to increase the validity of our study.
Our conclusion is that there exist several restricting factors that limit the impact of intrinsic value in
the investment decision. The restricting factors leads to compensating behavior, where the
managers strive to cover exposure to index developments created through the restricting factors.
This has been the rationale behind many investment decisions, rather than considerations of
intrinsic value. The ethical profile in particular has led to varying degrees of compensating behavior
depending on the range of companies excluded. Other important restricting factors are the 5-10-40
rule, levels of in-house expertise and the liquidity of the investment objects.
Authors: Erik Jacobsson (20197) and Emelie Palm (20298)
Supervisor: Niclas Hellman
Discussants: Alfred Gunnevik (20596), Albin Nylén (20586) and Anders Svensson (20593)
Presentation: December 15, 2008; 15:15-17:00
Acknowledgements: Our appreciation goes out to Niclas Hellman for valuable discussions and advices.
Table of Contents
1. INTRODUCTION ........................................................................................................................................................ 1
2. FRAME OF REFERENCES ....................................................................................................................................... 3
2.1 INVESTMENT DECISIONS ........................................................................................................................................... 3
2.2 INTRINSIC VALUATION FACTORS .............................................................................................................................. 5
2.3 RESTRICTING FACTORS AND PREVIOUS RESEARCH ................................................................................................... 6
3. METHODOLOGY ....................................................................................................................................................... 9
3.1 FUND SELECTION .................................................................................................................................................... 10
3.2 DATA ANALYSIS ..................................................................................................................................................... 12
3.3 INTERVIEWS ............................................................................................................................................................ 13
4. RESULTS .................................................................................................................................................................... 15
4.1 THE SETTING FOR THE FUND MANAGERS‟ INVESTMENT DECISION ......................................................................... 15
4.1.1 Characteristics of the Stockholm Stock Exchange .......................................................................................... 16
4.1.2 Performance Determining Indices and Tracking Error .................................................................................. 16
4.1.3 Compensating Behavior Defined .................................................................................................................... 21
4.1.4 Summary ......................................................................................................................................................... 22
4.2 FORMAL RESTRICTIONS........................................................................................................................................... 22
4.2.1 The 5-10-40 Rule ............................................................................................................................................. 22
4.2.2 Ethical Restrictions ......................................................................................................................................... 25
4.2.3 Compensating Behavior .................................................................................................................................. 30
4.2.4 Summary ......................................................................................................................................................... 32
4.3 EXPERTISE WITHIN THE FUND BROKER ................................................................................................................... 33
4.3.1 Time-horizons ................................................................................................................................................. 37
4.3.2 Compensating Behavior .................................................................................................................................. 39
4.3.3 Summary ......................................................................................................................................................... 39
4.4 THE LIQUIDITY OF THE INVESTMENT OBJECT .......................................................................................................... 39
4.4.1 Compensating Behavior .................................................................................................................................. 42
4.4.2 Summary ......................................................................................................................................................... 42
5. DISCUSSION OF THE EMPIRICAL RESULTS ................................................................................................... 43
5.1 SUMMARY OF THE MOST IMPORTANT RESULTS ........................................................................................................ 43
5.2 DISCUSSION OF RESULTS ......................................................................................................................................... 46
5.3 VALIDITY ................................................................................................................................................................ 48
6. REFERENCES .............................................................................................................................................................. 49
APPENDIX A .................................................................................................................................................................. 52
1
1. Introduction
98 % of all Swedes save in funds. The open-ended equity fund is the most common fund, and 55 %
of the investors place their money in this investment vehicle (www.fondspara.se). Most people are
therefore affected by the investment decisions made by the many fund managers that strive to create
value for the savers. But how does a fund manager make his decisions? What factors influence his
decision making? This thesis aims to contribute to the understanding of the investment decision
process for equity fund managers.
The starting point for our essay is that an unrestricted investor that wish to maximize the value for
the fund-investors will make his investment decision based on intrinsic value. The purpose of this
thesis is to investigate the impact of intrinsic value on the investment decisions of a fund manager
who is faced with restrictions. We have chosen to make a series of mini case-studies of actively
managed Swedish equity funds that are marketed as ethical. The ethical branding has different
consequences for the different funds, but common for all funds is that a number of companies have
been negatively screened so that managers are faced with a restricted list of investment objects.
Other characteristics of the study objects constitute further restrictions, such as only being able to
invest in Swedish equity. Restricting factors, as defined by this thesis, are factors that limit or
influence the fund manager's investment decision. We aim to investigate when restricting factors
cause the investor to forgo intrinsic value.
A key concept in our thesis is intrinsic value. We have chosen to use Penman's (2007, p. 4)
definition. Intrinsic value is,
“the worth of an investment that is justified by the information about its payoffs.”
Intrinsic value builds on the notion that a best-estimate value can be calculated for a security based
on financial information available to the fund manager. This value is dependent on the future
payoffs and is calculated without reference to market price or any other benchmark. A stock can be
undervalued if the stock quotation is lower than the intrinsic value, or overpriced if the stock
quotation exceeds the intrinsic value. An active fund manager will try to discover mispriced stocks
and try to exploit them (Penman, 2007).
2
All funds we have examined claim to be active. Some of the funds also express at their website that
they base their investment decisions on fundamental analysis1. However, Hellman (2000) found
empirical evidence of investor contexts and market premises that has restricted or reinforced the
investor‟s fundamental opinion of an investment object. He studied the equity investment decision
of eight large Swedish institutional investors2. We have found no other previous studies that have
drawn conclusions of the impact of intrinsic value in the investment decision of fund managers at a
disaggregated level.
In light of this we have formulated three questions to guide us through our thesis:
Q1: What restricting factors exist that limit the impact of intrinsic value on fund managers‟
investment decisions?
Q2: What specific restricting factors does the ethical profile convey?
Q3: What is the relative importance of intrinsic value in the fund managers‟ investment decisions?
Q1 and Q2 are easier to answer than Q3 is, because the answers will encompass our empirical
observations in a direct way. Therefore we have structured our results in section 4 after the former
two questions. Results are presented grouped as factors related to formal restricting factors,
restricting factors related to in-house expertise and investment object specific restricting factors. Q3
will be directly addressed in our discussion of our results in section 5. Section 2 deals with our
frame of reference and section 3 treats our methodology.
1 AktieAnsvar (http://www.aktieansvar.se/artiklar/varafonder/sverige/index.cfm?show=mal) and Swebank Robur
(www.swedbankrobur.se) express explicitly at their website that fundamental analysis is used. Other funds
implicitly state this.
2 Two fund management companies, one investment company (closed-end fund), two life insurance companies, one life
insurance company/fund management company, one foundation and one non-life insurance company
3
2. Frame of References
In our Frame of References we explore the concepts of the investment decision, intrinsic valuation
factors and restricting factors based on theory and previous research. While our specific study
subject is distinguished from rationality and rational choices, this has served as a starting point for
our study. We use rationality and the empirical studies‟ of Koller et al (2005) to motivate the focus
on intrinsic value.
2.1 Investment Decisions
The Economic Approach, as described by Becker (1978. p 5) describes a way to look at rationality:
''The combined assumptions of maximizing behavior, market equilibrium and stable preferences,
used relentlessly and unflinchingly, form the heart of the economic approach [...]''
Man is hereby described as an actor who maximizes his wealth or utility given his preferences.
Becker's Economic Approach is part of a framework for understanding economic and social
behavior. This framework is often called Rational Choice Theory. There is a large body of theory
concerning how to model decisions faced by a rational investor, such as the rational actor described
by Becker.
Raiffa (1968) describes a systematic approach for individuals who are faced with problems of
choice. Different courses of action are carefully modelled, and payoff and probabilities tied to the
choices are calculated. The choices can then be ranked according to the expected return of each
alternative action (Raiffa, 1968).
According to the Rational Choice Theory, the rational decision maker will base his decision on
future expected payoffs of the shares. But this approach can be questioned. The fund manager might
have other preferences than to maximize the funds wealth, and act thereafter. Is the manager then
being rational or not? To enter a discussion of rationality we believe would take focus from the
investment decision process that we want to have in focus. Thurén (1996) discusses different kind
of problems with rationality and creates a definition that also takes those problems into account.
Thurén (1996, p. 120) defines rational action as,
“to chose the mean that most reliably takes one to the desired goal, given one‟s knowledge of the
path.”
4
With this definition we can assume fund value-maximization as our goal and this way conclude that
it is rational to let intrinsic value play a part in the investment decision. In addition to this
theoretical motivation for the use of intrinsic value, Koller et al (2005) argue for the practical
applicability of fundamental analysis in investment decisions. The authors‟ studies show that
companies with higher returns and higher growth are valued higher by the stock market. Market-
wide price deviations have been short-lived during the past four decades, and the market has
corrected itself to price levels consistent with economic fundamentals within a matter of years.
Markets focus primarily on long-term economic fundamentals and this is what should guide
managers in their investment decisions (Koller et al, 2005).
There are however other considerations for a value-maximizing manager. Even though intrinsic
value is important in the choice of the individual security, the fund manager manages a portfolio.
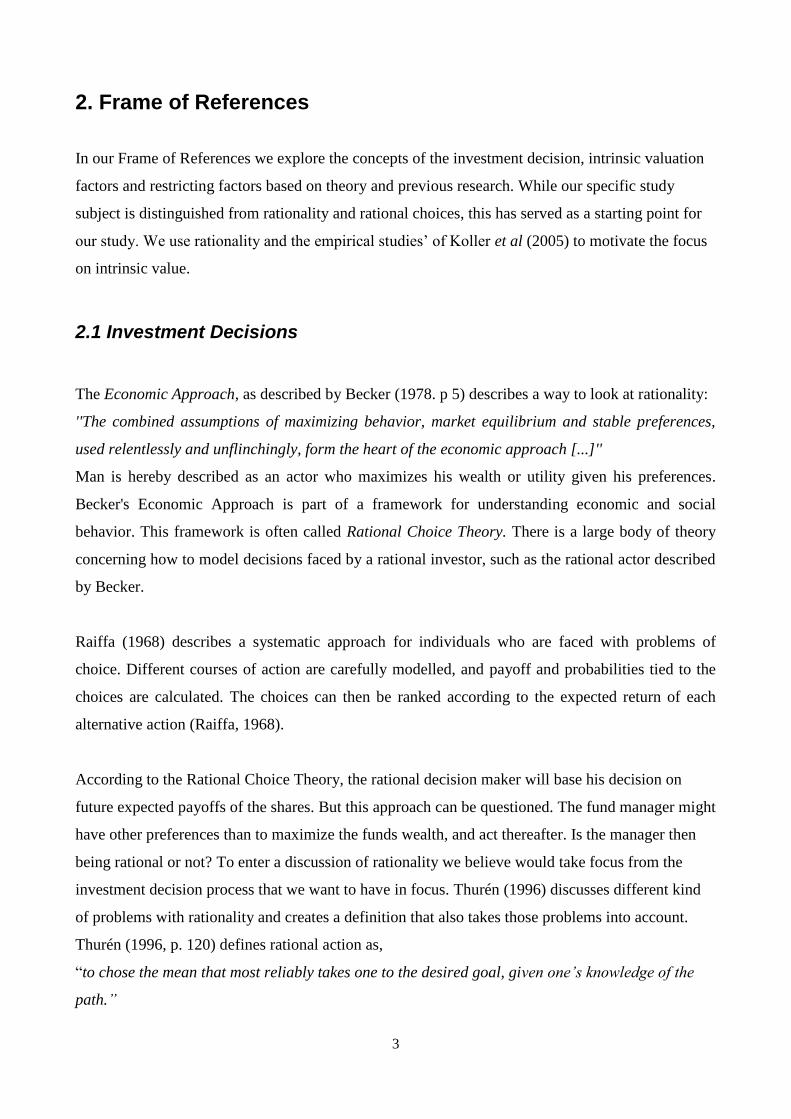
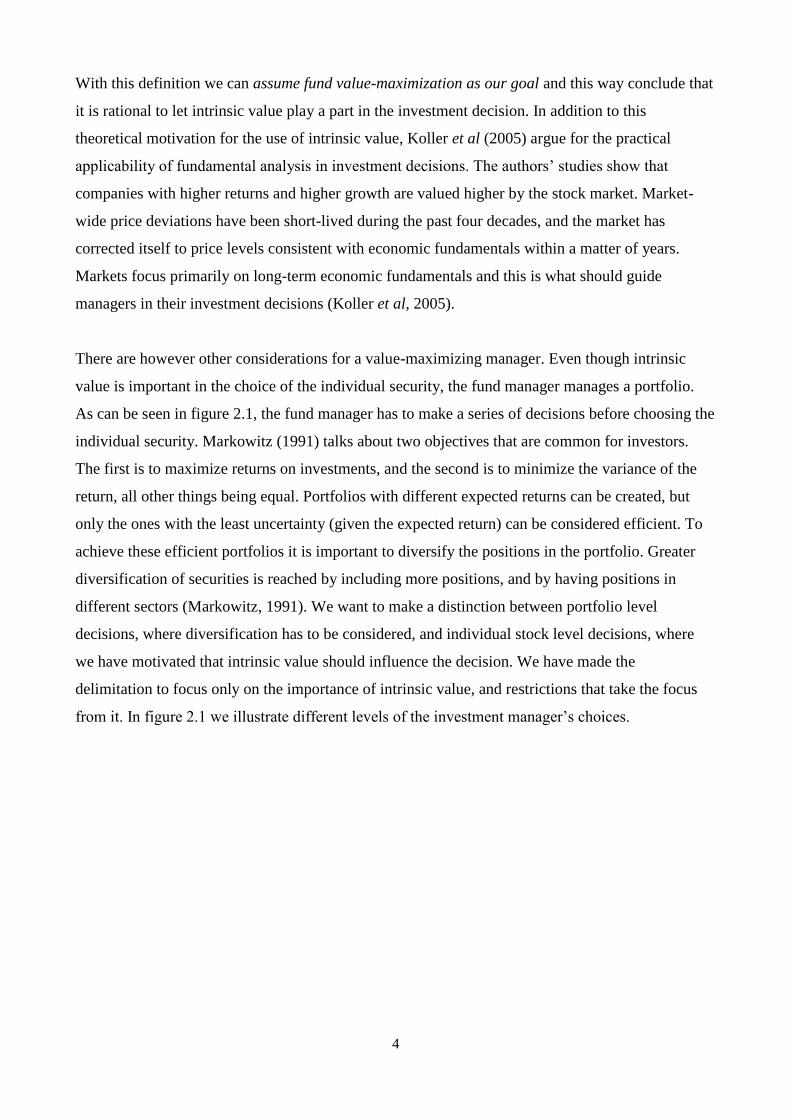
As can be seen in figure 2.1, the fund manager has to make a series of decisions before choosing the
individual security. Markowitz (1991) talks about two objectives that are common for investors.
The first is to maximize returns on investments, and the second is to minimize the variance of the
return, all other things being equal. Portfolios with different expected returns can be created, but
only the ones with the least uncertainty (given the expected return) can be considered efficient. To
achieve these efficient portfolios it is important to diversify the positions in the portfolio. Greater
diversification of securities is reached by including more positions, and by having positions in
different sectors (Markowitz, 1991). We want to make a distinction between portfolio level
decisions, where diversification has to be considered, and individual stock level decisions, where
we have motivated that intrinsic value should influence the decision. We have made the
delimitation to focus only on the importance of intrinsic value, and restrictions that take the focus
from it. In figure 2.1 we illustrate different levels of the investment manager‟s choices.
5
Figure 2.1, Aspects of the investment decision. Only some alternatives for each decision and only
some leaf nodes are exemplified.
One way to motivate the individual security level focus is that we have chosen to focus on ethically
branded funds. The work with ethics is done on individual company level in the forms that we have
encountered. We also want to delimit our thesis and keep a clear focus. We are however aware that
there are conflicting objectives for the fund manager and has kept this in mind in our analysis.
2.2 Intrinsic Valuation Factors
Different fundamental valuation techniques are used to estimate intrinsic value. In our thesis we
have chosen not to tie the concept of intrinsic value to any specific valuation method. This is also
the reason why we have chosen the more neutral term intrinsic value, rather than other terms
sometimes used inter-changeably such as warranted value or fundamental value (Penman, 2007).
Penman (2007) defines four methods of valuation that involve forecasting. Dividend Discounting
Analysis discounts the dividends from a company, Discounted Cash Flow Analysis discounts free
cash flow to investors, Residual Earnings Analysis calculates the value as the book value plus
6
residual earnings and finally Earnings Growth Analysis calculates value as capitalized earnings plus
the present value of expected abnormal earnings growth. Hellman (2000) talks about different
valuation attributes; dividends, residual earnings, and free cash flow that are involved in the three
fundamental valuation models he mentions. Intrinsic valuation factors as discussed in this thesis
refer to factors relating to a companies growth, margins on investments made and/or cost of capital,
as these are the factors that drive intrinsic value (Koller et al, 2005). When talking about equity, we
can make assumptions of the future development of these intrinsic valuation factors and estimate
future cash flows from the underlying company and hereby estimate an intrinsic value of the equity.
2.3 Restricting Factors and Previous Research
In the introduction part of this thesis we introduced the concept of restricting factors. These
restricting factors can be described in terms of different limiting dimensions. The following limiting
dimensions were identified based on our fund selection:
Product types – managers can only invest in equity.
Stock markets available – managers can only invest in equity noted on the Stockholm Stock
Exchange (further on referred to as SSE).
Ethical considerations – all funds had ethical investment restrictions.
Diversification – All funds have to have at least 16 positions (and the maximum size of
individual positions is further restricted) according to legislative regulations. Some funds
had applied a maximum number of positions as well.
Net flows from the fund – One fund was not retail but directed to institutional investors and
was expected to experience larger net flows.
In addition to these a-priori restrictions we have found support for additional restrictions based on
previous research on investor behavior at a disaggregated level.
Hellman (2000) did an empirical study on eight institutional investors. Some of the
restricting factors he addressed were legal conditions, low liquidity, and index-thinking3. He
describes that the institutional investors based their fundamental opinions on both
expectations expressed in quantitative and qualitative terms. One important qualitative term
is the market‟s opinions. Hellman (2000) also presents previous research that has shown the
same results. He shows that non-public information played an important part in the decision
making.
7
Elton et al (2003) have studied the effect of incentive fees on mutual fund managers‟
behavior. The incentive fee is a reward structure; the investment performance relative to
some benchmark creates the compensation to the fund manager. They found that incentive-
fee funds take more risk than non-incentive-fee funds on average and that the risk is
increased after a period of poor performance or decreased after a period of good
performance (Elton et al, 2003).
Haugen (2004) discusses why most American fund-portfolios look pretty much the same.
He explains that it is due to the fact that most funds are benchmarked to the S&P 500 index.
He distinguishes managers from individual investors; the managers have to worry about the
S&P 500 tracking error while individual investors do not (Haugen, 2004).
Baker (1998) studies the effect of performance benchmarking, by an interview survey to 64
fund managers. She presents that this affects the attitude to risk, to motivation and to time
horizons. She concludes that the performance monitoring leads to short-term thinking
(Baker, 1998).
Coval & Moskowitz (2001) study the geography of mutual fund investments. They found
that the fund manager can earn excessive return on nearby investments, thanks to an
informational advantage i.e. having superior information about local stocks (Coval &
Moskowitz, 2001).
The list of limiting dimensions can be increased with,
Index-thinking – A focus on index weights in the investment decisions. Tracking error
emphasizes this.
Incentive systems and Performance monitoring – Increased risk-taking with poor
performance and short-term focus with close performance monitoring.
Liquidity – Low liquidity might prevent investment.
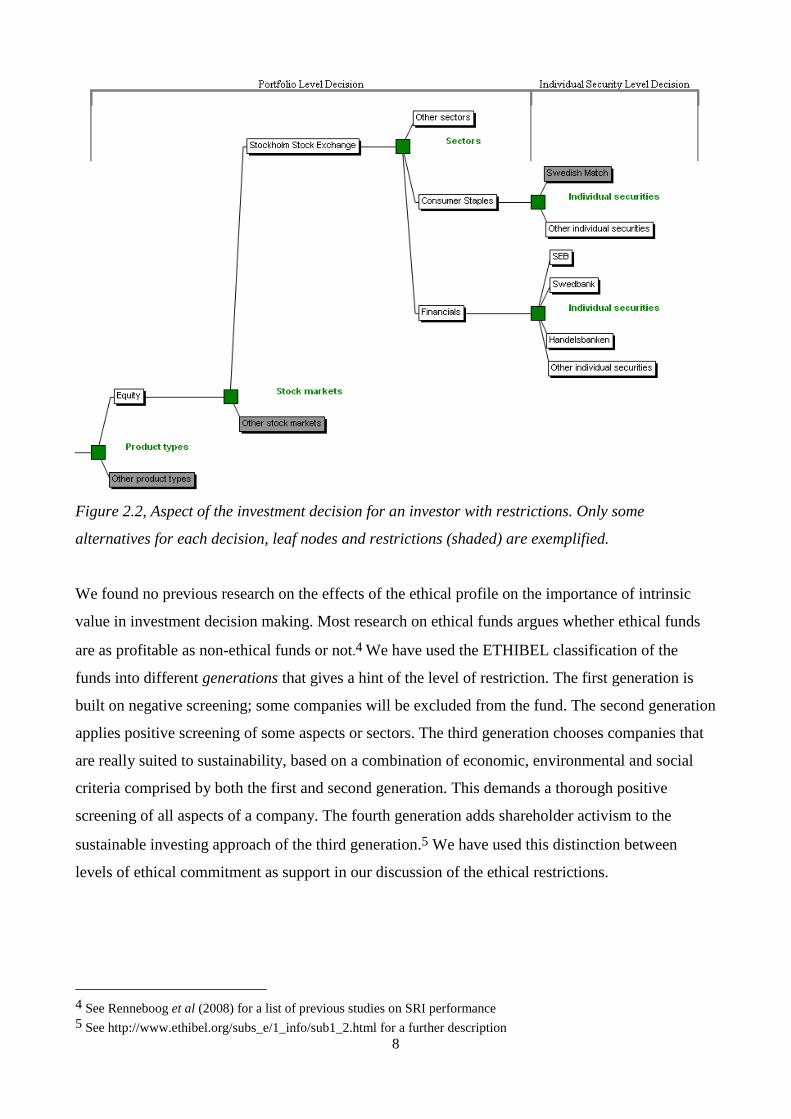
In figure 2.2 we illustrate the fund manager‟s restricted choices. We find further motivation on our
focus on the individual investment object level in the fact that a number of choices on a higher level
have been restricted.
3 Buying and selling equities on the basis of their index weights
8
Figure 2.2, Aspect of the investment decision for an investor with restrictions. Only some
alternatives for each decision, leaf nodes and restrictions (shaded) are exemplified.
We found no previous research on the effects of the ethical profile on the importance of intrinsic
value in investment decision making. Most research on ethical funds argues whether ethical funds
are as profitable as non-ethical funds or not.4 We have used the ETHIBEL classification of the
funds into different generations that gives a hint of the level of restriction. The first generation is
built on negative screening; some companies will be excluded from the fund. The second generation
applies positive screening of some aspects or sectors. The third generation chooses companies that
are really suited to sustainability, based on a combination of economic, environmental and social
criteria comprised by both the first and second generation. This demands a thorough positive
screening of all aspects of a company. The fourth generation adds shareholder activism to the
sustainable investing approach of the third generation.5 We have used this distinction between
levels of ethical commitment as support in our discussion of the ethical restrictions.
4 See Renneboog et al (2008) for a list of previous studies on SRI performance
5 See http://www.ethibel.org/subs_e/1_info/sub1_2.html for a further description
9
3. Methodology
We started our thesis work with a specific interest in investor behavior. An initial literature search,
of „investor behavior‟ in the databases Business Source Premier, ABI and Science Direct, gave few
hits on investor behavior at a disaggregated level. One was written by Hellman (2000) and called
Investor behaviour – An empirical study of how large Swedish institutional investors make equity
investment decisions. We were intrigued by the study of institutional investors‟ behavior and
decided to make a similar study but introduce further restrictions to make our study unique. We
decided to examine ethical Swedish equity funds. We became specifically interested in the relative
importance of intrinsic value in the investment decision making.
In the design of our study we tried to find a research design that could capture the complex
investment decision making of fund managers. We have therefore chosen a compilation of mini
case-studies. We have used both qualitative and quantitative data to describe the phenomenon. This
combination increases the validity of a qualitative study (Merriam, 1994; Hellman, 2000; Andersen,
1994). The qualitative data consists of interviews. The quantitative data consists of the quarterly
holdings of the studied funds published by the Swedish Financial Supervisory Authority‟s
(Finansinspektionen, further on referred to as FI). It has been used as preparation for the interviews,
during the interviews and after the interviews to verify the answers. Further we have used
secondary data from the funds‟ homepages, interim reports and data on aggregated net-flows from
the fund industry‟s promotional organization (Fondbolagensföreningen). Our study contains all
parts of a case-study described by Merriam (1998, p. 24), but we have decided to perform several
mini case-studies instead of a single case. We perform one interview at several funds, instead of
several interviews at one fund. Our ambition was to capture as large a variety of observations as
possible rather than to gain the depth a single case study would have given.
To answer our questions we needed an inductive method of scientific inquiry. We wanted no pre-
specified hypothesis (see Hellman, 2000, p. 50). We concluded that it was better to start by
gathering the empirical data. When performing case-studies an abductive method is often used
(Sköldberg in Alvesson & Sköldberg, 1994, p. 42). The abductive method combines both induction
and deduction and differs from the two by also attempting to understand the investigated
phenomena (Alvesson & Sköldberg, 1994, p. 41f). Therefore we did a lot of research about investor
behavior, ethical and SRI funds, and behavioral finance before performing the study. By this, we
gained knowledge about the area. When we did the data-analysis and the interviews we were still
10
open for all results and searched for further relevant research after all empirical material was
gathered and compiled. This method, to gather the empirical material without knowing what results
will be concluded, has also been argued for by Merriam (1998, p. 79) and Silverman (in Wästerfors,
1998, p. 71).
3.1 Fund Selection
To answer our question about what restricting factors that limits the impact of intrinsic value we
had to choose funds that reflected these restrictions. These restrictions are that the fund can only
invest in Swedish equity, and that it has ethical restrictions. The selection has therefore been non-
probabilistic (see Chein in Merriam, 1998, p. 61), with a purposeful sampling6 (see Patton in
Merriam, 1998, p. 61). Criteria have been used when we have selected the funds to reflect these
restrictions. The criteria that we used to find our study objects were: for the fund to invest in
Swedish equity, for it to be marketed as ethical, for it to be actively managed (i.e. no index funds)
and for it to be registered in Sweden. The delimitation to Swedish equity funds was made to get a
sample size that fitted the scope of the thesis. The ethical branding was chosen to add further
restrictions to the funds and to add an element of uniqueness to our study. To delimit our study
further, we excluded funds with a specialization such as environmental funds, culture funds or
funds donating returns to specific causes. Swedish registration was important to improve our
chances to get access to the fund manager. It was important to exclude index-funds so that we could
observe active investment decisions. Finally we have chosen only one fund per fund broker,
because we found that different funds managed by the same fund broker often faced similar
conditions.
To find the funds, we searched FI‟s register. We also searched Morningstar and the list of PPM
funds. We searched for funds that included the key words „SRI‟, „etisk‟ and „ethic‟. We contacted
the agency for consumers interest (Konsument Ombudsmannen), Fondbolagens Förening, an
organization to promote ethical investments (SWESIF) and Finansinspektionen by mail and asked
for a complete register over ethical funds, but no such register existed. We did however find a
survey over the profitability of Swedish ethical funds by Folksam in 2006 (Lundberg & Westholm,
2006). No further studies have been performed since. In the survey we found two more funds that
fitted our criteria, though their name did not include any of our ethical search words. We also talked
to one of the authors of the report, and asked for her opinion of how to best identify ethical funds.
6 Goetz & Lecompte (in Merriam, 1998, p. 62) calls it criterion related sampling – alltid oavsett, för evigt djurgården
11
She told us that no complete list or register existed but that our method sounded solid. A full list of
every fund, including the funds we chose to exclude in our study, is attached in Appendix A.
At two times we had to decide which fund to choose because the fund brokers offered several
ethical Swedish equity funds. For Swedbank Robur we decided to pick their MEGA fund, a fund
directed to institutional investors (smallest deposit is 1 MSEK), and from Banco we chose their
Special fund, that is restricted to invest in fewer companies than its normal counterpart. These
choices where made because we believed that their special conditions could add further restricting
factors that could lead to deviations from intrinsic valuation. It also reflects our limiting dimensions
in the framework of references. When we had contacted all fund managers we found out that
Folksams Aktiefond Sverige had outsourced management through a prime brokerage agreement to
Swedbank, and that the manager in our Swedbank Robur fund managed Folksams‟ fund as well.
We decided that it was still interesting to include them both since they face different conditions due
to the size of the funds and applied ethical rules.
The seven funds we have included in our paper are Aktie-Ansvar Sverige (managed by Aktie-
Ansvar), Banco Etisk Sverige Special (managed by Alfred Berg Fondförvaltning), Carlson
Sverigefond (managed by Carlson Fondförvaltning), Cicero SRI Sverige (managed by Cicero
Fondförvaltning), Folksams Aktiefond Sverige (managed by Swedbank Robur), Nordea Etiskt
Urval (managed by Nordea Asset Management) and Swedbank Robur Ethica Sweden MEGA
(managed by Swedbank Robur).
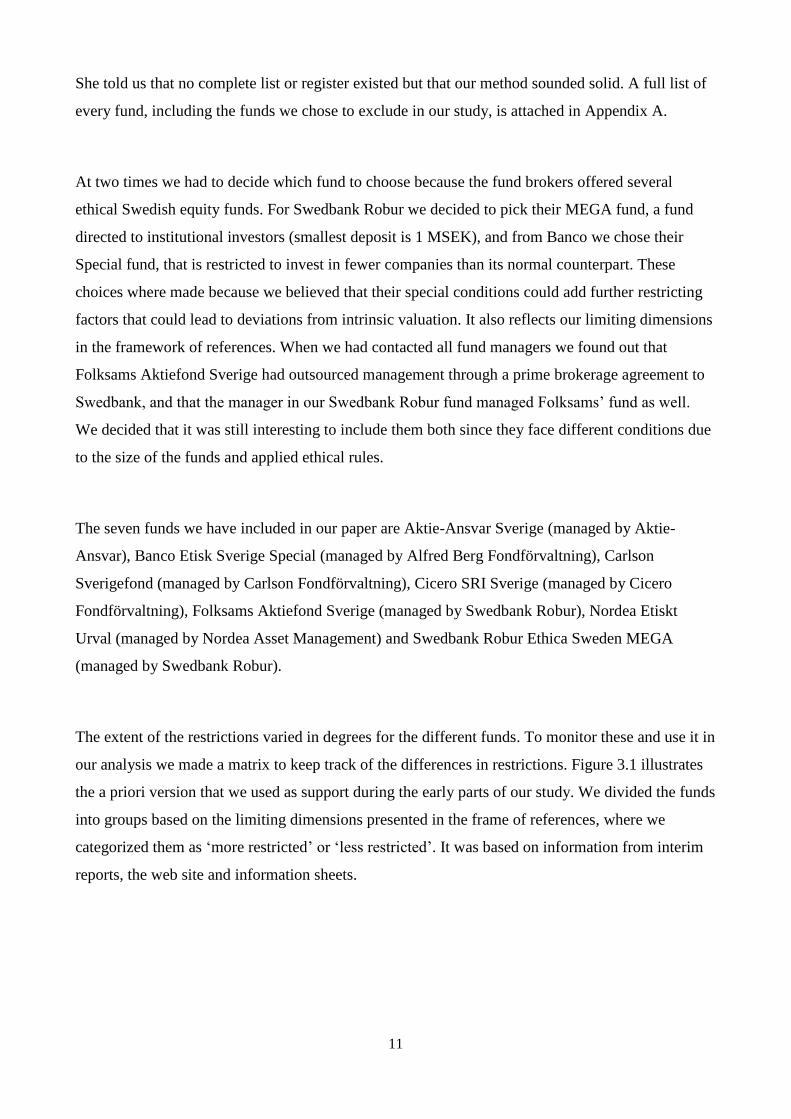
The extent of the restrictions varied in degrees for the different funds. To monitor these and use it in
our analysis we made a matrix to keep track of the differences in restrictions. Figure 3.1 illustrates
the a priori version that we used as support during the early parts of our study. We divided the funds
into groups based on the limiting dimensions presented in the frame of references, where we
categorized them as „more restricted‟ or „less restricted‟. It was based on information from interim
reports, the web site and information sheets.
12
Fund
Product
types
Stock
markets
Ethical
considerations Diversification
Net flows
from the fund
Aktie-Ansvar x
Banco Etisk Sverige Special x x
Carlson Sverigefond x x x
Cicero SRI Sverige x x
Folksams Aktiefond Sverige x
Nordea Etiskt Urval x x x
Swedbank Robur Ethica
Sweden MEGA x x x x
Figure 3.1, x means more restricted 7
3.2 Data Analysis
The starting point for our data sampling is the second quarter of 2007, this is when the aggregated
net flows from all equity funds became negative (www.fondbolagen.se). This was chosen because
we wanted to perform our study in the context of a receding „bear market‟. We have collected the
transactions made by each of the funds every three months, based on the quarterly reports publicly
available and on data provided by FI. The last report used was released in September 2008, giving
us a total of 6 reports each and 5 transaction periods. We also asked every fund for data on net
flows and derivatives – though we only got data on net flows from one fund. We then used the
interim reports to analyse the balance sheet, which showed us to what extent they had used
derivatives and gave a hint about the flows of the funds.
All funds had an index they were compared against; five out of seven was benchmarked to the SIX
Portfolio Return Index (further on referred to as SIX PRX). For increased comparability we have
compared all funds against this index. This index was included in the data for every fund. The
different companies in the portfolio were divided into sectors as defined by the Global Industry
Classification Standard8. For every period the portfolio weights, the change in portfolio weights and
the change in quantity was calculated for. Then the reports were analysed regarding deviations from
7 The fund is restricted if it claims to have a fewer number of holdings (diversification), has more than negative
screening (ethical considerations), only invests in companies at the OMXS (stock markets), can only use other
instruments than equity in a restricted way (product types), and if had large net-flows from/to the fund (MEGA
fund, least investment is 1 MSEK)
8 See www.omxnordicexchange.com
13
index or differences in the past weights. We searched for patterns that seemed unusual or deviated
from the other funds. Especially large deviations from index weights were paid attention to.
After the interviews we went through the data again to cross-reference our observations and results
from the interviews with the data. We also did calculations to verify empirical results from the
interviews that could be supported by the quantitative data.
3.3 Interviews
All fund managers were first contacted by letter, where we described that we are writing our
master‟s thesis about the investment decision process of ethical fund managers. We called them a
few days later. Four fund managers, one equity analyst and two ethical analysts agreed upon
meeting for an interview. One fund broker did not wish to participate at all, and so we had no
further information about the fund than official data published at their homepage, by Fondbolagens
Förening and by FI.
The data analysis was used as preparation for the interviews. We also used secondary data, such as
interim reports, information sheets and the web sites of the companies. The interviews were held
during approximately an hour. Both writers were present; one took notes and the other asked the
questions. The interviews were semi-structured; interviews with open questions according to
Merriam (1998, p. 88), and we tried to ask relevant follow-up questions when needed.
All interviews were recorded and then transcribed. We have used the funnel-technique, to ask
questions on a wider level at first to get more specific questions at the end (Patel & Davidson, 1994,
p. 65). At every interview we asked about the interviewee‟s background, the general structure of
day-to-day work, the portfolio strategy and how the ethical aspect played out. We had also prepared
an overview of the portfolio broken down sector-by-sector, containing weights and the SIX PRX for
each interview. If we had a specific question about a company or a sector we presented the
quarterly data in an overview for it as well. This was done to get more specific answers, and so that
we would be able to back our questions with solid data. At all interviews, we asked questions about
the Consumer Staple sector. We always tried to ask specific questions to avoid general answers, and
we knew that we wanted compare the answers with the data afterwards so specific questions
became crucial. We also asked all interview subjects questions about Ericsson AB. We wanted to
have at least one company that we asked all interviewees about so we could compare the answers.

14
We started by asking about the strategy and the thoughts the interviewee had about the company,
then we asked about the reaction to the profit warning on October 16, 20079. These questions were
backed by an overview of the Information Technology with weights, change in quantity, stock price
and the SIX PRX weights for every quarter. We also showed an overview of the fund's holdings
with a portfolio weight larger than 5 % in the latter interviews, when we had appreciated the
importance of the 5-10-40 rule, and asked about the effect on stock picking. We finished the
interview by questioning whether the interviewee could give a concrete example when he had been
restricted or reinforced due to the ethical aspect of the fund.
9 See http://www.ericsson.com/se/releases/prquarterview20074.shtml
15
4. Results
We will now present the results of our study. Each sub-section contains first empirical observations
and then our analysis of the observations supported by data, theory and previous research where
necessary. Initially we describe the impact of the performing determining indices, the
characteristics of the SSE and introduce the concept compensating behavior. These are important
observations and conclusions that are vital for the understanding of the other results, and the
concept of compensating behavior is used in the discussion of the other results. We then proceed to
discuss the formal restrictions, i.e. restrictions that apply to all funds and that exist due to formal
regulation or commitments. Then we discuss restrictions related to aspects of information, and these
are fund broker specific issues. The final part is related to the investment object specific factors that
cause deviation from intrinsic value, namely the liquidity. Each section‟s findings are summarized
and observations related to compensating behavior are discussed in a separate sub-section in the
end.
For each section the funds will be referred to as fund 1 through 7, and the managers as fund
manager 1 through 7. In each section the numbers have been changed, so as to further ensure the
anonymity of the interview subjects (i.e. numbers are consistent only for 4.1.1 through 4.1.4, 4.2.1
through 4.2.3 and so on). At some points we are not specific about what fund we are talking about,
and this has been done to further guarantee the funds anonymity. A final measure to ensure the
anonymity of funds was to edit some quotations that have been used as empirical support.
4.1 The Setting for the Fund Managers’ Investment Decision
This section will go through parts of the setting in which our fund managers made their decision
necessary to understand the rest of our results. These are specifically the characteristics of the SSE
and the performance determining indices for the funds. We also introduce the important concept of
compensating behavior.
16
4.1.1 Characteristics of the Stockholm Stock Exchange
The characteristics of the SSE have proved to be an important factor when it comes to the decision
making of the fund managers. The characteristics of the market are somewhat special; it is very
small compared to for example New York Stock Exchange & NASDAQ. Roll (1992) presents
empirical evidence that small markets are more volatile. The SSE further contains small number of
large market cap companies that weigh heavy in the indices. Also, there exist several companies
that are unique on the exchange, i.e. they have no close substitutes. Another characteristic is that
there are few companies in the consumer staple and energy sectors. Fund manager 3 describes the
market:
“Overall there is a problem with the Swedish Stock Exchange, there is a relatively small number of
companies with this character [refers to Swedish Match]; consumer staples, not so many oil, gas
companies either, energy. As there are in Europe. This makes the Swedish Stock Exchange sensitive
to the business cycle.”
4.1.2 Performance Determining Indices and Tracking Error
One thing that has been similar for all the funds that we have examined is that they all evaluate
performance primarily against an official index. One fund was benchmarked to the SIX60 Index
Cap, which is an index of the 60 most traded companies on the SSE capped so that no company
weigh more than 10 % (www.six.se). Another fund benchmarked against the OMXSB Cap, which
is an index comprising of the 80 to 100 most traded companies with a cap so that no company can
weigh more than 10 % (www.omxnordicexchange.se). The five remaining funds benchmarked
against the SIX PRX, which is an index that reflects all companies on the SSE with a cap so that no
company can weigh more than 10 % (www.six.se). All the indices use the calculating method to re-
invest dividends.
A few funds claimed not to look at the benchmark index in their investment decisions, but it
became obvious that it played a large role for all funds. Fund 5 measures performance solely against
an index but officially claim not to look at the index when making their investments. We asked
about what role the index really plays in the investment decision:
“Well… That‟s a very good question. We claim not to look at the index [when we make the
17
investment decision] but at the same time, it‟s in here [points at his head] that you look at it
anyway.”
All fund managers had positions in the largest companies on the SSE (with the exception for the
cases where ethical restrictions prevented them). Fund manager 2 talks about the risk of owning no
shares in a large company, in this case Ericsson:
"Even if we try not to have our starting point in the index we cannot ignore it totally. Ericsson still
weighs quite a bit so should we choose not to own anything it is quite a big risk we are taking"
Fund manager 1:
“We can absolutely be zero weighted in a small sector. But we‟ll probably own Ericsson, even if we
don‟t like Ericsson. Because Ericsson weighs 7 % of the SSE and that‟s a big bet to us. We‟ll be
under-weighted by 1 % or 2 % and, yeah, then we are enormously negative even though it weighs 7
%.”
Fund manager 3 also talks about the heavy weighing companies, and the problems that can arise if
you do not like them:
“We cannot own nothing in H&M, that can be the right thing but it is a VERY large position you
are taking. Maybe we do it sometimes, but rarely as big bets as 9 %. On the Swedish stock market
you can have a position where you are quite below index, a fairly big bet, but you still have quite a
lot of stocks. It is a bit ungrateful to manage a fund in such an environment.”
Fund manager 4 describes what they do when the fund experienced substantial uncertainty
regarding Ericsson:
“[their reports] has been either very positive or very negative. Either or. Every time. You want
companies that are more predictable. [with this uncertainty] we remain at the index weights.”
Fund manager 5 describes the same situation:
”If there is substantial uncertainty you can remain close to index weights over those days [when
quarterly reports are released], we have done that some times.”
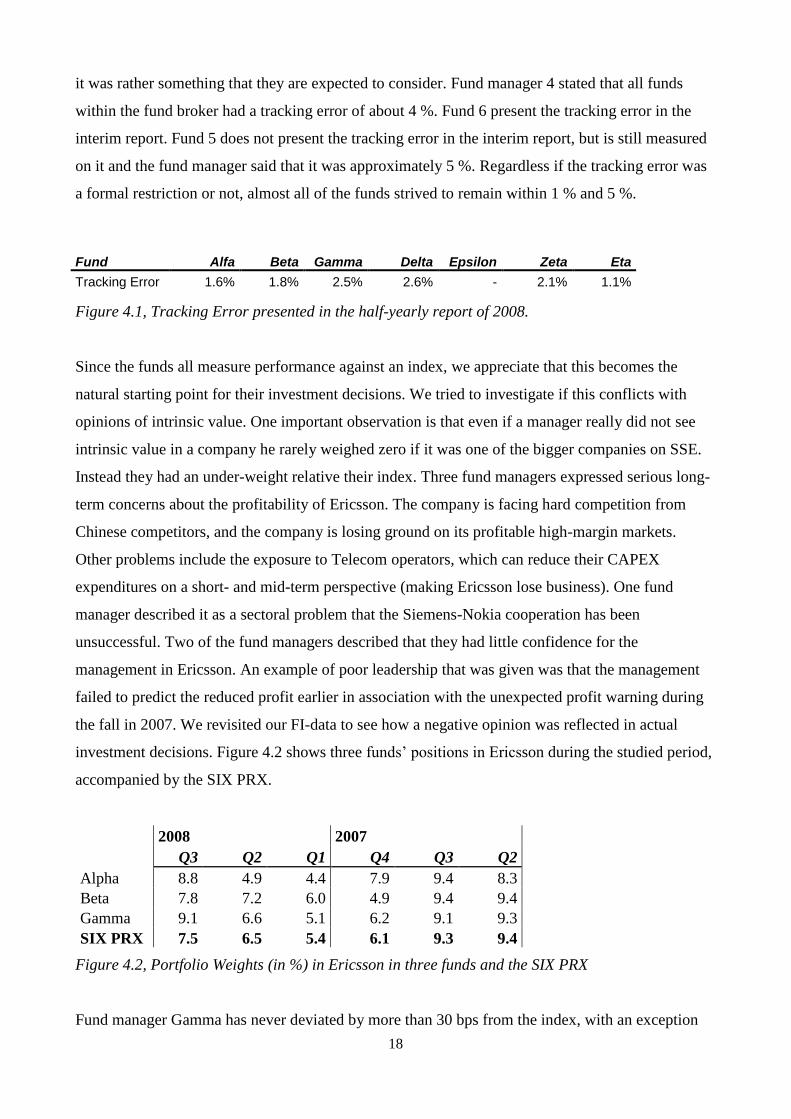
Most of the fund managers are measured on tracking error10. This is a measure of how closely the
fund follows their index. Funds 1 and 3 have formal restrictions that they cannot exceed. Fund 2, 4
and 7 present the tracking error in their interim report but do not have formal boundaries. For them
10 Tracking error can either be used ex post, i.e. as a measure of historical performance or as a risk control tool to
predict future deviations. The data that we have encountered is ex post tracking error, and is measured as T.E = √(E((d –
b)2 )), (d-b) equals the difference between portfolio return and index return
18
it was rather something that they are expected to consider. Fund manager 4 stated that all funds
within the fund broker had a tracking error of about 4 %. Fund 6 present the tracking error in the
interim report. Fund 5 does not present the tracking error in the interim report, but is still measured
on it and the fund manager said that it was approximately 5 %. Regardless if the tracking error was
a formal restriction or not, almost all of the funds strived to remain within 1 % and 5 %.
Figure 4.1, Tracking Error presented in the half-yearly report of 2008.
Since the funds all measure performance against an index, we appreciate that this becomes the
natural starting point for their investment decisions. We tried to investigate if this conflicts with
opinions of intrinsic value. One important observation is that even if a manager really did not see
intrinsic value in a company he rarely weighed zero if it was one of the bigger companies on SSE.
Instead they had an under-weight relative their index. Three fund managers expressed serious long-
term concerns about the profitability of Ericsson. The company is facing hard competition from
Chinese competitors, and the company is losing ground on its profitable high-margin markets.
Other problems include the exposure to Telecom operators, which can reduce their CAPEX
expenditures on a short- and mid-term perspective (making Ericsson lose business). One fund
manager described it as a sectoral problem that the Siemens-Nokia cooperation has been
unsuccessful. Two of the fund managers described that they had little confidence for the
management in Ericsson. An example of poor leadership that was given was that the management
failed to predict the reduced profit earlier in association with the unexpected profit warning during
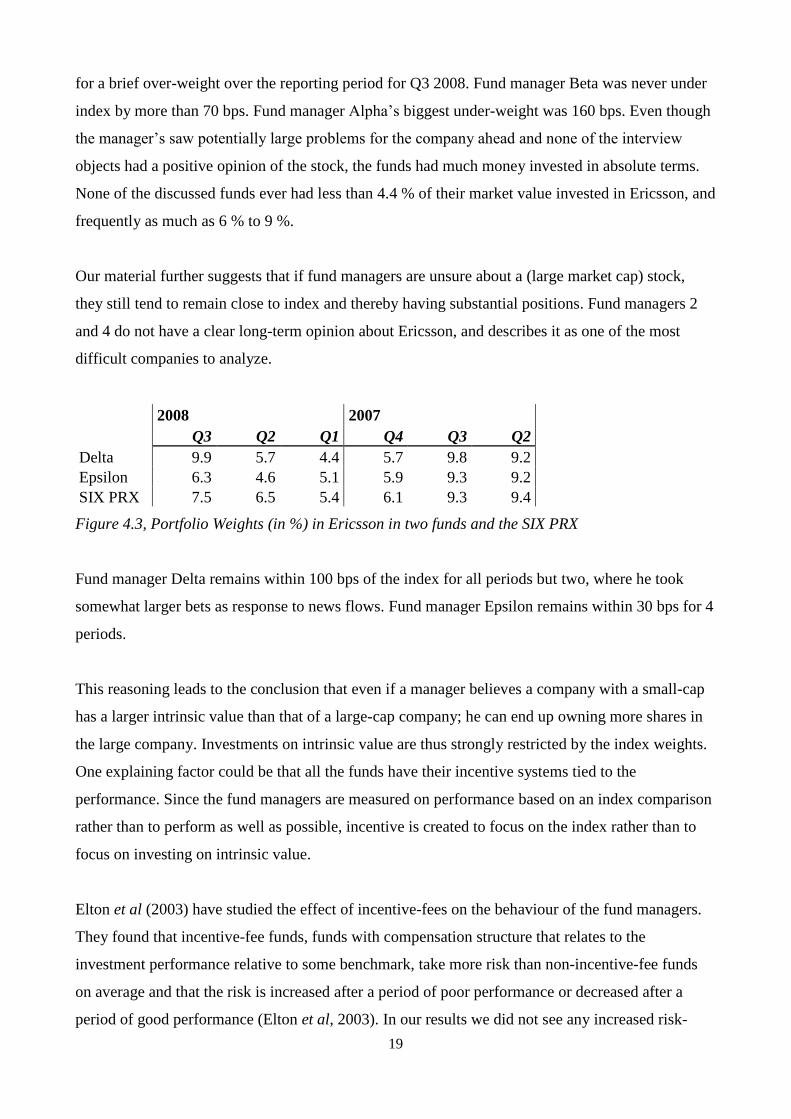
the fall in 2007. We revisited our FI-data to see how a negative opinion was reflected in actual
investment decisions. Figure 4.2 shows three funds‟ positions in Ericsson during the studied period,
accompanied by the SIX PRX.
2008 2007
Q3 Q2 Q1 Q4 Q3 Q2
Alpha 8.8 4.9 4.4 7.9 9.4 8.3
Beta 7.8 7.2 6.0 4.9 9.4 9.4
Gamma 9.1 6.6 5.1 6.2 9.1 9.3
SIX PRX 7.5 6.5 5.4 6.1 9.3 9.4
Figure 4.2, Portfolio Weights (in %) in Ericsson in three funds and the SIX PRX
Fund manager Gamma has never deviated by more than 30 bps from the index, with an exception
Fund Alfa Beta Gamma Delta Epsilon Zeta Eta
Tracking Error 1.6% 1.8% 2.5% 2.6% - 2.1% 1.1%
19
for a brief over-weight over the reporting period for Q3 2008. Fund manager Beta was never under
index by more than 70 bps. Fund manager Alpha‟s biggest under-weight was 160 bps. Even though
the manager‟s saw potentially large problems for the company ahead and none of the interview
objects had a positive opinion of the stock, the funds had much money invested in absolute terms.
None of the discussed funds ever had less than 4.4 % of their market value invested in Ericsson, and
frequently as much as 6 % to 9 %.
Our material further suggests that if fund managers are unsure about a (large market cap) stock,
they still tend to remain close to index and thereby having substantial positions. Fund managers 2
and 4 do not have a clear long-term opinion about Ericsson, and describes it as one of the most
difficult companies to analyze.
2008 2007
Q3 Q2 Q1 Q4 Q3 Q2
Delta 9.9 5.7 4.4 5.7 9.8 9.2
Epsilon 6.3 4.6 5.1 5.9 9.3 9.2
SIX PRX 7.5 6.5 5.4 6.1 9.3 9.4
Figure 4.3, Portfolio Weights (in %) in Ericsson in two funds and the SIX PRX
Fund manager Delta remains within 100 bps of the index for all periods but two, where he took
somewhat larger bets as response to news flows. Fund manager Epsilon remains within 30 bps for 4
periods.
This reasoning leads to the conclusion that even if a manager believes a company with a small-cap
has a larger intrinsic value than that of a large-cap company; he can end up owning more shares in
the large company. Investments on intrinsic value are thus strongly restricted by the index weights.
One explaining factor could be that all the funds have their incentive systems tied to the
performance. Since the fund managers are measured on performance based on an index comparison
rather than to perform as well as possible, incentive is created to focus on the index rather than to
focus on investing on intrinsic value.
Elton et al (2003) have studied the effect of incentive-fees on the behaviour of the fund managers.
They found that incentive-fee funds, funds with compensation structure that relates to the
investment performance relative to some benchmark, take more risk than non-incentive-fee funds
on average and that the risk is increased after a period of poor performance or decreased after a
period of good performance (Elton et al, 2003). In our results we did not see any increased risk-
20
taking, we rather got the impression that funds strived to remain close to the index. We interpreted
the tracking errors as relatively low, and that this supports our assumption. Haugen (2004) discusses
why most American fund-portfolios look pretty much the same. He explains that it is due to the fact
that most funds are benchmarked to the S&P 500 index. His explanation is that the managers are
afraid of under-performance (this will lead to termination), but also over-performance because then
suspicion will be raised regarding the level of risk of the fund. He distinguishes managers from
individual investors; the managers have to worry about the S&P 500 tracking error while individual
investors do not (Haugen, 2004).
Baker (1998) studies the effect of performance benchmarking. He illustrates that the incentive to
perform better than the benchmark is to keep the fund management contract, and attracting a
positive award. He describes that the fund manager might expect to lose the fund contract if he
perform worse than the benchmark. This performance monitoring affects the attitude to risk and
return, and creates a short-term thinking. He found empirical results for short-term thinking and
shorter holding periods due to the performance benchmark and monitoring system (Baker, 1998).
These studies show results in line with our observation of the index‟ central position in the
investment decision, and suggests that a reason for this is the ties to performance measurement
reward-systems.
In Kaplan & Norton‟s (1992) article about the balanced scorecard they begin by describing how
managers‟ behavior is strongly affected by the measurement system. They write:”What you
measure is what you get”, meaning that the manager‟s focus and activity strongly is related to what
he is measured on. In Kaplan & Norton‟s work we find further evidence to a link between, on the
one hand index-determined performance and tracking error measurement and the other hand the
performance-determining index‟ central role in investment decisions.
Hellman (2000) refers to the buying and selling of equities on the basis of their weights in an index
as index-thinking. He found that the stock‟s index weights had a significant impact on several
institutional investors‟ investment decisions. He observed that two of the institutional investors held
stocks in companies that they had negative fundamental opinions about, due to index-thinking. He
also observed that some institutional investors‟ alternative by default was holding the index weight
of a company if they were uncertain about the development of a stock. This index-thinking was
reinforced if the investor was monitored closely by media and principals and experienced external
pressure (Hellman, 2000). These results are in line with our observations and conclusions.
21
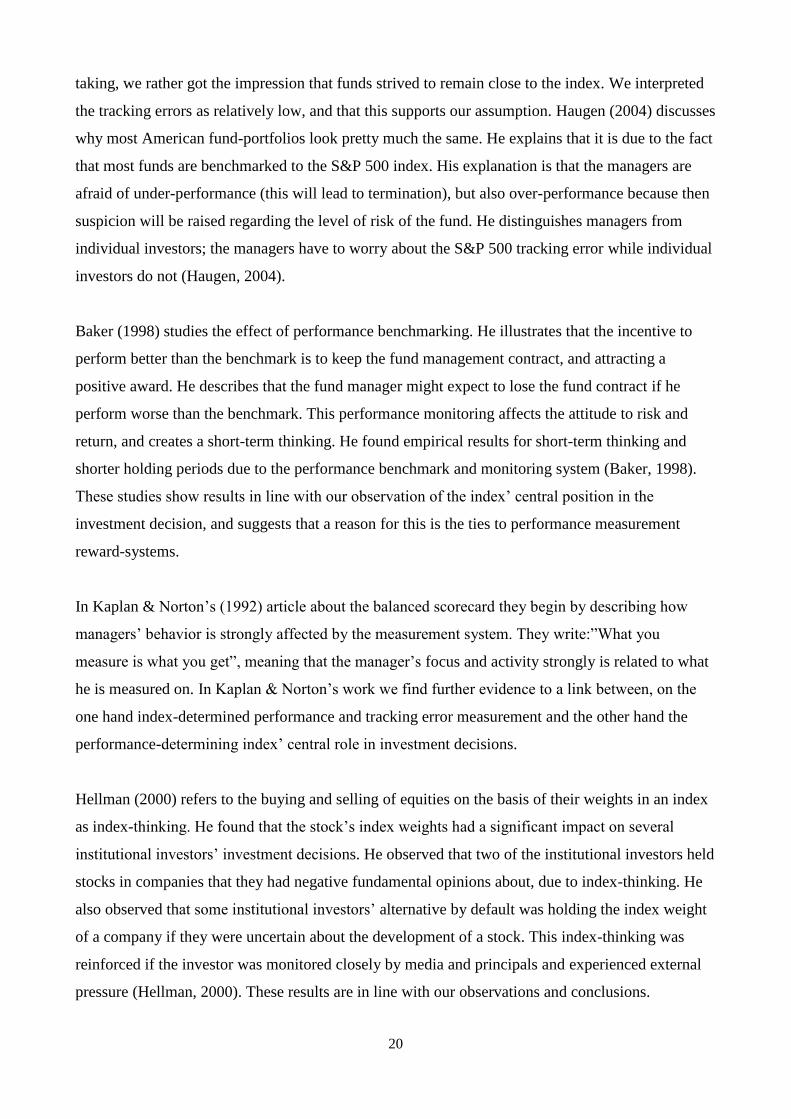
4.1.3 Compensating Behavior Defined
As a consequence of the importance of the index that the companies compare performance against
and the restrictions imposed on the funds the funds will try to compensate the companies that they
are unable to have desired exposure towards. They do this by taking positions in somehow related
companies. This is what we have chosen to call compensating behavior. While several researchers
have pointed to the importance of the benchmark index, it has to our knowledge not been discussed
in terms of compensating behavior.
We have identified two dimensions in the compensating behavior. Compensating behavior can have
inter-sector focus, i.e. one sector where the company is underweighted is compensated with
overweight in another sector. It can also have intra-sector focus, i.e. a specific company is excluded
and overweight is taken in another company within the sector to remain weighted at par in the
sector as a whole. Another dimension is what the fund exactly is trying to compensate. In some
cases the companies just wanted to replicate the exposure of un-available companies in general. In
this group we have included the cases when companies‟ cyclical-qualities were compensated for. In
other cases more specific exposures were focused on, such as exposure to rising oil-prices. The
following diagram illustrates different types of compensation.
Inter-Sector Intra-Sector
General
exposure
coverage
Covering general exposure by
sectoral over- and under-
positioning.
Covering general exposure by over-
and under-weighting in individual
companies.
Specific
exposure
coverage
Covering exposure to specific
factors, such as rising oil-
prices, by sectoral over- and
under-positioning.
Covering exposure to specific factors,
such as rising oil-prices, by over- and
under-weighting in specific
companies.
Figure 4.4, Different types of compensating behavior
The desire to compensate deviations from the comparative index is what guides these investment
decisions. In other words, the desire to compensate index-exposure comes at the expense of
intrinsic value considerations.
22
This is one of the strongest conclusions our thesis makes, and we saw this behavior in all the
examined funds. The funds with more excluded/un-available companies showed more tendencies of
compensating behavior. In each of the following result-sections, we have a sub-section called
Compensating Behavior to illustrate how the specific restricting factor has led to this phenomenon.
4.1.4 Summary
In this section we have reviewed some important settings for the fund manager to make his
investment decisions within.
Important characteristics of the SSE include the lack of direct substitutes of many companies
and the individually heavy weight of some companies. The small (few companies, and low
sector-weight) Consumer Staples and Energy sectors are other characteristics.
The performance determining index is important in the investment decision, both according to
our observations and previous research. All funds measure performance solely against a
benchmark index and keep constant track of deviations from it.
The conflicts with investments on intrinsic value due to the index-focus become most obvious
in companies weighing heavy in the index: even if the manager does not see intrinsic value in a
share, he might hold a substantial amount to avoid large index deviations. When the manager
was uncertain about a share, he remained close to the index weight.
We have also defined an important concept for our results, that of compensating behavior.
4.2 Formal Restrictions
In this section we will discuss how formal restrictions that all funds face, specifically the 5-10-40
rule and the ethical restrictions, have influenced the impact of intrinsic value in the investment
decision.
4.2.1 The 5-10-40 Rule
In the Swedish law for investment funds (Lagen om värdepappersfonder, 1990:1114), there are
specific regulations on how concentrated a fund‟s portfolio is allowed to be. The law stipulates that
individual positions cannot exceed 5 % of the market value of the portfolio. A position can be as big
as 10 %, but positions between 5 % and 10 % cannot exceed 40 % put together (Lagen om
23
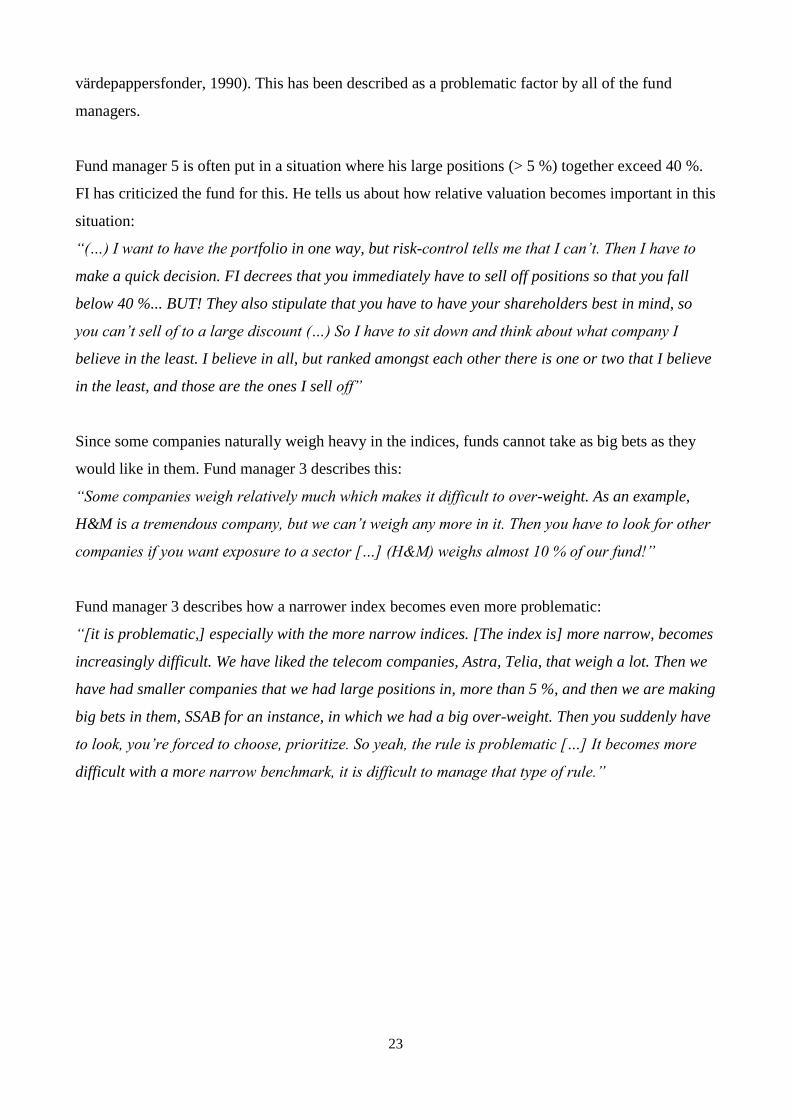
värdepappersfonder, 1990). This has been described as a problematic factor by all of the fund
managers.
Fund manager 5 is often put in a situation where his large positions (> 5 %) together exceed 40 %.
FI has criticized the fund for this. He tells us about how relative valuation becomes important in this
situation:
“(…) I want to have the portfolio in one way, but risk-control tells me that I can‟t. Then I have to
make a quick decision. FI decrees that you immediately have to sell off positions so that you fall
below 40 %... BUT! They also stipulate that you have to have your shareholders best in mind, so
you can‟t sell of to a large discount (…) So I have to sit down and think about what company I
believe in the least. I believe in all, but ranked amongst each other there is one or two that I believe
in the least, and those are the ones I sell off”
Since some companies naturally weigh heavy in the indices, funds cannot take as big bets as they
would like in them. Fund manager 3 describes this:
“Some companies weigh relatively much which makes it difficult to over-weight. As an example,
H&M is a tremendous company, but we can‟t weigh any more in it. Then you have to look for other
companies if you want exposure to a sector […] (H&M) weighs almost 10 % of our fund!”
Fund manager 3 describes how a narrower index becomes even more problematic:
“[it is problematic,] especially with the more narrow indices. [The index is] more narrow, becomes
increasingly difficult. We have liked the telecom companies, Astra, Telia, that weigh a lot. Then we
have had smaller companies that we had large positions in, more than 5 %, and then we are making
big bets in them, SSAB for an instance, in which we had a big over-weight. Then you suddenly have
to look, you‟re forced to choose, prioritize. So yeah, the rule is problematic […] It becomes more
difficult with a more narrow benchmark, it is difficult to manage that type of rule.”
24
Fund 1 Fund 2 Fund 3 Fund 4 Fund 5 Fund 6 Fund 7
Consumer Discretionary 10.2 8.2 9.0 8.9 8.2 6.7 8.9
Consumer Staples
Energy
Financials 7.8 11.0 8.7 7.7 6.3 7.2 9.0
Health Care 5.3 7.6 5.1 9.3
Industrials 11.6 5.8
Information Technology 7.7 6.3 8.7 9.9 8.8 6.9 9.1
Materials
Telecom. Services 9.3 7.3 9.8 9.9 7.3 8.4
Other Fund 6.7
Sum 40.2 47.1 41.4 38.1 48.2 28.1 35.5
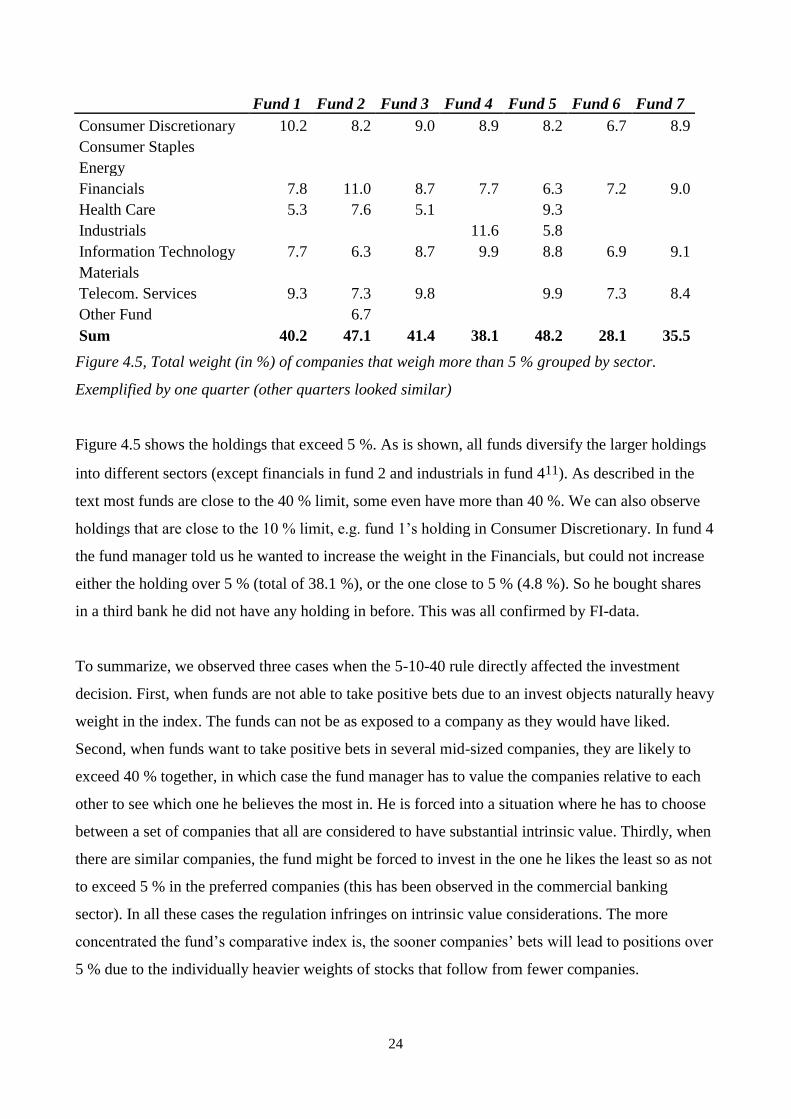
Figure 4.5, Total weight (in %) of companies that weigh more than 5 % grouped by sector.
Exemplified by one quarter (other quarters looked similar)
Figure 4.5 shows the holdings that exceed 5 %. As is shown, all funds diversify the larger holdings
into different sectors (except financials in fund 2 and industrials in fund 411). As described in the
text most funds are close to the 40 % limit, some even have more than 40 %. We can also observe
holdings that are close to the 10 % limit, e.g. fund 1‟s holding in Consumer Discretionary. In fund 4
the fund manager told us he wanted to increase the weight in the Financials, but could not increase
either the holding over 5 % (total of 38.1 %), or the one close to 5 % (4.8 %). So he bought shares
in a third bank he did not have any holding in before. This was all confirmed by FI-data.
To summarize, we observed three cases when the 5-10-40 rule directly affected the investment
decision. First, when funds are not able to take positive bets due to an invest objects naturally heavy
weight in the index. The funds can not be as exposed to a company as they would have liked.
Second, when funds want to take positive bets in several mid-sized companies, they are likely to
exceed 40 % together, in which case the fund manager has to value the companies relative to each
other to see which one he believes the most in. He is forced into a situation where he has to choose
between a set of companies that all are considered to have substantial intrinsic value. Thirdly, when
there are similar companies, the fund might be forced to invest in the one he likes the least so as not
to exceed 5 % in the preferred companies (this has been observed in the commercial banking
sector). In all these cases the regulation infringes on intrinsic value considerations. The more
concentrated the fund‟s comparative index is, the sooner companies‟ bets will lead to positions over
5 % due to the individually heavier weights of stocks that follow from fewer companies.
25
Hellman (2000, p. 159f) presents a situation where one of the interviewees “swaps” Astra for
Ericsson; the interviewee weights up Astra to 9 % at the expense of Ericsson (weight down
Ericsson from 10 %). If the 40 % limit had not been there the interview object would not have
weighted down Ericsson. This result has also been shown in our study, where fund managers are
forced to prioritize holdings over 5 %. Hellman (2000) concludes that the 5-10-40 rule influenced
the decision regarding the portfolio weights in terms of possible numerical combinations.
4.2.2 Ethical Restrictions
The ethical restrictions faced by the fund managers differ. We will initially focus on the negative
screening that was observed in all funds and then we look at the cases where ethical considerations
played a part later in the investment process.
Fund 1 has arranged their ethical considerations so that the fund manager is given a range of
possible investment opportunities that include about 80 % of the market cap. All companies have to
be evaluated, and of practical reasons they start from the large cap and moves downwards. This
means that most small companies are excluded by default. Within those investment objects that the
manager can choose from, he acts as a manager of an ordinary Swedish equity fund without
restrictions (i.e. no interaction with the ethical team). The companies are screened based on pre-set
criteria, such as that a company cannot have more than 5% of its sales from tobacco, oil, alcohol,
gambling, weapons or pornography. This includes among others AxFood, since more than 5 % of
their sales stem from tobacco and beer. There are no exceptions to these screens. The ethic
screening creates problems for the fund manager, and that it can be difficult to get exposure to some
sectors. The company engages in dialogue with investment objects and tries to make them behave
more socially responsible.
Fund 2 has an ethical analyst team that act as support for all fund managers. Only a very few
companies are negatively screened, such as Swedish Match, Saab and the internet poker sites. The
analyst team has never added a company to the list of excluded companies (except those originally
there). The focus of their ethical team is to see where the ethical considerations can create value.
The fund manager therefore has regular contact with the ethical team, and they give
11 Fund 4 also had two holdings that were larger than 4.7 % in the industrial sector, and one more holding larger than
4.7 %.
26
recommendations of companies that are good investments from an ethical perspective. The
interview object tells us that even if he could invest in the excluded companies, he would not, since
he does not see long-term value in them.
Fund 3 uses negative screening. A few Swedish companies are excluded and these include Swedish
Match, Saab and the internet poker sites. The fund manager describes that, with the exception of
Swedish Match, the ethic screens do not affect him. In the interview the manager brought an ethical
expert. The fund manager did not know precisely what companies where excluded, when the
evaluation of companies was done or how often. The list of excluded companies rarely changes.
Fund 4 has an active ethical analyst team that continuously works with ethical questions. The
ethical department has an elaborate list of companies that are excluded, and this list is often updated
(many times as a response to news flows). Companies excluded can include OMXS companies and
the manager is notably affected by companies‟ exclusion. Still, the fund manager is given a list of
excluded companies and invests freely without intervention thereafter. The manager is able to
influence what companies the ethical team should analyse. Before a company is excluded, the fund
manager sits down with the ethical team and they discuss the consequences of the exclusion. The
ethical team meets companies on a regular basis, and especially focuses on emerging markets and
companies‟ (ethically questionable) activities there. The team tries to publicly attract attention to
issues they find important.
Fund 5 uses negative screening and excludes a few companies, just like fund 2 and 3. The list has
not had any additions or subtractions since it was written. Something that differ the fund from 2 and
3 is an elaborate policy on inside information management. If a person employed of the fund broker
has any connections to a listed company, he cannot participate in the discussion of it and usually the
company as an investment object all together. The company has had an „‟ethical mindset‟‟ from the
funds start and even before the fund was officially branded as ethical. However, the fund manager
admits that the fund could work more with the ethical considerations, perhaps by employing an
ethical manager. Even though the ethical mind-set is present in all the managed funds (of which all
are not branded ethical), the ethical part „‟is not part of the fund brokers main business idea‟‟.
Just like for funds 2, 3 and 5, a few companies are excluded for fund 6 and these include Swedish
Match, Saab and the internet poker sites. The fund does not have any in-house ethical expertise.
There is no further ethical work than the negative screening.
27
Fund 7 has an environmental department that works actively for a sustainable society. The
department is responsible for all funds within the fund broker and has created a list containing 11
companies. Only Swedish Match is excluded for the Swedish fund. The fund manager can freely
invest without intervention, except he can not invest in Swedish Match. He thinks it is problematic
that Swedish Match is excluded. The company is engaging in dialogues with companies to work for
ethical questions.
To summarize how the funds are affected by their ethical restrictions, we can group them into two
groups. On one hand, we have fund 1 and fund 4 that have more far-reaching exclusions than the
others. Restrictions can exclude large OMXS companies, or whole sectors. Their lists of excluded
companies are continuously updated and add a factor of uncertainty to the managers. They are
notably affected by this in their fund management.
On the other hand, we have funds 2, 3, 5 and 6 which just exclude Swedish Match, Saab and the
internet poker sites. Finally we have fund 7, who just exclude Swedish Match. These funds are
much less affected by their exclusions. Two of the interview objects are even doubtful if they would
invest in any of the excluded companies if they could. Since the lists have not changed (at least
during our studied period) a sense of stability can be felt. Fund manager 5 tells us:
„‟People ask me: Why are you ethical? That will only lead to worse performance! But no, I don‟t
think so […] it would be different if we couldn‟t buy (as an example) Astra. That would have led to
bigger problems.‟‟
There are some aspects of the ethical branding that further affects the investment decision. One
would be in the cases where ethical considerations reach beyond negative screening, namely in fund
2 and fund 4. Fund 2‟s ethical analyst support function continuously advises on companies that are
best in class from an ethical perspective. The point of this is to find value creating aspects. An
ethical analyst from fund 2 exemplifies it:
"From an ESG perspective all large Swedish banks perform well but Swedbank has consistently
scored a little better than the rest, and this type of information is considered by our fund
managers".
Fund 4 also expresses that they believe that companies that take social responsibility are good
investments, and that they consider this in their investment decisions. We want to be careful about
making statements about if positive screening means a deviation from intrinsic valuation factors. If
ethical considerations create value or not is matter of controversy and it falls outside the focus of
this thesis, so a lengthy discussions will be avoided. Renneboog et al (2008) summarize the
28
discussion. Proponents claim that the SRI screening processes can generate value-relevant
information (foremost good managerial quality and reduced risk for social crises). Opponents mean
that if there were to exist such information they could easily replicate the screens (Renneboog et al,
2008). Since funds 2 and 4 only considers some aspects of ethical considerations, and according to
our observations does not use it categorically, we categorize this as second generation ETHIBEL
ethical thinking.
Another aspect to consider is that funds 1, 2, 4 and 7 engages in dialogue with companies and try to
affect their behavior this way. However, in neither of the cases we have found evidence that this has
affected the fund management. In no cases was the fund managers asked to remain in a position
under ongoing negotiations. Fund managers were never asked to take positions so that the ethical
functions could engage in dialogue. Dialogues appear to happen independently of fund
management. These funds incorporate some aspects of fourth generation ETHIBEL thinking, but
since they do not live up to the third generation according to our observations they cannot formally
qualify for the fourth generation either.
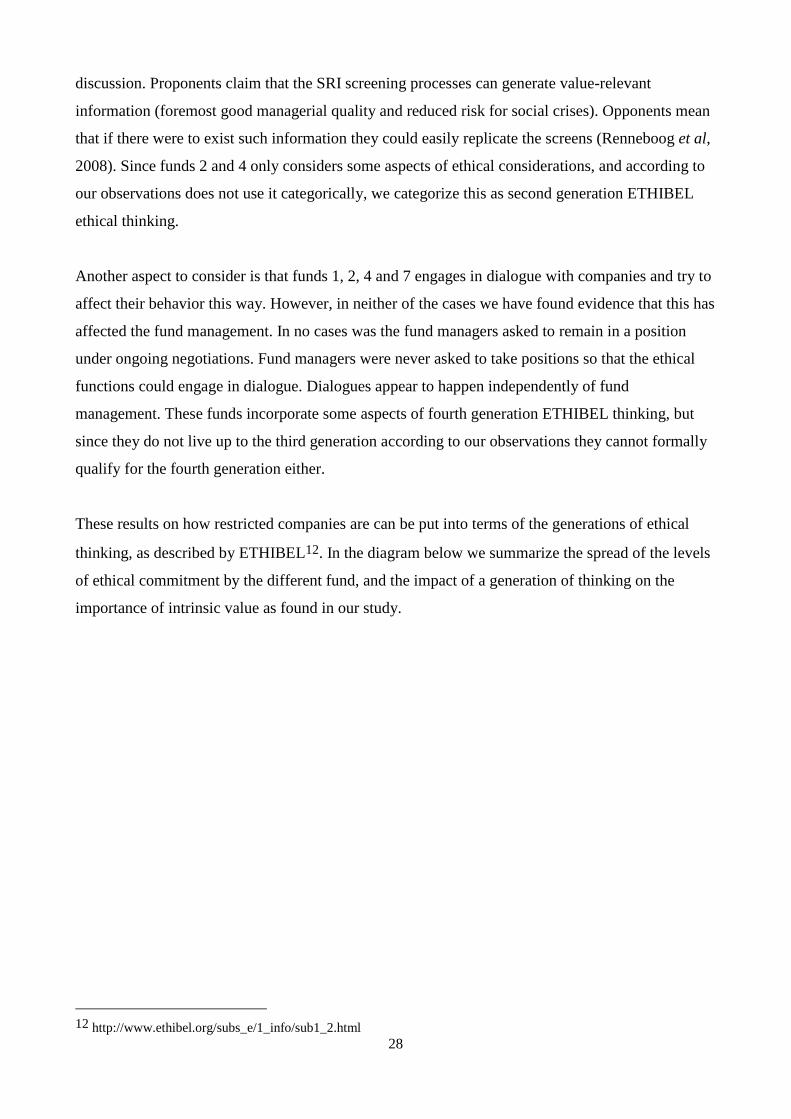
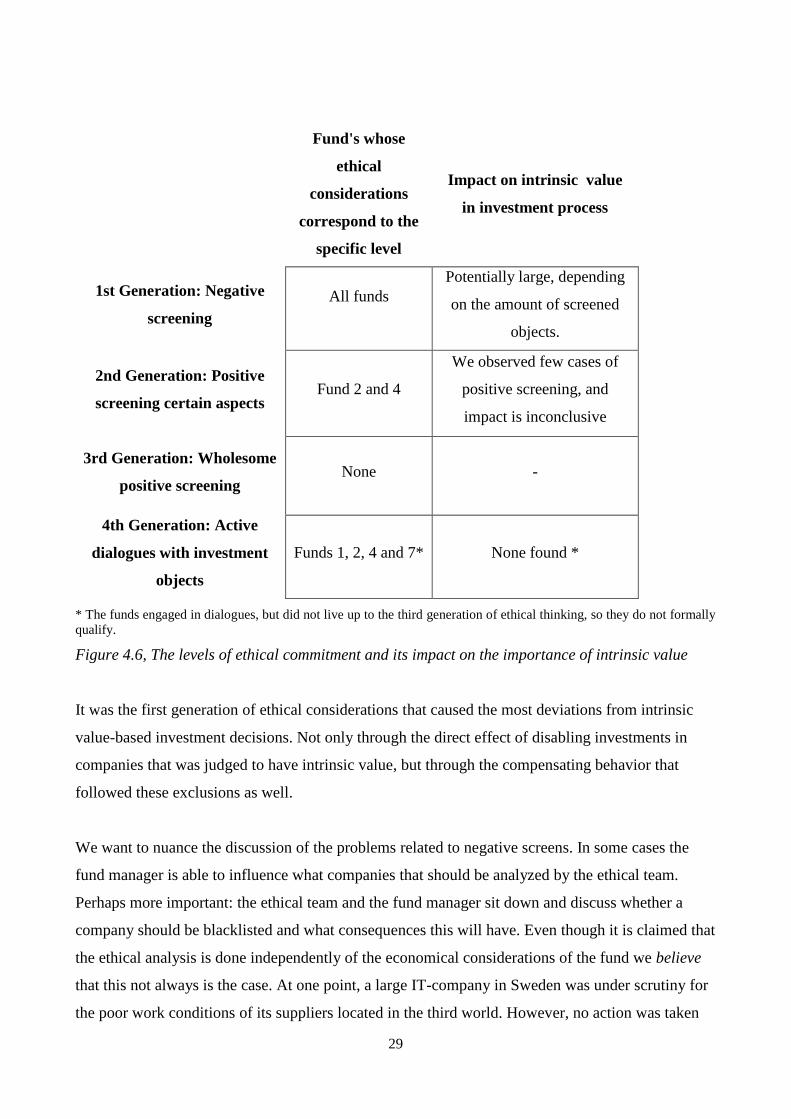
These results on how restricted companies are can be put into terms of the generations of ethical
thinking, as described by ETHIBEL12. In the diagram below we summarize the spread of the levels
of ethical commitment by the different fund, and the impact of a generation of thinking on the
importance of intrinsic value as found in our study.
12 http://www.ethibel.org/subs_e/1_info/sub1_2.html
29
Fund's whose
ethical
considerations
correspond to the
specific level
Impact on intrinsic value
in investment process
1st Generation: Negative
screening
All funds
Potentially large, depending
on the amount of screened
objects.
2nd Generation: Positive
screening certain aspects Fund 2 and 4
We observed few cases of
positive screening, and
impact is inconclusive
3rd Generation: Wholesome
positive screening None -
4th Generation: Active
dialogues with investment
objects
Funds 1, 2, 4 and 7* None found *
* The funds engaged in dialogues, but did not live up to the third generation of ethical thinking, so they do not formally
qualify.
Figure 4.6, The levels of ethical commitment and its impact on the importance of intrinsic value
It was the first generation of ethical considerations that caused the most deviations from intrinsic
value-based investment decisions. Not only through the direct effect of disabling investments in
companies that was judged to have intrinsic value, but through the compensating behavior that
followed these exclusions as well.
We want to nuance the discussion of the problems related to negative screens. In some cases the
fund manager is able to influence what companies that should be analyzed by the ethical team.
Perhaps more important: the ethical team and the fund manager sit down and discuss whether a
company should be blacklisted and what consequences this will have. Even though it is claimed that
the ethical analysis is done independently of the economical considerations of the fund we believe
that this not always is the case. At one point, a large IT-company in Sweden was under scrutiny for
the poor work conditions of its suppliers located in the third world. However, no action was taken
30
by the ethical analysts. At this point we believe that an exclusion of this company would have
created a difficult situation for the fund manager so they (formally or informally) agreed not to act.
We open for the possibility that the ethical analysis influences and is influenced by the fund
management and investment decision process to a larger extent than what has been explicitly said in
interviews and other secondary data in some of the funds we have studied.
Finally we want to comment on Fund 1‟s lacking opportunity to invest in small-cap exposure due to
ethical exclusion. The reasoning is that small companies lack the facilities and mind-set to live up to
the set ethical standards. While in itself a restriction that potentially prevents investing based on
intrinsic value, the practical consequences are limited compared with the other funds as we shall see
in section 4.3.2 where we discuss the implications of stocks‟ liquidity, and the funds‟ general
inability to invest in small-cap companies.
4.2.3 Compensating Behavior
The ethical screening and the 5-10-40 rule leads to compensating behavior. Fund 1 screened sectors
include all oil related sub-sectors. To get exposure to rising oil prices the fund has invested in
companies that produce products for the oil industry, such as AtlasCopco, Sandvik or ABB. The
fund manager talks about compensating exposure to the oil-sector:
“We have been able to have positions in substitutes, or not substitutes but comparable sectors, such
as SSAB or even AtlasCopco and Sandvik who supply products to this sector that is having a boom
time, so indirectly… indirectly you are exposed to what also has driven the oil-sector, at least a
bit.”
Another sector that is influenced by the screen is the financial sectors. The two major Swedish
investment companies, Kinnevik and Investor, are unavailable (due to interests in the arms-
industry). To compensate for this and remain weighted at par in the financial sector, the fund has
over-invested in Nordea:
“[the 5-10-40 rule] becomes especially decisive for the biggest companies on the stock exchange
[...] Nordea weighs somewhere between 7 and 8 percent of the index. You have to decide which
companies to allow to be your five biggest [...] it becomes especially complicated in the ethic funds,
because you have to compensate blacklisted companies with others. So it could be so that Nordea
has been over-weighted due to technicalities and so forth.”
31
Fund 4 has blacklisted a large telecom company. This creates some problems for the fund manager:
“The problem with the ethical funds is that they haven‟t been allowed [the telecom company],
[they] have done well lately. Then we try to compensate it with something else. [How do you solve
that?] Then we have to look at the other telecom companies. [...] [They] have taken different risks,
they have been exposed to emerging markets and that hasn‟t been very good lately.”
We see that due to the SSE‟s inherent characteristics, i.e. its relatively small size, it is difficult to
find perfect substitutes to blacklisted companies. In this case the manager is looking for substitutes
and in the process has to forego some of the intrinsic valuation factors that he found value creating
in the original company i.e. the company specific risk exposure. Other excluded companies are
easier to substitute. This manager explains that since the only company that Investor holds that is
off limit is SAAB, it is possible to take direct positions in those companies. The same point of view
was expressed by fund manager 1 and 6.
Fund 2, 3 and 5 are faced with fewer excluded companies so their compensating behavior is less
prominent. The only company that is described as potentially interesting of the screened ones is
Swedish Match. We will further discuss the implications of this exclusion in section 4.3.2 when we
discuss the Consumer Staples sector. We categorically found a link between a high degree of ethical
restrictions and compensating behavior.
The 5-10-40 rule gives rise to some compensations, as described by fund manager 3:
“[...]Kappahl was such a company that [as compared with H&M] was similar. A retail company.
[...] in H&M we already own as much as we are allowed.”
Another similar example is when a fund manager is forced to invest in a company similar to the one
he originally intended due to the regulation. Fund manager 4 answers, when we ask about their
under-weight in the financial sector:
“It is because we have been under-weighted in the commercial banks even though we didn‟t want to
when prices are as low as they are now. So we had to weigh up the sector. Then we had to go into
(Svenska Handelsbanken) because we had too much weight in the other banks. (…) [the 5-10-40
rule] doesn‟t allow us to have more in SEB or Swedbank.”
The 5-10-40 gave rise to mainly intra-sectoral compensating behavior, which is natural since the 5-
10-40 rule concerns individual positions.
32
The mismatch of actual investment objects available and the ones included in the comparative index
has been identified as a main restricting factor. We asked the interview objects why they did not
benchmark to an ethical index to mitigate this mismatch. Some fund managers said that could be a
good solution but did not know that such an index existed. Fund manager 3 explained that it would
be problematic to use many different benchmarks for different products. He explains,
“[…] if the ethical part of the fund would have been more prominent, so that more companies
would have been excluded, then it would have been necessary. [As of now] only a few numbers of
companies are excluded, so it doesn‟t make that big of a difference.”
Fund manager 5 also expresses that it is not relevant to use an ethical index since only a few
companies are excluded. Fund manager 1 believes that the investors would prefer an ordinary
index,
“[…] it is not justifying [that they do not use an ethical index] for me as a manager. But, my
customers, they are interested in how this sort of funds‟ performance turns out compared to a
traditional fund.”
SIX offers an ethical index together with the Global Ethical Standard, GES, called
SIXETHICALSE (www.six.se). We observe that the funds with more ethical restrictions would
have appreciated an ethical benchmark index more than the funds with less restriction. This leans
support to our conclusion that the combination of index focus and exclusions from the index is
unfortunate for the fund manager.
4.2.4 Summary
In this section we have illustrated how the combination of the restrictions of only being able to
invest in Swedish equity, of the ethical restrictions, and of the 5-10-40 rule create a compensating
behavior that takes focus from intrinsic value. The most important results are
The 5-10-40 rule prevented investments on intrinsic value in a number of ways. Funds were not
able to take as large bets as they wanted in heavy weighting companies. This problem becomes
more important with a narrower index. Situations where companies, all perceived to have
intrinsic value, had to be valued relative each other occurred. The ones with the „least over-
value relative stock price‟ were invested less in.
33
The funds can be divided into two groups with regards to ethical restrictions; the ones with a
few excluded companies and the ones who exclude larger companies or sectors. The ones with
the more far-going exclusions showed more compensating behavior. The 1st generation of
ethical thinking was what we observed impacted intrinsic value considerations.
The 5-10-40 rule led to primarily intra-sectoral compensating behavior.
4.3 Expertise within the Fund Broker
In this section, we investigate what consequences factors related to information and knowledge of
companies and sectors has on the use of intrinsic valuation factors in the investment decision.
Fund 1 is a large fund broker, one of the biggest in Swedish fund brokering seen to the capital
they manage. They are part of a large financial institution with other areas of operation than
fund management. The fund broker has a wholesome analyst team that act as support for all
fund managers. The analyst team has picked out model-portfolios for the fund-managers to rely
on. They claim to have expertise within all sectors, and this is described as one of the funds
comparative edges by the fund manager. Another edge, as described by the manager, is their
developed contact net with stockbrokers. The stockbrokers provide them with opportunities to
interview and interact with the management of their investment companies. This is a benefit that
they use frequently, and the fund manager usually has at least two meetings with management
of different companies every day. For the bigger companies on the SSE, they try to meet
management at least quarterly. At times when a company's profitability is questioned, such as
when a company signals lower profits than budgeted or adverse news related to their key
markets are released, the opportunity to talk to the management directly is frequently used.
Fund 2 is managed by one of the Nordic regions largest fund brokers. The Swedish fund
brokering is just a small part of their operations. This makes the Swedish market investment
team relatively small. They have expertise within certain sectors and sub-sectors, and they have
an explicit strategy of more sector bets than individual stock bets. In smaller and mid-sized
companies, especially when they own a large equity stake in them, they usually have access but
in large cap companies they usually meet with the Investor Relations department. They visit the
companies‟ production facilities at times to get a good sense of their business.
34
Fund 3 is part of a big Swedish financial institution. The fund broker part is only a small part of
the institution. The section dedicated to Swedish fund managing is small. The fund manager
also describes his own fund as small, and they do not have any dedicated analysts as a result of
this. Instead, the employees each have a field of expertise, usually one or several sectors, and
they act as analysts as well as another professional role such as fund managers or assistant fund
managers. The fund manager tells us that cooperation between employees becomes very
important and that other fund managers (at the same fund broker), with different areas of
expertise, often are consulted in investment decisions.
Fund 4 is managed by a smaller fund broker. The fund managing team consists of one manager,
two analysts (normally, but one is on maternity leave at the moment) and two traders. The
manager has some sectoral responsibilities, as has one of the traders who are mainly responsible
for risk-and technical-analysis. They have a close collaboration with an external ethical
department.
Fund 5 is a small fund that is managed by a small fund broker. The fund manager has a
developed contact net with Swedish CEO‟s thanks to previous employments.
Fund 6 is managed by a small fund broker with a small fund investment team.
Fund 7 is managed by a big Swedish financial institution. The fund manager has a large
analytical team to his disposal, and the fund claim competence within all sectors. The manager
has frequent contact with investment object management, and a developed contact net within
stockbrokers.
A small fund broker that lacks the general analytical resources that a large fund broker has in-house
will have more focused areas of expertise. In all our interviews with the smaller fund brokers, while
not directly asked, it has been brought up that the funds feel that they ''understand'' or ''know''
certain industries better than others. The funds with larger resources rather expressed that they had
competence within all sectors and companies. Note that some of the fund brokers referred to as
small here might be part of big institutions, but have a smaller section dedicated to Swedish fund
managing.
We saw a connection between the areas of expertise and the trade activity and bet placement. Fund
manager 3 had a background as an analyst within the financial sector. In the empirical data as well
as in the interview, we understood that this was one of the sectors where they made the most short-
term trading to capture market movements. As an example, the fund was zero-weighted in one of
the big Swedish commercial banks in one period, and over-weighted in other periods. Even within
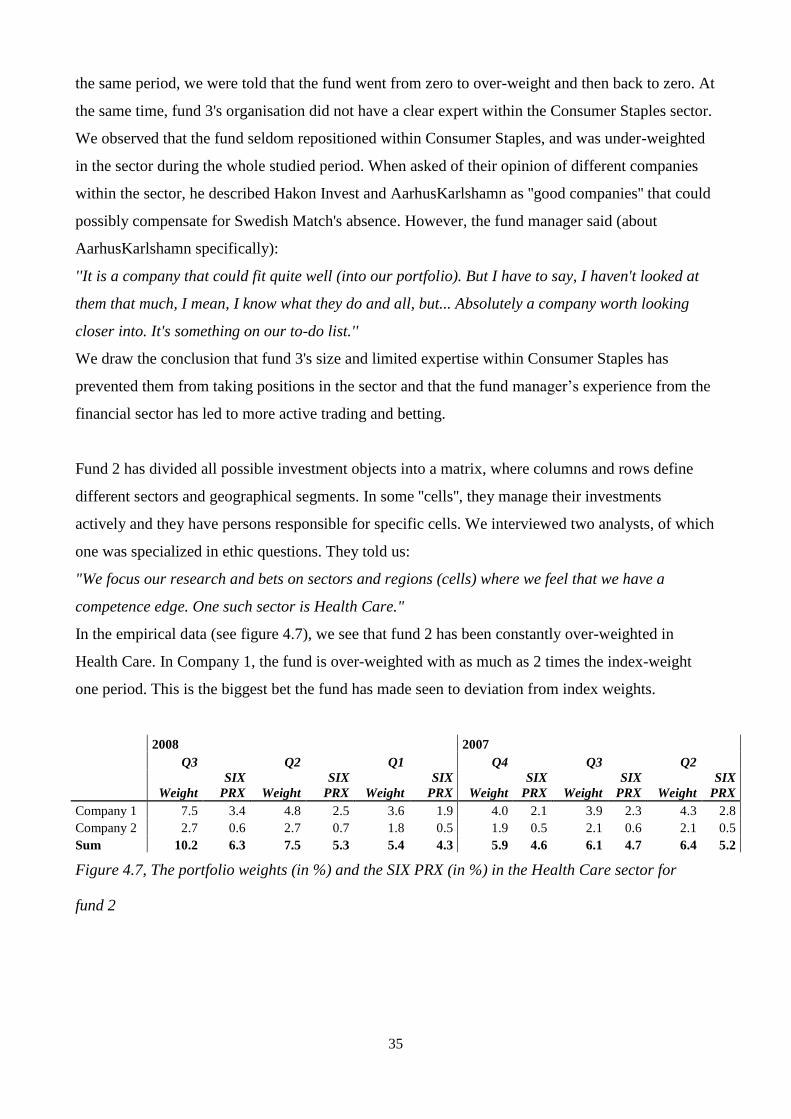
35
the same period, we were told that the fund went from zero to over-weight and then back to zero. At
the same time, fund 3's organisation did not have a clear expert within the Consumer Staples sector.
We observed that the fund seldom repositioned within Consumer Staples, and was under-weighted
in the sector during the whole studied period. When asked of their opinion of different companies
within the sector, he described Hakon Invest and AarhusKarlshamn as ''good companies'' that could
possibly compensate for Swedish Match's absence. However, the fund manager said (about
AarhusKarlshamn specifically):
''It is a company that could fit quite well (into our portfolio). But I have to say, I haven't looked at
them that much, I mean, I know what they do and all, but... Absolutely a company worth looking
closer into. It's something on our to-do list.''
We draw the conclusion that fund 3's size and limited expertise within Consumer Staples has
prevented them from taking positions in the sector and that the fund manager‟s experience from the
financial sector has led to more active trading and betting.
Fund 2 has divided all possible investment objects into a matrix, where columns and rows define
different sectors and geographical segments. In some ''cells'', they manage their investments
actively and they have persons responsible for specific cells. We interviewed two analysts, of which
one was specialized in ethic questions. They told us:
"We focus our research and bets on sectors and regions (cells) where we feel that we have a
competence edge. One such sector is Health Care."
In the empirical data (see figure 4.7), we see that fund 2 has been constantly over-weighted in
Health Care. In Company 1, the fund is over-weighted with as much as 2 times the index-weight
one period. This is the biggest bet the fund has made seen to deviation from index weights.
2008 2007
Q3 Q2 Q1 Q4 Q3 Q2
Weight
SIX
PRX Weight
SIX
PRX Weight
SIX
PRX Weight
SIX
PRX Weight
SIX
PRX Weight
SIX
PRX
Company 1 7.5 3.4 4.8 2.5 3.6 1.9 4.0 2.1 3.9 2.3 4.3 2.8
Company 2 2.7 0.6 2.7 0.7 1.8 0.5 1.9 0.5 2.1 0.6 2.1 0.5
Sum 10.2 6.3 7.5 5.3 5.4 4.3 5.9 4.6 6.1 4.7 6.4 5.2
Figure 4.7, The portfolio weights (in %) and the SIX PRX (in %) in the Health Care sector for
fund 2
36
Fund 4 has only 2 analysts, and willingly admits that they focus on only the most traded stocks:
“We have two analysts so there are quite a few companies to analyze. [...]We focus on, maybe, half
the universe [of stocks] and the rest we don‟t look at. There are a lot of IT-companies and such that
we don‟t follow closely.”
Fund 1 on the other hand claim to have detailed knowledge of all mid- and large-cap corporations
as well as some of the smaller ones. This led to a strategy of ''stock-picking'', as described by the
fund manager:
„„(Our) philosophy is to be invested in a lot of small companies. We are a big company and can
make the best analysis of everyone, of all companies. We have a good relation to all companies (in
terms of access) (...) our goal is to be neutral in all sectors, but pick the best individual stocks''
When funds have better access to information, it is easier to let intrinsic valuation factors play an
important part. When a fund manager lacks information of certain companies, or sectors, he simply
will be adverse to invest in them as compared to companies he knows better. It follows naturally
that an investment team that consist of only a few employees won‟t have time to monitor all of the
hundreds of stock at SSE.
Several studies have shown empirical evidence of home-bias (see for example Coval & Moskowitz,
2001). Coval & Moskowitz (2001) describe that mutual fund managers trade locally on an
informational advantage, they have superior information about local stocks. James & Karceski
(2006) describe that institutional investors are generally assumed to be better informed than smaller
investors. The lower search costs should lead to different and presumably more sophisticated
investment selection criteria, the institutional investor can select the equities with better knowledge
(James & Karcerski, 2006).
We believe that the fund with better access to information should be able to make better decisions.
However this thesis does not examine the performance of the funds. But parallels can be drawn to
the home bias; the funds with less information are more eager to invest in companies they know
better.
37
4.3.1 Time-horizons
The level of in-house expertise affected the time horizons of the investments, i.e. some investments
were based on long-term, sustainable value within the company and some on expected short-term
market movements. Investment that were based on expectations of short-term market movements
often differed from an investment based on intrinsic value, the fund manager then believed that the
market price would change regardless of the intrinsic value. Fund manager 4 describes the in-house
expertise within the telecom sector,
“[Regarding Ericsson] If we can‟t evaluate the company thoroughly, we don‟t take any risks. We
want companies that we have an edge in [WHAT DO YOU MEAN BY EDGE?] That we know the
company well. We see that our predictions fall out well [...] Millicom is such a company. We have
been in positions when it‟s been good and out of position when it turns bad. Two years ago, they
were target for a merger. We had a lot of stocks then. It came to a critical moment. Then we made
the call that the merger wouldn‟t fall through, so we sold it and at that time we had a lot of contact
with management. [from the contact with management] we drew the conclusion that the risk was
too big and that the deal wouldn‟t go through. And there wasn‟t any deal. So the stock price
plummeted and we repurchased it. Then we joined for another ride. We have done that a few times”
The fund manager then bought and sold the equity based on expected market movements, because
he had better knowledge of that company.
Fund manager 3 had better knowledge within the financial sector because he had been an analyst
within that sector before he became a fund manager:
“In (one bank) we have been active back and forward, during the third quarter we have had both
over-weight and zero. We have been pretty active. Tried to earn some money on the large
movements that has been.”
To the contrary of specific knowledge within certain sectors or companies, we have the fund
manager that has good knowledge in every sector and every company. The fund manager explained
that the price of a share was not solely based on intrinsic value, but one have to consider soft factors
in the decision making. He even had experienced that sometimes he knew more than the market, but
this was rather to his disadvantages because then the marked did not react as he had expected.
38
Regarding to this he expressed a need to understand the market‟s opinion:
“You can‟t just listen to one analyst; you have to see several to capture how the market thinks. In a
lot of situations we have more information than the analyst we are listening to because we have just
met the company‟s management. Still, we are interested in the „simple‟ version of how the company
is interpreted, because it is a part of how the market reasons.”
Even if the fund manager had an idea of the long-term value of the share he argued that it was
important to understand the short-term movements of the stock market and that the intrinsic value
was not always reflected in the price.
The results we have seen are that the in-house expertise affected the time-horizons of the fund
manager. Especially, when the fund manager had more knowledge, within a company or a sector,
bets were made on short-term movements. Betting on the markets movements is related solely to
the investors‟ expectations. The funds that bet on these movements often know more about the
company and have a different opinion about the intrinsic value but can still earn money on these
movements. We have also seen that the manager with most knowledge wanted to understand the
market opinion and was aware that the intrinsic value was not reflected in the market price but
timing had to be considered.
The funds that invested on short-term movements often knew more thanks to non-public
information they had attained. Hellman (2000) found that non-public information plays an essential
role in the decision making. It was used to form a fundamental opinion about the company.
Hellman (2000) also presents that Holland & Doran (in Hellman, 2000, p. 124) report that private
information from the direct company contact was central to fund management decisions. In our
study we saw this in the funds where the fund broker had in-house expertise.
Hellman (2000) also found that the institutional investors‟ fundamental opinions were influenced by
observations of market opinions regarding particular companies/equities. We saw this in the fund
that at times had more knowledge than the market and wished to understand the market pricing so
he could invest on the prevailing market price.
39
4.3.2 Compensating Behavior
The compensating behavior was a result of several restricting factors. All funds were under-
weighted within the Consumer Staples sector. This was due to the small numbers of share within
the sector, many fund managers lacked expertise within the sector and many companies had low
liquidity, see section 4.4. Fund 2 took larger positions in AstraZeneca instead that is a company
they like and has “good defensive qualities”. The health care sector was explained to be a sector
they had good in-house expertise within. Therefore, they compensated for the lack of expertise in
the Consumer Staples, a defensive sector, with more holdings in Health Care, a defensive sector
they had great in-house expertise in.
4.3.3 Summary
In this section we have illustrated how the access to knowledge influences the behavior of the
manager. The most important results are:
When an investment team has deeper knowledge about a sector they will trade more intensively
and take bigger bets in that sector.
The fund will try to take advantage of short-term market movements.
If a team has little knowledge about a sector, they will usually over-look it or invest in a sector
they have in-house expertise in. This could mean that attention is paid to a sector where there is
less intrinsic value than others less known about.
4.4 The Liquidity of the Investment Object
In this section we will discuss how qualities of the investment objects can affect the investment
decision and cause the fund manager to deviate from intrinsic value. Funds are big players on the
stock market and their relative size can cause price movements as they purchase or sell equity. The
average daily traded volumes of the shares - the liquidity of the share - become important in the
investment decision.
Fund manager 1 explains that liquidity becomes especially important when market conditions are
extra-ordinary, or during a severe bear market when trade volumes are more unpredictable and
spotty. Fund manager 5 agrees:
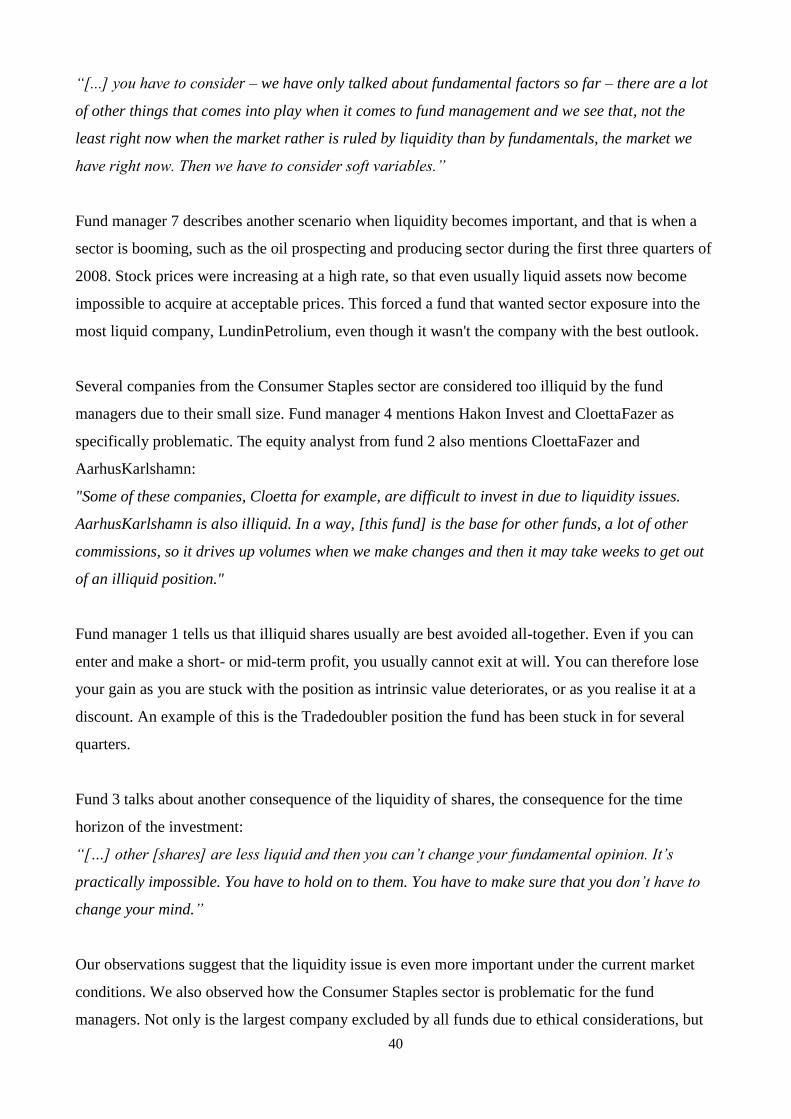
40
“[...] you have to consider – we have only talked about fundamental factors so far – there are a lot
of other things that comes into play when it comes to fund management and we see that, not the
least right now when the market rather is ruled by liquidity than by fundamentals, the market we
have right now. Then we have to consider soft variables.”
Fund manager 7 describes another scenario when liquidity becomes important, and that is when a
sector is booming, such as the oil prospecting and producing sector during the first three quarters of
2008. Stock prices were increasing at a high rate, so that even usually liquid assets now become
impossible to acquire at acceptable prices. This forced a fund that wanted sector exposure into the
most liquid company, LundinPetrolium, even though it wasn't the company with the best outlook.
Several companies from the Consumer Staples sector are considered too illiquid by the fund
managers due to their small size. Fund manager 4 mentions Hakon Invest and CloettaFazer as
specifically problematic. The equity analyst from fund 2 also mentions CloettaFazer and
AarhusKarlshamn:
"Some of these companies, Cloetta for example, are difficult to invest in due to liquidity issues.
AarhusKarlshamn is also illiquid. In a way, [this fund] is the base for other funds, a lot of other
commissions, so it drives up volumes when we make changes and then it may take weeks to get out
of an illiquid position."
Fund manager 1 tells us that illiquid shares usually are best avoided all-together. Even if you can
enter and make a short- or mid-term profit, you usually cannot exit at will. You can therefore lose
your gain as you are stuck with the position as intrinsic value deteriorates, or as you realise it at a
discount. An example of this is the Tradedoubler position the fund has been stuck in for several
quarters.
Fund 3 talks about another consequence of the liquidity of shares, the consequence for the time
horizon of the investment:
“[…] other [shares] are less liquid and then you can‟t change your fundamental opinion. It‟s
practically impossible. You have to hold on to them. You have to make sure that you don‟t have to
change your mind.”
Our observations suggest that the liquidity issue is even more important under the current market
conditions. We also observed how the Consumer Staples sector is problematic for the fund
managers. Not only is the largest company excluded by all funds due to ethical considerations, but
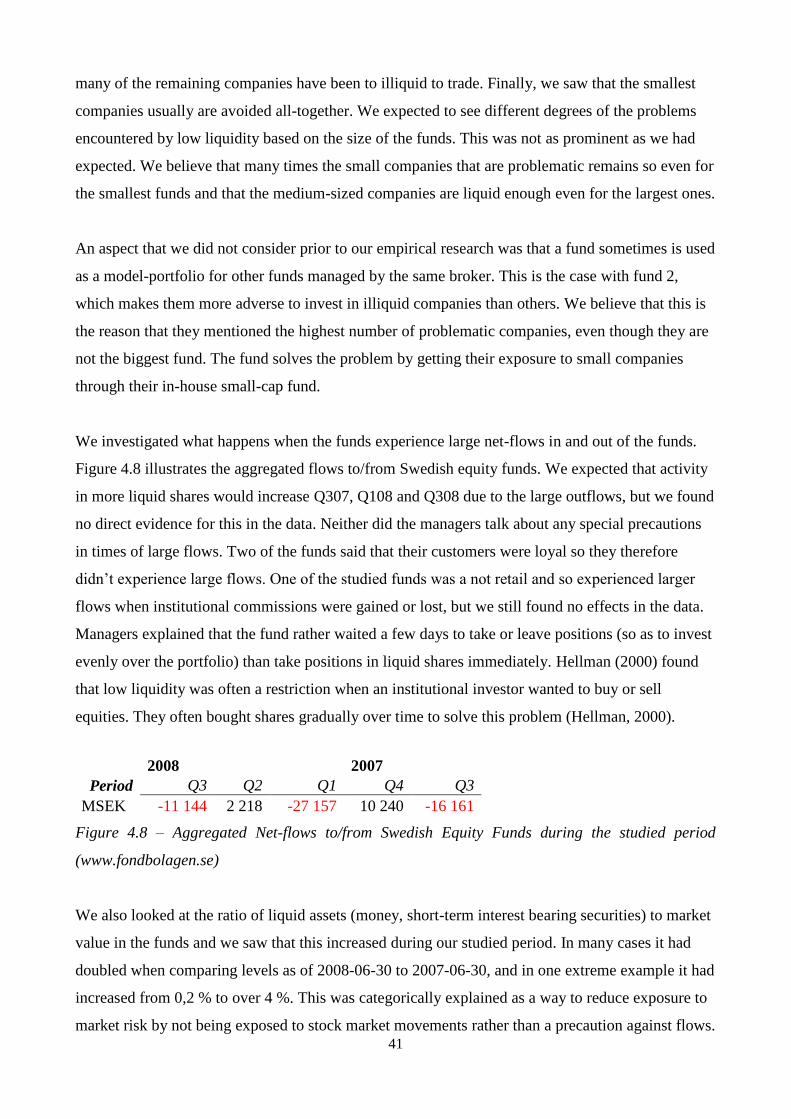
41
many of the remaining companies have been to illiquid to trade. Finally, we saw that the smallest
companies usually are avoided all-together. We expected to see different degrees of the problems
encountered by low liquidity based on the size of the funds. This was not as prominent as we had
expected. We believe that many times the small companies that are problematic remains so even for
the smallest funds and that the medium-sized companies are liquid enough even for the largest ones.
An aspect that we did not consider prior to our empirical research was that a fund sometimes is used
as a model-portfolio for other funds managed by the same broker. This is the case with fund 2,
which makes them more adverse to invest in illiquid companies than others. We believe that this is
the reason that they mentioned the highest number of problematic companies, even though they are
not the biggest fund. The fund solves the problem by getting their exposure to small companies
through their in-house small-cap fund.
We investigated what happens when the funds experience large net-flows in and out of the funds.
Figure 4.8 illustrates the aggregated flows to/from Swedish equity funds. We expected that activity
in more liquid shares would increase Q307, Q108 and Q308 due to the large outflows, but we found
no direct evidence for this in the data. Neither did the managers talk about any special precautions
in times of large flows. Two of the funds said that their customers were loyal so they therefore
didn‟t experience large flows. One of the studied funds was a not retail and so experienced larger
flows when institutional commissions were gained or lost, but we still found no effects in the data.
Managers explained that the fund rather waited a few days to take or leave positions (so as to invest
evenly over the portfolio) than take positions in liquid shares immediately. Hellman (2000) found
that low liquidity was often a restriction when an institutional investor wanted to buy or sell
equities. They often bought shares gradually over time to solve this problem (Hellman, 2000).
2008 2007
Period Q3 Q2 Q1 Q4 Q3
MSEK -11 144 2 218 -27 157 10 240 -16 161
Figure 4.8 – Aggregated Net-flows to/from Swedish Equity Funds during the studied period
(www.fondbolagen.se)
We also looked at the ratio of liquid assets (money, short-term interest bearing securities) to market
value in the funds and we saw that this increased during our studied period. In many cases it had
doubled when comparing levels as of 2008-06-30 to 2007-06-30, and in one extreme example it had
increased from 0,2 % to over 4 %. This was categorically explained as a way to reduce exposure to
market risk by not being exposed to stock market movements rather than a precaution against flows.
42
4.4.1 Compensating Behavior
Some companies were avoided due to low liquidity, mostly small caps. In some funds the small-cap
companies were restricted due to the ethical aspects. In one fund they compensated for the low
liquidity in small-cap companies by investing in a small-cap fund instead.
Another aspect of liquidity was when stock prices rose sharply and the low liquidity of the equity
made it difficult for the fund to buy equity. This was seen in the oil-boom. The fund managers then
bought equity in the largest oil company even though the manager preferred several other oil
companies.
4.4.2 Summary
In this section we have illustrated how the qualities in the investment object has affected the
importance of intrinsic value in the investment decision. The most important results are
Illiquid stocks are often avoided. Even if a fund makes a short- or mid-term profit, it can just as
easily be erased as conditions deteriorate and the fund is stuck in its position.
During extraordinary market conditions, such as the prevailing market, liquidity becomes more
important.
During a sectoral boom, fund managers find it difficult to buy a specific stock that has the most
intrinsic value since the demand of stocks at a price-level exceed the supply. The fund is forced
to purchase the most liquid company instead.
Illiquid shares demand long-term commitment to the stock.
43
5. Discussion of the Empirical Results
In section 5.1 we will summarize our most important conclusions and discuss how strong the results
are. In section 5.2 we will discuss why we did and why we did not observe certain results. In
section 5.3 we will discuss the validity of our work.
5.1 Summary of the most important results
We set out to investigate three questions in our study: what restricting factors exist that limit the
impact of intrinsic value in the fund managers‟ investment decision, what specific restrictions the
ethical profile conveys and finally to investigate the relative importance of intrinsic value in the
investment decision. We have identified a number of factors that directly limits the fund manager‟s
ability to invest based on intrinsic value.
The single factor that impacted the importance of intrinsic value the most was the index that the
fund was benchmarked to. The conflicts with investments on intrinsic value due to the index-focus
became most obvious in heavy index weighting companies. Even if the manager does not see
intrinsic value in a share he might hold a substantial amount to avoid large index deviations. When
the manager was uncertain about a share he remained close to the index weight. This is supported
by our FI-data and the interviews as well as previous research, and we feel that we have strong
support for the conclusion.
The managers were restricted to invest only in Swedish equity. The SSE characteristics include
several individually heavy companies and few direct substitutes to companies. We conclude that
this was a contributing factor to the level of compensating behavior seen. Another problem
inherited from the SSE is that there exist many illiquid shares. The liquidity of individual equities
has caused the investor to neglect intrinsic value, since illiquid companies with intrinsic value have
been avoided. All fund managers described that they had the liquidity of companies in mind and
most fund managers often avoided less liquid companies, or waited until they were really sure and
then made a bet on that share. All interview subjects mentioned this as a problem, and we saw in the
empirical data that funds indeed held some illiquid positions that they had expressed a desire to get
out of. We also saw that they did not hold companies they had described as „good companies‟ but
too illiquid. We considered this a strong result supported by both FI-data and interviews.
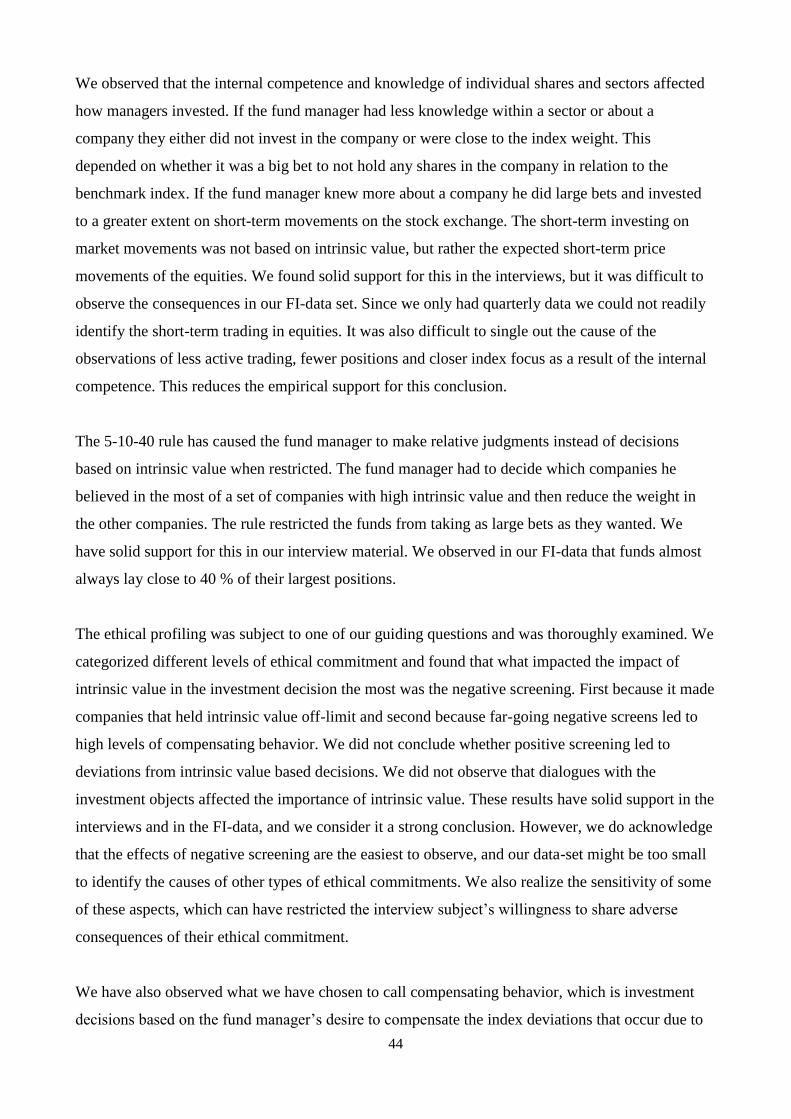
44
We observed that the internal competence and knowledge of individual shares and sectors affected
how managers invested. If the fund manager had less knowledge within a sector or about a
company they either did not invest in the company or were close to the index weight. This
depended on whether it was a big bet to not hold any shares in the company in relation to the
benchmark index. If the fund manager knew more about a company he did large bets and invested
to a greater extent on short-term movements on the stock exchange. The short-term investing on
market movements was not based on intrinsic value, but rather the expected short-term price
movements of the equities. We found solid support for this in the interviews, but it was difficult to
observe the consequences in our FI-data set. Since we only had quarterly data we could not readily
identify the short-term trading in equities. It was also difficult to single out the cause of the
observations of less active trading, fewer positions and closer index focus as a result of the internal
competence. This reduces the empirical support for this conclusion.
The 5-10-40 rule has caused the fund manager to make relative judgments instead of decisions
based on intrinsic value when restricted. The fund manager had to decide which companies he
believed in the most of a set of companies with high intrinsic value and then reduce the weight in
the other companies. The rule restricted the funds from taking as large bets as they wanted. We
have solid support for this in our interview material. We observed in our FI-data that funds almost
always lay close to 40 % of their largest positions.
The ethical profiling was subject to one of our guiding questions and was thoroughly examined. We
categorized different levels of ethical commitment and found that what impacted the impact of
intrinsic value in the investment decision the most was the negative screening. First because it made
companies that held intrinsic value off-limit and second because far-going negative screens led to
high levels of compensating behavior. We did not conclude whether positive screening led to
deviations from intrinsic value based decisions. We did not observe that dialogues with the
investment objects affected the importance of intrinsic value. These results have solid support in the
interviews and in the FI-data, and we consider it a strong conclusion. However, we do acknowledge
that the effects of negative screening are the easiest to observe, and our data-set might be too small
to identify the causes of other types of ethical commitments. We also realize the sensitivity of some
of these aspects, which can have restricted the interview subject‟s willingness to share adverse
consequences of their ethical commitment.
We have also observed what we have chosen to call compensating behavior, which is investment
decisions based on the fund manager‟s desire to compensate the index deviations that occur due to
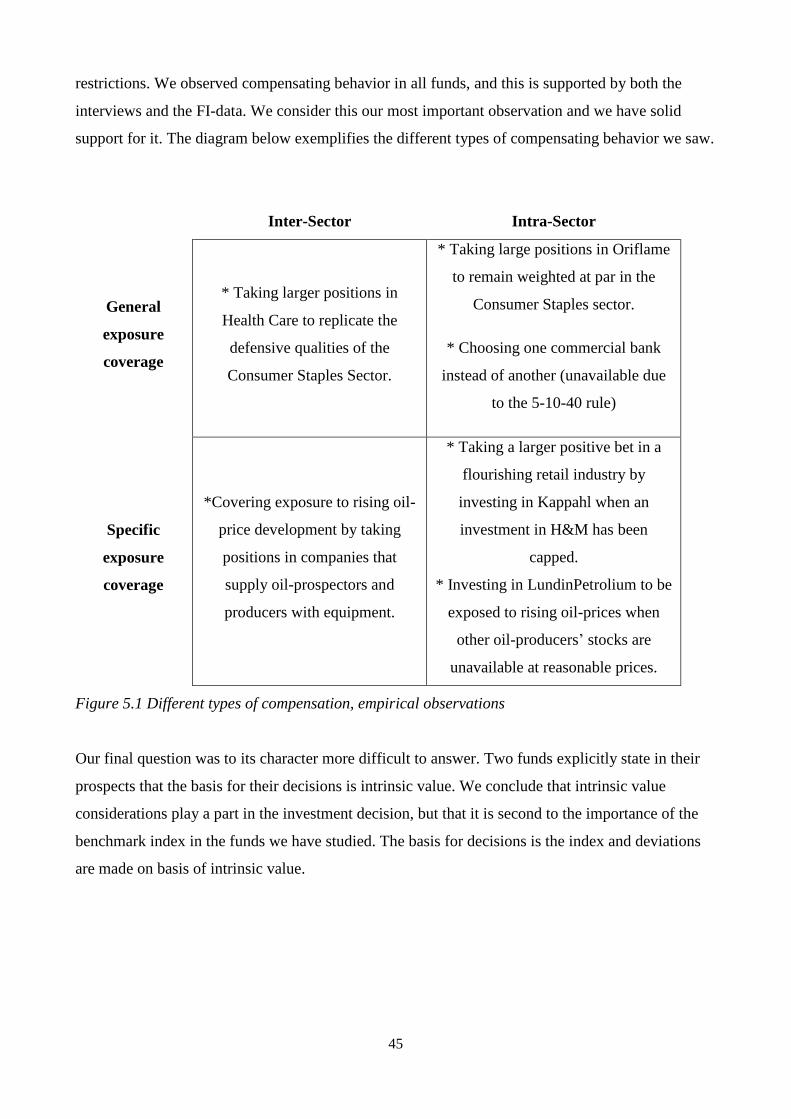
45
restrictions. We observed compensating behavior in all funds, and this is supported by both the
interviews and the FI-data. We consider this our most important observation and we have solid
support for it. The diagram below exemplifies the different types of compensating behavior we saw.
Inter-Sector Intra-Sector
General
exposure
coverage
* Taking larger positions in
Health Care to replicate the
defensive qualities of the
Consumer Staples Sector.
* Taking large positions in Oriflame
to remain weighted at par in the
Consumer Staples sector.
* Choosing one commercial bank
instead of another (unavailable due
to the 5-10-40 rule)
Specific
exposure
coverage
*Covering exposure to rising oil-
price development by taking
positions in companies that
supply oil-prospectors and
producers with equipment.
* Taking a larger positive bet in a
flourishing retail industry by
investing in Kappahl when an
investment in H&M has been
capped.
* Investing in LundinPetrolium to be
exposed to rising oil-prices when
other oil-producers‟ stocks are
unavailable at reasonable prices.
Figure 5.1 Different types of compensation, empirical observations
Our final question was to its character more difficult to answer. Two funds explicitly state in their
prospects that the basis for their decisions is intrinsic value. We conclude that intrinsic value
considerations play a part in the investment decision, but that it is second to the importance of the
benchmark index in the funds we have studied. The basis for decisions is the index and deviations
are made on basis of intrinsic value.
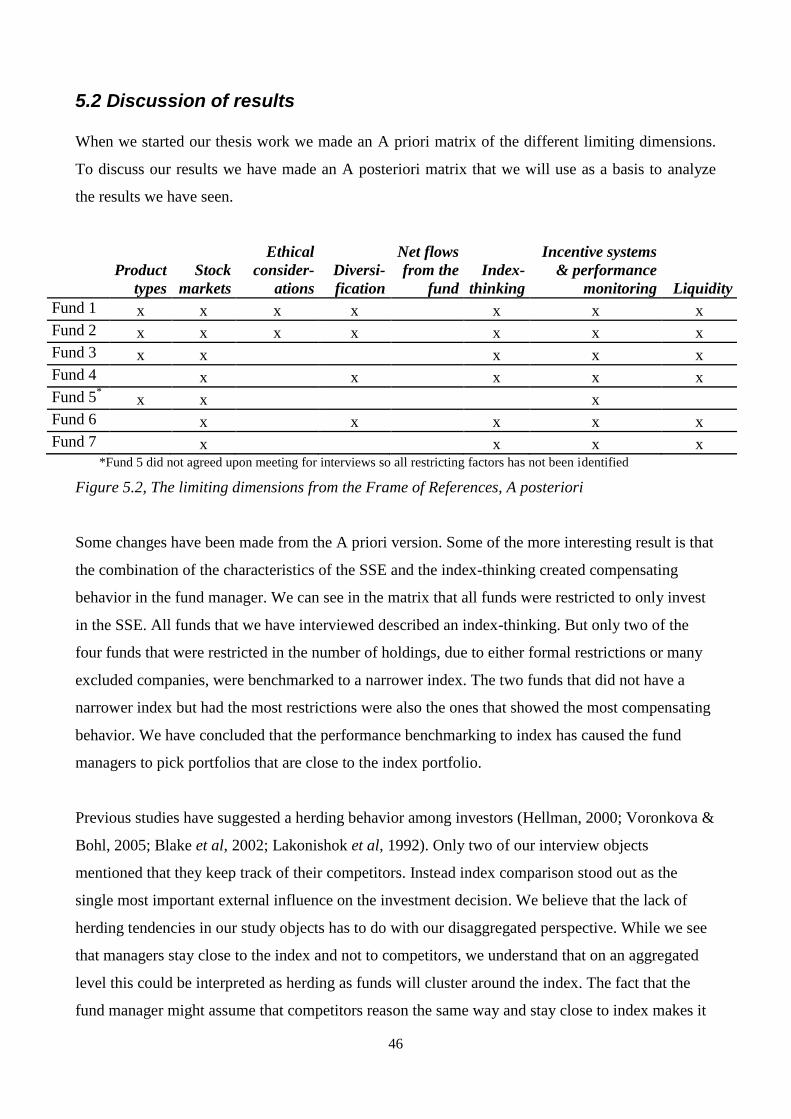
46
5.2 Discussion of results
When we started our thesis work we made an A priori matrix of the different limiting dimensions.
To discuss our results we have made an A posteriori matrix that we will use as a basis to analyze
the results we have seen.
Product
types
Stock
markets
Ethical
consider-
ations
Diversi-
fication
Net flows
from the
fund
Index-
thinking
Incentive systems
& performance
monitoring Liquidity
Fund 1 x x x x x x x
Fund 2 x x x x x x x
Fund 3 x x x x x
Fund 4 x x x x x
Fund 5* x x x
Fund 6 x x x x x
Fund 7 x x x x *Fund 5 did not agreed upon meeting for interviews so all restricting factors has not been identified
Figure 5.2, The limiting dimensions from the Frame of References, A posteriori
Some changes have been made from the A priori version. Some of the more interesting result is that
the combination of the characteristics of the SSE and the index-thinking created compensating
behavior in the fund manager. We can see in the matrix that all funds were restricted to only invest
in the SSE. All funds that we have interviewed described an index-thinking. But only two of the
four funds that were restricted in the number of holdings, due to either formal restrictions or many
excluded companies, were benchmarked to a narrower index. The two funds that did not have a
narrower index but had the most restrictions were also the ones that showed the most compensating
behavior. We have concluded that the performance benchmarking to index has caused the fund
managers to pick portfolios that are close to the index portfolio.
Previous studies have suggested a herding behavior among investors (Hellman, 2000; Voronkova &
Bohl, 2005; Blake et al, 2002; Lakonishok et al, 1992). Only two of our interview objects
mentioned that they keep track of their competitors. Instead index comparison stood out as the
single most important external influence on the investment decision. We believe that the lack of
herding tendencies in our study objects has to do with our disaggregated perspective. While we see
that managers stay close to the index and not to competitors, we understand that on an aggregated
level this could be interpreted as herding as funds will cluster around the index. The fact that the
fund manager might assume that competitors reason the same way and stay close to index makes it
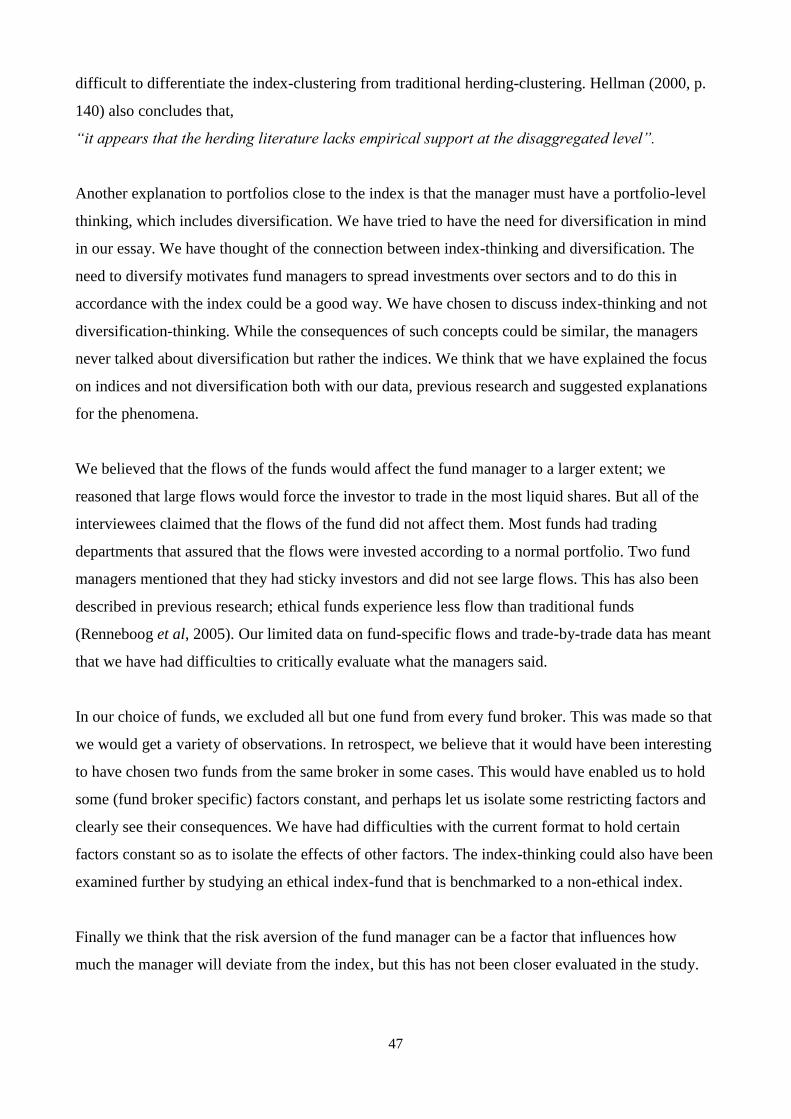
47
difficult to differentiate the index-clustering from traditional herding-clustering. Hellman (2000, p.
140) also concludes that,
“it appears that the herding literature lacks empirical support at the disaggregated level”.
Another explanation to portfolios close to the index is that the manager must have a portfolio-level
thinking, which includes diversification. We have tried to have the need for diversification in mind
in our essay. We have thought of the connection between index-thinking and diversification. The
need to diversify motivates fund managers to spread investments over sectors and to do this in
accordance with the index could be a good way. We have chosen to discuss index-thinking and not
diversification-thinking. While the consequences of such concepts could be similar, the managers
never talked about diversification but rather the indices. We think that we have explained the focus
on indices and not diversification both with our data, previous research and suggested explanations
for the phenomena.
We believed that the flows of the funds would affect the fund manager to a larger extent; we
reasoned that large flows would force the investor to trade in the most liquid shares. But all of the
interviewees claimed that the flows of the fund did not affect them. Most funds had trading
departments that assured that the flows were invested according to a normal portfolio. Two fund
managers mentioned that they had sticky investors and did not see large flows. This has also been
described in previous research; ethical funds experience less flow than traditional funds
(Renneboog et al, 2005). Our limited data on fund-specific flows and trade-by-trade data has meant
that we have had difficulties to critically evaluate what the managers said.
In our choice of funds, we excluded all but one fund from every fund broker. This was made so that
we would get a variety of observations. In retrospect, we believe that it would have been interesting
to have chosen two funds from the same broker in some cases. This would have enabled us to hold
some (fund broker specific) factors constant, and perhaps let us isolate some restricting factors and
clearly see their consequences. We have had difficulties with the current format to hold certain
factors constant so as to isolate the effects of other factors. The index-thinking could also have been
examined further by studying an ethical index-fund that is benchmarked to a non-ethical index.
Finally we think that the risk aversion of the fund manager can be a factor that influences how
much the manager will deviate from the index, but this has not been closer evaluated in the study.
48
5.3 Validity
We have performed a qualitative study. Our intention has been to understand the investment
decision making of Swedish equity fund managers with ethical restrictions. Merriam (1998, p. 53)
describes that there might exist biases in qualitative research. We have tried to increase the validity
of the interviews by recording them and both being present. We have used quotations. We also
asked the interview subjects if the quotations were correct to avoid interpretations in the empirical
results that can create biases. We have also combined the qualitative study with quantitative data to
increase the validity (see Merriam, 1998; Hellman, 2000; Andersen, red, 1994). The data could be
used to verify some answers of the interview subjects. In the results we have specified when the
quantitative data increased the validity of the qualitative data. We have used the SIX PRX as a
comparison for all funds, even though two funds used different benchmark indices. We have had
this in mind when we have analyzed the deviations from index but have not been able to compare
the holdings to their benchmark index. The quantitative data is from the quarterly rapports and do
not reflect every transaction and decision of the fund managers, it is a momentary picture of what
has happened in three months. If Ericsson weighs 6 % in Q1 and 6.2 % in Q2 it does not show if the
fund manager had 9 % in between the reporting. The quarterly reports might have been modified to
look better before the reporting. Guba & Lincoln (in Merriam, 1998, p. 53) describes that the best
way to prevent bias in the results is to be aware of the influence. We have tried to be specific in the
description of the methodology and what data has been used to verify the results from the
interviews.
49
6. References
Alvesson, M. & Sköldberg, K., (1994), Tolkning och reflektion: Vetenskapsfilosofi och kvalitativ
metod, Lund: Studentlitteratur
Andersen, H., (1994), ”Kvantitativa och kvalitativa metoder” in Andersen, H., (ed.),
Vetenskapsteori och metodlära - En introduktion, translation by Liungman, C., Lund:
Studentlitteratur, pp. 70-73
Baker, M., (1998), Fund managers‟ attitudes to risk and time horizons: the effect of performance
benchmarking, The European Journal of Finance, Vol. 4, pp. 257-278
Becker, G., (1978), The Economic Approach to Human Behavior, Chicago: University of Chicago
Press
Blake, D., Lehmann, B. & Timmermann, A., (2002), Performance clustering and incentives in the
UK pension fund industry, Journal of Asset Management, Vol. 3, Issue 2, pp. 173-194
Coval, J. & Moskowitz, T., (2001), The Geography of Investment: Informed Trading and Asset
Prices, Journal of Political Economy, Vol. 109, No. 4, pp. 811-841
Elton, E., Gruber, M. & Blake, C., (2003), Incentive Fees and Mutual Funds, The Journal of
Finance, April, Vol. 63, No. 2, pp. 779-804
Grinold, R. and Kahn, R., (1999), Active Portfolio Management, City: McGraw-Hill,
Haugen, R., (2004), The New Finance: Overreaction, Complexity, and Uniqueness, 3rd
Edition,
New Jersey: Pearson Education
Hellman, N., (2000), Investor Behaviour: An empirical study of how large Swedish institutional
investors make equity investment decisions, Stockholm: EFI
James, C. & Karceski, J., (2006), Investor monitoring and differences in mutual fund performance,
Journal of Banking & Finance, Vol. 30, pp. 2787-2808
50
Kaplan, R. & Norton, D., (2000), The Balanced Scorecard – Measures That Drive Performance,
Harvard Business Review, Jan/Feb, pp. 71-79
Koller, T., Goedhart, M. & Wessels, D., (2005), Valuation: Measuring and managing the value of
companies, 4th
edition, New Jersey: McKinsey & Company
Lakonishok, J., Schleifer, A. & Vishny, R., (1992), The impact of institutional trading on stock
prices, Journal of Financial Economics, Vol. 32, pp. 23-43
Lundahl, U. & Skärvad, P-H., (1992), Utredningsmetodik för samhällsvetare och ekonomer, Lund:
Studentlitteratur
Markowitz, H., (1991), Efficient Diversification of Investment, 2nd
Edition, New York: Blackwell
Publishing
Merriam, S., (1994), Fallstudien som forskningsmetod, translation by Nilsson, B., Lund:
Studentlitteratur
Patel, R. & Davidson, B., (1994), Forskningsmetodikens grunder: att planera, genomföra och
rapportera en undersökning, Lund: Studentlitteratur
Penman, S., (2007), Financial Statement Analysis and Security Valuation. New York: McGraw-
Hill/Irwin.
Raiffa, H., (1968), Decision Analysis: Introductory Lectures on Choices under Uncertainty, The
United States of America: McGraw-Hill, Inc
Renneboog, L., Ter Horst, J. & Zhang, C., (2008), Socially responsible investments: Institutional
aspects, performance, and investor behavior, Journal of Banking & Finance, Vol. 32, pp. 1723-
1742

51
Roll, R., (1992), Industrial Structure and the Comparative Behavior of International Stock Market
Indices, The Journal of Finance, Vol. 47, No. 1, pp. 3-41
Thurén, T., (1996), Vetenskapsteori för nybörjare, Malmö: Liber
Voronkova, S. & Bohl, M., (2005), Institutional Traders‟ Behaviour in an Emerging Stock Market:
Empirical Evidence on Polish Pension Investors, Journal of Business Finance & Accounting,
Sep/Oct, Vol. 32 Issue 7/8, pp. 1537-1560
Wästerfors, D., (2008), ”Analytiska knep”, in Sjöberg, K. & Wästerfors, D., (ed), Uppdrag:
Forskning, Malmö: Liber, pp. 66-84
Internet sources
www.omxnordicexchange.com, [Available: Nov. 23, 2008],
http://www.omxnordicexchange.com/digitalAssets/50/50331_GICS_Index_Levels_name_al
l4.xls
www.fondspara.se, [Available: Nov. 23, 2008], http://www.fondspara.se/Fakta-
fondsparande/
www.fondbolagen.se, , [Available: Nov. 23, 2008],
http://www.fondbolagen.se/StatistikStudierIndex/Statistik/NysparandeIFonder.aspx
www.six.se, [Available: Nov. 29, 2008],
o http://www.six.se/templates/pages/ProductPage____234.aspx
o http://www.six.se/templates/pages/TextPage____268.aspx
http://www.aktieansvar.se/artiklar/varafonder/sverige/index.cfm?show=mal, [Available:
Nov. 29, 2008]
www.swedbankrobur.se, [Available: Nov. 29, 2008]
http://www.ericsson.com/se/releases/prquarterview20074.shtml, [Available: Dec. 3, 2008]
http://www.ethibel.org/subs_e/1_info/sub1_2.html, [ Available: Dec. 3, 2008]
Other references
Lundberg, C. & Westholm, E. (2006), Folksams Etikfondindex – Folksams kapitalförvaltning
Rapport 2006, Folksam
Ur lagen om värdepappersfonder 1990:1114
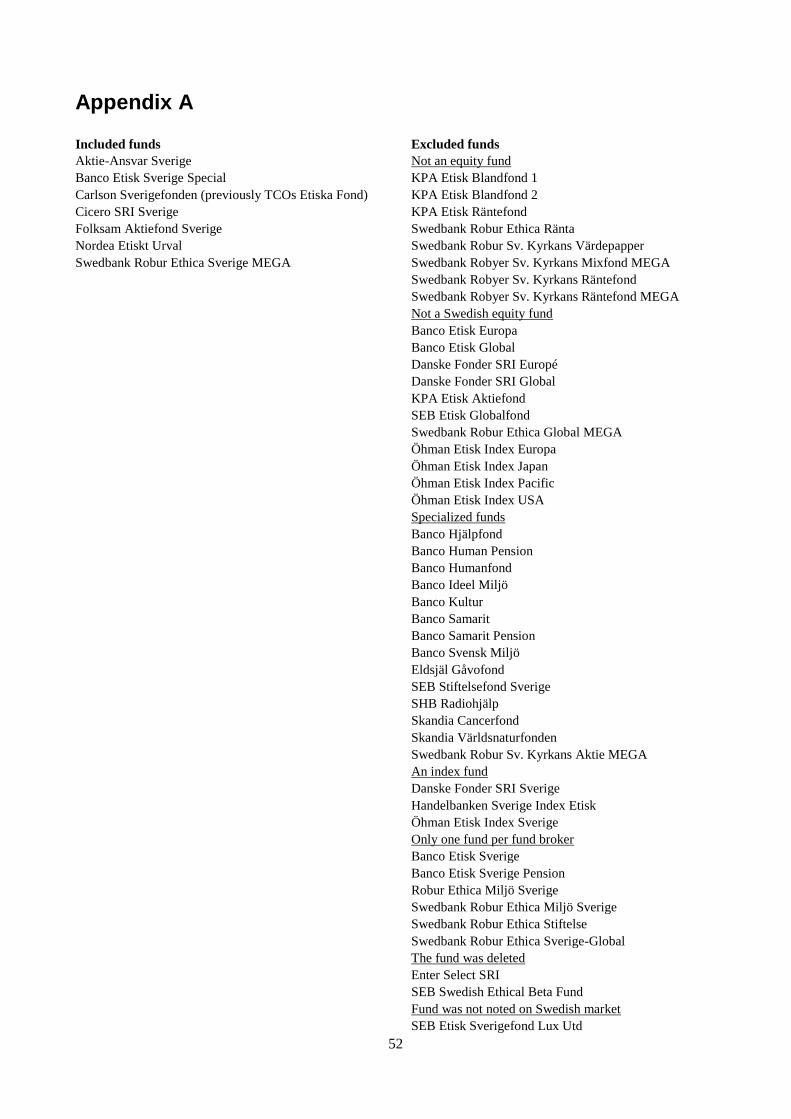
52
Appendix A
Included funds Excluded funds
Aktie-Ansvar Sverige Not an equity fund
Banco Etisk Sverige Special KPA Etisk Blandfond 1
Carlson Sverigefonden (previously TCOs Etiska Fond) KPA Etisk Blandfond 2
Cicero SRI Sverige KPA Etisk Räntefond
Folksam Aktiefond Sverige Swedbank Robur Ethica Ränta
Nordea Etiskt Urval Swedbank Robur Sv. Kyrkans Värdepapper
Swedbank Robur Ethica Sverige MEGA Swedbank Robyer Sv. Kyrkans Mixfond MEGA
Swedbank Robyer Sv. Kyrkans Räntefond Swedbank Robyer Sv. Kyrkans Räntefond MEGA Not a Swedish equity fund Banco Etisk Europa Banco Etisk Global Danske Fonder SRI Europé Danske Fonder SRI Global KPA Etisk Aktiefond SEB Etisk Globalfond Swedbank Robur Ethica Global MEGA Öhman Etisk Index Europa Öhman Etisk Index Japan Öhman Etisk Index Pacific Öhman Etisk Index USA Specialized funds Banco Hjälpfond Banco Human Pension Banco Humanfond Banco Ideel Miljö Banco Kultur Banco Samarit Banco Samarit Pension Banco Svensk Miljö Eldsjäl Gåvofond SEB Stiftelsefond Sverige SHB Radiohjälp Skandia Cancerfond Skandia Världsnaturfonden Swedbank Robur Sv. Kyrkans Aktie MEGA An index fund Danske Fonder SRI Sverige Handelbanken Sverige Index Etisk Öhman Etisk Index Sverige Only one fund per fund broker Banco Etisk Sverige Banco Etisk Sverige Pension Robur Ethica Miljö Sverige Swedbank Robur Ethica Miljö Sverige Swedbank Robur Ethica Stiftelse Swedbank Robur Ethica Sverige-Global The fund was deleted Enter Select SRI SEB Swedish Ethical Beta Fund Fund was not noted on Swedish market SEB Etisk Sverigefond Lux Utd

53