Embed Size (px)
Citation preview
THE IMPACT OF OPEN GOVERNMENT ON INNOVATION:
DOES GOVERNMENT TRANSPARENCY DRIVE INNOVATION?
A Thesis submitted to the Faculty of the
Graduate School of Arts and Sciences of Georgetown University
in partial fulfillment of the requirements for the degree of
Master of Public Policy in Public Policy
By
Anjelika A. Deogirikar, B.S.
Washington, DC April 15, 2014
ii
Copyright 2014 by Anjelika A. Deogirikar All Rights Reserved
iii
THE IMPACT OF OPEN GOVERNMENT ON INNOVATION:
DOES GOVERNMENT TRANSPARENCY DRIVE INNOVATION?
Anjelika A. Deogirikar, B.S.
Thesis Advisor: Robert W. Bednarzik, Ph.D.
ABSTRACT
This study adds to the body of research on open government by empirically measuring the
association of government transparency and innovation. The study uses Transparency
International’s Corruption Perceptions Index (CPI) as a proxy measure of government
transparency. It assumes that an increase in government transparency increases applied
innovation activity, which is measured as the number of annual patents by country residents. The
study also tests whether the association is different for countries participating in the Open
Government Partnership (OGP), a voluntary multi-stakeholder international collaboration of 63
countries who have committed to make their governments more transparent. The analysis uses
fixed effects regression on panel data from 1996 to 2011 for 95 countries, including 54 OGP
members. Although the empirical results do not support the hypothesis that transparency and
innovation are positively correlated for countries participating in the OGP, this finding
contributes to the literature on open government by making an initial attempt to quantify the
association of transparency and innovation. Additional future research demonstrating a positive
relationship between transparency and innovation could help to justify implementation of open
government policies and participation in the Open Government Partnership.

iv
This thesis is dedicated to my family – my parents, Arvind and Tatiana, and my brother, Michael – for their never-ending faith and encouragement in my academic and life pursuits.
Many thanks to the faculty and staff at the McCourt School of Public Policy, formerly known as the Georgetown Public Policy Institute, for their guidance throughout this journey. I would like to extend my sincere appreciation to my thesis advisor Dr. Robert Bednarzik for motivating me
to keep digging for answers, Michael Barker for his patience, Dr. Jeffrey Mayer for his guidance, and Leslie Evertz for her support. I would also like to thank Dr. Andreas Kern and Dr. Barbara
Schone for their feedback, and my mentors Dr. Judith Feder, Dr. Jason Fichtner, and Dr. Markus Jachtenfuchs for supporting my scholarly pursuits.
I would like to extend gratitude to my classmates in my thesis workshop section for their
friendship and ideas in all stages of this research endeavor.
Special thanks to the open government community and researchers who were willing to answer questions about their work and provide me feedback along the way.
Finally, a heartfelt thank you to Eric Grossman for cheering for me along the way.
Thank you,
ANJELIKA A. DEOGIRIKAR
v
TABLE OF CONTENTS
INTRODUCTION ................................................................................................................. 1
EXAMINING THE LITERATURE ........................................................................................... 6
Transparency ............................................................................................................. 6
Innovation .................................................................................................................. 8
DATA AND METHODOLOGY ............................................................................................ 10
Data ......................................................................................................................... 10
Model Specification ................................................................................................. 15
EMPIRICAL RESULTS AND ANALYSIS .............................................................................. 18
POLICY IMPLICATIONS .................................................................................................... 20
APPENDIX A ................................................................................................................... 22
APPENDIX B - DIAGNOSTICS ........................................................................................... 25
BIBLIOGRAPHY ............................................................................................................... 30

1
INTRODUCTION “Open Government” – the principle of creating a transparent, collaborative, and participatory
government – has become a priority for nations around the world. Governments pursue open
government and open data initiatives with the promise of increased innovation, economic growth
and job creation. Research on government transparency has conventionally focused on political
and social benefits, such as government accountability and civic participation. Past literature
highlights public meetings and access to information legislation as examples of good
governance. However, more recent discussions emphasize the potential that transparency policies
and open data initiatives can spur innovation and create economic benefits.
This paper empirically examines how government transparency is related to a country’s level
of innovation. Transparency International’s Corruption Perceptions Index (CPI) score is used as
a proxy measure for transparency, and annual resident patent applications is used as a measure of
applied innovation. The study tests the assumption that an increase in transparency increases
applied innovation, particularly for those countries participating in the Open Government
Partnership (OGP).
The type, quality, and adoption of transparency initiatives vary greatly across countries
(Meijer, 2013). Literature in the field suggests that studies of government transparency should
move towards describing how governments are collecting and disseminating aggregate data and
information that are made available to the public for free, and the extent to which this material is
being used (Hollyer, 2012; Grimmelikhuijsen, 2013).
Yu et al. (2012) describe how the term “open government” was first used in the 1950s during
discussions of political accountability in the context of the United States Freedom of Information

2
Act, which was eventually adopted in the United States in 1966 (Relly, 2009; Yu, 2012). Since
then, the definition of “open government” has been expanded to include technological
innovations and open government data (Yu, 2012). Yu et al. (2012) note that “there is much to
like about economic opportunity, innovation, and efficiency, and a convenient label [of “open
government”] could be a good way of promoting them all.”
In the United States, the Obama Administration has been committed to creating an open
government through transparency and open data initiatives since the beginning of the President’s
first term. On his first full day in office, the President issued Memorandum on Transparency and
Open Government committing his administration to be transparent, participatory and
collaborative (Obama, 2009). Later that year, the Office of Management and Budget issued Open
Government Directive, which provided agencies direction to fulfill the goals of a more open and
transparent government.
As governments focus on publishing government data online to be made accessible to the
public, “open data” falls under the umbrella of open government. Well-known examples of open
government data made accessible by the U.S. Government include Global Positioning System
(GPS) satellite data and weather data from National Oceanic and Atmospheric Administration,
which have both been made freely available to the public.
Internationally, other countries are also moving beyond freedom of information laws to
address open data policies as part of efforts to increase government transparency. In his 2010
address to the United Nations General Assembly, President Barack Obama emphasized the
importance of an open government, noting, “the strongest foundation for human progress lies in
open economies, open societies, and open governments… In all parts of the world, we see the
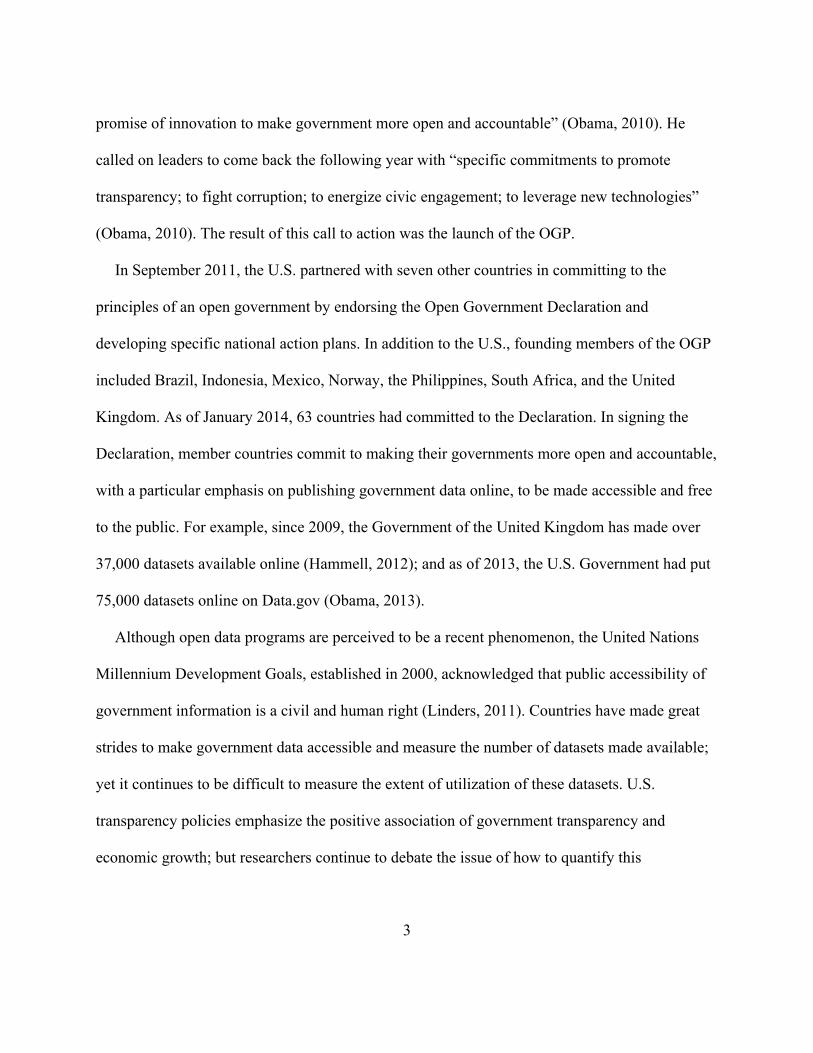
3
promise of innovation to make government more open and accountable” (Obama, 2010). He
called on leaders to come back the following year with “specific commitments to promote
transparency; to fight corruption; to energize civic engagement; to leverage new technologies”
(Obama, 2010). The result of this call to action was the launch of the OGP.
In September 2011, the U.S. partnered with seven other countries in committing to the
principles of an open government by endorsing the Open Government Declaration and
developing specific national action plans. In addition to the U.S., founding members of the OGP
included Brazil, Indonesia, Mexico, Norway, the Philippines, South Africa, and the United
Kingdom. As of January 2014, 63 countries had committed to the Declaration. In signing the
Declaration, member countries commit to making their governments more open and accountable,
with a particular emphasis on publishing government data online, to be made accessible and free
to the public. For example, since 2009, the Government of the United Kingdom has made over
37,000 datasets available online (Hammell, 2012); and as of 2013, the U.S. Government had put
75,000 datasets online on Data.gov (Obama, 2013).
Although open data programs are perceived to be a recent phenomenon, the United Nations
Millennium Development Goals, established in 2000, acknowledged that public accessibility of
government information is a civil and human right (Linders, 2011). Countries have made great
strides to make government data accessible and measure the number of datasets made available;
yet it continues to be difficult to measure the extent of utilization of these datasets. U.S.
transparency policies emphasize the positive association of government transparency and
economic growth; but researchers continue to debate the issue of how to quantify this
4
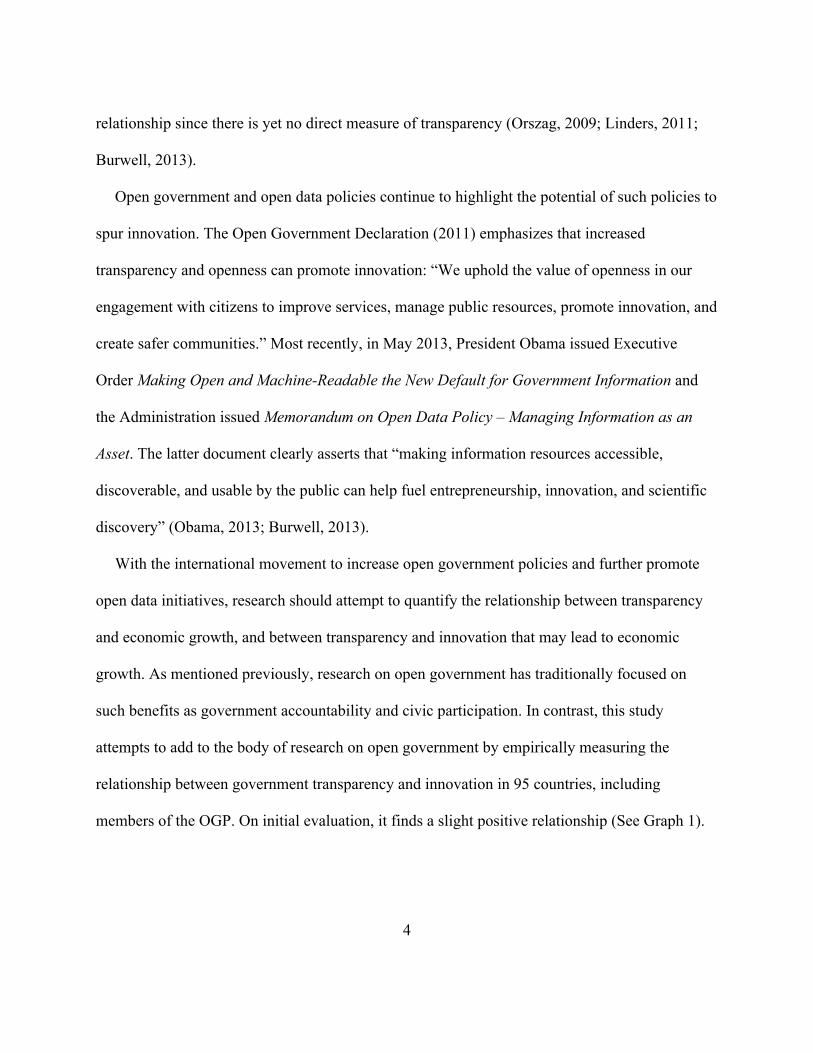
relationship since there is yet no direct measure of transparency (Orszag, 2009; Linders, 2011;
Burwell, 2013).
Open government and open data policies continue to highlight the potential of such policies to
spur innovation. The Open Government Declaration (2011) emphasizes that increased
transparency and openness can promote innovation: “We uphold the value of openness in our
engagement with citizens to improve services, manage public resources, promote innovation, and
create safer communities.” Most recently, in May 2013, President Obama issued Executive
Order Making Open and Machine-Readable the New Default for Government Information and
the Administration issued Memorandum on Open Data Policy – Managing Information as an
Asset. The latter document clearly asserts that “making information resources accessible,
discoverable, and usable by the public can help fuel entrepreneurship, innovation, and scientific
discovery” (Obama, 2013; Burwell, 2013).
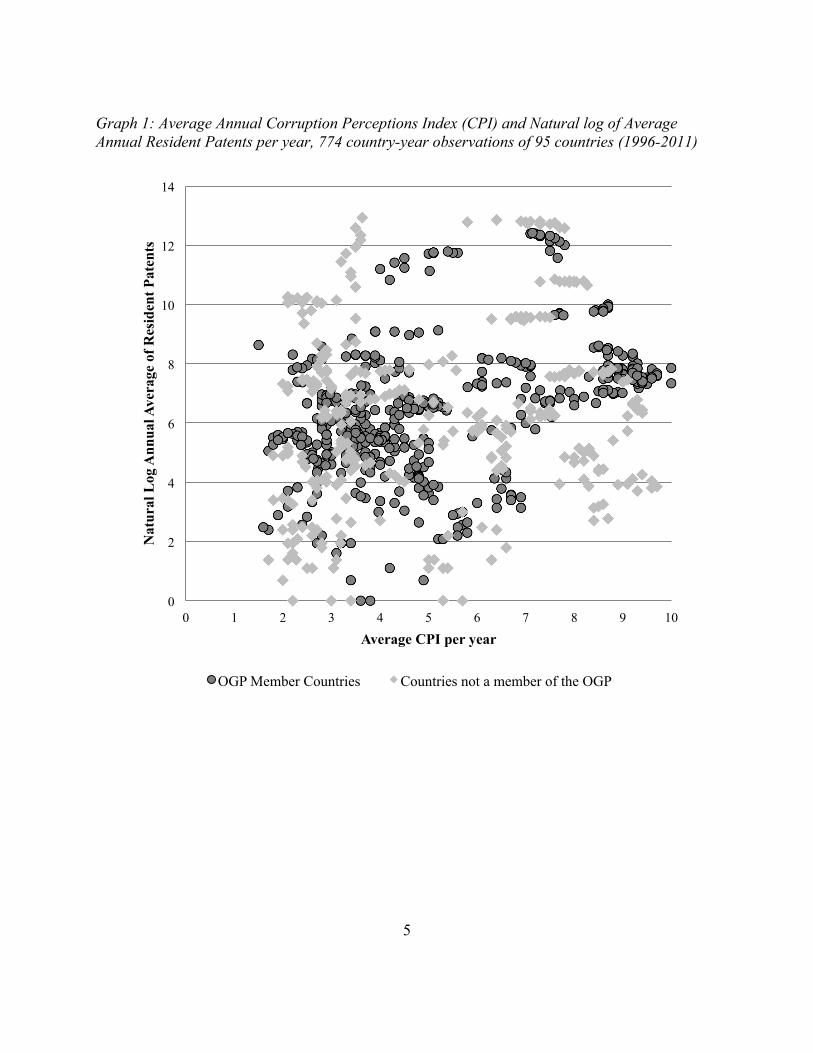
With the international movement to increase open government policies and further promote
open data initiatives, research should attempt to quantify the relationship between transparency
and economic growth, and between transparency and innovation that may lead to economic
growth. As mentioned previously, research on open government has traditionally focused on
such benefits as government accountability and civic participation. In contrast, this study
attempts to add to the body of research on open government by empirically measuring the
relationship between government transparency and innovation in 95 countries, including
members of the OGP. On initial evaluation, it finds a slight positive relationship (See Graph 1).
5
Graph 1: Average Annual Corruption Perceptions Index (CPI) and Natural log of Average Annual Resident Patents per year, 774 country-year observations of 95 countries (1996-2011)
0
2
4
6
8
10
12
14
0 1 2 3 4 5 6 7 8 9 10
Nat
ural
Log
Ann
ual A
vera
ge o
f Res
iden
t Pat
ents
Average CPI per year
OGP Member Countries Countries not a member of the OGP
6
EXAMINING THE LITERATURE
Transparency
The term “government transparency” captures a broad array of activities from access to
information legislation to open data policies (Relly, 2009; Meijer, 2013). Historically, research
on government transparency has focused on the political and social benefits of increasing
openness. Literature on promoting good governance observes that an increase in transparency
can lead to an increase in government accountability and efficiency, and increased civic
participation (Chun, 2010; Grimmelikhuijsen, 2013). In addition, the literature describes how
increases in government transparency can decrease corruption and, thereby, increase the public’s
trust in their governments (Grimmelikhuijsen, 2013).
More recently, research has focused on how an increase in transparency stimulates economic
growth, where the outcome of “public reuse of government data is anticipated to provide
economic and social value to spur growth, promote a knowledge economy, and help the public
help itself” (Linders, 2011). In particular, U.S. transparency policies highlight potential
economic benefits of transparency, especially as a consequence of releasing data to the public
(Orszag, 2009; Linders, 2011; Burwell, 2013). Former U.S. Chief Information Officer, Kundra
(2012) discusses that, “there is an opportunity to create value with government data, and
numerous new companies can be built on this data.”
A contemporary working definition of transparency coined by Grimmelikhuijsen et al. (2013)
is that “transparency is the availability of information about an organization or actor that allows
external actors to monitor the internal workings or performance of that organization.” Hollyer et
7
al. (2012) developed this definition further suggesting that government data collection and
dissemination is a specific dimension of government transparency.
However, the quantification of contemporary government transparency initiatives continues to
be debated in the research. With the exception of the Human Genome Project, there has not been
extensive empirical analysis to demonstrate the economic impact of open data initiatives
(Battelle, 2013).
In the place of empirical research, open government advocates have relied on case studies and
anecdotes to showcase how open data and transparency initiatives spur innovation and drive
economic growth. For example, the Open Data 500 project at New York University’s the
Governance Lab (GovLab) is working to compile a list of companies throughout the U.S. that
use open data. Jetzek (2012) notes the anticipated outcomes of sharing more government data:
As most OGD [open government data] initiatives are relatively recent, the key questions regarding the value proposition and return on investment of these initiatives remain unanswered… [Nevertheless,] we expect OGD initiatives to generate value and substantial returns through increased transparency, efficiency of government activities, citizen participation, and entrepreneurial activity.
In addition to the definition of transparency being imprecise, there is also great variability in
how and to what extent transparency programs are implemented across various countries (Yu,
2012; Meijer, 2013). One of the challenges that this creates is that “the absence of formal
definitions, criteria, and metrics around government openness deprives agencies of clear
guidance and milestones” (Linders, 2011). However, since the measurement of transparency
remains “elusive,” the term continues to be used with “great liberty” (Hollyer, 2012;
Grimmelikhuijsen, 2013).
8
The predominant method in the literature is to use corruption as a proxy for transparency
(Mauro, 1995; Zhao, 2003; Varsakelis, 2006; Bertot, 2010; Broberg, 2012; Hollyer, 2012).
Researchers measure government transparency as the extent of corruption using Transparency
International’s Corruption Perceptions Index (CPI) score (Varsakelis, 2006; Broberg, 2012;
Zhao, 2003). Mauro argues that “corruption lowers private investment, thereby reducing
economic growth” (Mauro, 1995; Furman, 2002; Zhao, 2003). In the present study, a decrease in
corruption is used as a proxy for an increase in transparency; therefore, the assumption is that an
increase in transparency is predicted to increase innovation.
Innovation
There are also limitations in measuring innovation outputs because of the complexity of
defining innovation. The literature has traditionally measured innovation by the amount of public
budget allocated to R&D or the number of research articles published (Furman, 2002;
Varsakelis, 2006; Broberg, 2012; Dutta, 2012).
Broberg (2012) shows how formal government structures lead to increased innovation by
examining how political institutional structures can positively promote private sector innovation.
As a consequence, research on national innovative activity focuses on how political and
institutional infrastructure can spur innovation (Furman, 2002; Varsakelis, 2006; Broberg, 2012).
Broberg (2012) finds that variation in national public institutional structure affects two types
of innovation – the number of scientific articles published and the number of patents granted.
The number of scientific and technical articles is used as a measure of “basic innovative
9
activity;” whereas the number of patents by residents of a country describes “applied innovative
activity” (Broberg, 2012).
Innovation research differentiates outcomes based on creation of knowledge versus creation
of businesses or products. Basic innovative activity leads to the creation of knowledge; whereas
applied innovation focuses on the potential economic impact that the innovations might bring,
such as the creation of new products or businesses (Broberg, 2012; Dutta, 2012). As a result, the
predominant method in the literature to measure applied innovation activity is to use resident
patents (Furman 2002; Varsakelis, 2006; Broberg, 2012).
In those countries with strong judicial systems, Varsakelis (2006) argues there is a positive
relationship between these more developed governmental institutions on innovative activity. In
his research, Varsakelis (2006) designated the number of resident patents as a measure of
innovation and concluded that developed governmental institutions are more likely to protect and
enforce patent laws, and therefore, promote innovation. Researchers have debated the limitations
of measuring innovative activity, as the number patent applications since this measure does not
capture all the nuances of innovation (Griliches, 1998; Furman, 2002). Nevertheless, in this
study, “resident patent applications” are used to measure applied innovation activity. As
government policies highlight the benefit of openness to increase innovation, this study attempts
to examine the association on government transparency on innovation. In addition, this paper
attempts to determine if there is a difference for countries participating in the OGP.
10
DATA AND METHODOLOGY
Data
This study uses a sample of 95 countries from 1996 to 2011 to test the association of
transparency and innovation using panel data methodology. 54 countries in the sample are
members of the Open Government Partnership (OGP) (See Appendix A, Exhibit A.1). The study
uses the World Bank Open Data STATA module to access World Bank databases, accessed as of
April 2014, including data from World Intellectual Property Organization (WIPO) and the
United Nations Educational, Scientific, and Cultural Organization (UNESCO) Institute for
Statistics. Data on corruption from Transparency International’s Corruption Perceptions Index
(CPI) score were obtained directly from Transparency International’s research team in August
2013.
Based on literature on innovation and government transparency, control variables that have
been included are: 1) drivers of innovation using research and development expenditures as a
percentage of GDP, and GDP per capita; and 2) perception of governance using the Worldwide
Governance Indicator “Voice and Accountability.”
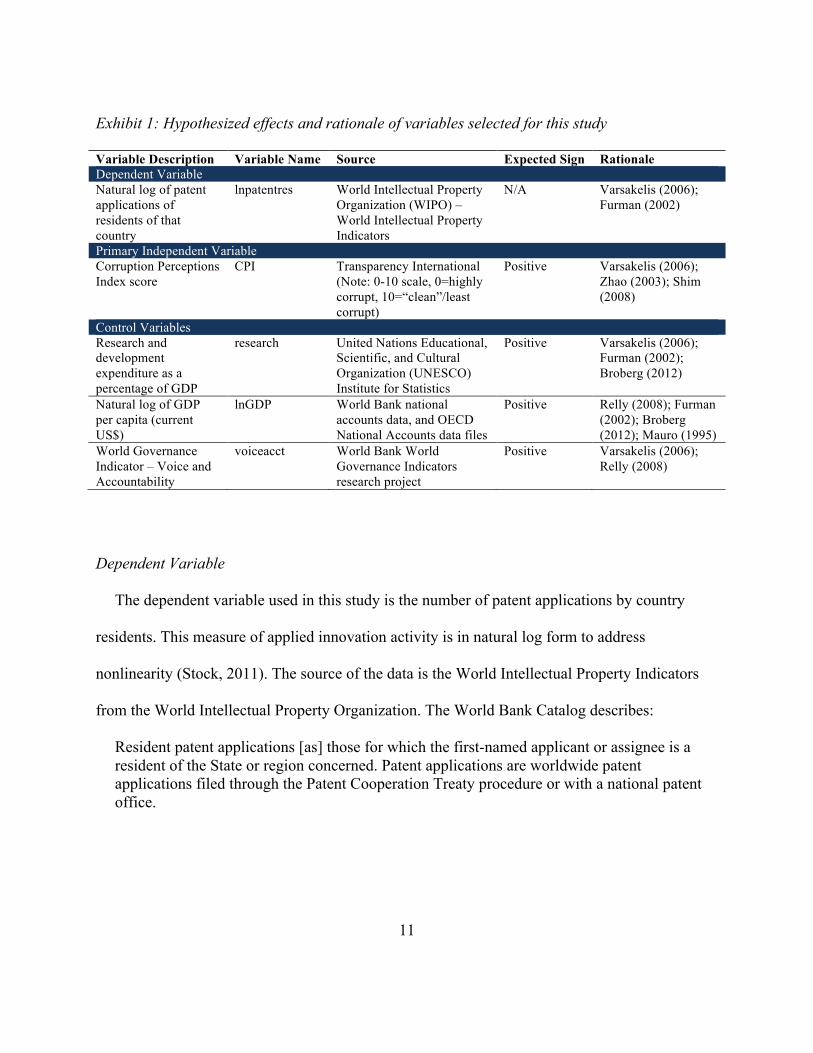
Based on a review of the literature and theory, Exhibit 1 outlines the expected relationships
between the dependent and the independent variables:
11
Exhibit 1: Hypothesized effects and rationale of variables selected for this study Variable Description Variable Name Source Expected Sign Rationale Dependent Variable Natural log of patent applications of residents of that country
lnpatentres World Intellectual Property Organization (WIPO) – World Intellectual Property Indicators
N/A Varsakelis (2006); Furman (2002)
Primary Independent Variable Corruption Perceptions Index score
CPI Transparency International (Note: 0-10 scale, 0=highly corrupt, 10=“clean”/least corrupt)
Positive Varsakelis (2006); Zhao (2003); Shim (2008)
Control Variables Research and development expenditure as a percentage of GDP
research United Nations Educational, Scientific, and Cultural Organization (UNESCO) Institute for Statistics
Positive Varsakelis (2006); Furman (2002); Broberg (2012)
Natural log of GDP per capita (current US$)
lnGDP World Bank national accounts data, and OECD National Accounts data files
Positive Relly (2008); Furman (2002); Broberg (2012); Mauro (1995)
World Governance Indicator – Voice and Accountability
voiceacct World Bank World Governance Indicators research project
Positive Varsakelis (2006); Relly (2008)
Dependent Variable
The dependent variable used in this study is the number of patent applications by country
residents. This measure of applied innovation activity is in natural log form to address
nonlinearity (Stock, 2011). The source of the data is the World Intellectual Property Indicators
from the World Intellectual Property Organization. The World Bank Catalog describes:
Resident patent applications [as] those for which the first-named applicant or assignee is a resident of the State or region concerned. Patent applications are worldwide patent applications filed through the Patent Cooperation Treaty procedure or with a national patent office.
12
Primary Independent Variable
Research on government transparency has regularly used Transparency International’s CPI
score as a measure for corruption. In this study, a decrease in corruption is used as a proxy for an
increase in government transparency as the primary independent variable.
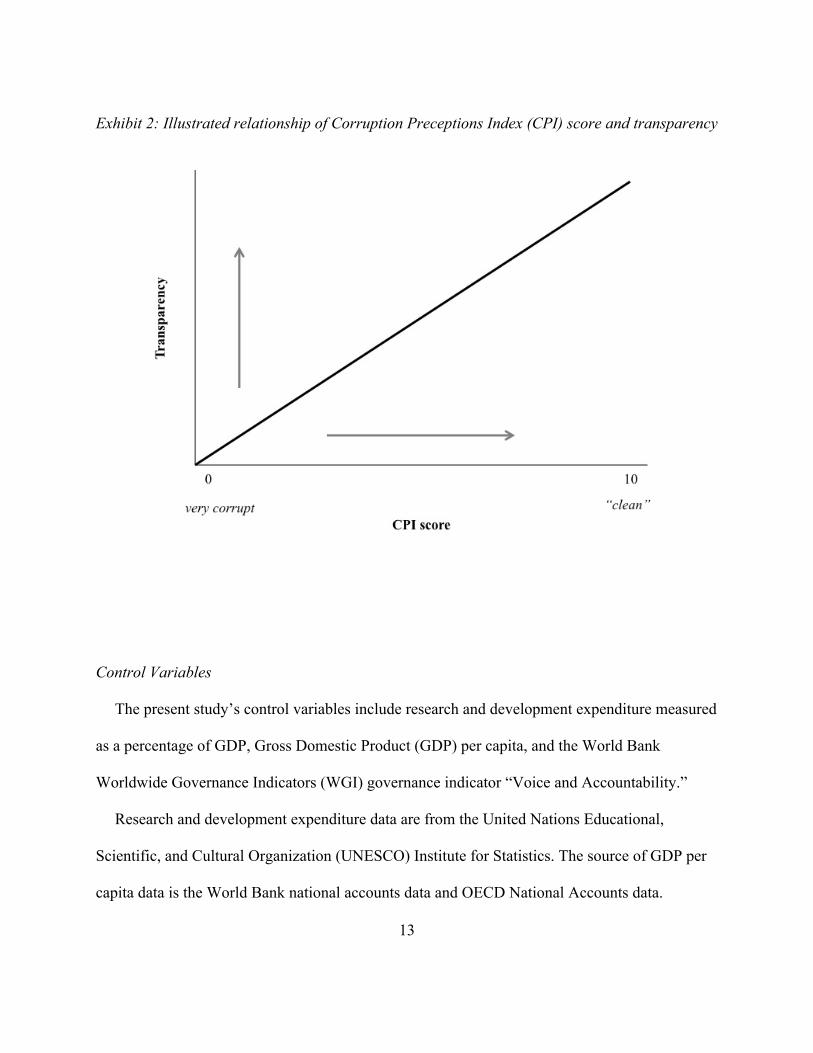
CPI is a composite score of perceptions on corruption based on a survey of individuals from
the public and private sectors. CPI has been measured annually since 1995. The index is
compiled from the surveyed perceptions and is reported on a scale of 0 to 10, where 0 is a
country that is perceived to be very corrupt and 10 is a country perceived to be “clean” of
corruption. Therefore, an increase in the CPI score to 10 means that the country is less corrupt
and is therefore considered to be more transparent. The relationship between CPI score and
transparency is illustrated in Exhibit 2. In 2012, Transparency International implemented a new
testing methodology; therefore, this study only uses CPI scores through 2011.
13
Exhibit 2: Illustrated relationship of Corruption Preceptions Index (CPI) score and transparency
Control Variables
The present study’s control variables include research and development expenditure measured
as a percentage of GDP, Gross Domestic Product (GDP) per capita, and the World Bank
Worldwide Governance Indicators (WGI) governance indicator “Voice and Accountability.”
Research and development expenditure data are from the United Nations Educational,
Scientific, and Cultural Organization (UNESCO) Institute for Statistics. The source of GDP per
capita data is the World Bank national accounts data and OECD National Accounts data.
14
At the time of Varsakelis’ research (2006), there were not enough country-year observations
from the WGI, so he used governance indictors from Freedom House. WGI covers 212 countries
on six different governance indicators: Voice and Accountability, Rule of Law, Political Stability
and Absence of Violence/Terrorism, Government Effectiveness, and Regulatory Quality. Prior to
2002, WGI was only measured every alternate year. Since 2002, however, WGI has been
measured annually. WGI is used in this study, instead of using the Freedom House governance
indicators, because WGI provides sufficient country-year observations. Specifically, WGI’s
Voice and Accountability estimates are used as a control variable in this study. Based on
Varsakelis’ (2006) research, Rule of Law was considered as an additional control variable but
was not included in the final model in the present study because it demonstrates high correlation
with the primary independent variable of interest CPI (See Appendix B – Diagnostics). The
World Bank Database describes Voice and Accountability as “the process by which governments
are selected, monitored, and replaced.” This variable captures “perceptions of the extent to which
a country's citizens are able to participate in selecting their government, as well as freedom of
expression, freedom of association, and a free media” (Kaufmann, 2010).
Open Government Partnership
In order to determine OGP membership, countries were designated an OGP member country
if that country had signed the Open Government Declaration as of January 2014. This variable
was set as a dummy variable indicating whether the country was a member of the OGP or not. Of
the 63 countries that currently participate in the OGP, 51 are included in the dataset, since there
were data available on both patents and CPI for these countries.
15
Model Specification
This paper uses fixed effects regression to evaluate the association of government corruption
and innovative activity and to test whether the association is different for countries participating
in the OGP. Again, innovative activity is measured by the number of patent applications of
residents of that country (Varsakelis, 2006; Broberg, 2012; Furman 2002), while corruption is
measured using Transparency International’s CPI score (Varsakelis, 2006; Broberg, 2012; Zhao,
2003).
After post-estimation tests, an initial regression was further refined (See Exhibit 3, and see
Appendix B – Diagnostics). Model diagnostics indicate several potential problems with the
model: heteroscedasticity, multicollinerity, and model misspecification (See Appendix B for
details of diagnostic tests). The data are declared to be panel data because the f-test null
hypothesis, that there is no difference between the countries, is rejected. In addition, country and
year fixed effects are included to take into consideration the variability of the data over time.
Since the data are not homoscedastic, the regression includes robust standard errors. Additional
control variables were also tested to address model specification problems. The addition of trade
and labor force education level considerably dropped the number of country-year observations,
and did not substantially change the outcome of this study. In addition, the WGI “Rule of Law”
was considered but was not included since this variable demonstrated high correlation with the
primary independent variable of interest CPI (See Appendix B – Diagnostics). The model
includes the interaction term OGP member and CPI to test if there is a difference for countries
participating in the OGP (See Exhibit 3).

16
Exhibit 3: Model and variable definitions
Model: 𝑙𝑛𝑝𝑎𝑡𝑒𝑛𝑡𝑟𝑒𝑠!" = 𝛽! + 𝛽! 𝐶𝑃𝐼!" + 𝛽! 𝑟𝑒𝑠𝑒𝑎𝑟𝑐ℎ𝑒𝑥𝑝!" + 𝛽! 𝑙𝑛𝐺𝐷𝑃!" + 𝛽! 𝑣𝑜𝑖𝑐𝑒𝑎𝑐𝑐𝑡!" +𝛽! 𝑂𝐺𝑃𝑚𝑒𝑚𝑏𝑒𝑟!" + 𝛽! (𝑂𝐺𝑃𝑚𝑒𝑚𝑏𝑒𝑟 ∗ 𝐶𝑃𝐼)!" + 𝛼! + 𝑢! + 𝜀!" Observations: 774 country-year observations of 95 countries from 1996 – 2011
Variable Name Definition lnpatentres Natural log of annual patent applications by residents of that country
CPI Corruption Perceptions Index score (primary independent variable of interest) research Research and development expenditure (percentage of GDP) lnGDP Natural log of GDP per capita (current US$)
voiceacct Voice and Accountability World Governance Indicator estimate OGPmember Dummy variable indicating if country is a member of OGP
OGPmember*CPI Interaction term of OGPmember and CPI to test the difference in the association of transparency and innovation for members of the OGP
𝛽! Coefficients of each variable (j=1-5); Constant (j=0) 𝛼! Unobserved country specific fixed effects (i=1-95) 𝑢! Unobserved year specific fixed effects (t=1-13) 𝜀!" Random variation
17
EMPIRICAL RESULTS AND ANALYSIS
This study examines the association of government transparency and innovation activity.
Using corruption as a proxy for transparency and patents as a measure of innovation, the study
tests the assumption that an increase in transparency increases applied innovation, particularly
for those countries participating in the Open Government Partnership (OGP).
Table 1 presents the results of the regression analysis. The interaction term OGPmember*CPI
is added to understand if the effective CPI is different for members of the OGP versus those
countries that are not members. Model 1 presents results from the OLS regression, Model 2
shows estimates from the random coefficients model, and Model 3 shows results from the fixed
effects model.
The results from the OLS regression (Model 1) do not control for the unobservable
characteristics for each country and time period, therefore random coefficients and fixed effects
regression models were also examined. A random coefficients model (Model 2) was estimated
because it appeared that the coefficients on CPI would change by country. The random
coefficients model estimates the distribution for a coefficient, instead of a point estimate. In
Model 2, the variability on the coefficient for each country is the estimated standard deviation of
the coefficient (CPI SD = 0.272, research SD = 0.755, lnGDP SD = 0.194, voiceacct SD = 0.601,
constant SD = 1.56).
The fixed effects model (Model 3) was estimated because the random coefficients model can
not control for country fixed effects. In addition, if there are time invariant unobservable
characteristics that differ across countries, the fixed effects model will control for them. The
estimated coefficients are similar in both models; therefore, the results will be interpreted using
18
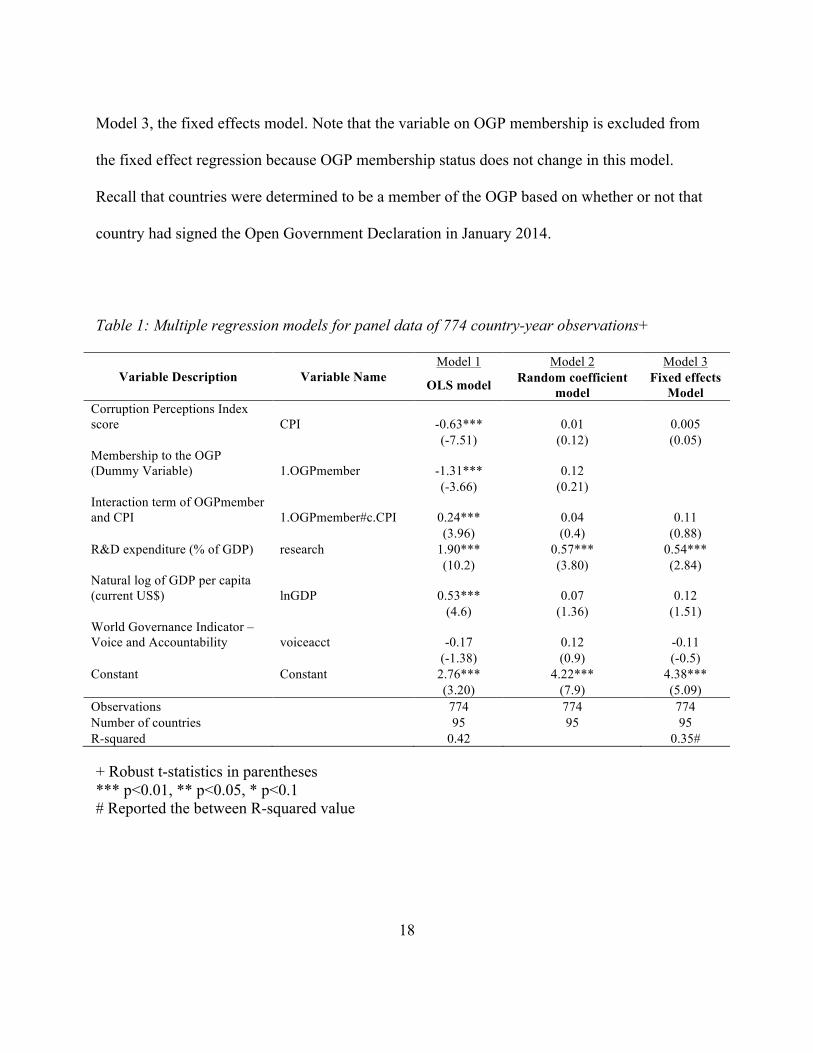
Model 3, the fixed effects model. Note that the variable on OGP membership is excluded from
the fixed effect regression because OGP membership status does not change in this model.
Recall that countries were determined to be a member of the OGP based on whether or not that
country had signed the Open Government Declaration in January 2014.
Table 1: Multiple regression models for panel data of 774 country-year observations+
Variable Description Variable Name Model 1 Model 2 Model 3
OLS model Random coefficient model
Fixed effects Model
Corruption Perceptions Index score CPI -0.63*** 0.01 0.005
(-7.51) (0.12) (0.05)
Membership to the OGP (Dummy Variable) 1.OGPmember -1.31*** 0.12
(-3.66) (0.21) Interaction term of OGPmember
and CPI 1.OGPmember#c.CPI 0.24*** 0.04 0.11
(3.96) (0.4) (0.88)
R&D expenditure (% of GDP) research 1.90*** 0.57*** 0.54***
(10.2) (3.80) (2.84)
Natural log of GDP per capita (current US$) lnGDP 0.53*** 0.07 0.12
(4.6) (1.36) (1.51)
World Governance Indicator – Voice and Accountability voiceacct -0.17 0.12 -0.11
(-1.38) (0.9) (-0.5)
Constant Constant 2.76*** 4.22*** 4.38***
(3.20) (7.9) (5.09)
Observations 774 774 774 Number of countries 95 95 95 R-squared
0.42
0.35#
+ Robust t-statistics in parentheses *** p<0.01, ** p<0.05, * p<0.1 # Reported the between R-squared value
19
The results do not support the hypothesis that transparency and innovation are positively
correlated for OGP members because the results are not statistically significant. The null
hypothesis that CPI and the interaction between CPI and OGP membership are jointly equal to
zero can not be rejected (p-value = 0.31). For non-OGP members, the results are also not
statistically significant.
The signs on the coefficients of the drivers of innovation – research and development
expenditures as a percentage of GDP, and GDP per capita – are consistent with the original
hypothesis that these variables would have a positive effect on innovation (See Exhibit 1). On the
other hand, the coefficient on the Worldwide Governance Indicator “Voice and Accountability”
did not have positive effect on innovation, which was inconsistent with the original hypothesis
(See Exhibit 1). Yet, only the coefficient on research and development expenditures as a
percentage of GDP is statistically significant indicating that the payoff in increasing R&D
investment is an increase in innovation (See Table 2).
As many open government policies and transparency initiatives highlight the potential of such
transparency initiatives to increase innovation, economic growth and job creation, one possible
explanation for the outcome of this study is omitted variable bias. As mentioned earlier, trade,
level of labor force education, and the government indicator “Rule of Law” were considered for
this study but were not pursued because these controls either did not pass diagnostic tests or did
not substantially change the outcome of the study. Since transparency and innovation are
multidimensional, additional variables might be considered in future studies to further control the
model.
20
POLICY IMPLICATIONS
Research on government transparency has traditionally focused on political and social
benefits, such as government accountability and civic participation. However, current
government transparency policies in the U.S. highlight the potential economic benefits of
transparency, particularly as a result of releasing data to the public (Orszag, 2009; Linders, 2011;
Burwell, 2013). Although the policies associate government transparency with positive economic
growth, additional research is needed to fully understand the nature of the association.
Currently, transparency policies are focused on increasing the amount of data that are made
available to the public. Since open data and open government policies have only been recently
implemented, future research should assess how the amount and extent of use of open data are
driving innovation and improving economies. By demonstrating a positive relationship between
transparency and innovation, additional research could justify the implementation of additional
open government and open data policies.
Although open government initiatives are shifting to data collection and dissemination, there
is yet no direct measure of this dimension of transparency. Although using corruption as a proxy
for transparency is an established method in government transparency and open government
research, researchers agree that there needs to be a more direct measure of transparency,
particularly to capture the extent of data dissemination and utilization.
Some researchers have tried to create new measures and indexes of transparency, although
these are seemingly narrow in focus. For example, Hollyer et al. (2013) have recently developed
an alternative measure of transparency, referred to as the “HRV Index,” which focuses on “the
collection and dissemination of credible economic data by national statistical offices” (Hollyer,
21
2013). However until an alternate measure better represents transparency over time, corruption is
likely to continue to be used as a proxy in transparency research.
In addition, researchers have debated the limitations on measuring innovative activity as the
number patents applications since this measure does not capture the nuances of innovation
(Griliches, 1998; Furman, 2002). Research conducted by a consortium of organizations,
including INSEAD and the World Intellectual Property Organization, developed the Global
Innovation Index (GII) to attempt to measure innovation more holistically. Launched in 2007,
this index examines a country’s innovation on multiple parameters from the public and private
sector and takes into consideration the importance of innovation to drive economic growth.
The present study attempts to add to the body of research on open government and to
empirically evaluate the association of government transparency and innovation and to examine
the difference in association for countries participating in the OGP. Although the results are not
statistically significant, the study makes an initial attempt to quantify the association of
government transparency and innovation. Additional research would help justify the
implementation of open government policies and encourage more countries to participate in the
Open Government Partnership.
22
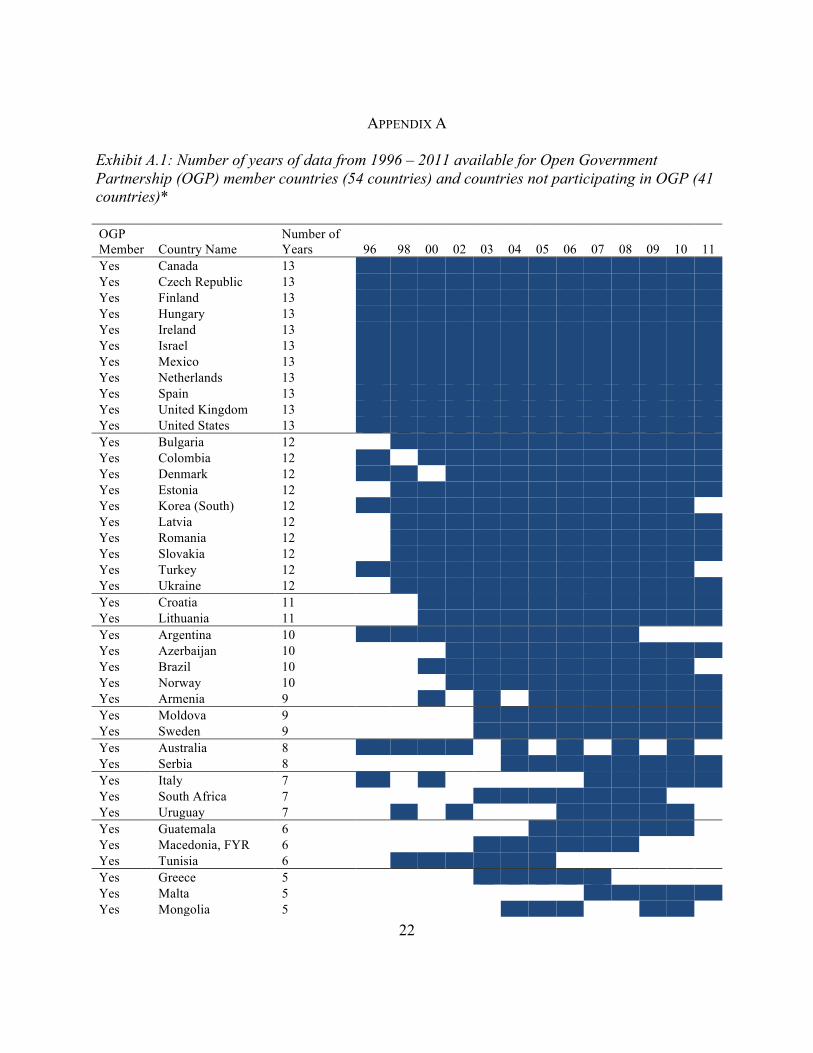
APPENDIX A
Exhibit A.1: Number of years of data from 1996 – 2011 available for Open Government Partnership (OGP) member countries (54 countries) and countries not participating in OGP (41 countries)* OGP Member Country Name
Number of Years 96 98 00 02 03 04 05 06 07 08 09 10 11
Yes Canada 13 1 1 1 1 1 1 1 1 1 1 1 1 1 Yes Czech Republic 13 1 1 1 1 1 1 1 1 1 1 1 1 1 Yes Finland 13 1 1 1 1 1 1 1 1 1 1 1 1 1 Yes Hungary 13 1 1 1 1 1 1 1 1 1 1 1 1 1 Yes Ireland 13 1 1 1 1 1 1 1 1 1 1 1 1 1 Yes Israel 13 1 1 1 1 1 1 1 1 1 1 1 1 1 Yes Mexico 13 1 1 1 1 1 1 1 1 1 1 1 1 1 Yes Netherlands 13 1 1 1 1 1 1 1 1 1 1 1 1 1 Yes Spain 13 1 1 1 1 1 1 1 1 1 1 1 1 1 Yes United Kingdom 13 1 1 1 1 1 1 1 1 1 1 1 1 1 Yes United States 13 1 1 1 1 1 1 1 1 1 1 1 1 1 Yes Bulgaria 12 0 1 1 1 1 1 1 1 1 1 1 1 1 Yes Colombia 12 1 0 1 1 1 1 1 1 1 1 1 1 1 Yes Denmark 12 1 1 0 1 1 1 1 1 1 1 1 1 1 Yes Estonia 12 0 1 1 1 1 1 1 1 1 1 1 1 1 Yes Korea (South) 12 1 1 1 1 1 1 1 1 1 1 1 1 0 Yes Latvia 12 0 1 1 1 1 1 1 1 1 1 1 1 1 Yes Romania 12 0 1 1 1 1 1 1 1 1 1 1 1 1 Yes Slovakia 12 0 1 1 1 1 1 1 1 1 1 1 1 1 Yes Turkey 12 1 1 1 1 1 1 1 1 1 1 1 1 0 Yes Ukraine 12 0 1 1 1 1 1 1 1 1 1 1 1 1 Yes Croatia 11 0 0 1 1 1 1 1 1 1 1 1 1 1 Yes Lithuania 11 0 0 1 1 1 1 1 1 1 1 1 1 1 Yes Argentina 10 1 1 1 1 1 1 1 1 1 1 0 0 0 Yes Azerbaijan 10 0 0 0 1 1 1 1 1 1 1 1 1 1 Yes Brazil 10 0 0 1 1 1 1 1 1 1 1 1 1 0 Yes Norway 10 0 0 0 1 1 1 1 1 1 1 1 1 1 Yes Armenia 9 0 0 1 0 1 0 1 1 1 1 1 1 1 Yes Moldova 9 0 0 0 0 1 1 1 1 1 1 1 1 1 Yes Sweden 9 0 0 0 0 1 1 1 1 1 1 1 1 1 Yes Australia 8 1 1 1 1 0 1 0 1 0 1 0 1 0 Yes Serbia 8 0 0 0 0 0 1 1 1 1 1 1 1 1 Yes Italy 7 1 0 1 0 0 0 0 0 1 1 1 1 1 Yes South Africa 7 0 0 0 0 1 1 1 1 1 1 1 0 0 Yes Uruguay 7 0 1 0 1 0 0 0 1 1 1 1 1 0 Yes Guatemala 6 0 0 0 0 0 0 1 1 1 1 1 1 0 Yes Macedonia, FYR 6 0 0 0 0 1 1 1 1 1 1 0 0 0 Yes Tunisia 6 0 1 1 1 1 1 1 0 0 0 0 0 0 Yes Greece 5 0 0 0 0 1 1 1 1 1 0 0 0 0 Yes Malta 5 0 0 0 0 0 0 0 0 1 1 1 1 1 Yes Mongolia 5 0 0 0 0 0 1 1 1 0 0 1 1 0
23
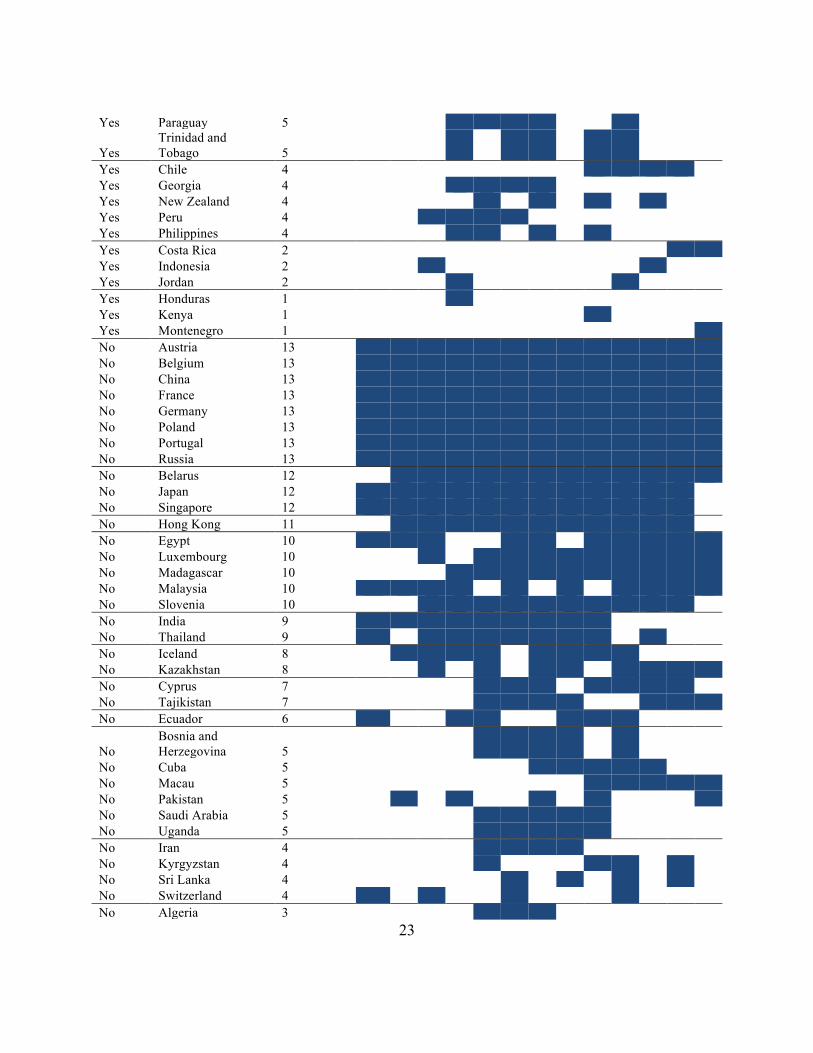
Yes Paraguay 5 0 0 0 1 1 1 1 0 0 1 0 0 0
Yes Trinidad and Tobago 5 0 0 0 1 0 1 1 0 1 1 0 0 0
Yes Chile 4 0 0 0 0 0 0 0 0 1 1 1 1 0 Yes Georgia 4 0 0 0 1 1 1 1 0 0 0 0 0 0 Yes New Zealand 4 0 0 0 0 1 0 1 0 1 0 1 0 0 Yes Peru 4 0 0 1 1 1 1 0 0 0 0 0 0 0 Yes Philippines 4 0 0 0 1 1 0 1 0 1 0 0 0 0 Yes Costa Rica 2 0 0 0 0 0 0 0 0 0 0 0 1 1 Yes Indonesia 2 0 0 1 0 0 0 0 0 0 0 1 0 0 Yes Jordan 2 0 0 0 1 0 0 0 0 0 1 0 0 0 Yes Honduras 1 0 0 0 1 0 0 0 0 0 0 0 0 0 Yes Kenya 1 0 0 0 0 0 0 0 0 1 0 0 0 0 Yes Montenegro 1 0 0 0 0 0 0 0 0 0 0 0 0 1 No Austria 13 1 1 1 1 1 1 1 1 1 1 1 1 1 No Belgium 13 1 1 1 1 1 1 1 1 1 1 1 1 1 No China 13 1 1 1 1 1 1 1 1 1 1 1 1 1 No France 13 1 1 1 1 1 1 1 1 1 1 1 1 1 No Germany 13 1 1 1 1 1 1 1 1 1 1 1 1 1 No Poland 13 1 1 1 1 1 1 1 1 1 1 1 1 1 No Portugal 13 1 1 1 1 1 1 1 1 1 1 1 1 1 No Russia 13 1 1 1 1 1 1 1 1 1 1 1 1 1 No Belarus 12 0 1 1 1 1 1 1 1 1 1 1 1 1 No Japan 12 1 1 1 1 1 1 1 1 1 1 1 1 0 No Singapore 12 1 1 1 1 1 1 1 1 1 1 1 1 0 No Hong Kong 11 0 1 1 1 1 1 1 1 1 1 1 1 0 No Egypt 10 1 1 1 0 0 1 1 0 1 1 1 1 1 No Luxembourg 10 0 0 1 0 1 1 1 1 1 1 1 1 1 No Madagascar 10 0 0 0 1 1 1 1 1 1 1 1 1 1 No Malaysia 10 1 1 1 1 0 1 0 1 0 1 1 1 1 No Slovenia 10 0 0 1 1 1 1 1 1 1 1 1 1 0 No India 9 1 1 1 1 1 1 1 1 1 0 0 0 0 No Thailand 9 1 0 1 1 1 1 1 1 1 0 1 0 0 No Iceland 8 0 1 1 1 1 0 1 1 1 1 0 0 0 No Kazakhstan 8 0 0 1 0 1 0 1 1 0 1 1 1 1 No Cyprus 7 0 0 0 0 1 1 1 0 1 1 1 1 0 No Tajikistan 7 0 0 0 0 1 1 1 1 0 0 1 1 1 No Ecuador 6 1 0 0 1 1 0 0 1 1 1 0 0 0
No Bosnia and Herzegovina 5 0 0 0 0 1 1 1 1 0 1 0 0 0
No Cuba 5 0 0 0 0 0 0 1 1 1 1 1 0 0 No Macau 5 0 0 0 0 0 0 0 0 1 1 1 1 1 No Pakistan 5 0 1 0 1 0 0 1 0 1 0 0 0 1 No Saudi Arabia 5 0 0 0 0 1 1 1 1 1 0 0 0 0 No Uganda 5 0 0 0 0 1 1 1 1 1 0 0 0 0 No Iran 4 0 0 0 0 1 1 1 1 0 0 0 0 0 No Kyrgyzstan 4 0 0 0 0 1 0 0 0 1 1 0 1 0 No Sri Lanka 4 0 0 0 0 0 1 0 1 0 1 0 1 0 No Switzerland 4 1 0 1 0 0 1 0 0 0 1 0 0 0 No Algeria 3 0 0 0 0 1 1 1 0 0 0 0 0 0
24
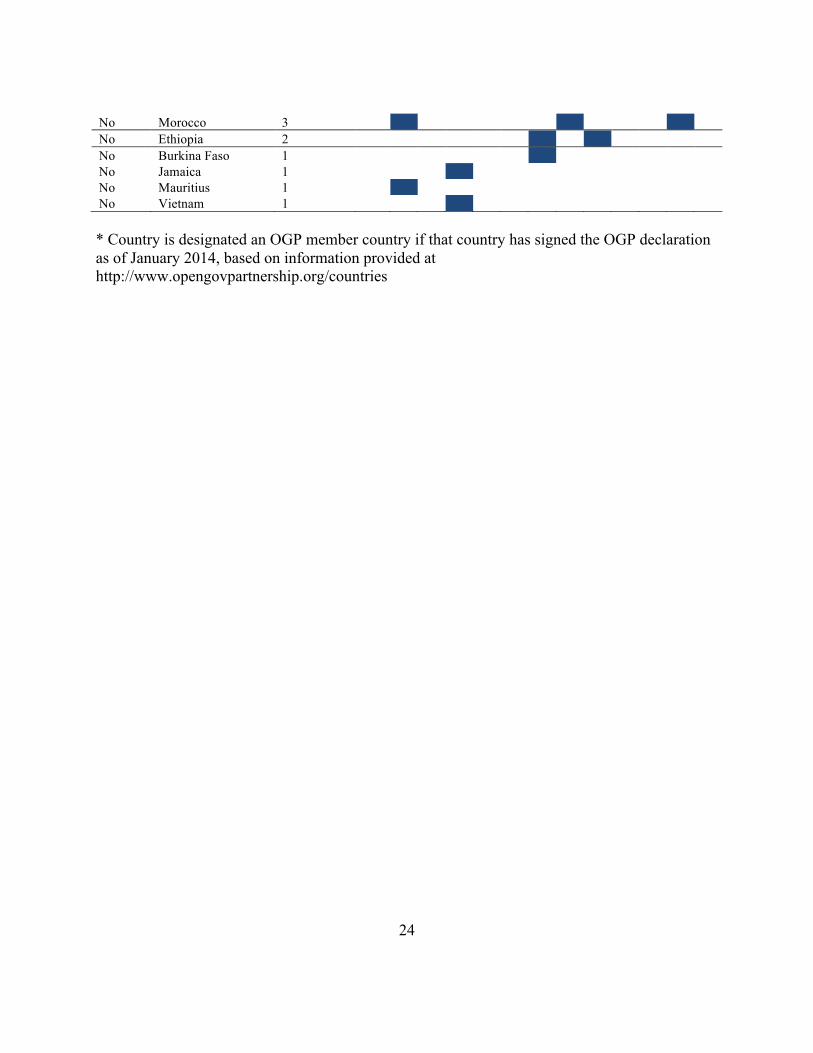
No Morocco 3 0 1 0 0 0 0 0 1 0 0 0 1 0 No Ethiopia 2 0 0 0 0 0 0 1 0 1 0 0 0 0 No Burkina Faso 1 0 0 0 0 0 0 1 0 0 0 0 0 0 No Jamaica 1 0 0 0 1 0 0 0 0 0 0 0 0 0 No Mauritius 1 0 1 0 0 0 0 0 0 0 0 0 0 0 No Vietnam 1 0 0 0 1 0 0 0 0 0 0 0 0 0 * Country is designated an OGP member country if that country has signed the OGP declaration as of January 2014, based on information provided at http://www.opengovpartnership.org/countries
25
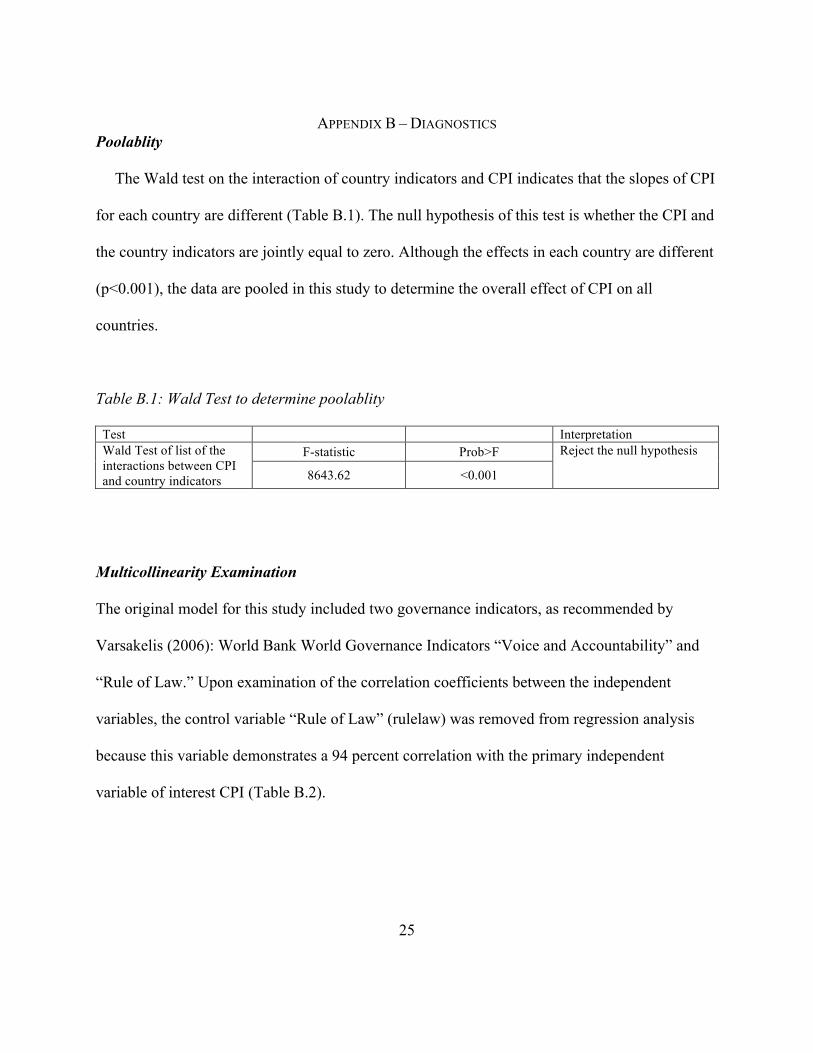
APPENDIX B – DIAGNOSTICS Poolablity
The Wald test on the interaction of country indicators and CPI indicates that the slopes of CPI
for each country are different (Table B.1). The null hypothesis of this test is whether the CPI and
the country indicators are jointly equal to zero. Although the effects in each country are different
(p<0.001), the data are pooled in this study to determine the overall effect of CPI on all
countries.
Table B.1: Wald Test to determine poolablity
Test Interpretation Wald Test of list of the interactions between CPI and country indicators
F-statistic Prob>F Reject the null hypothesis
8643.62 <0.001
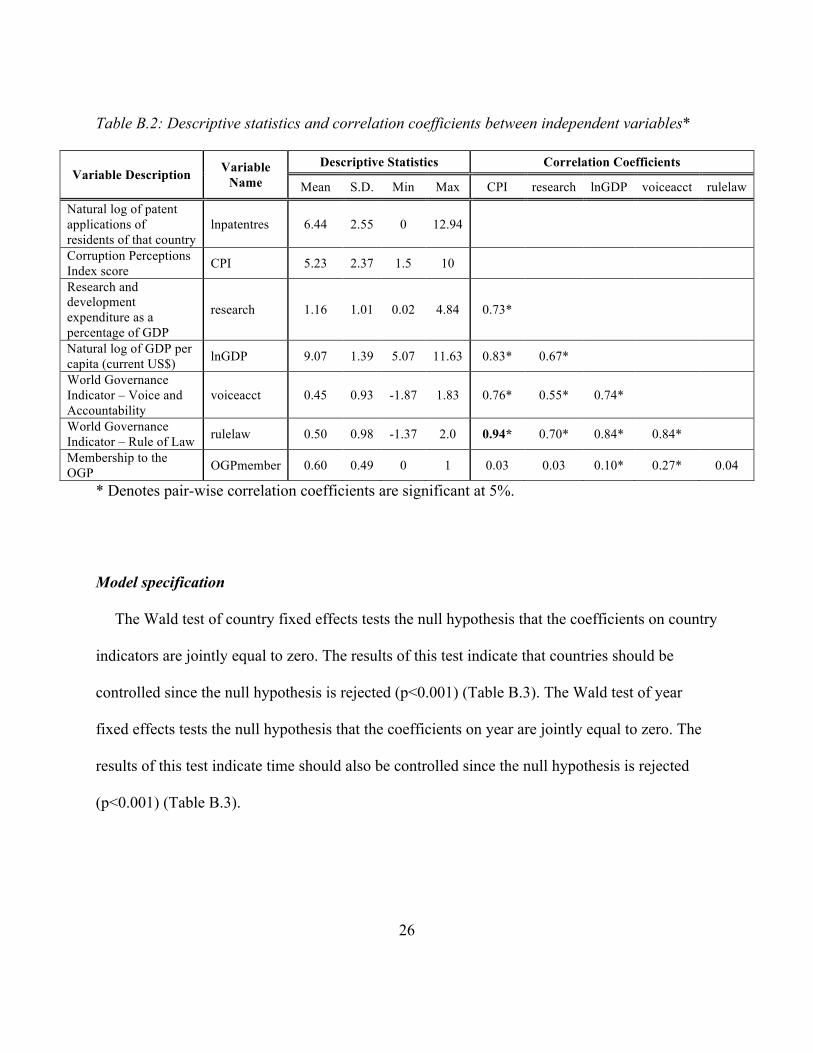
Multicollinearity Examination
The original model for this study included two governance indicators, as recommended by
Varsakelis (2006): World Bank World Governance Indicators “Voice and Accountability” and
“Rule of Law.” Upon examination of the correlation coefficients between the independent
variables, the control variable “Rule of Law” (rulelaw) was removed from regression analysis
because this variable demonstrates a 94 percent correlation with the primary independent
variable of interest CPI (Table B.2).
26
Table B.2: Descriptive statistics and correlation coefficients between independent variables*
Variable Description Variable Name
Descriptive Statistics Correlation Coefficients
Mean S.D. Min Max CPI research lnGDP voiceacct rulelaw
Natural log of patent applications of residents of that country
lnpatentres 6.44 2.55 0 12.94
Corruption Perceptions Index score CPI 5.23 2.37 1.5 10
Research and development expenditure as a percentage of GDP
research 1.16 1.01 0.02 4.84 0.73*
Natural log of GDP per capita (current US$) lnGDP 9.07 1.39 5.07 11.63 0.83* 0.67*
World Governance Indicator – Voice and Accountability
voiceacct 0.45 0.93 -1.87 1.83 0.76* 0.55* 0.74*
World Governance Indicator – Rule of Law rulelaw 0.50 0.98 -1.37 2.0 0.94* 0.70* 0.84* 0.84*
Membership to the OGP OGPmember 0.60 0.49 0 1 0.03 0.03 0.10* 0.27* 0.04
* Denotes pair-wise correlation coefficients are significant at 5%.
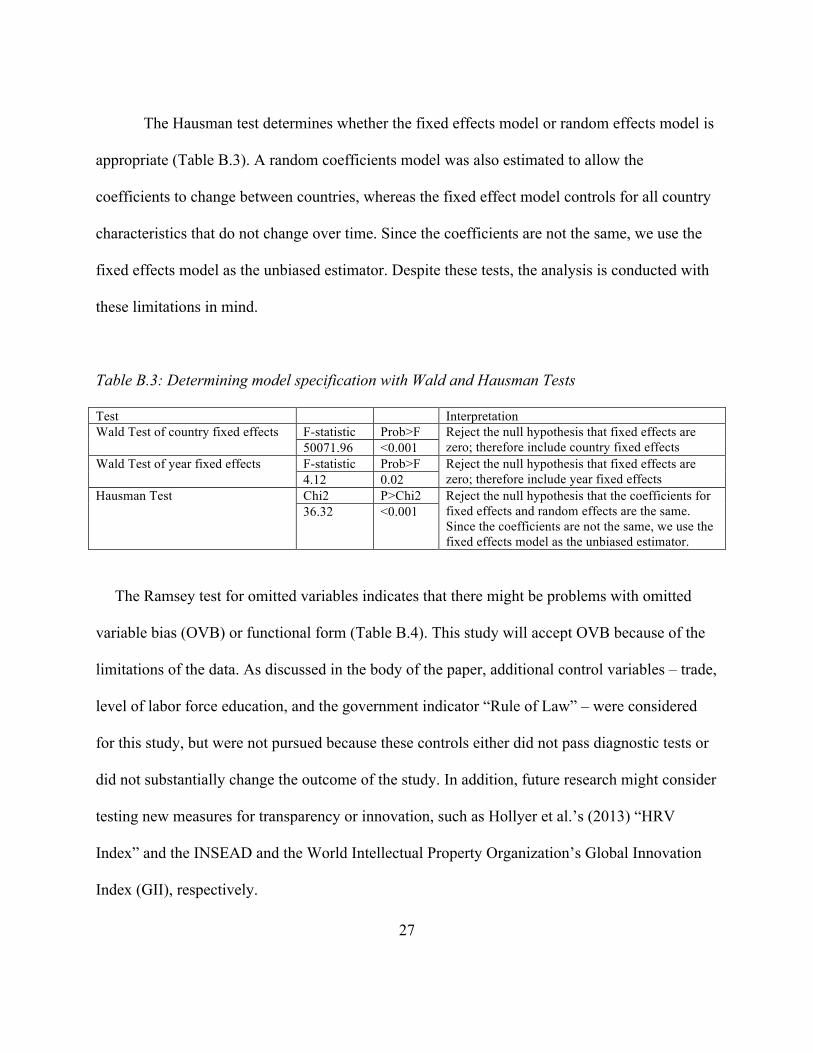
Model specification
The Wald test of country fixed effects tests the null hypothesis that the coefficients on country
indicators are jointly equal to zero. The results of this test indicate that countries should be
controlled since the null hypothesis is rejected (p<0.001) (Table B.3). The Wald test of year
fixed effects tests the null hypothesis that the coefficients on year are jointly equal to zero. The
results of this test indicate time should also be controlled since the null hypothesis is rejected
(p<0.001) (Table B.3).
27
The Hausman test determines whether the fixed effects model or random effects model is
appropriate (Table B.3). A random coefficients model was also estimated to allow the
coefficients to change between countries, whereas the fixed effect model controls for all country
characteristics that do not change over time. Since the coefficients are not the same, we use the
fixed effects model as the unbiased estimator. Despite these tests, the analysis is conducted with
these limitations in mind.
Table B.3: Determining model specification with Wald and Hausman Tests Test Interpretation Wald Test of country fixed effects F-statistic Prob>F Reject the null hypothesis that fixed effects are
zero; therefore include country fixed effects 50071.96 <0.001 Wald Test of year fixed effects F-statistic Prob>F Reject the null hypothesis that fixed effects are
zero; therefore include year fixed effects 4.12 0.02 Hausman Test Chi2 P>Chi2 Reject the null hypothesis that the coefficients for
fixed effects and random effects are the same. Since the coefficients are not the same, we use the fixed effects model as the unbiased estimator.
36.32 <0.001
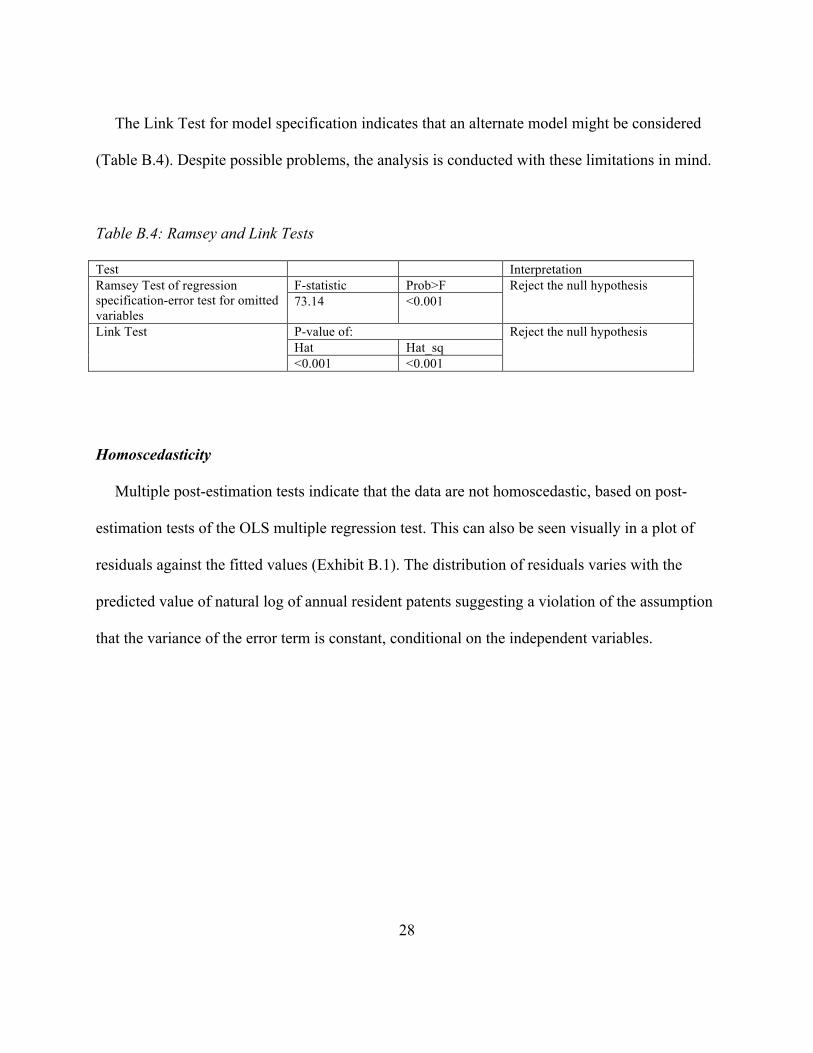
The Ramsey test for omitted variables indicates that there might be problems with omitted
variable bias (OVB) or functional form (Table B.4). This study will accept OVB because of the
limitations of the data. As discussed in the body of the paper, additional control variables – trade,
level of labor force education, and the government indicator “Rule of Law” – were considered
for this study, but were not pursued because these controls either did not pass diagnostic tests or
did not substantially change the outcome of the study. In addition, future research might consider
testing new measures for transparency or innovation, such as Hollyer et al.’s (2013) “HRV
Index” and the INSEAD and the World Intellectual Property Organization’s Global Innovation
Index (GII), respectively.
28
The Link Test for model specification indicates that an alternate model might be considered
(Table B.4). Despite possible problems, the analysis is conducted with these limitations in mind.
Table B.4: Ramsey and Link Tests Test Interpretation Ramsey Test of regression specification-error test for omitted variables
F-statistic Prob>F Reject the null hypothesis 73.14 <0.001
Link Test P-value of: Reject the null hypothesis Hat Hat_sq <0.001 <0.001
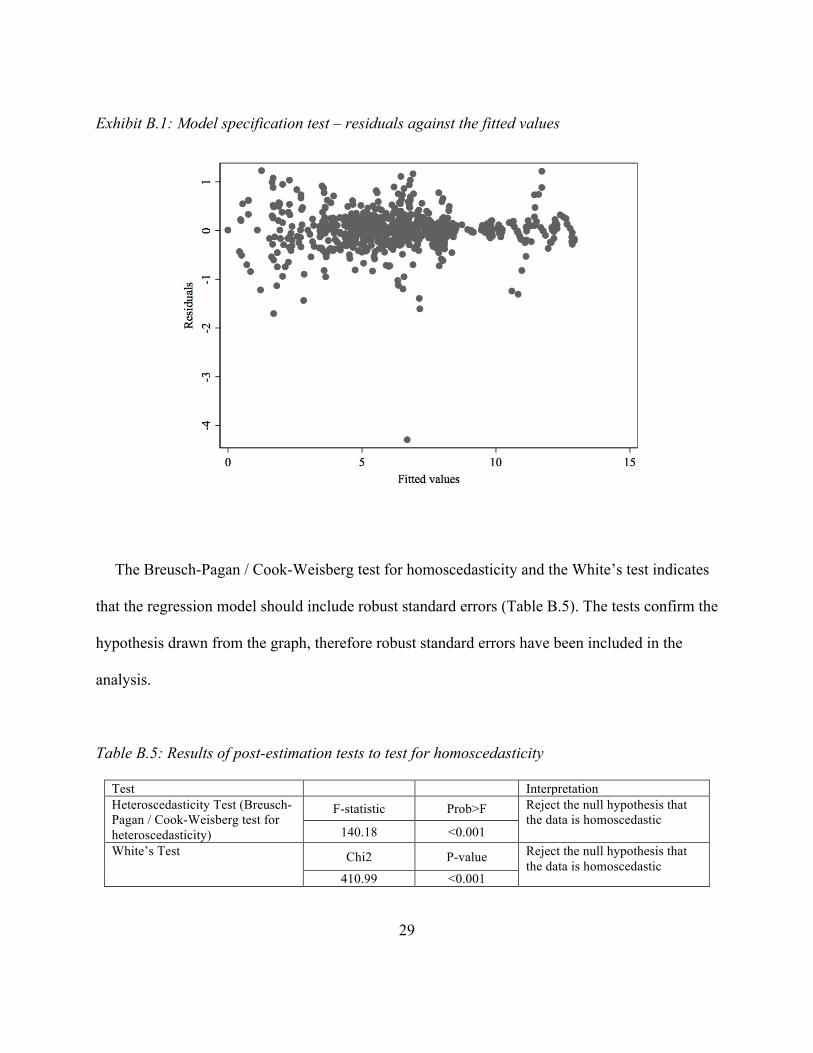
Homoscedasticity
Multiple post-estimation tests indicate that the data are not homoscedastic, based on post-
estimation tests of the OLS multiple regression test. This can also be seen visually in a plot of
residuals against the fitted values (Exhibit B.1). The distribution of residuals varies with the
predicted value of natural log of annual resident patents suggesting a violation of the assumption
that the variance of the error term is constant, conditional on the independent variables.
29
Exhibit B.1: Model specification test – residuals against the fitted values
The Breusch-Pagan / Cook-Weisberg test for homoscedasticity and the White’s test indicates
that the regression model should include robust standard errors (Table B.5). The tests confirm the
hypothesis drawn from the graph, therefore robust standard errors have been included in the
analysis.
Table B.5: Results of post-estimation tests to test for homoscedasticity
Test Interpretation Heteroscedasticity Test (Breusch-Pagan / Cook-Weisberg test for heteroscedasticity)
F-statistic Prob>F Reject the null hypothesis that the data is homoscedastic
140.18 <0.001 White’s Test
Chi2 P-value Reject the null hypothesis that the data is homoscedastic
410.99 <0.001
30
BIBLIOGRAPHY
Battelle Technology Partnership Practice for United Medical Research (UMR) (2012). The Impact of Genomics on the U.S. Economy – Federal research investment has contributed to medical science, improved public health, created American jobs and helped generate nearly $1 trill in economic impacts to date. Battelle Memorial Institute.
Bertot, J. C., Jaeger, P. T., & Grimes, J. M. (2012). Promoting transparency and accountability
through ICTs, social media, and collaborative e-government. Transforming Government: People, Process and Policy, 6(1), 78-91.
Broberg, J. C., McKelvie, A., Short, J. C., Ketchen Jr., D. J., & Wan, W. P. (2012). Political
institutional structure influences on innovative activity. Journal of Business Research. Burwell, Sylvia M., Steve VanRoekel, Todd Park, Dominic J. Mancini (2013). Open Data
Policy—Managing Information as an Asset. Memorandum for the Heads of Executive Departments and Agencies.
Dutta, Soumitra (2012). The Global Innovation Index 2012: Stronger Innovation Linkages for
Global Growth. INSEAD and WIPO. Furman, J. L., Porter, M. E., & Stern, S. (2002). The determinants of national innovative
capacity. Research Policy, 31(6), 899-933. Griliches, Z. (1998). Patent statistics as economic indicators: A survey. R&D and productivity:
The econometric evidence (pp. 287-343). University of Chicago Press. Grimmelikhuijsen, S., Porumbescu, G., Hong, B., & Im, T. (2013). The effect of transparency on
trust in government: A cross-national comparative experiment. Public Administration Review, 73(4), 575-586.
Hammell, Richard, Costi Perricos, Harvey Lewis, David Branch (2012). Open growth:
Stimulating demand for open data in the UK. Deloitte. Hollyer, J., Rosendorff, B., & Vreeland, J. (2012). Measuring transparency. Retrieved on 17
August 2013 from http://ssrn.com/abstract= 2113665. Jetzek, T., Avital, M., & Bjørn-Andersen, N. (2012). The Value of Open Government Data: A
Strategic Analysis Framework. In 2012 Pre-ICIS Workshop. Kaufmann, D., Kraay, A., & Mastruzzi, M. (2010). The worldwide governance indicators:
Methodology and analytical issues. World Bank Policy Research Working Paper, No. 5430.
31
Linders, D., & Wilson, S. C. (2011, June). What is open government?: one year after the directive. In Proceedings of the 12th Annual International Digital Government Research Conference: Digital Government Innovation in Challenging Times (pp. 262-271). ACM.
Mauro, P. (1995). Corruption and growth. The Quarterly Journal of Economics, 110(3), 681-
712. Meijer, A. (2013, May–June). Understanding the complex dynamics of transparency. Public
Administration Review. 73(3), 429–439. Obama, Barack (2008). Transparency and Open Government. Retrieved on 17 August 2013
from The White House, http://www.whitehouse.gov/the_press_office/TransparencyandOpenGovernment
Obama, Barack (2009). Transparency and open government. Memorandum for the Heads of
Executive Departments and Agencies, Retrieved data from http://www.whitehouse.gov/sites/default/files/microsites/ostp/ostp_public_access_memo_2013.pdf
Obama, Barack (2013) Executive Order – Making Open and Machine-Readable the New Default
for Government Information. Retrieved on 17 August 2013 from The White House, http://www.whitehouse.gov/the-press-office/2013/05/09/executive-order-making-open-and-machine-readable-new-default-government
Open Government Partnership (September 2011) Open Government Declaration. Retrieved on
17 August 2013 from http://www.opengovpartnership.org/open-government-declaration Orszag, P. (2009). Open government directive. Memorandum for the Heads of Executive
Departments and Agencies. Relly, J. E., & Sabharwal, M. (2009). Perceptions of transparency of government policymaking:
A cross-national study. Government Information Quarterly, 26(1), 148-157. Shim, D. C., & Eom, T. H. (2008). E-government and anti-corruption: Empirical analysis of
international data. International Journal of Public Administration, 31(3), 298-316. Stock, James H. and Mark W. Watson (2011). Introduction to Econometrics, 3rd edition.
Addison-Wesley. Varsakelis, N. C. (2006). Education, political institutions and innovative activity: A cross-
country empirical investigation. Research Policy, 35(7), 1083-1090.
32
Yu, H., & Robinson, D. (2012). The new ambiguity of 'open government'. Princeton CITP/Yale ISP Working Paper, 59 UCLA L. Rev. Disc. 178.
Zhao, J. H., Kim, S. H., & Du, J. (2003). The impact of corruption and transparency on foreign
direct investment: An empirical analysis. MIR: Management International Review, 43(1), 41-62.