Embed Size (px)
Citation preview
The Incremental Benefits and Costs of Football,
Bowling, and Rifle at the University of Alabama at Birmingham
(A Primary and Secondary Study)
Prepared for Public Release by
Daniel A. Rascher, Ph.D. [email protected]
Andrew D. Schwarz, M.B.A. [email protected]
of the firm
With a fundamental valuation perspective in an appendix by
Joseph M. Orlando, ASA [email protected]
of the firm
Original Version April 22, 2015 Revised April 30, 2015
This Report was prepared by: Daniel A. Rascher, Ph.D. Professor & Director of Academic Programs Sport Management Program College of Arts & Sciences University of San Francisco Partner, OSKR LLC 2200 Powell Street, Suite 430 Emeryville, CA 94608 Tel: 510.899.7197 E-mail: [email protected]
Andrew D. Schwarz, M.B.A. Partner, OSKR LLC 2200 Powell Street, Suite 430 Emeryville, CA 94608 Tel: 510.899.7190 E-mail: [email protected] Affiliate Professor University of San Francisco Appendix VII written by Joseph M. Orlando, ASA Director – Business Valuation Frank, Rimerman + Co. LLP E-mail: [email protected] This document is protected under the copyright laws of the United States and other countries as an unpublished work. © (Report) 2015 Rascher and Schwarz (Unpublished). All rights reserved. © (Appendix VII) 2015 Orlando (Unpublished). All rights reserved.
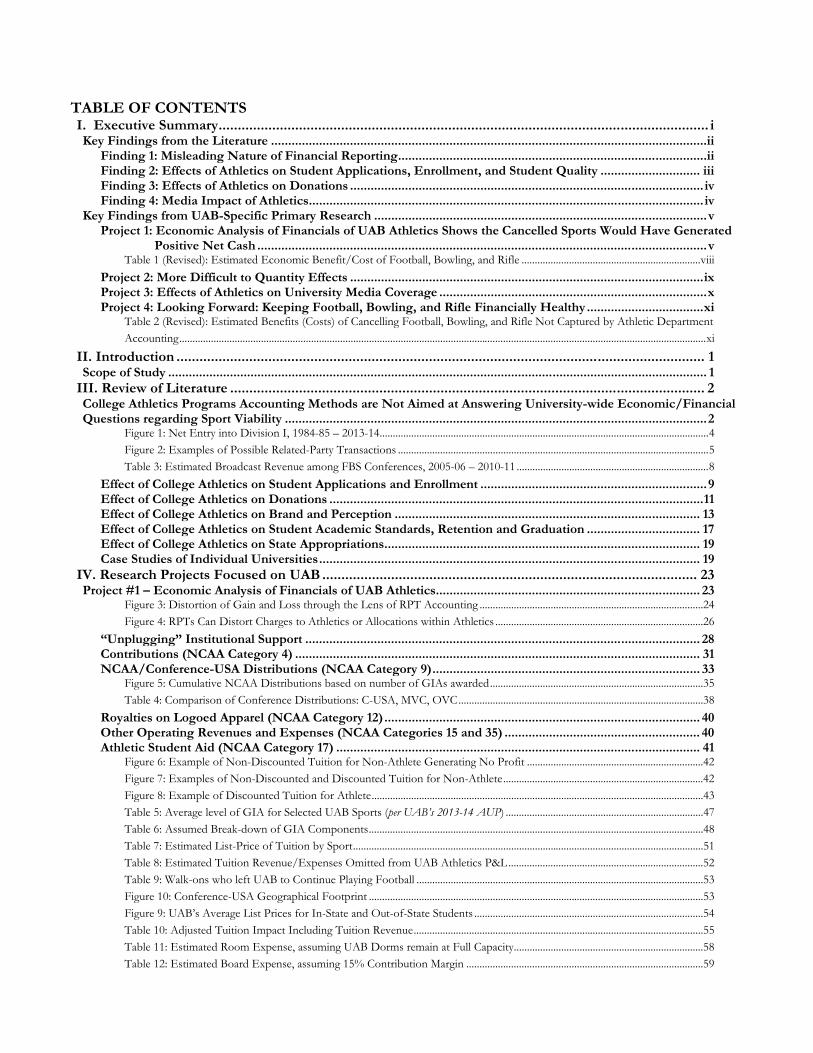
TABLE OF CONTENTS I. Executive Summary ................................................................................................................................ iKey Findings from the Literature ...............................................................................................................................ii
Finding 1: Misleading Nature of Financial Reporting ..........................................................................................iiFinding 2: Effects of Athletics on Student Applications, Enrollment, and Student Quality ............................. iiiFinding 3: Effects of Athletics on Donations ....................................................................................................... ivFinding 4: Media Impact of Athletics ................................................................................................................... iv
Key Findings from UAB-Specific Primary Research ................................................................................................. vProject 1: Economic Analysis of Financials of UAB Athletics Shows the Cancelled Sports Would Have Generated
Positive Net Cash ................................................................................................................................... vTable 1 (Revised): Estimated Economic Benefit/Cost of Football, Bowling, and Rifle .................................................................... viii
Project 2: More Difficult to Quantity Effects ....................................................................................................... ixProject 3: Effects of Athletics on University Media Coverage .............................................................................. xProject 4: Looking Forward: Keeping Football, Bowling, and Rifle Financially Healthy .................................. xi
Table 2 (Revised): Estimated Benefits (Costs) of Cancelling Football, Bowling, and Rifle Not Captured by Athletic Department
Accounting ........................................................................................................................................................................................................ xiII. Introduction .......................................................................................................................................... 1Scope of Study ............................................................................................................................................................. 1
III. Review of Literature ............................................................................................................................ 2College Athletics Programs Accounting Methods are Not Aimed at Answering University-wide Economic/Financial Questions regarding Sport Viability ........................................................................................................................... 2
Figure 1: Net Entry into Division I, 1984-85 – 2013-14 ............................................................................................................................. 4Figure 2: Examples of Possible Related-Party Transactions ...................................................................................................................... 5Table 3: Estimated Broadcast Revenue among FBS Conferences, 2005-06 – 2010-11 ......................................................................... 8
Effect of College Athletics on Student Applications and Enrollment .................................................................. 9Effect of College Athletics on Donations ............................................................................................................. 11Effect of College Athletics on Brand and Perception ......................................................................................... 13Effect of College Athletics on Student Academic Standards, Retention and Graduation ................................. 17Effect of College Athletics on State Appropriations ............................................................................................ 19Case Studies of Individual Universities ............................................................................................................... 19
IV. Research Projects Focused on UAB .................................................................................................. 23Project #1 – Economic Analysis of Financials of UAB Athletics............................................................................. 23
Figure 3: Distortion of Gain and Loss through the Lens of RPT Accounting .....................................................................................24Figure 4: RPTs Can Distort Charges to Athletics or Allocations within Athletics ...............................................................................26
“Unplugging” Institutional Support ................................................................................................................... 28Contributions (NCAA Category 4) ...................................................................................................................... 31NCAA/Conference-USA Distributions (NCAA Category 9) .............................................................................. 33
Figure 5: Cumulative NCAA Distributions based on number of GIAs awarded .................................................................................35Table 4: Comparison of Conference Distributions: C-USA, MVC, OVC .............................................................................................38
Royalties on Logoed Apparel (NCAA Category 12) ............................................................................................ 40Other Operating Revenues and Expenses (NCAA Categories 15 and 35) ......................................................... 40Athletic Student Aid (NCAA Category 17) .......................................................................................................... 41
Figure 6: Example of Non-Discounted Tuition for Non-Athlete Generating No Profit ...................................................................42Figure 7: Examples of Non-Discounted and Discounted Tuition for Non-Athlete ............................................................................42Figure 8: Example of Discounted Tuition for Athlete ..............................................................................................................................43Table 5: Average level of GIA for Selected UAB Sports (per UAB’s 2013-14 AUP) ...........................................................................47Table 6: Assumed Break-down of GIA Components ...............................................................................................................................48Table 7: Estimated List-Price of Tuition by Sport .....................................................................................................................................51Table 8: Estimated Tuition Revenue/Expenses Omitted from UAB Athletics P&L ..........................................................................52Table 9: Walk-ons who left UAB to Continue Playing Football .............................................................................................................53Figure 10: Conference-USA Geographical Footprint ...............................................................................................................................53Figure 9: UAB’s Average List Prices for In-State and Out-of-State Students .......................................................................................54Table 10: Adjusted Tuition Impact Including Tuition Revenue ..............................................................................................................55Table 11: Estimated Room Expense, assuming UAB Dorms remain at Full Capacity ........................................................................58Table 12: Estimated Board Expense, assuming 15% Contribution Margin ..........................................................................................59
Table 13: Estimated Book Expense, assuming UAB Receives 15% of Book Sales .............................................................................60Table 14: Estimated Impact of New COA Stipends and Unlimited Food Allowances .......................................................................62Table 15: Net Impact of Providing Athletic Scholarships ........................................................................................................................63
Staff Salaries & Benefits-UAB & Related Parties (NCAA Category 19) ............................................................. 64Table 16: Elements of the Standard UAB “Fringe Benefit” Charge .......................................................................................................64
Athletic Academic Center (NCAA Category 21) ................................................................................................. 67Team Travel (NCAA Category 28) ...................................................................................................................... 67
Figure 11: Impact of Conference Switch on West Virginia non-Football Travel Expense .................................................................68Fund Raising, Promotion and Marketing (NCAA Category 28) ........................................................................ 69Spirit Groups (NCAA Category 31) ...................................................................................................................... 70Medical Expenses and Insurance (NCAA Category 33) ..................................................................................... 71
The Bottom Line: How much do the three sports actually gain or lose for UAB? ................................................. 72Table 17 (Revised): Estimated Economic Benefit/Cost of Football, Bowling, and Rifle ...................................................................73
Project #2 – More Difficult to Quantify Benefits. .................................................................................................... 74Difficult to Quantify “Sports” Effects ...................................................................................................................... 74
Figure 12: Example of Merchandise Sales Apparently Not Attributed to Athletics .............................................................................75Difficult to Quantify Academic Financial and Non-Financial Effects .............................................................. 76
Figure 13: UAT Enrollment by Year, 2006-2004 .......................................................................................................................................77Figure 14: UAB Enrollment by State, Fall 2013 .........................................................................................................................................78Figure 15: Conference-USA Geographic Footprint ..................................................................................................................................79Figure 16: Missouri Valley Conference Geographic Footprint ................................................................................................................79Figure 17: Ohio Valley Conference Geographic Footprint ......................................................................................................................80
Project #3 – Media Coverage of UAB – Athletics and Non-Athletics ..................................................................... 81Table 18: Google News Estimate of UAB Media Coverage ....................................................................................................................82
Project #4 – Looking Forward .................................................................................................................................. 83Impact of Economic Base Case on Long-term Projections ............................................................................... 84Short-term Impact of Cancelling Football .......................................................................................................... 88Improving Fund-Raising through the Threat to Cancel Sports: UC-Berkeley Case Study ............................... 90Economic Analysis of Past Efforts to Cancel Football to Improve Rest of University ...................................... 91
Table 19: Schools That Have Dropped Football But Remained in Division I .....................................................................................92Economic Impact of UAB Football on the Birmingham Community ............................................................... 93Title IX issues: Would a UAB with Football need to add an additional Women’s Sport? ................................. 95Future Fund Raising Needs ............................................................................................................................... 102
Table 20 (Revised): Est. Benefits (Costs) of Cancelling Football, Bowling, and Rifle Not Captured by Ath. Dept. Accounting102Table 21: Debt Service and Total Debt (2012-13) for Select Peer Institutions .................................................................................. 105
The Bottom Line: What Should UAB ask of the Outside Community ............................................................. 107V. Conclusions ........................................................................................................................................ 108About the Authors ................................................................................................................................... 109Appendix I: Academic Articles Referenced ............................................................................................... 1Appendix II: Assumptions ......................................................................................................................... 6Appendix III: Potential Impact of Less Conservative Assumptions ........................................................ 12
Table 22 (Revised): Estimated Benefits (Costs) of Cancelling Football, Bowling, and Rifle based on Less Conservative Assumptions ...........................................................................................................................................................................................................................12Table 23 (Revised): Upside of Economic Benefit/Cost of Football, Bowling, and Rifle ....................................................................14
Appendix IV: Unadjusted UAB accounting data ..................................................................................... 15Table 24: Source Data per UAB’s 2013-14 AUP report ...........................................................................................................................15
Appendix V: Funding, Acknowledgements, and Relevant Past Work ..................................................... 16Funding ..................................................................................................................................................................... 16Acknowledgements ................................................................................................................................................... 17Relevant College Sports Work and Research Performed by Rascher and Schwarz ................................................ 18
Appendix VI: Future Research Proposals ............................................................................................... 20Future Project – Longitudinal Study of UAB Athletics and Donor/Applicant History .......................................... 20Future Project – Benchmarking against other C-USA institutions ......................................................................... 20Future Project – Focus Groups addressing “Future Research Project” questions above ...................................... 21
Proposal from The Global Citizens ..................................................................................................................... 21Appendix VII – A Fundamental Valuation Perspective by Joe Orlando ................................................. 24
| Executive Summary: Page i |
I. Executive Summary Summary of Conclusions This report was spurred by questions vital to the University of Alabama at Birmingham (UAB) community, namely what are the economic benefits and costs of an FBS football team as well as women’s bowling and rifle to the University, and on balance is the net impact on UAB finances and overall strength positive or negative? We undertake two major tasks: (1) a review of the academic literature on the economic costs and benefits of Division I sports programs, and (2) investigation of the specifics of the University of Alabama at Birmingham (UAB) sufficient to assess the incremental benefits and costs of the football, bowling, and rifle teams to the university as a whole. From the literature, we show that Athletic Department financial reporting has a systematic tendency to understate revenues and overstate costs from athletics. The result is that standard athletic department accounting provides poor insight into the financial impact of sports programs on the university as a whole.
The literature also finds some evidence for positive effects from athletics on (a) applications, enrollment, and student quality; (b) donations; and (c) media attention to/exposure for the university, especially among key demographic groups seeking admission to college.
From our UAB research, we find that the three sports in question did not cost the university anywhere near the $3.75 million indicated on UAB’s accounting statements for 2013-14. Instead, after making the sort of adjustments suggested by the economics literature, we conclude that the three sports were effectively break-even. Bowling showed a modest positive return for 2013-14, the last year for which complete data was available. Football and Rifle showed slight deficits, and in aggregate the three-sport balance was negative to the tune of $25,000. The key drivers of this conclusion are:
- Athletic Scholarships cost UAB far less than their listed prices.
- Conference USA membership is far superior, financially, to any alternative non-FBS conference. C-USA membership almost certainly hinges on UAB fielding an FBS football team.
We conclude that going forward, anticipated improvement in ticket sales from 2013-14 levels and new College Football Playoff revenues will outpace new expenses from Cost of Attendance (COA) stipends and unlimited food allowances. Once these new revenues and expenses kick in, we anticipate the aggregate annual surplus from football, bowling, and rifle would exceed $400,000, even without including the anticipated but hard-to-quantify benefits to admissions and enrollment, donations, and media exposure.
Based on this surplus, we see no specific need for any new funding for the three sports to resume in a profitable fashion. Nevertheless, we recommend the community commit to provide UAB with $1.2 million annually, to cover the new COA stipends and to provide a substantial portion of anticipated new debt service for desired facilities improvements. Doing so will likely keep these three sports in the black even as the university covers its share of the anticipated debt service. It will also provide funding during the recovery from the financial setbacks caused by the cancellation of the three sports.
| Executive Summary: Page ii |
The conclusions noted above and shown in the body of our report are based on conservative estimates and assumptions. When we faced an uncertain range of input values, we generally have chosen an assumption unfavorable to football’s profits (and the same holds for bowling and rifle). Even then, we project a pro forma annual surplus over $400,000. When we relax those conservative assumptions (in Appendix III), we show the annual surplus could exceed $2 million. Because of the causal link between FBS membership and these key sources of revenue, the university will be worse off, on a pure dollars and cents basis, without these three sports than with them, even after accounting for offsetting (downward) cost effects. Thus, we find the decision to terminate football, bowling, and rifle was ill advised from a net cash-flow perspective. Our analysis is distinct from, though obviously related to, the question of what UAB’s Athletic Department’s accounting figures will look like with or without these sports. Standard NCAA accounting (often referred to as AUP, or “Agreed Upon Procedures”), by its nature ignores economic factors that are vital when making forward-looking financial decisions, such as whether to continue or cancel a sport. By widening the focus to include economic factors, we provide a more robust analysis than would just a straightforward exercise in financial accounting. Our report begins with a literature review focused on well-established, peer-reviewed economics supporting a whole-University approach, and then we dive into the specifics of our research at UAB, research informed and focused by the economic consensus that has emerged from the literature. The literature review consisted of dozens of peer-reviewed journal articles and industry reports on how intercollegiate athletics impacts universities across the country. There is no one study in the literature that is sufficient to understand the specific relationship between athletics and UAB as a whole, but here we attempt to first present and then synthesize the teachings from that literature with a focus on UAB. Key Findings from the Literature
Finding 1: Misleading Nature of Financial Reporting
Related-party transactions (RPT) and cross-subsidies between athletics departments and their universities make the true underlying net economic value of athletics departments hard to discern directly from accounting statements. While there are errors in both directions, the accounting is more likely to understate revenues or overstate expenses than vice versa.
- What appeared to be a $1.5 million loss to Western Kentucky University (WKU) from having athletics was only a $330,000 loss when adjusting for the related-party transactions and actually a gain of over $5 million when accounting for the enrollment impact of athletics. (Borland, Goff & Pulsinelli, 1992)
- Utah State University reported a loss of $700,000 per year in the late 1980s, but was shown to actually have a gain of $366,000 (not accounting for merchandise sales attributable to athletics). (Skousen & Condie, 1988)
| Executive Summary: Page iii |
A general estimate using these adjustments to RPT shows that only 10% of D1 schools were losing money from their athletics program during the mid-1990s despite most Athletic Departments showing accounting losses. (Goff, 2000)
More recent studies of the University of San Francisco and the University of Nebraska-Omaha both found that the listed cost of athletic scholarships substantially overstated the cost savings from eliminating athletic scholarships.
- In the case of USF, actual expenses were $2.4 million less than the accounting indicated. (Howell & Rascher, 2011)
- For Nebraska-Omaha, the difference was enough to change a $1.5 million loss to a break-even result. (Schwarz, 2011)
Per Goff & Wilson (2013): “While the accounting practices at many institutions have reflected long-standing idiosyncratic practices not guided by any explicit strategy…, [k]eeping awareness of the rent flow low … permits either certain athletic or other university officials discretion over use of the flows. As a result, the most common practice over many decades has been to minimize or diminish apparent surpluses. In fact, the supposed losses have been a means for university presidents to pursue ‘cost containment’ measures designed to reduce the ability of athletic departments to spend the rents within their unit.”
Finding 2: Effects of Athletics on Student Applications, Enrollment, and Student Quality
The “Flutie Effect” is the notion that star athletes and athletics prominence lead to increases in applications to universities. The following examples illustrate increases in new student applications following athletic success but do not control for other factors.
- Flutie → 30% increase at Boston College (McEvoy, 2006) - Patrick Ewing → 30% increase at Georgetown University (McEvoy, 2006) - Steve Nash → 36% increase at Santa Clara University (Coonan, 2010) - Big 10 Championship → 21% increase at Northwestern U. (Dodd, 1997) - Gonzaga: 30-50% of applications increase after basketball success (Lieber, 2004)
Substantial changes in football winning percentage (greater than 0.250), such as UAB experienced between 2013 and 2014, have been shown to raise admissions by about 6%. (McEvoy, 2005).
Public schools show a likelihood of increases in enrollment after football success. The impact of sports success is larger on out-of-state enrollments than for in-state, and is likely due to increased interest among males, African-American students, and students who played high school sports who were more influenced by athletics outcomes in their choices for higher education than other students. (Pope & Pope, 2007 & 2009)
Athletic success can lead to increases in applications from students with higher SAT scores. Reaching the Sweet 16 of the men’s NCAA basketball tournament increases the number of mid- to high-quality students sending their SAT scores to a university by about 10%. (Pope & Pope, 2009)

| Executive Summary: Page iv |
Finding 3: Effects of Athletics on Donations
Public universities that played in a college football bowl game saw increases in alumni donations of up to 40%. Private universities that played in a college football bowl game received even higher increases in alumni donations of 54%. Appearing in the NCAA men’s basketball tournament was associated with a 35% increase in alumni donations for public schools, but no statistically significant donation change for private schools. (Baade & Sundberg 1996).
Tucker (2004) found that a successful football team has a significant impact on alumni donations, but found no statistically significant impact of basketball success.
For public universities, earning a bowl bid in football is associated with higher restricted donations of more than $1.1 million (or about 12% more than the average amount of restricted donations at that university). Similarly, an appearance in the NCAA men’s basketball tournament raises restricted gifts by about $825,000 or 8%. (Humphreys & Mondello, 2007).
Athletic giving at the University of Oregon during its initial run of successful football (1994-2002) increased dramatically (Stinson & Howard 2004). Donors who gave to both athletics and academics (at three D1 institutions) gave more in total than athletics-only donors, have higher retention (in terms of continual giving over long periods of time), but give less to athletics than athletics-only donors.
While more donations to universities playing DI college football come from alumni, the amount donated by non-alumni is almost twice as high per person as donations from alumni. (Stinson & Howard 2007) Athletic success shows substantial impacts on giving to athletics. Much of the growth is from additional new donors joining the ranks of donors, not as much by existing donors donating more money. Schools with higher academic rankings (according to U.S. News and World Reports) are less susceptible to the effect of athletic success or failure to donations; the donation effect of athletics is greater at schools below the top academic tier.
Finding 4: Media Impact of Athletics
Media coverage of a university is impacted by athletics
- WKU: 90% of articles written about it were on athletics.
- Northwestern: 70% of articles written about it were on athletics and articles about Northwestern University jumped 185% during its 1995 successful football season leading to the Rose Bowl (in comparison to the prior three-year average).
- 58 universities with FBS football: 87% of New York Times articles were on athletics while among 16 universities without FBS football, 38% of New York Times articles were on athletics.
- St. Mary’s College: Sweet 16 appearance in 2010 garnered $9.3 million in free media coverage, reaching over 12 million people.
| Executive Summary: Page v |
Key Findings from UAB-Specific Primary Research Project 1: Economic Analysis of Financials of UAB Athletics Shows the Cancelled Sports Would Have Generated Positive Net Cash Our analysis found that the standard UAB Athletic Department accounting suffers from many of the common problems endemic to the accounting standards commonly used within college athletics, especially related-party transactions. That is, while the reporting may meet all relevant accounting standards, systematic issues in those standards tend to bias expenses (generally upward) and bias revenues (generally downward). This results in accounting losses that do not appear to have a basis in economic fact and with the net tendency to understate profits1/surpluses of revenues over expenses. Our work found reason to question and adjust the listed value of the following categories to reach a more accurate economic answer. The direction of the arrows shows the impact of our adjustment on the surplus (up arrow means we adjust the surplus upward, down arrow downward):
Contributions from UABEF (revenue ↓; surplus ↓) NCAA/Conference/Tournament Revenues (revenue ↑; surplus ↑) Royalties for Licensed Apparel (revenue ↑; surplus ↑) Athletic Student Aid (expense ↓; surplus ↑) Coaching Salaries & Benefits (expense ↓; surplus ↑) Administrative Salaries & Benefits (expense ↑; surplus ↓) Team Travel (expense ↓; surplus ↑) Fund Raising, Marketing, & Promotion (expense ↑; surplus ↓) Spirit Groups (expense ↓; surplus ↑) Medical Expenses (expense ↑; surplus ↓) Coaching Transition Payments (expense ↓; surplus ↑)
In several cases, we found reason to believe revenues were overstated and expenses understated, but these were more than offset by keys spots in which large expense items were overstated and major revenue assumptions were understated. Once adjusted for, we find Women’s Bowling was likely cash positive in 2013-14, and that Football and Rifle likely generated a mild loss. On net, the estimated cash impact from these three sports was slightly negative (around $25,000). Given the uncertainty of our (generally conservative) assumptions, we suggest treating this as effectively being a break-even result. However, future ticket and playoff revenues will likely be more than sufficient to cover the future anticipated costs of Cost-of-Attendance (COA) stipends and increased food allowances for athletes, and still generate an estimated $435,000 annual surplus.2 This positive surplus is prior to
1 It is worth noting that both UAB as a whole and UAB Athletics are non-profit organizations. Some dislike the word profit used in this context. We want to be clear that we think of profit in this context as an excess of cash inflows over cash outflows, and we are comfortable with using the word this way. We also use surplus, or surplus of revenues over expenses, as a synonym. All of these terms are meant to describe a positive economic outcome that generates more value than it costs.
2 In Appendix III we also estimate an upside surplus (under less conservative assumptions) of $2 million.
| Executive Summary: Page vi |
accounting for the more difficult-to-quantify benefits that likely will result in further increases to surplus, such as increased merchandise sales, increased non-athlete enrollment, improved undergraduate academic quality, or possible increases in donations to the university in general. Driving much of these adjustments is the true economic impact of Grants-in-Aid (GIAs) – that is the actual net cost of athletic scholarships. We find that the true cost of the tuition portion of scholarships is effectively nil, and that the cost of the board and books components are likely somewhat overstated. We find less of an issue with the cost of the room component, but to the extent UAB does not fill its new dorms to capacity, a further downward adjustment in costs should be made. Based on this review, we conservatively adjust the true cost of GIAs downward by 65% ($1,846,979). Another major component of our adjustments focuses on the revenue and expense benefits of membership in Conference USA (C-USA). Our understanding is that without football, the likelihood of remaining in C-USA is effectively nil.3 Across several categories of revenue and expense, we estimate UAB will, on balance, lose over $3 million in cash (annually) if the school is forced to leave Conference USA as a consequence of terminating the football program. We further estimate the greater travel distances involved in UAB’s new conference may result in an increase in travel expenses for the men’s and women’s basketball program of approximately $320,000. To the extent other sports also see increased expenses, that total could exceed $1 million. Combined, the loss of conference revenue from C-USA and the likely increase in travel expenses is large enough to wipe out all potential savings from ending the three sports programs, once net scholarship costs are properly accounted for. The question of C-USA membership is thus the most critical pivot point for deciding whether UAB’s financial health is maximized with or without football. Even joining a well-respected non-football conference will not come close to fully mitigating these losses. On the flip-side, among our adjustments that have the effect of lowering surplus, the most important appears to be donations from the UAB Educational Foundation (UABEF) to the Athletic Department. Based on our understanding of the discretionary nature of those funds (i.e., we understand these are not donations that hinge on keeping football), our analysis incorporates a reduction in football donations of approximately $620,000. We’ve also adjusted football expenses upward (and surplus downward) by another $725,000 to account for items on UAB’s books that appear to be driven, at least in part, by football but are assigned to the category of “not allocated by sport or gender” (“NABSOG”). These include tutoring, marketing, and medical expenses. Despite these upward adjustments to expenses (and hence downward adjustments to profits/surplus), we still find the three sports would have, and would likely continue to have, a positive impact on the net financial position of UAB had they not been terminated. And of course, the one-time costs of termination (in the millions) would also have been avoided. Thus, we identify over $1.3 million in adjustments that potentially reduce football revenues or increase football expenses. Nevertheless, our financial review boils down to three key facts:
3 “Conference USA has communicated to UAB that the league won't amend its bylaws to keep the Blazers without football, according to sources familiar with the discussions.” http://www.cbssports.com/collegefootball/writer/jon-solomon/25167509/sources-c-usa-wont-change-bylaws-to-keep-uab-without-football

| Executive Summary: Page vii |
Athletic Scholarships cost UAB far less than their listed prices.
Conference USA membership is far superior, financially, to any alternative non-FBS conference. C-USA membership very likely hinges on UAB fielding an FBS football team.
Future CFP revenues will outpace new expense categories like unlimited food and COA stipends. In order to continue receiving these revenues at current levels, UAB must field an FBS football team.
It is easy for a self-sufficient business to look like a money loser when major expense items are over-valued and major revenue drivers are ignored. UAB’s accounting overstates the cost of providing scholarships and does not capture the critical tie between important sources of revenue and sponsorship of an FBS football team. Because of the causal link between FBS and revenue, the university will be worse off, on a pure dollars and cents basis, without these three sports than with them, even after accounting for offsetting downward effects. Based on this analysis, we find the decision to terminate football, bowling, and rifle was ill advised from a net cash-flow perspective. It is also important (though somewhat beyond the scope of this report) to ask why a university sponsors Athletics at all, or any particular sport. While we show here that football, bowling, and rifle would have had (and if restored, will likely to continue to have) a net positive impact on the bottom line, even if that were not the case, it might make sense for the school to incur a manageable deficit to bring football, bowling and rifle to the campus simply for their contribution to the total UAB experience. Schools host money-losing concerts, sponsor money-losing intramurals, run money-losing academic departments, etc. All of this is done with an eye to using the resources of the university to create the desired college experience, a blend of academics, social activities, athletic activities, and much more. Often, the literature on college sports economics lumps these intangibles into a study of more-difficult-to-quantify (but still financial) benefits, such as improved enrollment, increased tuition, or higher sales of merchandise. We take up these sorts of beyond-the-bottom-line benefits in Project 2 below. But it is also worth pausing to ask, if all of the pluses and minuses were tallied up precisely and UAB showed a small deficit from the three sports in question (which it would not), would that be the sort of cost worth incurring to provide the simple fun element of a campus with FBS football and the benefits such a campus provides to students and the broader community. Although an important philosophical question, it is one we can defer for another day because our analysis shows that on balance the sports in question effectively break even and would have shown a future surplus of revenues over costs that would help UAB’s overall bottom line. And as we show immediately below, in Project 2, consideration of the less concrete financial benefits only strengthens this conclusion.
| Executive Summary: Page viii |
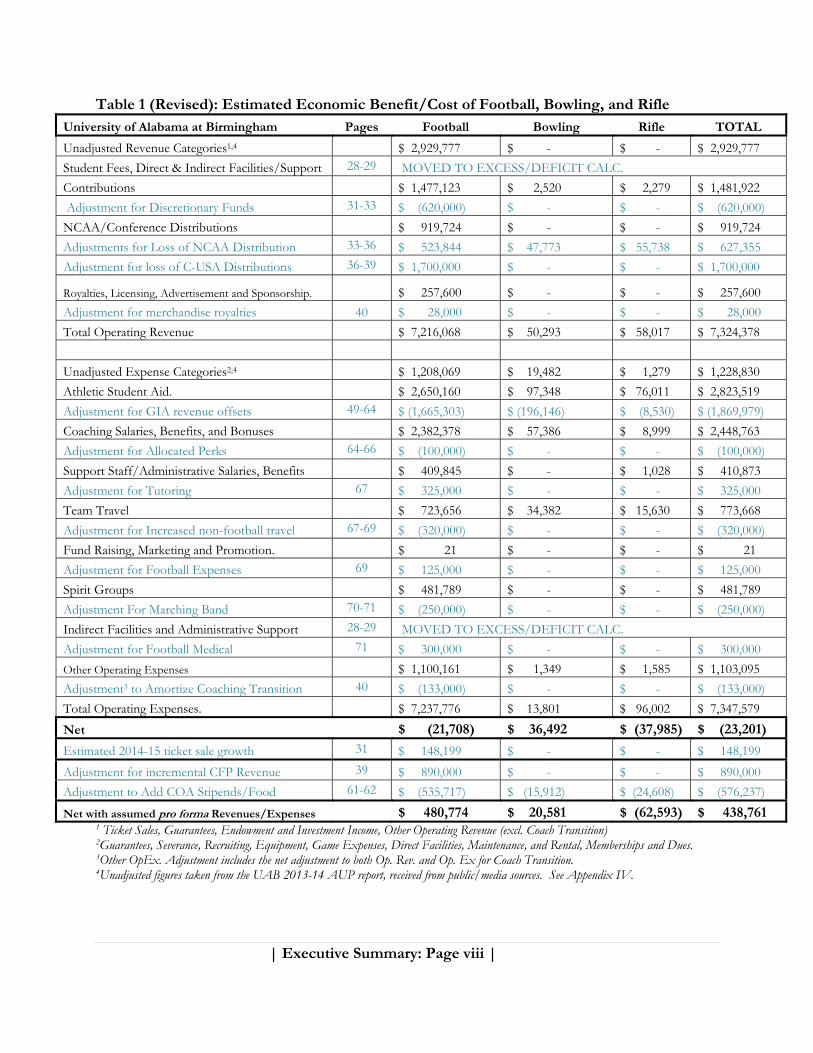
Table 1 (Revised): Estimated Economic Benefit/Cost of Football, Bowling, and Rifle University of Alabama at Birmingham Pages Football Bowling Rifle TOTAL
Unadjusted Revenue Categories1,4 $ 2,929,777 $ - $ - $ 2,929,777
Student Fees, Direct & Indirect Facilities/Support 28-29 MOVED TO EXCESS/DEFICIT CALC.
Contributions $ 1,477,123 $ 2,520 $ 2,279 $ 1,481,922
Adjustment for Discretionary Funds 31-33 $ (620,000) $ - $ - $ (620,000)
NCAA/Conference Distributions $ 919,724 $ - $ - $ 919,724
Adjustments for Loss of NCAA Distribution 33-36 $ 523,844 $ 47,773 $ 55,738 $ 627,355
Adjustment for loss of C-USA Distributions 36-39 $ 1,700,000 $ - $ - $ 1,700,000
Royalties, Licensing, Advertisement and Sponsorship. $ 257,600 $ - $ - $ 257,600
Adjustment for merchandise royalties 40 $ 28,000 $ - $ - $ 28,000
Total Operating Revenue $ 7,216,068 $ 50,293 $ 58,017 $ 7,324,378
Unadjusted Expense Categories2,4 $ 1,208,069 $ 19,482 $ 1,279 $ 1,228,830
Athletic Student Aid. $ 2,650,160 $ 97,348 $ 76,011 $ 2,823,519
Adjustment for GIA revenue offsets 49-64 $ (1,665,303) $ (196,146) $ (8,530) $ (1,869,979)
Coaching Salaries, Benefits, and Bonuses $ 2,382,378 $ 57,386 $ 8,999 $ 2,448,763
Adjustment for Allocated Perks 64-66 $ (100,000) $ - $ - $ (100,000)
Support Staff/Administrative Salaries, Benefits $ 409,845 $ - $ 1,028 $ 410,873
Adjustment for Tutoring 67 $ 325,000 $ - $ - $ 325,000
Team Travel $ 723,656 $ 34,382 $ 15,630 $ 773,668
Adjustment for Increased non-football travel 67-69 $ (320,000) $ - $ - $ (320,000)
Fund Raising, Marketing and Promotion. $ 21 $ - $ - $ 21
Adjustment for Football Expenses 69 $ 125,000 $ - $ - $ 125,000
Spirit Groups $ 481,789 $ - $ - $ 481,789
Adjustment For Marching Band 70-71 $ (250,000) $ - $ - $ (250,000)
Indirect Facilities and Administrative Support 28-29 MOVED TO EXCESS/DEFICIT CALC.
Adjustment for Football Medical 71 $ 300,000 $ - $ - $ 300,000
Other Operating Expenses $ 1,100,161 $ 1,349 $ 1,585 $ 1,103,095
Adjustment3 to Amortize Coaching Transition 40 $ (133,000) $ - $ - $ (133,000)
Total Operating Expenses. $ 7,237,776 $ 13,801 $ 96,002 $ 7,347,579
Net $ (21,708) $ 36,492 $ (37,985) $ (23,201)
Estimated 2014-15 ticket sale growth 31 $ 148,199 $ - $ - $ 148,199
Adjustment for incremental CFP Revenue 39 $ 890,000 $ - $ - $ 890,000
Adjustment to Add COA Stipends/Food 61-62 $ (535,717) $ (15,912) $ (24,608) $ (576,237)
Net with assumed pro forma Revenues/Expenses $ 480,774 $ 20,581 $ (62,593) $ 438,761 1 Ticket Sales, Guarantees, Endowment and Investment Income, Other Operating Revenue (excl. Coach Transition) 2Guarantees, Severance, Recruiting, Equipment, Game Expenses, Direct Facilities, Maintenance, and Rental, Memberships and Dues. 3Other OpEx. Adjustment includes the net adjustment to both Op. Rev. and Op. Ex for Coach Transition. 4Unadjusted figures taken from the UAB 2013-14 AUP report, received from public/media sources. See Appendix IV.
| Executive Summary: Page ix |
Project 2: More Difficult to Quantity Effects The economic literature presents strong evidence of the positive economic spillover effects of a vibrant athletic department onto the campus as a whole. In some cases, these effects are quantifiable, but require access to university personnel and a willingness to undertake the investigation. Determining what portion of bookstore apparel sales are driven by football is an example of such an effect; it’s clear it happens and it has positive economic effect on University finances,4 but the process of breaking these revenues out of a bookstore profit and loss statement will require deep inside-the-university access that we no longer have since our project was terminated. Beyond these direct sports-related revenues that are simply parked off the Athletic Department’s books, there are also academic benefits to having a sports program. These include all of the university-wide advertising effects generated by sports such as the potential for increased donations to the university, increases in both the quantity of applications and enrolled students, and improved changes in the quality of the incoming freshman class (either due to better applicants or more to choose from). It seems clear that UAB agrees that some of these potential benefits exists, which likely explains why the University took great pains to say that it plans to re-focus the same level of resources on the remaining sports within the athletic program when it announced the termination of football, bowling and rifle.5 However, just as no one on the outside of UAB can easily know what portion of merchandise sold in the bookstore consists of apparel purchases driven by football, neither can an outsider easily know how many incoming freshmen chose UAB over their second choice because of the presence of any of the cancelled sports. Had we continued our work with the university, we had a specific plan to estimate these benefits. In lieu of that, we lay out areas of potential impact, explain the expected value predicted by the economic literature, and then present future research projects designed to flesh these topics out. It is important to emphasize that these predicted benefits are above and beyond the cash-flow analyses presented in Project 1 – meaning that to the extent these prove substantial, they are “gravy” on top of what appears to be an already break-even (or somewhat better than break-even) scenario, providing additional surplus to UAB. Thus, while the estimates here are uncertain, simply to the extent they exist, they tip the balance of the decision further in favor of restoration of the three sports in question.
4 As discussed below, we estimate that UAB may receive 15% of all bookstore sales, on top of the listed licensing money it receives from apparel manufacturers.
5 The Carr Report assumed the savings would all be reinvested: “Carr’s report to UAB in November uses the same projected subsidy numbers with and without football.” UAB vice president for financial affairs and administrator Allen Bolton told Jon Solomon of CBS Sports: “… this decision wasn’t about finding cost savings or cutting costs to break even. … This is about investing and reinvesting in sustained excellence, and cultivating programs where we can win.” http://www.cbssports.com/collegefootball/writer/jon-solomon/24913760/death-of-uab-football-anger-remains-but-study-banks-on-healing
| Executive Summary: Page x |
Difficult to Quantify “Sports” Effects As best we can tell, the bookstore no longer sells football-specific apparel, but most other sports are well represented. It is our assumption that prior to the termination of the football program, such products were likely available, and that in the event of the restoration of football, they would return. Similarly, many fans specifically purchase university logoed products to show support for football without the word football appearing on the product. To the extent such sales would occur and not be credited to the football team specifically, these would count as difficult to quantify, but real, revenues driven by football. To the extent they decline in the absence of football they should be included as a cost of termination.
Difficult to Quantify Academic Financial and Non-Financial Effects While no data are available for analysis of UAB-specific results, the economic literature provides models for making estimates. For example, McCormick and Tinsley (1987) note that SAT scores are about 3% higher in schools in Division I, all else equal. Mulholland et al. (2014) show that simply playing Division I football is associated with a higher ranking in peer assessments by other university administrators that is very large and “a willingness to invest in big-time football of the visibility that comes along with it affects the assessment of those completing” the U.S. News and World Report forms for peer assessment. Conference USA’s footprint is well tailored to UAB’s use of sports as a tool to drive out-of-state enrollment. UAB draws most out-of-state students from the adjacent states of Georgia, Mississippi, Florida, and Tennessee, followed by Texas and Louisiana,6 five out of six of which are C-USA states. Switching to a geographically less well-suited conference may result in a less relevant advertising effect, as away games target (say) Iowa high-schoolers rather than potential applicants in adjacent southern states for whom UAB may be a more realistic consideration for their choice of college.
Project 3: Effects of Athletics on University Media Coverage
Football is a key driver of media coverage of UAB. Across over 100,000 articles spanning 2013-2014 (all prior to the announcement of the decision to cancel football) that contained the word UAB, Google News found that some 47% contained the word football, with 21% containing the exact phrase “UAB football”—more than double the coverage of other keywords such as business school, campus, faculty, medical school, and student. Basketball showed slightly lower levels of popularity: 44% contained the word basketball. UAB football also received prominent viewership in select televised games including UAB’s game at
LSU on September 7th, 2013 which drew 659,000 viewers on ESPNU.7
6 UAB, Facts & Figures. Available at https://www.uab.edu/institutionaleffectiveness/images/factbook/factsfigures.pdf
7 Sports Media Watch. “College Football TV Ratings”. bit.ly/1ao4XLU. Accessed 4/13/2015.

| Executive Summary: Page xi |
Project 4: Looking Forward: Keeping Football, Bowling, and Rifle Financially Healthy As shown above, the straight financial accounting approach focused solely on the standard entries for the athletic department, tends to miss major cash impacts on the University as whole. While these omitted impacts go in both directions, the net effect was to understate the three sports’ net positive impact by approximately $3.7 million dollars for 2013-14: Table 2 (Revised): Estimated Benefits (Costs) 8 of Cancelling Football, Bowling, and Rifle Not Captured by Athletic Department Accounting9
Adjustment Page Football Bowling Rifle TOTAL
Regained Discretionary Funds 31-33 $620,000 $0 $0 $620,000
Loss of NCAA Distribution 33-36 ($523,844) ($47,773) ($55,738) ($627,355)
Loss of C-USA Distributions 36-39 ($1,700,000) $0 $0 ($1,700,000)
Adjustment for Merchandise Royalties 40 ($28,000) $0 $0 ($28,000)
Loss of GIA Revenue Offsets 46-64 ($1,665,303) ($196,146) ($8,530) ($1,869,979)
Lost Coverage of Fixed Benefits Costs 65-67 ($100,000) $0 $0 ($100,000)
Adjustment for Tutoring 67 $325,000 $0 $0 $325,000
Increase in Cost of Non-football Travel 68-70 ($320,000) $0 $0 ($320,000)
Reduced Expenses from Marketing 70 $125,000 $0 $0 $125,000
Ongoing Cost of Marching Band 70-71 ($250,000) $0 $0 ($250,000)
Reduced Expenses from Medical 71 $300,000 $0 $0 $300,000
Coaching Transition Amortization 40 ($133,000) $0 $0 ($133,000)Net Losses to UAB from Cancelling FB/Bowling/Rifle not Captured by Athletic Department Accounting
($3,350,147) ($243,919) ($64,268) ($3,658,334)
From this base we then project into the future by creating a pro forma version of the base model that takes into account anticipated new revenues and expenses. The two biggest drivers of future deficits per UAB’s previous analysis of football were projections of flat conference revenues and of rapidly increasing scholarships costs. In our view, these key drivers of projected future losses were both misstatements of the true economic impact of an ongoing football program. College football revenues, especially those driven by new television playoff money are unlikely to remain flat over the next five years. The UAB projection understated the first year’s playoff benefit by more than $300,000.
8 This table only summarizes the ongoing costs. It does not include the one-time costs such as termination fees, paying coaches not to coach, administrators not to administrate, or any fees for consultants, public relations, armed guards, etc.
9 By “Not Captured by Athletic Department Accounting” we mean that these future net losses are items that won’t show up if one limits one’s focus to a narrow analysis of the three sports’ accounting numbers on the Athletic Department’s books rather than focusing on impacts to UAB as a whole. This is the money you won’t find on the AUP.
| Executive Summary: Page xii |
As for the listed scholarships costs on UAB’s AUP, they are not costs at all; instead they are prices based on what a full-paying customer pays, not what it costs the school to provide education. In a university without enrollment constraints, a tuition price increase for an athlete on full scholarship has zero impact on true costs of providing the tuition portion of that scholarship, unless that price is itself a reflection of increased costs of education. For an athlete on partial scholarship or for a walk-on drawn to the school for sports, that same tuition price increase is a benefit to the school, not a cost. Analyses of college sports finances often confuse price with cost; UAB’s projections appear to have treated anticipated increase in prices as increases in costs. Tuition increases (even to athletes offered a substantial discount) have net benefits to the university. This should not surprise anyone: just like any firm that can raise prices faster than costs without lowering quantity demanded, UAB will increase profit as it raises prices, all else equal. The fact that colleges have convinced the public that raising their prices to students somehow hurts their bottom line is a wonderful little magic trick, but a savvy analyst should know better, especially for a university with growth targets. Thus, in the coming years, we foresee the positive surplus from the three sports in question growing (on a UAB-wide level after adjusting for both increased football playoff revenue and increased expenses from COA stipends and unlimited food allowances). Historically, the revenues from sports have grown faster than the costs associated with COA items like incidental living expenses or food. Beyond this, there is little reason to foresee growth in other true costs rising faster than anticipated growth in revenue. There also exists actual historic data to assess the likely success of a plan to cancel football in order to strengthen the rest of the athletic department or the university as a whole. In a study of the twenty-one Division I programs since 1985-86 that have cancelled football (but stayed in Division I), we see no evidence of improved academic performance or increased enrollment, and some evidence that basketball performance has declined relative to those same schools’ standing prior to cancelling football. When the quantifiable benefits of the sports in question are taken into account, the overall health of UAB as a whole is likely stronger with football, bowling, and rifle than without. This is because, though cutting the sports in question lowers costs, it also lowers revenues and the net result is negative to the University. This makes it a simple decision to keep football even without fully undertaking the steps needed to value the various hard-to-quantify effects such as the advertising benefits of being an FBS school. Moreover, if UAB needs to add an additional women’s sport to meet Title IX obligations, we propose relatively low cost (or cost-neutral) ways to add an additional women’s sport while improving compliance with the “financial proportionality” rules of Title IX. To the extent the university also decides to invest in capital improvements for the sake of the three sports in question, this surplus can cover some, but likely not all, of the debt service involved. Thus, on a going-forward basis, while we envision the university’s financial health to be stronger with football than without, we recommend a fund-raising goal of $1.2 million per year. This money would likely cover all of the costs of capital improvements not covered by the anticipated surpluses from the sports; alternatively, if the school is willing to match private contributions to debt service, the remainder of the community-raised funds could be allocated for COA stipends and unlimited food for the three sports. This would serve as additional “Contributions” revenue that would allow the university to reap greater profit from football, bowling, and rifle.
| Executive Summary: Page xiii |
In essence, by providing more community funding (contingent on football resuming), the fan base increases the economic benefits to UAB from having a football team and also makes the accounting of those benefits more clearly positive; this makes it harder to confuse accounting and economic profits. The recent UC-Berkeley experience provides a blueprint for how a university determined to cut sports can be persuaded of community interest through sufficient fund-raising efforts. Such efforts will likely result in a modest return on the community investment. We present a preliminary, conservative estimate of the Economic Impact of football on Birmingham as part of Project 4. While that impact is not measured in the billions, it is clear that the presence of football and any resulting increase in overall enrollment will have a substantial, positive impact on the City as a whole. We very conservatively estimate the annual economic benefits to Birmingham at $1.5 million or more.

| Page 1 |
II. Introduction
Scope of Study Originally, the authors proposed to UAB to undertake a study that would “(1) benchmark relevant data against select peer institutions to determine the viability and necessary resources to offer/reinstate the football, bowling, and rifle programs; (2) report any additional reasonably quantifiable projections that should be incorporated in future decisions regarding sports sponsorship and associated operational concerns; and (3) incorporate any qualitative analysis of the relationship between these sports and the greater university.” Part (3) would have likely included analysis of intangible consequences of the decision including the impact of changes in the athletic department’s offering on the revenues and costs of other departments of the university, as well as the more tangible financial impact of changes in conference affiliation on revenue and costs to UAB as a whole. This report seeks to perform a somewhat truncated version of the study originally proposed, relying on publicly available data and raising key questions for making a viable decision. As originally envisioned, those questions would have been answered, in part or in whole, through research into UAB proprietary data and discussion with UAB decision-makers. Instead, this report can only point to the need for those further steps, and lay out the broad contours of the likely outcomes. One result of the interrupted and partial funding of this project is that many anticipated projects remain “TBD” for future research. In these cases, reasonable assumptions have been made. Where possible, we have highlighted what we see as the best research strategy for addressing the information gap and replacing the assumptions with empirical results. We have also summarized the key assumptions made throughout the report in tabular form, presented in Appendix II. When there was some doubt as to the possible range of assumed values, we have tried to err on the side of conservatism. The result is that our estimate likely understates the value of the three sports in question. To provide some sense of the high-end potential of the sports in question, we have also provided a more aggressive set of estimates in Appendix III where we look at much more favorable assumptions and measure the impact on the bottom line. As will be seen, the football program has considerable upside above our conservative estimate of a mild profit once new revenues and costs are accounted for.
| Page 2 |
III. Review of Literature The review of the literature that follows is based heavily on a similar section written by one of this study’s authors (Dr. Rascher) in conjunction with Professor Jeremy Howell. We re-use those portions with permission of Dr. Howell and Dr. Rascher, and then extend and update the findings based on more recent literature. College Athletics Programs Accounting Methods are Not Aimed at Answering University-wide Economic/Financial Questions regarding Sport Viability The most commonly cited financial figures related to college athletics come from the process through which the NCAA collects data for Title IX compliance. These data, submitted via the NCAA Membership Financial Reporting System and collated inter alia for submission pursuant to the EADA, also appear to form the basis of the Revenues and Expenses of NCAA Division I Intercollegiate Athletics Programs,10 and subsequently serves as the basis for analyses by media outlets such as USA Today and ESPN through the Freedom of Information Act (FOIA) process. Outside groups, such as the Knight Commission and Drake Group, also rely on these reported figures. A commonly cited result of this analysis is that only 18 - 23 athletics programs in the FBS reported positive net revenues during the 2004 - 2013 fiscal years.11 Despite this, these same data also show that in all three subdivisions, total athletic expenditures as a percentage of total institutional expenditures have remained constant at approximately 5% for several years while net deficits, rather than total expenses, are approximately 1% in the FBS and 4% in the other two subdivisions of Division I.12 These EADA data are not designed to reflect accurately the economic costs/benefits of athletic programs to institutions; when they do so, it is only a happy coincidence of factors. The NCAA itself recognizes that what makes sense for the purpose of measuring compliance with Title IX may not make sense for other analytical purposes and so in the Revenues and Expenses of NCAA Division I Intercollegiate Athletics Programs report by Prof. Daniel Fulks, the NCAA makes downward adjustments to revenue, on the theory that by doing so, those downward adjustments better capture the stand-alone cost of an Athletic Department without what they consider a “subsidy”13 from student fees, and direct and indirect institutional support.
10 https://www.ncaapublications.com/p-4344-division-i-revenues-and-expenses-2004-2013.aspx
11 http://www.ncaapublications.com/productdownloads/D1REVEXP2013.pdf, page 28.
12 Fulks, Daniel L., NCAA Division I Intercollegiate Athletics Programs Report: Revenues & Expenses 2004-2009, 2010, p. 8, bit.ly/1g2cewI, accessed 4/15/2015.
13 We use the word “subsidy” in quotation marks because these line items are better thought of as transfer payments by the university for sports. In some cases, such as student fees, the payment may simply be a season ticket purchase, or priority in a ticket lottery. This would turn a “subsidy” into ticket revenue. In other cases, such as the institutional support categories, the payment may represent an estimate of some or all of the off-the-books benefits the athletic department provides the university and so this “subsidy” would represent real outside revenue streams that are driven by athletics being transferred back to athletics for accounting purposes. We would encourage media sources to discontinue the use of “subsidy” without determining whether those transfers actually represent a payment beyond the value of athletics. A more neutral approach would be to refer to these accounting entries as transfer payments, leaving the question of how much is

| Page 3 |
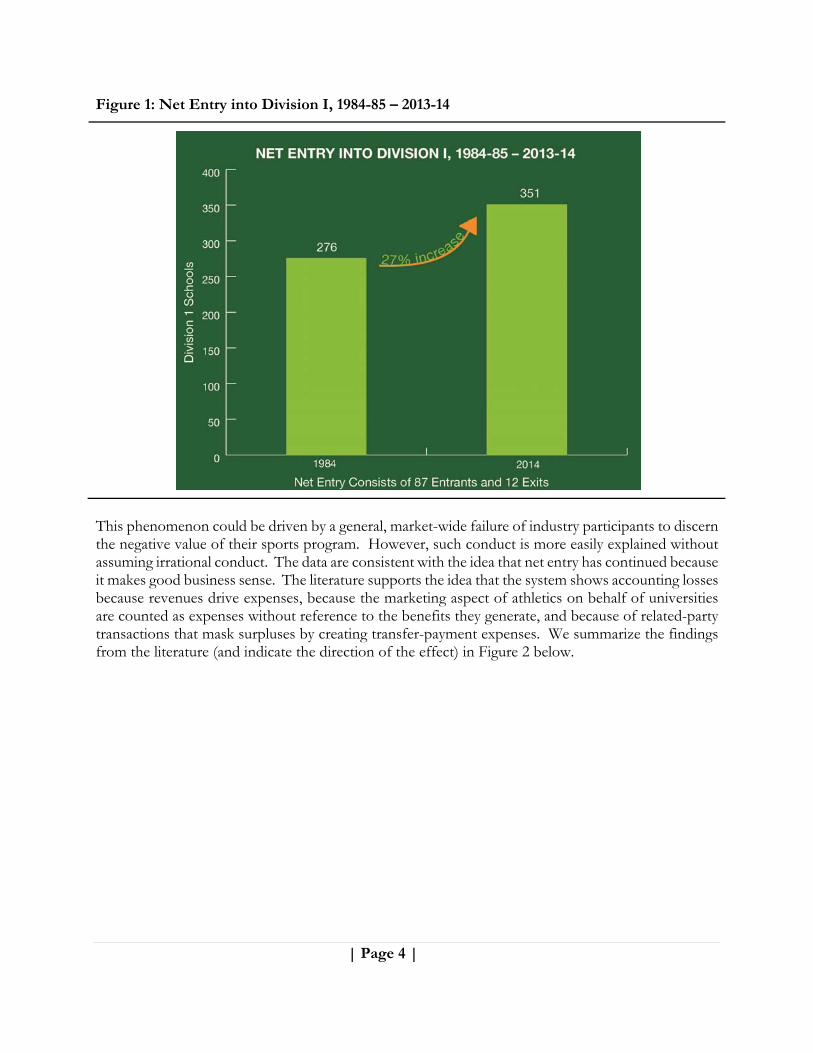
The NCAA’s efforts have improved the consistency of reporting from their member institutions and the quality of financial data related to intercollegiate athletes. However, as with the Title IX figures, while the NCAA’s approach may make perfect sense for its own internal analyses, a different approach is needed to analyze the true financial costs and benefits of athletics at NCAA universities. Reliance on these accounting data as if they were accurate measures of economic impact is akin to relying on accounting “book value” to represent the market value of a company. As with book value, the accounting figures used in the NCAA’s “Agreed Upon Procedures” reports make sense in context, but they provide a very poor estimate of the value of the revenue generation of a business. There are a number of reasons for this. First, the nature of budget-based accounting with simple line items can be misleading if details of each line item are not known. Second, athletics departments operate within non-profit universities, thus there is less of an incentive (and mechanism) to show a profit. In fact, there are no equity holders watching over revenues and expenses in order to produce profits and dividend payments. Thus, this can often lead to a use it or lose it budget management process, where a school will incur whatever deficit the school has approved. Third, on a university campus there are often significant related-party transactions (RPTs) and cross-subsidies. These mask the true underlying economics of athletics departments. As shown in Figure 1 below, there are many possible instances when the revenues listed in an Athletic Department’s budget are under-valued compared to their true impact and expenses are over-valued. That is, not only do the accounting figures diverge from the economic reality, they do so in a way that tends to obscure the surplus of revenues over expenses in a systematic way – that is, profits consistently look lower than they really are. This conclusion that revenues grow and then provide the ability for schools to spend more (rather than being spending required to generate the revenues) is also consistent with market conduct. In a money-losing industry, it is rare to see strong, consistent, positive net entry, where the number of firms joining far exceeds the number of firms leaving. However, this is exactly the case in Division I sports. Net entry into both Division 1 and FBS has risen steadily since 1984. Demand to enter has been so strong that the NCAA has twice since 2000 prohibited all entry (from 2001-02 through 2002-2003 and 2007-08 through 2010-11, all new entry into Division I and FBS was suspended). Immediately thereafter, new entry resumed its steady pace. Schools are clamoring to get into DI and FBS.
subsidy and how much is simply “repatriating” sports-driven money to more in-depth analyses that drill deeper than the initial accounting statements. Calling them “subsidies” may be easy, but it may also be wrong.
| Page 4 |
Figure 1: Net Entry into Division I, 1984-85 – 2013-14
This phenomenon could be driven by a general, market-wide failure of industry participants to discern the negative value of their sports program. However, such conduct is more easily explained without assuming irrational conduct. The data are consistent with the idea that net entry has continued because it makes good business sense. The literature supports the idea that the system shows accounting losses because revenues drive expenses, because the marketing aspect of athletics on behalf of universities are counted as expenses without reference to the benefits they generate, and because of related-party transactions that mask surpluses by creating transfer-payment expenses. We summarize the findings from the literature (and indicate the direction of the effect) in Figure 2 below.
| Page 5 |
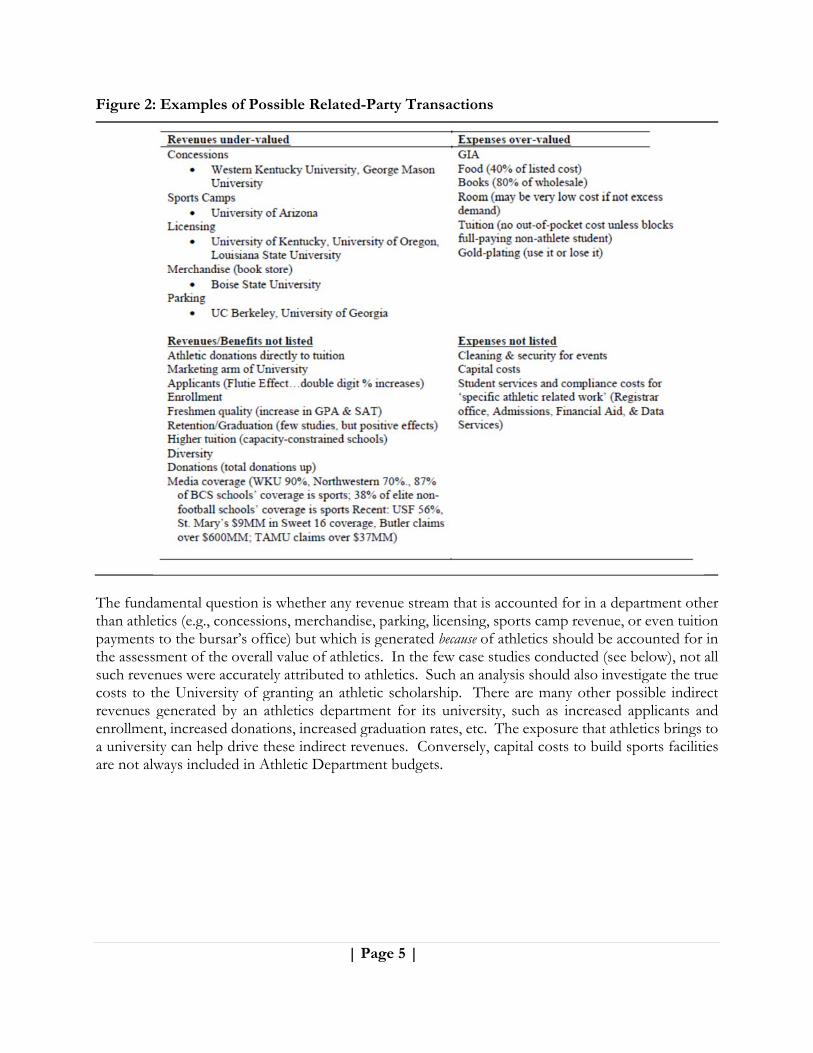
Figure 2: Examples of Possible Related-Party Transactions
The fundamental question is whether any revenue stream that is accounted for in a department other than athletics (e.g., concessions, merchandise, parking, licensing, sports camp revenue, or even tuition payments to the bursar’s office) but which is generated because of athletics should be accounted for in the assessment of the overall value of athletics. In the few case studies conducted (see below), not all such revenues were accurately attributed to athletics. Such an analysis should also investigate the true costs to the University of granting an athletic scholarship. There are many other possible indirect revenues generated by an athletics department for its university, such as increased applicants and enrollment, increased donations, increased graduation rates, etc. The exposure that athletics brings to a university can help drive these indirect revenues. Conversely, capital costs to build sports facilities are not always included in Athletic Department budgets.
| Page 6 |
A case study conducted nearly two decades ago is one of the few analyses that has directly looked at the costs and benefits of intercollegiate athletics for a single university. Borland, Goff and Pulsinelli (1992) investigated athletics at Western Kentucky University (WKU) because the school was considering major changes to its athletics department. Their paper takes an economic look at the accounting and budgeting practices at the university and finds that the many and significant related-party transactions between university departments mask the true underlying economic values and costs of the athletics department. As an example, concessions revenues collected at intercollegiate athletics events may be accounted for on the books of the food services department instead of the source of their cause, an athletics event. Similarly on the expense side, the cost to Western Kentucky of providing food to the athletes on scholarship was about 40% of the retail price that the athletics department was charged as part of the Grant-in-Aid (GIA),14 but athletics received no credit for the portion of the price that represented profit.15 The largest such related party transaction at WKU was the tuition expense charged against the athletics department’s budget. WKU was not at full capacity, so allowing one more athlete on scholarship did not truly cost the university the full tuition, but rather closer to zero in out-of-pocket costs. Only if this scholarship athlete somehow prevented a full paying student from attending would there be a true cost (or if it forced the university to hire an additional professor, for instance). In the end, the WKU study showed that what appeared to be a $1.5 million loss to WKU from having athletics was only a $330,000 loss when adjusting for the related-party transactions and actually a gain of over $5 million when accounting for the enrollment impact of athletics. Goff (2000) notes that negative exposure, like NCAA sanctions has a negative effect on the school’s brand, but of smaller magnitude than positive exposure. He argues that large losses at big-time programs are muddled by the non-profit status of universities and related accounting practices. He also notes that universities are clamoring to join D1, that athletics department revenues are above $100 million per year for some schools, and the fact that they don’t remunerate the athletes at anything near a likely market rate points towards profitability. Specifically, he shows that 70% of universities in major conferences have revenues greater than expenses. For smaller schools, there may be a loss, but it is small (compared with the gains for the 70% making money). Utah State University reported a loss of $700,000 per year in the late 1980s, but was shown to actually have a gain of $366,000 (before accounting for merchandise sales attributable to athletics) once the related-party transactions were accounted for. Citing Sheehan (1996), Goff makes adjustments to that data and shows that only 10% of the 109 schools in the study (FBS) lost money, with most of those being from the Mid-American Conference.
14 Grant-in-Aid is the NCAA term for an athletic scholarship. It is commonly abbreviated as GIA.
15 The opposite can occur in which a cost, for example cleaning a venue after a game, is charged to another department’s budget even though the expense was created by Athletics Department activities.
| Page 7 |
Schwarz (2011) conducted a study of the University of Nebraska, Omaha, which chose to jump from DII to DI in 2011, but while dropping football and wrestling.16 The university claimed that its football program was losing about $1.5 million annually. Yet, it had excess capacity to accept any qualified students who applied. The true economic cost of the football scholarships was much lower than the reported costs. When adjusting for this and other factors, Schwarz found that the university actually broke even from its football and wrestling programs. Howell and Rascher (2011) performed the most in-depth, insider-access athletic department analysis since the Western Kentucky study, focused on the full value of athletics to the University of San Francisco, a Division I school without football.17 The study found that the listed cost of athletic scholarships ($5.3 million) overstated the cost savings from eliminating athletic scholarships by approximately 83% ($2.4 million). The NCAA commissioned a series of studies co-authored by Jonathan and/or Peter Orszag (2003, 2005, 2009). These studies examine a number of issues using 8 to 10 years’ worth of data for FBS. They conclude (a) that athletics spending (including capital expenditures) is a small share of overall university spending, 18 (b) inequality increased in terms of spending across D1-A basketball and football programs, (c) there was substantial change in the mobility of which schools spent more than others over the first decade studied (1993-2003), but less so from 2003-2007, (d) increases in spending were associated with similar increases in revenues, so there was no net gain in revenues19 (e) spending more did not improve winning in the earlier studies, but from 2003-2007 the authors “find a small positive and statistically significant relationship between greater operating expenditure on football and team success,”20 and (f) winning in football or basketball generally does not increase net revenues but that there is a suggestion that “finishing the season in the top 25 is associated with roughly $3 million more in revenue.” Other hypotheses about student quality, donations, and an “arms race” are inconclusive, though in their final update, Orszag and Israel (2009) find that for
16 A blog version of this study is available at http://sportsgeekonomics.tumblr.com/post/45761374835/making-riches-look-like-rags
17 The framework of this report closely follows the Howell & Rascher study and this literature review has its primary foundation in that report, with additions for newly published literature.
18 Per Orszag and Israel (2009): “… despite the changes since 2003, we continue to conclude that operating athletic expenditures represent a relatively small share of total higher education expenditures at Division I-A schools, particularly for those larger schools with at least $1 billion in total institutional expenditures.”
19 Orszag and Israel (2009) found that for “… combined spending on football and basketball, these updated regression results suggest that one extra dollar of spending may lead to slightly more than one extra dollar of revenue,” those authors then conclude that they cannot reject the hypothesis of each dollar in expense being matched by an equal dollar of revenue.
20 Orszag and Israel (2009) conclude the primary expense drivers of increased football success are “recruiting, travel, equipment, and other game-day expenses” and reject the conclusion that spending more on a football coach has a significant effect on winning percentage.

| Page 8 |
“…football/basketball expenditures, a $1 increase in average conference spending is associated with a $0.55 increase at a given school,” which they interpret as indicating an “arms race.” 21 More recently, Hoffer, Humphreys, Lacombe, & Ruseski (2014) revisited this question and found that university “revenue increases are strongly associated with increases in total expenditure and investment in coaching salaries” In terms of the direction of causation, the authors conclude that “The empirical analysis provides strong evidence that athletic departments engage in dynamic nonprice competition: athletic department expenditure varies systematically with expenditure by other conference teams. The results also support the revenue theory of costs in that own revenues22 also explain expenditure.” In other words, expenses go up because revenues rise and provide more money to spend, rather than the expenses needed to generate those revenues actually rising. One such source of new revenues that have helped allow new spending, rather than being driven by new spending is broadcast revenue. Over the last decade, FBS conferences have experienced steady upward climbs in revenue. This growth has extended well beyond the so-called power conferences. For example, Conference USA’s annual broadcast revenue increased from $28 million in 2005-06 to $38 million in 2010-11. More recent broadcast revenues are reportedly higher still, fueled in part by the increased revenue from the revamped football postseason format. Table 3: Estimated Broadcast Revenue among FBS Conferences, 2005-06 – 2010-11
Readers familiar with “Hollywood Accounting” (where results can be manipulated so that actors who receive a share of the net, rather than a share of the gross, often find a hugely successful movie appears to have lost money) may see a parallel.23 This tension between strong market indicia of profit and a tendency for schools to show accounting losses is well explained by work by Brian Goff and Dennis Wilson. In a working paper, they argue:
21 We shy away from this term, which implies that both teams on the field cannot win economically. What is commonly described as an “arms race” looks to us more like standard economic competition in a profitable industry.
22 That is, a team’s own revenues serve as an explanatory variable for the team’s own expenses.
23 For an example, see http://www.theatlantic.com/business/archive/2011/09/how-hollywood-accounting-can-make-a-450-million-movie-unprofitable/245134/ “Most corporations try to make a profit by limiting costs. Movies corporations manage to record a loss by maximizing costs. Only in Hollywood, indeed.” Except it is not just in Hollywood, as the practice pervades college sports.
| Page 9 |
While the accounting practices at many institutions have reflected long-standing idiosyncratic practices not guided by any explicit strategy, more astute university and athletic decision makers have faced a dilemma with regard to whether to establish accounting practices that highlighted the value rents flowing to the school or not. On one side, the realization of these values places pressure on universities in regard to the façade of amateurism and the lack of compensation to players. Keeping awareness of the rent flow low permits either certain athletic or other university officials discretion over use of the flows. As a result, the most common practice over many decades has been to minimize or diminish apparent surpluses. In fact, the supposed losses have been a means for university presidents to pursue “cost containment” measures designed to reduce the ability of athletic departments to spend the rents within their unit.
The relevant question for UAB (and thus for this report), analyzed in great detail below, is to what extent these findings apply to an FBS school like UAB that sits outside the power conferences but still has sources of potential benefits. As we show below, an unquestioning reliance on accounting figures as the sole measure of actual costs and benefits likely misstates the real economic impacts to UAB of the sports in question.
Effect of College Athletics on Student Applications and Enrollment Highly publicized athletic success has generated some very strong anecdotal evidence showing increases in applications following a year of atypical athletic success. According to McEvoy (2006), when Doug Flutie won the Heisman Trophy in 1984, sealing the deal in a memorable performance against the University of Miami, Boston College (his alma mater) saw a 30% increase in applicants the following year. Similarly, Patrick Ewing’s tenure at Georgetown University (where the team made three Final Four appearances in the mid-1980s) coincided with a 45% increase in applicants during that time period (much of it allegedly attributable to the basketball team’s success). Santa Clara may have had an athletics-aided spike in admissions related to the remarkable career of men’s basketball athlete Steve Nash. Nash, who graduated in 1996, led Santa Clara to three NCAA tournament berths, advancing to the second round twice. One of his NCAA Tournament teams defeated #2 Arizona as a #15 seed in perhaps the most heralded single Santa Clara athletics victory of all time. Applications increased by 36% between 1995 and 1997 (Coonan, 2010). McEvoy (2006) citing Dodd (1997) shows that Northwestern University had a 21% increase in applicants following its Big Ten Championship in football (after having been a poor athletic performer for decades). Mixon and Hsing (1994) show that schools playing DI versus DII sports improve their enrollment of out-of-state students by 3-4%, which the authors claim can increase total revenues for schools charging higher out-of-state tuition. They use a cross-section of schools and employ 1990 data. This is consistent with the findings by Mixon and Ressler (1995). Allen and Peters (1982) found that DePaul University’s men’s basketball success was correlated with higher enrollments and that the enrollment impacts for male students exceeded those for female students. In another case study, Chressanthis and Grimes (1993) showed that a 1% increase in the football team’s winning percentage (using a 21-year time series) led to increased enrollment of 3.8 students. Or, doubling the number of wins from 5 to 10 (a formidable task) significantly increased enrollment by 380 students.
| Page 10 |
Toma and Cross (1998) created a peer-group of institutions as a control group, used data from 1979-1992, and found that winning a basketball championship (or football championship) substantially increased applicants. Murphy and Trandel (1994), studying the 10-yr period 1978-1987, found that D1 football success had a significant, but moderate impact, on freshman applications. An increase in winning from average (0.500) to a 0.750 winning percentage increased the number of applicants the following year by 1.3%, all else equal. McEvoy (2006) further defines the Flutie Factor to mean the performance of an elite athlete and his/her impact on applicants. He finds that a university with a football player who finishes in the top 5 in voting for the Heisman Trophy sees an increase in applicants by about 6.59% the following year. Controlling for how well the athlete’s team performed, the net impact was approximately a 3.3% increase in applicants. In another study, McEvoy (2005) utilized admissions data and classified dramatic changes in winning in football, men’s and women’s basketball, and women’s volleyball to determine if there was a relationship between the two. While McEvoy found no change in admissions for increases in basketball winning percentage, he found that substantial changes in football winning percentage, such as increases greater than 0.250, mattered with respect to admissions, raising admissions by about 6%. Note that this is just the sort of improvement that UAB football experienced in 2014-15, jumping from a 0.200 winning percentage to a 0.500 percentage. Pope and Pope (2007) found that males, African-American students, and students who played high school sports were more influenced by athletics outcomes in their choices for higher education than other students. In a recent and perhaps the most comprehensive study of the impact of intercollegiate athletic success on the quantity and quality of applications, Pope and Pope (2009) analyze a large data set compiled for the years 1983 – 2002 and provide separate analyses for public and private schools. They find that the applications effects differ by sport and by type of institution. They show that while “private schools see increases in application rates after sports successes that are two to four times higher than seen by public schools,” that “increases in enrollment that take place after football success are mainly driven by public schools.” Specifically, the authors find that “… teams that have basketball success do not enroll more students the following year. However, schools that perform well on the football field in a given year do increase enrollment that year. Teams that finish in the top 20, top 10, and champion in football on average enroll 3.4%, 4.4%, and 10.1% more students, respectively. This is largely driven by public schools. This increased enrollment could come from the fact that many public schools give guaranteed admission for certain students. For example, a school that guarantees admission for in-state students with a certain class rank or test score may be required to enroll many more students if demand suddenly spikes.” Pope and Pope (2014) updated their earlier analyses and found, inter alia, that “high school students’ responses to sports success decays very quickly across time” and that there is “a larger effect of sports success on out-of-state than for in-state students. While a sports victory for a given school may not change the awareness of in-state students regarding its existence, the sports victory may present a significant shock in attention/awareness for out-of-state students.” The authors also continue to find “the influence of sports success on males, blacks, and students who played sports in high school to be significantly higher than their counterparts.” In a study of who influences incoming freshmen on where to attend college, students (via survey) said that the number one influencer was faculty/staff/coach at a university right ahead of their parents and visiting campus (Johnston, 2010). Attending a “sport event” ranked ninth out of fifteen total sources

| Page 11 |
of information. A survey of faculty/staff/coaches at a university showed a disconnect, valuing the importance of faculty/staff/coach as only eleventh out of fifteen. Howell and Rascher (2011) found that 18% of enrolling freshmen said that watching Intercollegiate Athletics at USF (CA) was “very important” in their college choice, while 43% said that it was “somewhat important”. Only 18% stated that they did not plan to attend intercollegiate sporting events. Chung (2013) described this benefit as a “Dynamic Advertising Effect of Collegiate Athletics.” He found that men’s basketball and football both led to growth in applications for admission. Georgetown University men’s basketball team success in the NCAA “March Madness” tournament from 1983-1986 (playing in three championship games) was matched with an increase in applications of 45% (as mentioned above). Similarly, Boise State’s upset win in 2007 Fiesta Bowl was followed by an 18% increase in applications and success by Texas Christian University’s football team starting in 2000 has corresponded with a doubling of applications from 2000 to 2008. Chung concludes that “when a school goes from being mediocre to being great on the football field, applications increase by 18.7 percent. To attain similar effects, a school has to either decrease its tuition by 3.8 percent or increase the quality of its education by recruiting higher-quality faculty who are paid five percent more in the academic labor market.” Effect of College Athletics on Donations Baade and Sundberg (1996) analyzed data from 1973-1990 for private and public universities and liberal arts colleges playing D1 football and/or basketball. Private universities that played in a college football bowl game saw shockingly high increases (54%) in alumni donations (sample size was 48 private universities). The public university sample also saw a substantial increase (40%) in alumni donations from appearing in a bowl game. Appearing in the NCAA men’s basketball tournament was associated with a 35% increase in alumni donations for public schools, but no statistically significant donation change for private schools. The liberal arts colleges saw an increase of 14% for alumni donations during the 1987-1990 seasons when making an appearance in the NCAA men’s basketball tournament. Rhoads and Gerking (2000), using data from 1986-1996, found that D1-A universities saw increases in alumni donations to educational programs based on football bowl game appearances and NCAA men’s basketball tournament appearances. Tucker (2004) examined the impact of athletic success in football and men’s basketball on alumni giving/donations. He found that a successful football team has a significant impact on alumni donations, but there is no statistically significant impact of basketball success using data from 2001-2002 (but containing variables averaged for the prior six years). Humphreys and Mondello (2007) analyzed The Integrated Postsecondary Education Data System (IPEDS) from 1976-1996 for all DI schools, both private and public. For public universities, earning a bowl bid in football is associated with higher restricted donations of more than $1.1 million (or about 12% more than the average amount of restricted donations at that university). Similarly, an appearance in the NCAA men’s basketball tournament raises restricted gifts by about 8%. They find that restricted gifts to private universities who make the post-season basketball tournament rises by about 9.8% (or about $1 million). They further conclude that some of these restricted gifts at private institutions are to non-athletics departments. Their study finds that for public and private universities, unrestricted giving was unrelated to athletic success.
| Page 12 |
Stinson and Howard (2004) showed that athletic giving at the University of Oregon during its initial run of successful football (1994-2002) increased dramatically and even crowded out a small amount of academic giving by the same donors. Stinson (unpublished) further shows that donors who give to both athletics and academics (at three D1 institutions) give more in total than athletics-only donors, have higher retention (in terms of continual giving over long periods of time), but give less to athletics than athletics-only donors. Analyzing just D1-AA and D1-AAA, Stinson and Howard (2008) find that winning football and men’s basketball teams are related to increases in both academic and athletics donations (using data from 1998-2003). End-of-season ranking and post-season appearances increased the number of donors, but not the amount of the average donation. The surprising trend is that the academic programs receive more of a boost than the athletics programs at these institutions. The study also shows that in the absence of football (the more commonly studied sport); basketball carries the same role in terms of attracting donations. Stinson and Howard (2007) show that while more donations to universities playing DI college football come from alumni, the amount donated by non-alumni is almost twice as high per person as the average alumni donation. Alumni also donate a higher percentage of their gift to athletics than non-alumni. Similar to Humphreys and Mondello (2007), Stinson and Howard find that athletic success does not appear to influence academic donations. They find substantial impacts from athletic success on giving to athletics. Much of the growth is from additional new donors joining the ranks of donors, not as much by existing donors donating more money. Schools with higher academic rankings (according to U.S. News and World Reports) are less susceptible to the effect of athletic success or failure on donations. Meer and Rosen (2009) collected alumni donation data of a selective research university as related to both the performance of the most visible teams, football and basketball, and also on the success of the team on which he or she played as an undergraduate. They found no significant donation differences for men and women except for the fact that when a male graduate’s former team wins its conference championship, his donations for general purposes increase by about 7% and his donations to the athletic program increase by about the same percentage. Howell and Rascher (2011) conducted a survey of about 10% of USF’s donors and found donors’ primary reasons for donating to the athletic department were (a) athletics is a worthwhile educational experience, (b) to support athletes, and (c) to support specific teams. Key giving triggers included the hiring of a new coach; the recession was a key contributor to reduced giving. Most recently, Koo and Dittmore (2014) determined that winning football teams are related to increases in both academic and athletic donations. They ruled out the idea that athletic donations “crowd out” academic donations, finding rather that “there was a significant and positive causal relationship between athletic factors and academic giving. For example, the coefficient on athletic giving implied that for every $1 increase in athletic giving, the current dollars of voluntary support restricted to academic purposes will increase by 48 cents. The coefficients on football winning percentage identified that for every one percent improvement in football win-loss record, the current dollars of volunteer support restricted to academics will increase by approximately $1.5 million.” The authors add that their findings support the idea of “a symbiotic relationship between athletics and academics. … Successful athletic programs are able to create substantial exposure for schools in higher education, which is equivalent to the advertising effects derived from using traditional mass media

| Page 13 |
outlets (Roy, Graeff, & Harmon, 2008). Further, findings from the current study which point to a positive relationship between enrollment numbers and graduation rates with academic giving might be good news for university administrators who advocate athletic success as a way to increase student applications.” Converse to most of the previously-cited research, Turner, Meserve & Bowen (2001) used data from 15 academically selective private colleges and universities and found that general giving rates are unaffected by football won-lost records at the high-profile DI-A schools and at the Ivy League schools. While there is a modest positive effect at DIII colleges, the authors conclude that there is little evidence that winning and giving go hand-in-hand at the selective private universities that play big-time football. This may highlight an important difference between schools with very strong academic reputations and those more commonly known for their sports. One of the findings mentioned by Stinson et al. (2004) is that some alumni might give when it’s needed most, such as when the team is losing, while others would give when the team is winning. Thus, the statistical relationship between winning and donations might be non-existent; yet simply having an athletics program might affect donations. Frank (2004) suggests that intercollegiate athletics exhibits characteristics of a winner-take-all market where participants only win if they win it all, not just have average success. Frank argues this is what creates financial losses for those programs that don’t win it all (or close to it) and he uses the term “arms race”24 in intercollegiate athletics to capture this. His conclusion on the impact of athletic success on donations or applicants (or incoming freshmen) is that it is either non-existent or small; however, it is larger for football success than basketball success. Mahony, Gladden and Funk (2003) developed a survey instrument and tested it at three D1 institutions. The goal was to determine donor motivations. The findings are not surprising in that athletic success and seating priority mattered. Also, there were clear differences among the three institutions, and the authors recommended individualized study of each institution (as opposed to generalizing about the results across schools). Gladden, Mahony and Apostopoulos (2005) show that helping the athletic program, receiving ticket benefits, and helping college athletes were the three most prevalent reasons for donating to college athletic programs. Effect of College Athletics on Brand and Perception There is a plethora of research on how publicity and media coverage impact the perceptions of people with respect to the brands of various organizations and products. Such studies imply that media coverage of intercollegiate athletics can have an impact on awareness and image of a university, especially if that coverage is not accompanied by regular coverage of non-athletics activities on campus. Academic research shows that publicity (or editorial content) has a stronger impact on cognitive thinking and memory about an issue than an advertisement does. It is clear in the literature that publicity is equal to or more powerful than advertising because it is more believable coming from a third-party source than from the organization itself.
24 As explained above, the key conditions for an arms race, where there can only be one winner applies to a league’s championship season but not to the league’s economics. In a profitable industry, far more than one team or one conference can win and competition among those teams and conference need not be seen as inherently wasteful.
| Page 14 |
Industry research has measured the impact of publicity on a professional sports team’s brand by using the “media equivalency” technique. This technique measures the amount of media coverage and places a dollar figure on it based on what it would cost to purchase the same amount of advertising (whether it be column inches in a newspaper or 30-second ads) on the same media outlet. In the sports industry, corporate sponsors commonly use media equivalency techniques to measure the value of their sponsorships. Roy, Graeff, and Harmon (2008) utilize surveys of stakeholder groups (students, alumni, and area residents) on their intentions to donate and attend sporting events and more generally on their attitudes toward and perceptions of the university once it moved to DI from a lower division. They note that the exposure provided by athletics is often the only substantial exposure a university gets, especially one without a top academic reputation. Citing to Goff (2000) and Goff (2004), they note that the cost of getting that much media exposure can be prohibitive using traditional mass media communications channels. They also discuss how intercollegiate sports can help build the brand equity of a university. They find that the respondents believe that FBS football is prestigious, enhances school spirit, and should increase applications. However, alumni worried about the move to FBS on the value of their degree. Also, the likelihood of attending more games or donating money to the school is enhanced, but only slightly. Goff (2000) conducts a media exposure analysis from 1991-1996 on six leading U.S. newspapers for both Northwestern University and Western Kentucky University (WKU). Articles about Northwestern University jumped 185% during its 1995 successful football season leading to the Rose Bowl (in comparison to the three-year average prior to that). For WKU, articles jumped from 2 or 3 per year to 13 and 20 during the successful basketball years of 1992 and 1993. In both cases, after the success, the coverage went down. Additionally, about 70% of articles about Northwestern were athletically related. For WKU, zero or one articles per year were non-athletically related. Clotfelter (2011) analyzed the media coverage in the New York Times for 74 universities during 2007. Fifty-eight (58) of the universities had “big-time” football programs. The Times ran 523 sports-related articles about these universities in 2007 and 78 non-sports articles. Sports stories made up 87% of the coverage of schools with big-time football programs. For the 16 universities without a big-time athletic program, 38% of the stories were sports related.25 These 16 universities include the Ivy League schools, which play in DI, but do not offer athletic scholarships. Howell and Rascher (2011) found that 57% of all internet media coverage of USF (CA) across an entire year focused on athletics, and had an estimated $2 million in publicity value. They note that a single upset win over a conference foe (Gonzaga) led to coverage with an estimated publicity value of $124,540.
25 The list of 74 came from the six big sports conferences, plus Notre Dame, plus the top universities as listed by U.S. News and World Reports.
| Page 15 |
Goidal and Hamilton (2006) developed a survey instrument to analyze the extent to which the general public equates NCAA athletic success to academic quality, particularly in the year in which a state university wins a national championship. They are somewhat correct when they say that a review of academic literature shows a mixed bag of results when it comes to studies analyzing the impact of NCAA athletics on alumni giving, applications received, graduation rates, and SAT scores of entering classes. However, they also point out that public perceptions on the issue are rarely studied, specifically as to whether NCAA success leads to the perception of a better academic university. The authors conducted two statewide surveys of Louisiana voting age residents between January 29 – March 3, 2004 (a period when Louisiana State won the BCS National Championship in football) and December 6, 2004 – February 1, 2005. Respondents were asked whether they strongly agreed, agreed, neither agreed nor disagreed, disagreed, or strongly disagreed with the following statement: ‘‘LSU’s success in college athletics makes for a better academic university.’’ As part of the split-ballot design in the 2004 survey, the question wording ‘‘success in college athletics’’ was altered to make a direct reference to LSU’s BCS National Championship. Results showed that a substantial proportion of the population believes that athletic success and academic quality are connected, that less-educated respondents are more likely to make such connections, and that these connections affect evaluations of colleges and universities. Perhaps what is most interesting is that these results were stable across both survey groups and that winning the national championship made little difference. It may well be that perceptions tied to athletic success have a long lasting ‘halo’ effect. Anecdotally, though, the belief in the overall benefit of NCAA athletics to university development is widely held by many university executives. During his 17-year tenure at Kansas State University, University President Jon Wefald has seen his college football team grow from the ranks of the worst in D1 to a perennial top-10 powerhouse. As he put it: “When I got here, there was a sense of futility…If the old administration had stayed on here for three more years, I think football would have been dropped. We would have no marching band, and we’d be at about 12,000 students today” (quoted in Mandel, 2003, Para 15-16). By 2003, Kansas State’s enrollment had increased from about 13,000 in 1986 to 23,000, its fundraising had gone from $7 million a year to $83 million and the city of Manhattan’s economy had grown exponentially (Mandel, 2003). When interviewed by Seattle University’s 2007 Athletic Alignment Study Task Force (AASTF), a report to determine whether the University should move from DII to DI, a senior Portland University administrator stated: “Because of the success of our soccer teams, we have received literally hundreds of thousands of dollars in free publicity. In addition, when the press covers sports we are often on the first or second page of the sports section. The other local private schools barely get mentioned, or if so on the back page.” (Final Report, 2007, p. 10). In 2007 Seattle University’s Board of Trustees approved the decision to apply to the NCAA for D1 status. Huge benefits have been reported by other schools, including an estimated $555 million from Wichita State for its 2013 tournament run26 and an estimated $512 million from Butler for its 2011 performance.27 These latter estimates have drawn some pushback as to the size of the effect, but few doubt the directional effect – more exposure is better for brand awareness.
26 http://www.wichita.edu/thisis/stories/story.asp?si=2426.
27 http://www.butlersports.com/sports/m-baskbl/2011-12/releases/072611aaa “The study by Borshoff found that the performance of the Butler men’s basketball team generated $60,378,084.41 in television publicity value, $2,792,954.18 in
| Page 16 |
A study conducted on behalf of St. Mary’s College of California investigated the overall media coverage and publicity value of its successful run into the Sweet 16 of the NCAA’s Men’s Basketball Tournament during the 2009-2010 season. The study focused on print, Internet, and broadcast articles from March 1, 2010 to April 1, 2010. Over 12 million people were reached from the 2,512 articles (542 print, 583 broadcast, and 1387 Internet) with 98% being from the Internet. The total publicity value was about $9.3 million with an average of $3,697 per article. (Personal Correspondence, 2010). Mulholland, Tomic, & Sholander (2014) find that simply having an FBS football program lifts an otherwise comparable university above its peers in the US News and World Report’s America’s Best Colleges rankings. They also find that this affect is then further increased by high performance on the gridiron. The authors note that the question of whether investment in FBS as a means of improved academic standing is wise comes down to the debate over costs. They conclude:
“Cost, however, is important. Improving on the field performance is likely, though not always, associated with larger athletic budgets. If high visibility programs are revenue neutral or profitable, as reported by Litan et al. (2003) and Matheson et al. (2011), then the additional benefit of higher peer assessment scores through intercollegiate football participation and performance may be more efficient than using merit scholarships, tuition discounts, or public subsidies to improve the institution’s peer assessment through its SAT profile. However, if Fulks (2008) and others are correct and a majority of football programs fail to cover their operating costs, then entering into the zero-sum game of intercollegiate football performance may not be a wise investment.”28
To this specific point, Stinson, Marquardt, Chandley (2012) find that among the various scholarly investments available to an institution, investments in athletic expenses increase university core revenues 114%, the second largest ROI among common university investments. They emphasize that “these assessments were made from a purely financial perspective, and did not take into account university subsidies designed to build brand awareness or shape brand meaning” and suggest that athletics may play a strong role there because “an important strategy in building strong brands is to connect with their various constituent groups, which is made significantly easier when these groups are given reason to regularly connect with the university. Intercollegiate sports provide such opportunity.” In an unpublished article by Hutchinson and Rascher, the authors found that schools that dropped football (often with the goal of refocusing resources elsewhere) showed a slight (but not statistically significantly different) decline in their US News and World Report academic rankings, no change in enrollments, no change in SAT scores of incoming freshmen, and an actual statistically significant
print publicity value and $449,211,664.31 in on-line publicity value. The study did not consider the publicity value of radio broadcasts or talk shows.”
28 Note, the authors of this report disagree that from a financial point of view, college athletics is a zero-sum game. On the court or field, clearly for every winning team there must be a loser, but both teams could nevertheless generate a profit. Indeed, the fact that each NFL season generates an equal number of wins and losses doesn’t prevent the league and all of its teams from winning on their Profit and Loss statements.

| Page 17 |
decrease in the quality of their basketball programs. We present these data in more detail below in the section on “Looking Forward.” Effect of College Athletics on Student Academic Standards, Retention and Graduation A study by Tucker (2005), who notes that the total revenues in college athletics, especially for football, and the media coverage of college athletics has grown substantially in the past one to two decades, finds that football success is a highly statistically significant predictor of higher SAT scores of the incoming freshmen class. The strongest findings are for the most recent years of his data (which ranges from 1990-2002). In fact, an increase of 10% in the winning percentage of a D1 football team for a 5-year period increases the average SAT score by about 14 points. Similarly, one additional appearance in a bowl game or in the Top 20 rankings, increases average SAT scores of the incoming freshmen class by about 12 points. Randall Smith (2009) published a comprehensive study looking at how all schools in D1 playing football (both Football Bowl Subdivision and Football Championship Division) affect their incoming freshmen classes in terms of academic quality. His data spans 233 D1 programs from 1994-2005. He uses multiple measures of recent football success and football “tradition” and finds that they are statistically significant, but fairly small, at impacting incoming freshmen SAT scores, incoming GPAs, and high school class rankings. One key finding is that football tradition seems to be more important than seasonal winning unless a long dry spell in winning has been overcome with a successful season. This coincides with his theory separating the advertising effect of short-term success (literal coverage of seasonal winning successes) with the general tradition that is promulgated about a particular school (i.e., he uses the number of books written about a school’s football program as one measure of this). Pope and Pope (2009) find that schools with basketball success see increases in the percentage of students who score greater than 500 on SAT math and verbal by 1-4% and greater than 600 on SAT math and verbal by the same 1-4%. Top 20 football teams also can expect increases in SAT scores of applicants of between 2% and 12% the following year. When a school reaches the Sweet 16 in the men’s basketball tournament, it sees a significant increase in the number of students sending SAT scores to the school (e.g., a potential applicant) for both mid-quality students (900<SAT<1000) and high quality students (SAT>=1100). Football success shows similar directional results, but are not statistically significant. Studying ten years (1993-2002), Tucker and Amato (2006) find that there is no consistent evidence that men’s basketball success impacts the quality of the incoming student body (as measured by average SAT scores), but that being in a major conference does impact average SAT scores of the incoming class. The inconsistency stems from the two different variables used to measure basketball success: average AP ranking at the end of the season and the number of NCAA tournament games played. The NCAA tournament games variable does have a positive and significant effect on the following two years’ SAT scores, while the AP ranking does not. Similar mixed results have been found looking at both football and men’s basketball. Pope and Pope (2009) may have uncovered the reason for this in that there are more applicants of all qualities and that many schools increase enrollment (instead of simply increasing the quality of the incoming class with a fixed enrollment) or increase tuition (which may have a differential impact on who chooses to attend the now-more-expensive university). Private universities may have different opportunities available to them compared with public universities. Few studies separate the effects across the two sub-groups except
| Page 18 |
Pope and Pope (2009). It appears that private schools have less of an option to increase enrollment when they are faced with more applicants, but can instead increase the quality of the admitted pool and/or increase tuition. The final impact on the freshman class depends on which of those admitted students choose to attend. The relationship of major athletic programs and incoming student quality has been shown by McCormick and Tinsley (1987) who found schools participating in “big-time” athletics saw an increase in SAT scores of the entering freshmen class relative to other schools of 3%. Yet, Bremmer and Kesselring (1993) do not find that SAT scores rise with athletic success. Their re-creation of McCormick and Tinsley’s study using 1989 data instead of 1971 data did show moderate positive impacts on SAT scores of simply participating in big-time sports, but the significance was only at the 15-20% levels, which is below standard significance acceptance levels. Mixon and Treviño (2005), using data from 2000-2001, show that college football success increases retention of freshmen and increases the general population’s graduation rates. Tucker (2004) examines the impact of athletic success in football and men’s basketball on student graduation. He finds that a successful football team has a significant impact on student body graduation rates, but there is no statistically significant impact of basketball success using data from 2001-2002 (but containing variables averaged for the prior six years). Le Crom, Warren, Clark, Marolla, and Gerber (2009) studied the effect of scholarship support, gender and sport-type (individual or team) on college athlete retention by utilizing the Academic Progress Rate (APR)29 of a single mid-major DI Conference using data from 2001-2005. They reported that scholarship support alone was not significantly related to retention. Gender was reported as a significant predictor of retention with female athletes having higher rates of retention than their male counterparts. Furthermore, sport-type was a significant predictor of retention with individual sport college athletes having higher rates of retention than team sport college athletes.
29 APR tracks student athletic eligibility and retention.
| Page 19 |
Effect of College Athletics on State Appropriations Humphreys (2006) looked at the relationship between major big-time college football programs and state appropriations to higher education. Between 1974-2000 over 150 institutions sponsored D1 football. 80% were public universities and over this 26-year period government dollars accounted for 32% of institutional funding, far larger than the 19% from tuition and fees, 4.7% from charitable donations, which comprised the primary areas of previous research on indirect financial benefits of intercollegiate athletics. The results suggest that institutions fielding FBS (then called “DI-A”) football programs receive 8% more in annual state appropriations – about $2.6 million in real 1982 dollars – than those without such programs. The study found that bowl appearances and national rankings do not lead to additional appropriations. These results suggest that the total economic benefit associated with FBS athletics programs may be larger than previously thought and provide insight into why the number of institutions fielding FBS college football programs increased by 10% from 1998 to 2002. Case Studies of Individual Universities
Rice University In 2003 the Board of Trustees at Rice University commissioned McKinsey & Co., a top management-consulting firm, to do research on all aspects of Rice’s athletic program, including budgets, academic and athletic success rates, and the changing national environment for athletics. As such, the McKinsey-Rice Report served … “as a tool to inform future Board discussions regarding the nature and scope of athletics at Rice University. The analyses contained within highlight nearly every aspect of Rice athletics and lead to four viable, forward-looking options that Rice could pursue” (Rice, 2004, p, 1). Rice University had been successful by most collegiate athlete recognizable standards. While winning numerous conference championships in many sports between 1999-2004, Rice had also been successful in graduating students, avoiding NCAA rules infractions and running an exemplary and ethical program. However, there was concern that competing in NCAA DIA may be having a detrimental financial and academic effect on the university as a whole. Driving this was the fact that Rice, with a student body of approximately 2700, would always be uncompetitive in the sport of ‘big time’ football. The McKinsey-Rice Report was certainly revealing. The following are relevant key highlights:
The accounting deficit between athletics revenues and athletics expenses had risen to nearly $7 million annually.
If 55% of the value of grants-in-aid were counted—approximately equivalent to the aid an athlete receives over and above an average Rice student—the deficit was more than $10 million annually.
75% of expenses were covered by what the university called “institutional support.” Salaries, scholarships, and travel comprised the largest costs for Rice athletics. These costs
had all been increasing at an annual rate in excess of 7 %. That was not out of line with the increases in the general operating budget of the University, which had been slightly above this rate.
| Page 20 |
Compared to other FBS schools, Rice ranked 75th out of 117 schools by total athletics budget.
Rice spent almost double on athletics per undergraduate ($6,809) as other private FBS institutions ($3,938).
Football generated approximately $2 million annually but was responsible for nearly $4 million of the $10 million-plus athletics accounting deficit in 2002.
A football team, on average, costs in excess of three times more to support annually than a basketball team does and more than nine times as much as the average expense of a baseball team.
More than half of Rice students felt that FBS athletics had little to do with their decision to come to Rice. Interestingly, though, most students agreed or agreed strongly that Rice should not eliminate athletics altogether (79%) or make a drastic change, such as moving to DIII (59%).
More than half of Rice’s African American males were on some sort of athletic scholarship. Former varsity athletes made up a significant number of the top donors. Their dollar
contribution, however, while significant, is in line with what might be expected, given the percentage of the undergraduate population that they have historically represented.
The vast majority of large donors gave almost exclusively to the University, and very little was restricted to the athletics programs. If every one of the top 200 donors at Rice who gave more than 5 % of their gifts to athletics stopped donating entirely, the donations to the general University funds would decrease by less than 10 %. Disenfranchising those same donors would have a much larger impact on designated athletics department gifts, but the state and quality of intercollegiate sports seemed to have little bearing on the vast majority of contributions to the University at large.
In May 2004 the Rice University Board of Trustees, after reviewing all viable options, decided to renew its commitment to participation in FBS intercollegiate athletics. “We unanimously have concluded that, in today’s world, DI-A remains the best place for Rice,” said Board Chairman Bill Barnett. “In doing so, we are resolved to maintain academic excellence as we pursue athletic excellence.”30 The Board of Trustees further recommended improving the athletics operations by:
Moving toward an integrated admission process that reflects best practices at other highly selective institutions,
Lowering the $10 million per year accounting budget deficit being incurred by the athletics department on a phased basis, and
Building a student-faculty fitness and recreation center and convocation center, which also would serve as an improved venue for men’s and women’s basketball and other intercollegiate, club and intramural sports.
30 (http://www.media.rice.edu/media/NewsBot.asp?MODE=VIEW&ID=3856&SnID=2)
| Page 21 |
Gonzaga University Since Gonzaga broke onto the national scene with a run to the elite eight of the NCAA Basketball national Championships in 1999, the University has experienced increased student applications and successful fundraising. In fiscal year ending May 31, 1997, the University raised $8.4 million from alumni and foundations. By the end of the 2000 fiscal year, which came months after the basketball team almost made it to the Final Four, the university raised $16.5 million (Lieber, 2004). Indeed, between 1998 and 2008, Gonzaga University completed a capital campaign that raised more than $150 million for buildings, student financial aid, faculty enrichment, technology and mission-based programs, increased its annual cash contributions from $5.8 million in 1997-98 to $15.4 million in 2006-07, and grew its endowment from $89 million in 1998 to $152.4 million in 2007 (Board of Trustees Letter, 2008). Included is a brand new state of the art 6,000 seat basketball arena. There has been similar growth in both student applications and attendance. According to Lieber (2004), the 3,713 student applicants for the 2003-2004 freshman class was more than double the 1997 number. Indeed, Gonzaga University has undergone steady enrollment increases from 4,507 overall in fall 1998 to 6,923 in fall 2007, with undergraduate enrollment increasing from 2,812 in 1998 to 4,386 in 2007. At the same time, the SAT levels of incoming freshman have increased. In 1998, the average incoming freshman GPA and SAT scores were 3.54 and 1159 respectively. In 2007, the scores were 3.72 and 1192 (Board of Trustees Letter, 2008). Gonzaga University administrators are quick to note that there is no definitive cause and effect between increases in fundraising, student applications and basketball success. They recognize the relevance of other forces such as (1) the dramatic Washington state demographic increase in the number of baby boomer college eligible children, and (2) the impact of financial aid restructuring targeted at attracting high achieving students. By 2004 over 90% of students received some financial aid for tuition and/or room and board costs. However, Father Spitzer, who became President of the University in 1998 and has been at the helm of Gonzaga University’s growth strategies for the past decade, is just as quick to make probable anecdotal connections: “Without trying to get too precise, because we don’t have the quantitative data to support it, you’d have to say that certainly well over 50% of the application rise” is due to public relations, “And that PR is attributable in great part to basketball” (Lieber, 2004, p. 4). Just this year, in the wake of a run to the Elite Eight, Gonzaga received a $5 million donation specifically earmarked to cover new athletic expenses.31
31 See www.spokesman.com/stories/2015/apr/05/in-brief-gonzaga-hoops-success-spurs-5-million/
| Page 22 |
Rutgers University Rutgers University, the State University of New Jersey, recently joined the Big Ten Conference after many years in the somewhat less prestigious Big East. Rutgers President Robert Barchi recently discussed how this switch has helped the athletic and academic prospects of the school:
“Our athletic programs, and the university as a whole, are now receiving national attention and exposure. … That attention and exposure is reflected across the university — from the spirit of our fans to the achievements of our students; from the depth and richness of our research collaborations to the millions of positive media impressions and the broad introduction of our great university to families across America. “We are already seeing the benefits of entering the Big Ten and its academic counterpart, the Committee on Institutional Cooperation. Applications for admission to Rutgers are up by 12 percent, with out-of-state applications up by 15 percent. The average SAT score of admitted applicants to Rutgers has increased by more than 20 points since our entrance to the Big Ten; this is an unprecedented improvement.’’32
Rutgers Vice President for Enrollment, Courtney McAnuff described areas where he believed the increased exposure from Big Ten affiliation improved the volume of applications for enrollment:
“New Jersey applications are up 8 percent. I think the Big Ten has certainly much more impacted the domestic, out-of-state market, which is up about 15 percent. But also we do quite a number of things to recruit students. But I do think the awareness of the school, which athletics does bring, does impact us quite positively.’ … we hear, ‘We saw Rutgers on TV, we didn’t know where you guys were.’ I hear a lot of that. You hear things about they want to see the Big Ten competition. And certainly in the Big Ten states we’re up significantly in every big state with the exception of Ohio. But every other Big Ten state there’s been a double-digit increase.’’33
Despite these apparent benefits, not all within the Rutgers community have celebrated the move to the Big Ten. Recently, the Faculty Senate voted to substantially scale back the university’s contributions to the athletic department,34 endorsing a proposal by which “Rutgers Athletics should design and enforce a five-year plan to eliminate all financial losses.”35 The conflicting assessments highlighted the importance of understanding the appropriate uses of athletic accounting data and how policy must be able to take into account both the profit and loss statements of the athletic department, but by doing so should not lose sight of the fact that many of the revenues and costs generated by athletics can appear on the profit and loss statements of other departments.
32 http://www.nj.com/rutgersfootball/index.ssf/2015/03/rutgers_enrollment_chief_says_applications_are_up.html
33 http://www.nj.com/rutgersfootball/index.ssf/2015/03/rutgers_enrollment_chief_says_applications_are_up.html
34 https://www.insidehighered.com/news/2015/03/31/university-senate-report-calls-rutgers-athletics-become-self-sustaining
35 http://senate.rutgers.edu/BFConS1408AthleticsProgramDeficitsMarch2015.pdf
| Page 23 |
IV. Research Projects Focused on UAB The Rutgers controversy provides an excellent transition into the specifics of UAB because it highlights the importance of revenues that may not appear on an athletic department’s profit and loss statement. The research projects listed below are based on the literature review and provide a complementary set of both primary and secondary research,36 focused on the direct question of whether the net economic benefit of cancelling football, bowling, and rifle will be positive or negative, both immediately and looking forward.
Project #1 – Economic Analysis of Financials of UAB Athletics
The review of literature showed many instances where the net economic profits generated by athletics departments were actually much higher than reported by those departments using standard university accounting practices. Often this is done for purely innocent reasons; as one example, it is simply easier to attribute all revenue generated by the bookstore to that department rather than to undertake the difficult process of identifying which bookstore sales are driven by athletics. Western Kentucky University was found to have losses of only $330,000 per year, not the $1.5 million annual loss originally reported (and was found to have gains in the millions of dollars when accounting for impacts on enrollment because of athletics). Utah State University’s reported loss of $700,000 during one year was actually a gain of $366,000. The University of Nebraska, Omaha was probably breaking even financially from its football and wrestling programs (even before accounting for any general enrollment, donations, or other indirect effects), even though it reported annual losses of $1.5 million from football and wrestling. One strong motivator for the current system of reporting is that there are standards in place that may mandate accounting methods that veer away from a better estimate of the true financial benefits of a particular sport. A very simple example should suffice to show why unadjusted standard athletic department accounting data cannot answer whether athletics makes or loses money for the University as a whole. Consider two high school seniors, both of whom excel at softball. Imagine UAB offers each a 50% athletic scholarship and both accept. One lives in Alabama; one lives in Tennessee. Other than their state of residence, assume they are identical, in that they end up living in the same dorms, attending the same classes, and majoring in the same sports. Each imposes identical costs on UAB; the only difference is that one qualifies for in-state tuition and the other does not. As we understand the current UAB accounting system (which is fairly standard across the NCAA), the university charges the Athletic Department for half of each athlete’s sticker price. For the in-state student, the “sticker price” of tuition, fees, room, board, and books is on the order of $15,600. For the out-of-state student,
36 When data sources are created for the study being conducted, then that is termed primary research. That often includes surveys or focus groups. Secondary research is conducted using already existing information that was not gathered or created for the study being conducted, but for some other reason. An example below is using existing information on the number of applicants and Athletics success and looking for statistical relationships among that data.
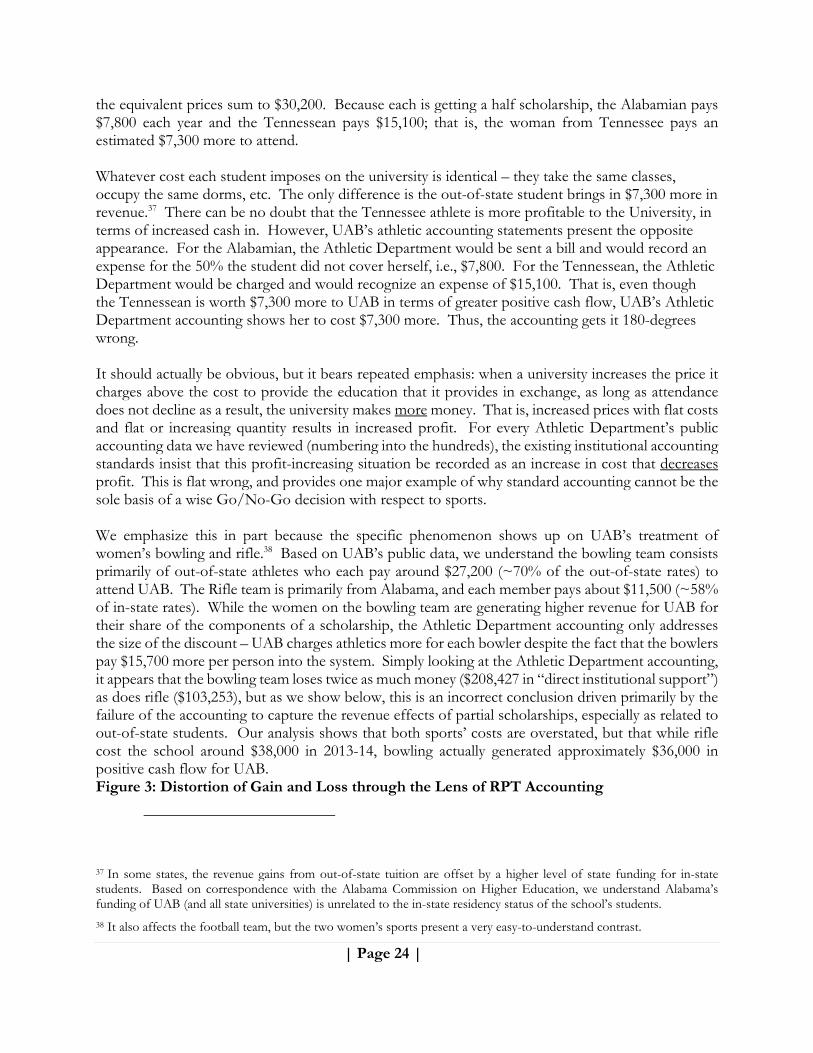
| Page 24 |
the equivalent prices sum to $30,200. Because each is getting a half scholarship, the Alabamian pays $7,800 each year and the Tennessean pays $15,100; that is, the woman from Tennessee pays an estimated $7,300 more to attend. Whatever cost each student imposes on the university is identical – they take the same classes, occupy the same dorms, etc. The only difference is the out-of-state student brings in $7,300 more in revenue.37 There can be no doubt that the Tennessee athlete is more profitable to the University, in terms of increased cash in. However, UAB’s athletic accounting statements present the opposite appearance. For the Alabamian, the Athletic Department would be sent a bill and would record an expense for the 50% the student did not cover herself, i.e., $7,800. For the Tennessean, the Athletic Department would be charged and would recognize an expense of $15,100. That is, even though the Tennessean is worth $7,300 more to UAB in terms of greater positive cash flow, UAB’s Athletic Department accounting shows her to cost $7,300 more. Thus, the accounting gets it 180-degrees wrong. It should actually be obvious, but it bears repeated emphasis: when a university increases the price it charges above the cost to provide the education that it provides in exchange, as long as attendance does not decline as a result, the university makes more money. That is, increased prices with flat costs and flat or increasing quantity results in increased profit. For every Athletic Department’s public accounting data we have reviewed (numbering into the hundreds), the existing institutional accounting standards insist that this profit-increasing situation be recorded as an increase in cost that decreases profit. This is flat wrong, and provides one major example of why standard accounting cannot be the sole basis of a wise Go/No-Go decision with respect to sports. We emphasize this in part because the specific phenomenon shows up on UAB’s treatment of women’s bowling and rifle.38 Based on UAB’s public data, we understand the bowling team consists primarily of out-of-state athletes who each pay around $27,200 (~70% of the out-of-state rates) to attend UAB. The Rifle team is primarily from Alabama, and each member pays about $11,500 (~58% of in-state rates). While the women on the bowling team are generating higher revenue for UAB for their share of the components of a scholarship, the Athletic Department accounting only addresses the size of the discount – UAB charges athletics more for each bowler despite the fact that the bowlers pay $15,700 more per person into the system. Simply looking at the Athletic Department accounting, it appears that the bowling team loses twice as much money ($208,427 in “direct institutional support”) as does rifle ($103,253), but as we show below, this is an incorrect conclusion driven primarily by the failure of the accounting to capture the revenue effects of partial scholarships, especially as related to out-of-state students. Our analysis shows that both sports’ costs are overstated, but that while rifle cost the school around $38,000 in 2013-14, bowling actually generated approximately $36,000 in positive cash flow for UAB. Figure 3: Distortion of Gain and Loss through the Lens of RPT Accounting
37 In some states, the revenue gains from out-of-state tuition are offset by a higher level of state funding for in-state students. Based on correspondence with the Alabama Commission on Higher Education, we understand Alabama’s funding of UAB (and all state universities) is unrelated to the in-state residency status of the school’s students.
38 It also affects the football team, but the two women’s sports present a very easy-to-understand contrast.
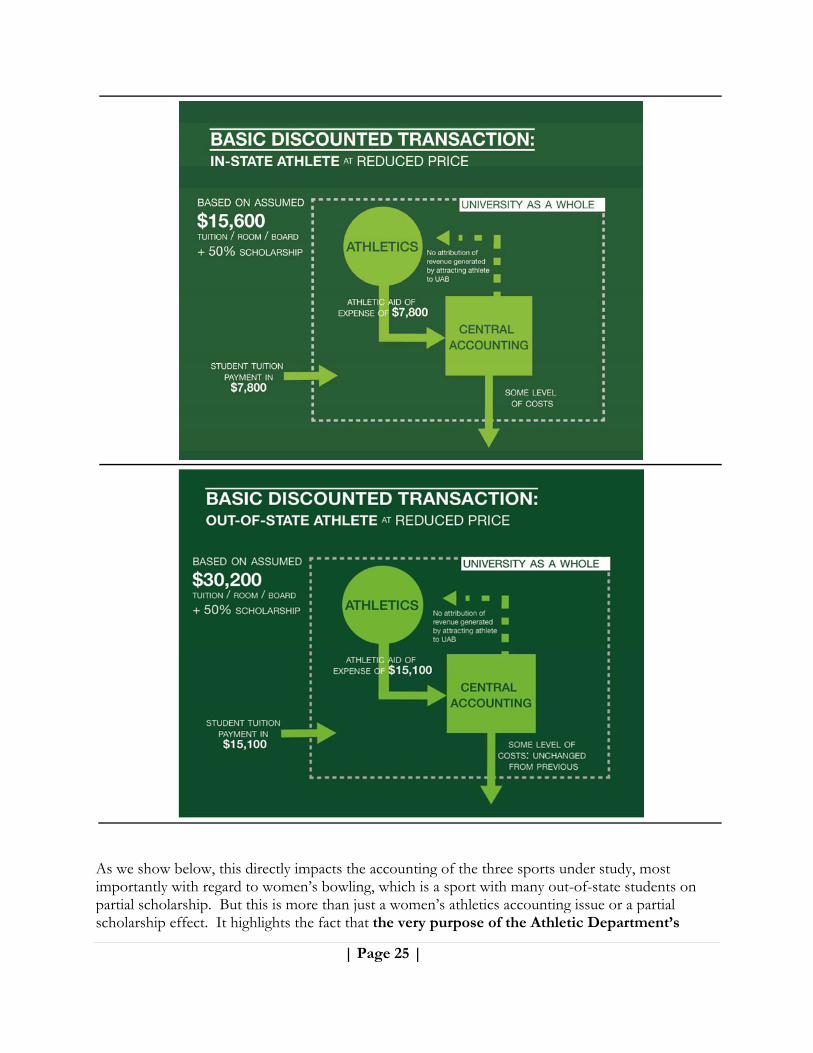
| Page 25 |
As we show below, this directly impacts the accounting of the three sports under study, most importantly with regard to women’s bowling, which is a sport with many out-of-state students on partial scholarship. But this is more than just a women’s athletics accounting issue or a partial scholarship effect. It highlights the fact that the very purpose of the Athletic Department’s

| Page 26 |
accounting is to capture something different from the net financial benefit of the athletic department on the university as a whole. Rather, it is designed inter alia to impose a common athletic standard across very different universities and to impose managerial controls on Athletics Departments that may have very different goals than maximizing the net cash in to the university. There is nothing inherently wrong about this motive, but it is an error to confuse the AUP or a universities implementation of that standard with a proper assessment of the economic benefits/costs of an athletic program. This confusion can lead uninformed analysts into making incorrect conclusions. Figure 4: RPTs Can Distort Charges to Athletics or Allocations within Athletics
It is worth mentioning that not all accounting methodologies are created equally. UAB’s numbers follow the NCAA’s Agreed Upon Procedures (“AUP”) approach; essentially a form of financial accounting, similar in intent to methods used by public corporations to comply with GAAP. It is an accounting method used for reporting to an external stakeholder (the NCAA) such that information reported by different schools is prepared according to a single set of procedures which facilitates ease of comparison between schools. Financial accounting methods (geared for external stakeholders) are quite distinct from managerial accounting methods (geared for internal management to make financially sound business decisions). Managerial accounting approaches are much more in sync with our approach as economists. For example, according to the text that we understand is required reading in UAB’s core “Principles of Accounting” classes, proper managerial decision-making requires analysis of both out-of-pocket costs and opportunity costs (but generally not sunk costs) as well as “the additional or incremental revenue generated by selecting a particular course of action over another. … In sum, both relevant costs and relevant benefits are crucial to managerial decision making.”39 Our entire approach is guided by this, so when the accounting standards followed by Athletic Departments (including UAB) diverge from this principle, we adjust to ensure consideration of true marginal costs and benefits. To make a proper assessment of the economic costs and benefits of
39 See Wild, J. J., Chiappetta, B., & Shaw, K. W. (2013).
| Page 27 |
sports, a whole-university, economic/managerial approach is needed, one that examines all revenues and costs at a system-wide level, and which essentially ignores any transfer payments if they have no true-cost basis. Ironically, because universities differ so much in terms of their economic conditions (most importantly, whether they are at capacity or not), the laudable accounting goal of creating a standard system likely causes athletic department accounting to become less accurate economically because the method of standardization treats schools with true opportunity costs identically to those with low or no such costs. Seen from the whole-university perspective, the decision not to credit the athletic department with certain revenues for which it is responsible (and similar decisions within the athletic department to leave unallocated certain sport-specific revenues) creates a seeming revenue gap that then (per standard accounting) “must” be filled with a “plug” entry for “direct institutional support.” That is, the appearance of a subsidy can be more an artifact of the accounting conventions inherent in the “agreed upon procedures” followed by NCAA schools in their reporting, rather than an actual economic loss. Thus, as we show below, when the full impact of women’s bowling is considered, the team actually appears to have generated a small, positive cash flow for UAB despite the appearance of a $200,000 deficit or “subsidy.” To be clear, none of this is an indictment of the accounting procedures of UAB for the purpose they are intended, which is to report UAB’s financials in a way that meets all relevant accounting standards such as the NCAA’s AUP report. Rather, it merely shows that the true financial impact to the school of a decision such as cancelling women’s bowling can be very different from those accounting figures. In the end, UAB itself needs to decide whether its goal in this process is to gussy up its accounting statements or to improve the actual financial health of the university. We would hope the latter is the choice. We nevertheless recognize that in a large, complex, bureaucratic institution, when accounting and economic answers diverge, sometimes the simple fact that the numbers have to be presented based on specific rules can encourage decision makers to focus on how their choices affect the accounting statements rather than how they actually affect true profits and losses. From an economic position the underlying reality matters far more than the on-paper representation of that reality approximated by accounting statements – the perception of on-paper profit or loss doesn’t change the financial wherewithal of the university; actual profits and losses do. While college sports accounting tends to understate surpluses, that is not always the case. Sometimes, the accounting can tend to overstate the benefits of an activity versus the economic reality. As a case in point consider UAB’s use of money from the UAB Educational Fund (UABEF). It is our understanding that the UABEF provides funds to the football program of around $640,000 which is categorized as a charitable donation to football.40 Based on preliminary discussions with the Athletic Department and a review of the UABEF’s online mission statement, it appears that in the absence of football, a good deal of those funds could be available for other uses at UAB, either for other sports within the remaining Athletic Department or for uses outside of athletics altogether. If this is true,
40 It looks like the UABEF incurs expenses on behalf of the Athletic Department as well. To be conservative, we have continued to charge the Athletic Department for these expenses, which include the cost of equipment (valued at $335,000) and for approximately $275,000 in “other” items.
| Page 28 |
then the expenditures they cover appear to be avoided in a no-football scenario; that is, from a whole-UAB economic perspective they are not really football revenues at all. Because UAB’s ability to spend that money on other priorities would increase, in our economic analysis, we remove them from football revenue, even though UAB’s accounting credits these funds to UAB football as revenue. Therefore in what follows, one of the calculated economic benefits from eliminating football is an equivalent growth in university-wide cash equal to the redirected UABEF revenues we assume would now made available for other uses. Leaving aside the complexity of the UAB/UABEF relationship, the remaining reported financials at UAB compared with the underlying economic revenues and expenses showed that the financials are generally quite straightforward. Like other universities studied in the economic literature, UAB tends to recognize as athletic revenue the obvious categories but in some areas the accounting procedures diverge from the economic costs/benefits. In a full-blown study, we would have investigated every listed revenue and expense category on UAB’s AUP report. In this preliminary, public approach, we chose to focus on large-value categories, and/or areas where the accounting methods are inherently unable to capture relevant economic effects. An example of the latter is the fact that by design, AUP does not allow an athletic department to recognize a positive revenue effect from attracting partial scholarship athletes or walk-ons. Under certain circumstances (which seem to apply to UAB), these are revenues driven by athletics and in those circumstances should be included in an economic assessment regardless of whether they should be included for accounting purposes. “Unplugging” Institutional Support Our recast numbers do not explicitly include listed values for the revenue category of “institutional support” (either direct, indirect, or through student fees41); this is because we understand these to be “plug” entries designed to balance the books. Instead, we simply determine whether there is an excess/deficiency at the bottom line; we prefer to see whether the books balance rather than force them to balance with a plug entry.42 By doing so, we let the bottom line speak for itself and to the extent a given sport shows a deficit (once all revenues/expenses have been accounted for), then that deficit represents the cost to the university (potentially in institutional support) of sponsoring that sport. This may seem a subtle distinction, but by doing so, we believe the latter presentation makes
41 Conceptually, depending on the type of student fee, we see good reason to consider student fees to be real revenue generated by sports. If in the absence of a given sport, student fees would drop, economically that increase in university revenues is driven by the sport. However, in the specific case of UAB, the university has stated that they have no plans to change student fees regardless of whether the three sports are restored or terminated, thus we lump student fees in with other forms of institutional support.
42 Per discussions with Timothy Garner in the UAB Athletic Department (prior to termination of our project), UAB merely assigns a value to this revenue category to force the books into balance. This is a “plug” in accounting terminology. The same is true at many institutions including the authors’ USF.

| Page 29 |
clearer the trade-offs inherent in the decision to sponsor a sport, while also not taking for granted that other sources of support can be found to meet the cash-flow gap.43 To be clear, by eliminating these transfer payments, we are not somehow adding revenue to these three sports. To the contrary, we treat the so-called “subsidy” revenue line items as having zero value to UAB as a whole, since by themselves they neither add nor subtract cash from the university. This has the effect of lowering listed accounting revenues; the approximately $3.75 million in what UAB labels as direct institutional support for the three terminated sports is removed from the revenue UAB lists as being driven by those sports. This same step is taken by the NCAA when it produces its annual publication Revenues and Expenses of NCAA Division I Intercollegiate Athletics Programs (by Prof. Daniel Fulks), in which institutional support and student fees are deducted from total revenues to calculate generated revenues. However, unlike with the Fulks report, for us this removal of these revenue categories is not the end of the process. A large portion of the analysis that follows is spent working through the details of undoing the same sort of related-party transactions on the expense side, and identifying spots where real football, bowling, or rifle revenues and expenses have not been captured on the athletic department books. The NCAA adjustment is reminiscent of the myth of Pandora’s box, where at first only negative aspects were let out of the box while Hope was kept locked tightly away. The NCAA opens the box of related-party transactions enough to zero out certain revenues, but slams it shut before finishing the job, and does so in such a way that biases Athletic Department profits downward. One of major contributions here is to undertake a preliminary effort to undo that built-in bias with careful, UAB-specific research. However, performing a proper economic analysis is much more difficult than simply identifying areas where the accounting may diverge from the economic reality. Getting the answer right depends heavily on facts. One core question is whether a given scholarship athlete is, or is not, displacing a non-athlete, and what that non-athlete’s contribution to the financial health of UAB would have been. This question cannot be answered generically for all institutions. The UAB answer is likely similar to that of many other FBS schools with unmet growth targets but because FBS is a diverse community, UAB’s answer also likely differs from the answer at other FBS schools, especially those with tight admissions constraints. Getting the answer right requires access to information only university insiders have, as well as to solid market-research data on applicants’ decision-making that requires time and access to develop. In many instances throughout this report, out of necessity we have replaced that hard work with reasonable, well-developed assumptions based on our experience and past research. They are good assumptions, but even the best assumption can only approximate the institution-specific answer, driven by actual, institution-specific data. We have done our best to make very clear where this report relies on assumptions and what those assumptions are. In many cases, we’ve also laid out a path for future work to replace those assumptions with more factual bases. If one result of this report being published is that our
43 Though this report is not designed as a direct assessment of the Carr report, it is worthwhile noting that in its sport-by-sport assessments, CarrSports also made this adjustment, removing direct institutional support from revenue and focusing on it as an excess/deficit instead. (See Carr Exhibit 2,pp. 19-20) Our treatment on this point is effectively identical.
| Page 30 |
assumptions are challenged by the university and better facts are provided, we will have set up a framework to re-run our analysis with those newly provided facts. So if it turns out our outsider’s perspective has obscured certain key facts specific to UAB’s situation, we ask the reader to recognize that there is value in a solid framework for analysis, even if the inputs to that analysis aren’t perfect. As an example, UAB’s accounting almost certainly understates the cost of football by failing to assign to football any of the costs of athletes’ visits to outside medical facilities.44 We suspect some of that expense will decrease in the absence of football, but from our vantage point, we can only make an assumption about the size of that understatement. We’ve assumed that approximately half of that expense, $300,000, is better attributed to football, but if the actual data-driven answer is $200,000 or $400,000, the framework we present can accept that improved input and still provide a better answer than simply ignoring the issue altogether. In other words – the quality of our analytical framework should be viewed in isolation from the nature of our data. If the data we used (based heavily on assumptions driven by the termination of our original project) proves incorrect, the framework is not thereby invalidated; it can prove helpful to assess the same questions using better inputs. We would relish the chance to reprise this work in the future using higher quality data, should the opportunity arise. With that said, we focused our analysis on categories where we thought there was the opportunity to find divergence (positive or negative) between accounting and economics of a magnitude worth worrying about. Thus, the revenue and expense categories analyzed in this preliminary analysis45 are as follows:
44 As an aside, to the extent these hospital visits are to UAB-owned facilities, all of the same related-party accounting issues arise, making the total expense questionable. This report has not tackled that issue –we assume the listed medical costs are true expenses paid to unrelated parties and to the extent that is not completely true, our answer understates profits.
45 Often the NCAA Expense Category 30 (“Direct Facilities, Maintenance, and Rental”) is a place where artificial expenses can be generated as a means of transferring surplus from athletics to the university. Without access to insider decision makers, we have no basis to judge whether these expenses are truly variable and thus would end with the termination of the sports in question. Thus in this analysis, we’ve assumed these expenses will result in true savings, making our estimate conservative. To the extent that some or all of these expenses would continue even without the sports in question, the benefits of the keeping the sports have been understated.
| Page 31 |
Contributions from UABEF (revenue ↓; surplus ↓) NCAA/Conference/Tournament Revenues (revenue ↑; surplus ↑) Royalties for Licensed Apparel (revenue ↑; surplus ↑) Athletic Student Aid (expense ↓; surplus ↑) Coaching Salaries & Benefits (expense ↓; surplus ↑) Administrative Salaries & Benefits (expense ↑; surplus ↓) Team Travel (expense ↓; surplus ↑) Fund Raising, Marketing, & Promotion (expense ↑; surplus ↓) Spirit Groups (expense ↓; surplus ↑) Medical Expenses (expense ↑; surplus ↓) Coaching Transition Payments (expense ↓; surplus ↑)
Importantly, because our base year is 2013-14 (when the team was 2-10), we have not included an estimate of higher ticket revenues from 2014-15 in our base scenario (when the team was much more successful and finished the season 6-6). UAB has stated that 2014-15 ticket revenues grew by about 30% from the previous year, to approximately $620,000.46 While we do not include this increase in our base model, we do include it in our pro forma calculation where we also include other new revenue and expense factors not present in 2013-14: the impact of CFP playoff revenues and added expenses for COA stipends and new food allowances. Contributions (NCAA Category 4) As discussed above, it appears that the UABEF is a stand-alone philanthropic fund with broad discretion over its choice of expenditures. UABEF lists two primary sources of revenue: parking revenue and donations it receives. It then donates money back out to various UAB entities in support of its mission. To the extent the rest of the UABEF donations to athletics are just a pass-through of donations made to UABEF with the understanding that the money will be used for football, that money should be treated as football revenue. To the extent those donations are not conditioned (explicitly or implicitly) on football, and to the extent they stem from non-athletic parking revenue, it is our understanding that these dollars could be repurposed in almost any other fashion at the discretion of the university administration or a board with similar spending priorities. To the extent this understanding is correct, then these “donations” are actually more like “direct institutional support” and as with our treatment of the various support line items, we think the analysis is better
46 http://www.cbssports.com/collegefootball/writer/jon-solomon/25098025/death-of-uab-football-will-new-consultants-study-lead-to-revival
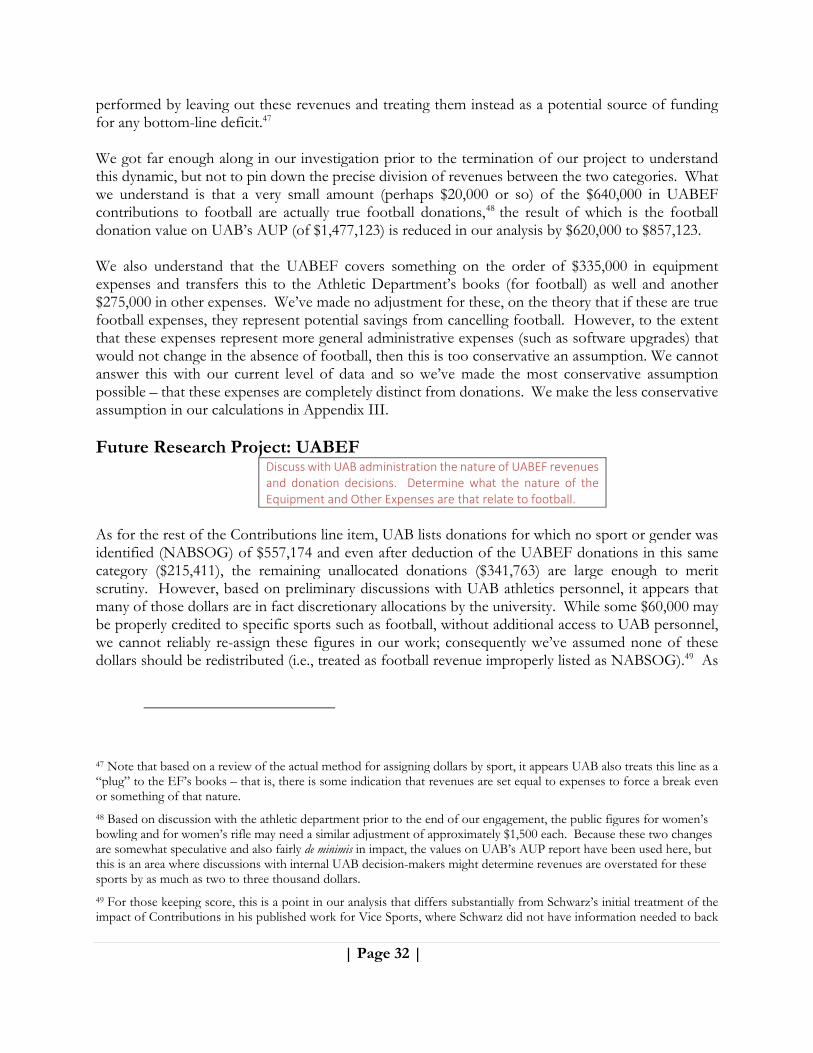
| Page 32 |
performed by leaving out these revenues and treating them instead as a potential source of funding for any bottom-line deficit.47 We got far enough along in our investigation prior to the termination of our project to understand this dynamic, but not to pin down the precise division of revenues between the two categories. What we understand is that a very small amount (perhaps $20,000 or so) of the $640,000 in UABEF contributions to football are actually true football donations,48 the result of which is the football donation value on UAB’s AUP (of $1,477,123) is reduced in our analysis by $620,000 to $857,123. We also understand that the UABEF covers something on the order of $335,000 in equipment expenses and transfers this to the Athletic Department’s books (for football) as well and another $275,000 in other expenses. We’ve made no adjustment for these, on the theory that if these are true football expenses, they represent potential savings from cancelling football. However, to the extent that these expenses represent more general administrative expenses (such as software upgrades) that would not change in the absence of football, then this is too conservative an assumption. We cannot answer this with our current level of data and so we’ve made the most conservative assumption possible – that these expenses are completely distinct from donations. We make the less conservative assumption in our calculations in Appendix III. Future Research Project: UABEF
Discuss with UAB administration the nature of UABEF revenues and donation decisions. Determine what the nature of the Equipment and Other Expenses are that relate to football.
As for the rest of the Contributions line item, UAB lists donations for which no sport or gender was identified (NABSOG) of $557,174 and even after deduction of the UABEF donations in this same category ($215,411), the remaining unallocated donations ($341,763) are large enough to merit scrutiny. However, based on preliminary discussions with UAB athletics personnel, it appears that many of those dollars are in fact discretionary allocations by the university. While some $60,000 may be properly credited to specific sports such as football, without additional access to UAB personnel, we cannot reliably re-assign these figures in our work; consequently we’ve assumed none of these dollars should be redistributed (i.e., treated as football revenue improperly listed as NABSOG).49 As
47 Note that based on a review of the actual method for assigning dollars by sport, it appears UAB also treats this line as a “plug” to the EF’s books – that is, there is some indication that revenues are set equal to expenses to force a break even or something of that nature.
48 Based on discussion with the athletic department prior to the end of our engagement, the public figures for women’s bowling and for women’s rifle may need a similar adjustment of approximately $1,500 each. Because these two changes are somewhat speculative and also fairly de minimis in impact, the values on UAB’s AUP report have been used here, but this is an area where discussions with internal UAB decision-makers might determine revenues are overstated for these sports by as much as two to three thousand dollars.
49 For those keeping score, this is a point in our analysis that differs substantially from Schwarz’s initial treatment of the impact of Contributions in his published work for Vice Sports, where Schwarz did not have information needed to back
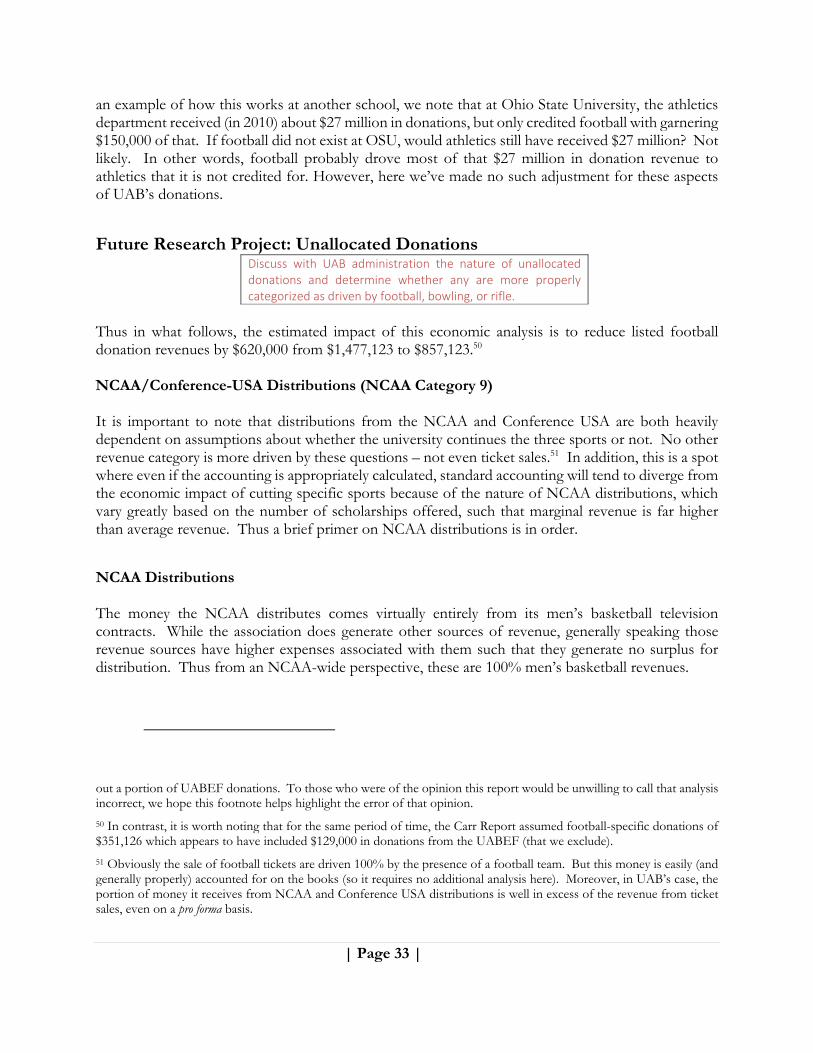
| Page 33 |
an example of how this works at another school, we note that at Ohio State University, the athletics department received (in 2010) about $27 million in donations, but only credited football with garnering $150,000 of that. If football did not exist at OSU, would athletics still have received $27 million? Not likely. In other words, football probably drove most of that $27 million in donation revenue to athletics that it is not credited for. However, here we’ve made no such adjustment for these aspects of UAB’s donations.
Future Research Project: Unallocated Donations Discuss with UAB administration the nature of unallocated donations and determine whether any are more properly categorized as driven by football, bowling, or rifle.
Thus in what follows, the estimated impact of this economic analysis is to reduce listed football donation revenues by $620,000 from $1,477,123 to $857,123.50 NCAA/Conference-USA Distributions (NCAA Category 9) It is important to note that distributions from the NCAA and Conference USA are both heavily dependent on assumptions about whether the university continues the three sports or not. No other revenue category is more driven by these questions – not even ticket sales.51 In addition, this is a spot where even if the accounting is appropriately calculated, standard accounting will tend to diverge from the economic impact of cutting specific sports because of the nature of NCAA distributions, which vary greatly based on the number of scholarships offered, such that marginal revenue is far higher than average revenue. Thus a brief primer on NCAA distributions is in order.
NCAA Distributions The money the NCAA distributes comes virtually entirely from its men’s basketball television contracts. While the association does generate other sources of revenue, generally speaking those revenue sources have higher expenses associated with them such that they generate no surplus for distribution. Thus from an NCAA-wide perspective, these are 100% men’s basketball revenues.
out a portion of UABEF donations. To those who were of the opinion this report would be unwilling to call that analysis incorrect, we hope this footnote helps highlight the error of that opinion.
50 In contrast, it is worth noting that for the same period of time, the Carr Report assumed football-specific donations of $351,126 which appears to have included $129,000 in donations from the UABEF (that we exclude).
51 Obviously the sale of football tickets are driven 100% by the presence of a football team. But this money is easily (and generally properly) accounted for on the books (so it requires no additional analysis here). Moreover, in UAB’s case, the portion of money it receives from NCAA and Conference USA distributions is well in excess of the revenue from ticket sales, even on a pro forma basis.

| Page 34 |
However, the NCAA and its members have chosen to distribute these funds through multiple sub-funds, based on at least six different formulas,52 and to an individual university, such as UAB, the drivers of these funds go beyond just basketball. Consequently, it appears that UAB accounts for large amounts of NCAA revenue as falling into the category of “Not Allocated by Sport or Gender” (NABSOG). This is likely done for simplicity and is not inappropriate for its intended use. But as shown below, it is inappropriate for determining the net change in cash in-flow from the NCAA from cancelling the sports in question. For the purpose of this analysis, there are four key sources of NCAA funding that hinge on the presence or absence of the sports in question, three direct and one indirect. The indirect one – the “Basketball Fund” are the units of revenue distributed to Conference USA on UAB’s behalf when UAB wins games in the men’s basketball tournament and/or revenues generated by other Conference USA teams that eventually reach UAB through revenue sharing by Conference USA. We isolate these dollars and address them below, under the Conference USA analysis, to avoid the risk of double counting. The three direct sources of revenue are the “Sports Sponsorship Fund,” the “Grants-in-Aid Fund,” and the “Student Assistance Fund.” The first is distributed based on a simple formula: for every sport sponsored beyond the 13th, each school receives one unit of revenue. In 2013 each unit was worth $33,200.53 UAB sponsored 18 sports (6 men’s and 12 women’s) in 2013-14, so in the absence of the three sports in question, UAB’s receipts from the NCAA would have been lower by $33,200 per sport, or $99,600.54 However, based on preliminary analysis of UAB’s accounting, the school does not assign any of this money to the football program; $33,200 is a better economic estimate than zero in this case, even if the accounting standards fully bless the characterization of these funds as NABSOG (and thus the assumption of zero football revenue), because the net impact of dropping football, bowling, and rifle will be a reduction in revenue, even if those revenues are driven by a basketball television contract. Similarly, it appears that neither bowling nor rifle receive credit for driving any revenue at all in this category, but each was responsible for an additional $33,200.55 The numbers below reflect this adjustment for each sport. The Grants-in-Aid Fund is more complex. The NCAA weighs these distributions heavily towards those schools that sponsor the most scholarships, with a heavy incentive to add scholarships above
52 https://www.ncaa.org/sites/default/files/2013-14%20Revenue%20Distribution%20Plan.pdf
53 The precise value changes annually but the magnitude is substantially similar from year to year. For analysis purposes here, we assume $33,200 is a sufficiently close estimate of the actual dollar impact.
54 “In the 2013 distribution, for sports sponsored beginning with the 14th, an institution received approximately $33,200 per sport (i.e., an institution sponsoring 16 total sports received approximately $99,600; an institution sponsoring 23 sports received approximately $332,000).” https://www.ncaa.org/sites/default/files/2013-14%20Revenue%20Distribution%20Plan.pdf
55 Note, it appears that UAB receives these payments and they are not subject to Conference USA sharing. If these revenues are shared, the direct impact of sponsoring the three sports in question would be substantially lessened – UAB would have received only 1/14 of the amount. However, as shown below, this would merely push the impact into the question of continued Conference USA membership, so for these purposes we believe the present treatment is roughly accurate, though further discussions with UAB personnel would easily resolve this question.
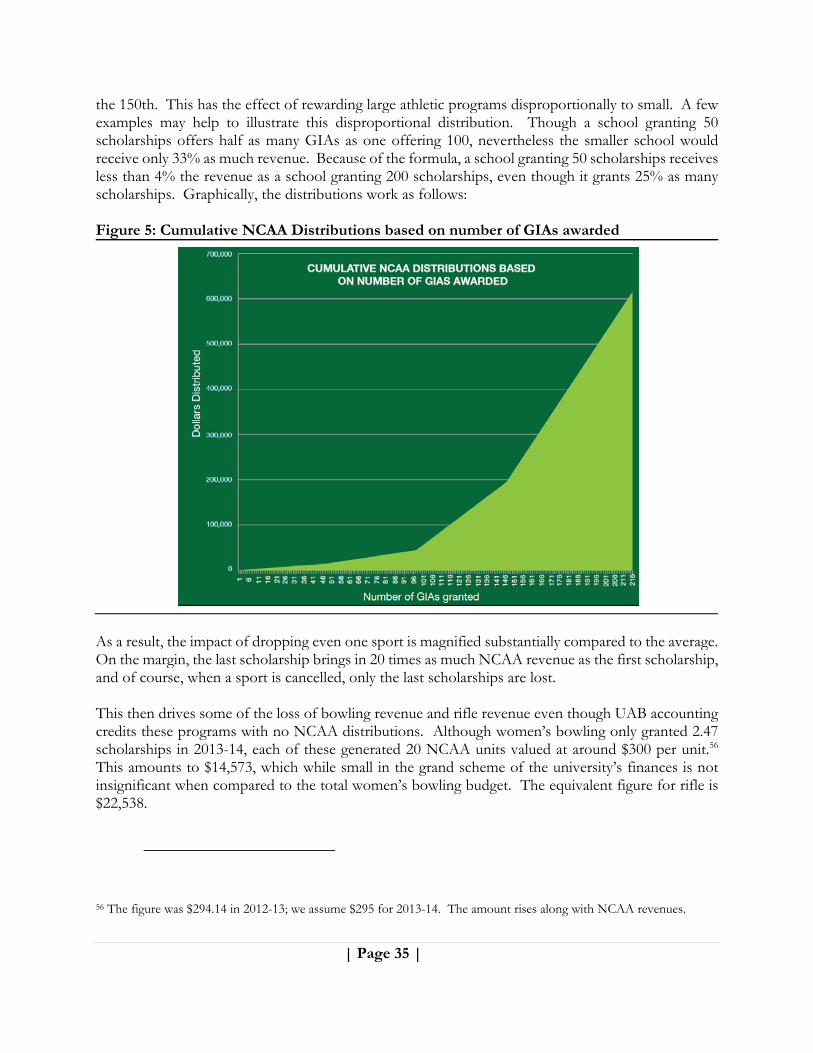
| Page 35 |
the 150th. This has the effect of rewarding large athletic programs disproportionally to small. A few examples may help to illustrate this disproportional distribution. Though a school granting 50 scholarships offers half as many GIAs as one offering 100, nevertheless the smaller school would receive only 33% as much revenue. Because of the formula, a school granting 50 scholarships receives less than 4% the revenue as a school granting 200 scholarships, even though it grants 25% as many scholarships. Graphically, the distributions work as follows: Figure 5: Cumulative NCAA Distributions based on number of GIAs awarded
As a result, the impact of dropping even one sport is magnified substantially compared to the average. On the margin, the last scholarship brings in 20 times as much NCAA revenue as the first scholarship, and of course, when a sport is cancelled, only the last scholarships are lost. This then drives some of the loss of bowling revenue and rifle revenue even though UAB accounting credits these programs with no NCAA distributions. Although women’s bowling only granted 2.47 scholarships in 2013-14, each of these generated 20 NCAA units valued at around $300 per unit.56 This amounts to $14,573, which while small in the grand scheme of the university’s finances is not insignificant when compared to the total women’s bowling budget. The equivalent figure for rifle is $22,538.
56 The figure was $294.14 in 2012-13; we assume $295 for 2013-14. The amount rises along with NCAA revenues.
| Page 36 |
The impact for football is of course much greater because the football team grants so many more scholarships – 83.16 in 2013-14. However, even without any of these sports, UAB’s total scholarships would exceed the 150 threshold needed to receive the maximum 20 units per scholarship. The result is that each of these 83.16 scholarships results in around $5,900 in additional football-driven revenue. Cancelling these GIAs will cost the university approximately $490,000. Nevertheless on UAB’s AUP, none of this revenue appears to have been assigned to these sports.57 Student Assistant Fund (SAF) money is distributed on a fairly complex basis. Most of the money is distributed per a blend of the Grants-in-Aid and Sports Sponsorship Funds formulas with additional weight placed on the number of Pell Grants awarded to each institutions’ athletes. Our understanding is that money is distributed from the NCAA directly to conferences; schools, on behalf of specific students, then apply for disbursement of specific amounts for specific uses. Thus, it is our understanding that any money a school receives from the SAF (via its conference) is supposed to be matched by an equal expenditure directly to benefit specific athletes with a need-based expense, as the NCAA describes the SAF: “Further, inasmuch as the fund is designed to provide direct benefits to student-athletes, the fund is not intended to be used to replace existing budget items.”58 To the extent that SAF money is not claimed, a conference may accumulate up to two years’ surplus, after which the money is forfeited. While we also understand that some schools in the past have directed some of these funds to somewhat dubious uses that arguably indirectly help athletes – e.g., staff computer needs – we assume for this analysis that any increase or decrease in SAF funds will be matched by an identical, and purely incremental, outflow of cash. Thus, in our analysis, we treat the SAF funds as a wash (as we think UAB does as well), immaterial to the question of financial health, because UAB’s net receipt of SAF funds should be zero in any scenario.
Conference USA Distributions According to UAB’s AUP report from 2013-14, UAB received $2,938,668 in distributions from Conference USA and the NCAA in 2013-14. Based on discussions with Athletic Department staff during the brief period of our engagement, we understand that approximately $1.4 million of this is
57 It is worth noting that in the Carr Report, it appears an effort was made to measure the football impact on these revenues. Our football figures differ from those of Carr but not substantially – this is likely based on different assumptions for the value of an NCAA unit. Carr does not appear to have accounted for the similar impact from cutting the two women’s sports, which while much smaller in magnitude, comprise a substantial portion of revenues generated by those specific sports for UAB. It is also worth noting that accounting and economics differ here specifically because of the nature of the question at hand. Assigning these specific revenues to the sports being considered for termination is the best approach for assessing the financial impact of that decision on the margin. It cannot be used for assessing the entire program because in such an analysis, no one sport is on the margin. A good analyst will recognize that in this case marginal decisions are vital and (here) football, bowling, and rifle should be treated as on the margin. Insisting that a non-marginal tool be used for a marginal decision is something neither accountants nor economists endorse.
58 Among the items the NCAA prohibits that SAF money be used for are “Salaries and Benefits, Grants-in-aid (other than summer school) for student-athletes with remaining eligibility, Capital improvements, Stipends, and Athletic development opportunities.”
See https://www.ncaa.org/sites/default/files/2013-14%20Revenue%20Distribution%20Plan.pdf, p. 18.

| Page 37 |
considered to come from Conference USA, with the rest (approximately $1.5 million) coming from NCAA distributions (albeit primarily through Conference USA). In the previous year, UAB reported $3,043,835, but curiously the corresponding Conference USA Form 990 shows that UAB received $3,297,660. This may have an innocent explanation (the timing of the fiscal years computed for each entity may differ), but this was a big enough uptick that we decided to use the Conference USA figure submitted to the IRS rather than the version UAB uses for NCAA reporting purposes. The money directly attributed to football in UAB’s public data, $919,724, comes from the Conference USA portion of the distribution. While no Conference USA money is attributed directly to women’s bowling or rifle (nor is any substantial conference revenue likely generated by these sports), around $430,000 of the money identified as coming from Conference USA is treated as NABSOG (not assigned by sport or gender).59 There are two approaches to estimating the true economic impact of losing these three sports – one is to undertake a line-item by line-item analysis and determine the actual driver of the Conference USA distributions. This, however is a complex and imprecise method and requires access to insider data and discussions. Thus, in this preliminary report, we adopt a simpler method, which is to compare, holistically, conference revenues with and without the sport – the difference is the revenue driven by these sports in aggregate.
Future Research Project: Detailed Analysis of C-USA Distributions
Discuss with UAB administration and C‐USA the precise impact on UAB’s NCAA and C‐USA distributions from cancelling the sports in question. Does UAB get 100% of its sport‐sponsorship and GIA‐driven NCAA distributions, or are those shared equally across C‐USA just like basketball fund money? Seems like C‐won’t let UAB stay without football but if it did, what will the distribution impact be?
Here the biggest question is whether Conference-USA will amend its constitution and allow UAB to remain in the Conference even without football. This is a complex inquiry that would have been manageable had promised access to Conference USA officials occurred prior to the termination of our project. Obviously, this is a project that can be undertaken, but requires UAB and Conference USA to discuss their plans with the research team. One could model an alternative where UAB remains in the conference and receives a reduced share of conference revenues, but to do so would require confidential C-USA data as to how much UAB’s distribution would be reduced. Thus, this report does not analyze this option, but this is purely due to lack of data – any full report should determine whether such an outcome is possible and if so, what the pro rata share of revenues would be.
59 Another $42,000 or so of C-USA is directly attributed to specific sports other than football.
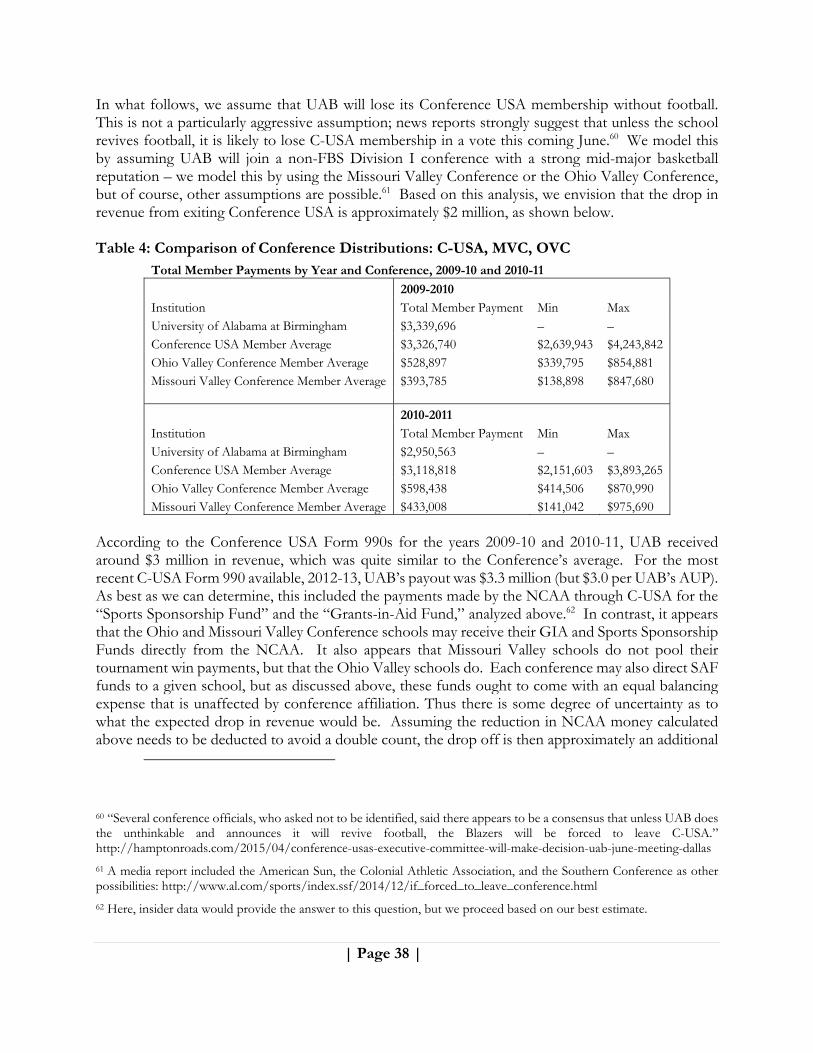
| Page 38 |
In what follows, we assume that UAB will lose its Conference USA membership without football. This is not a particularly aggressive assumption; news reports strongly suggest that unless the school revives football, it is likely to lose C-USA membership in a vote this coming June.60 We model this by assuming UAB will join a non-FBS Division I conference with a strong mid-major basketball reputation – we model this by using the Missouri Valley Conference or the Ohio Valley Conference, but of course, other assumptions are possible.61 Based on this analysis, we envision that the drop in revenue from exiting Conference USA is approximately $2 million, as shown below. Table 4: Comparison of Conference Distributions: C-USA, MVC, OVC
Total Member Payments by Year and Conference, 2009-10 and 2010-11
2009-2010
Institution Total Member Payment Min Max University of Alabama at Birmingham $3,339,696 – – Conference USA Member Average $3,326,740 $2,639,943 $4,243,842Ohio Valley Conference Member Average $528,897 $339,795 $854,881 Missouri Valley Conference Member Average $393,785 $138,898 $847,680
2010-2011
Institution Total Member Payment Min Max University of Alabama at Birmingham $2,950,563 – – Conference USA Member Average $3,118,818 $2,151,603 $3,893,265Ohio Valley Conference Member Average $598,438 $414,506 $870,990 Missouri Valley Conference Member Average $433,008 $141,042 $975,690
According to the Conference USA Form 990s for the years 2009-10 and 2010-11, UAB received around $3 million in revenue, which was quite similar to the Conference’s average. For the most recent C-USA Form 990 available, 2012-13, UAB’s payout was $3.3 million (but $3.0 per UAB’s AUP). As best as we can determine, this included the payments made by the NCAA through C-USA for the “Sports Sponsorship Fund” and the “Grants-in-Aid Fund,” analyzed above.62 In contrast, it appears that the Ohio and Missouri Valley Conference schools may receive their GIA and Sports Sponsorship Funds directly from the NCAA. It also appears that Missouri Valley schools do not pool their tournament win payments, but that the Ohio Valley schools do. Each conference may also direct SAF funds to a given school, but as discussed above, these funds ought to come with an equal balancing expense that is unaffected by conference affiliation. Thus there is some degree of uncertainty as to what the expected drop in revenue would be. Assuming the reduction in NCAA money calculated above needs to be deducted to avoid a double count, the drop off is then approximately an additional
60 “Several conference officials, who asked not to be identified, said there appears to be a consensus that unless UAB does the unthinkable and announces it will revive football, the Blazers will be forced to leave C-USA.” http://hamptonroads.com/2015/04/conference-usas-executive-committee-will-make-decision-uab-june-meeting-dallas
61 A media report included the American Sun, the Colonial Athletic Association, and the Southern Conference as other possibilities: http://www.al.com/sports/index.ssf/2014/12/if_forced_to_leave_conference.html
62 Here, insider data would provide the answer to this question, but we proceed based on our best estimate.

| Page 39 |
$1.7 million.63 To the extent that is too conservative of an assumption as to revenue that hinges on C-USA membership, we estimate the incremental impact could be as large as to $2.2 million per year.64 Our best estimate is based on using the more conservative approach, which yields an estimated loss of $1.7 million in C-USA distributions on top of the approximately $625,000 loss in NCAA distributions. Calculated exactly, this sums to a net loss of revenues of $2,327,355.65 Switching conferences would likely increase the travel costs for the sports that remain, and we estimate these added costs in the expense section below, but suffice it to say that how much more money this costs UAB depends heavily on which conference or conferences the school joins. If UAB is able to join a basketball-focused conference like the MVC (for its two basketball teams) and then join a more geographically proximate conference for other sports, those costs may be held under $500,000. If not, the costs could easily exceed $1 million. We describe this estimate below.66
Projected CFP revenue increases are not included in our base model, but are included in our forward-looking pro forma. Because we are using 2013-14 as the base year for our analysis, our base model of forgone C-USA revenue (discussed immediately above) does not take into account the change in football post-season revenue ushered in with the new College Football Playoffs (CFP). The CFP will dramatically increase C-USA’s postseason football revenue. In 2012-13, C-USA received $3,526,800 from the BCS, on top of any non-BCS Bowl revenues. In 2014-15, the first year of the new College Football Playoff, C-USA received a reported $16 million just from the new CFP Bowls. On a per-school basis,67 the impact of this change alone represents an additional approximately $890,000 that would be forgone by an exit from FBS. While we do not include this in the base model, we have provided a pro forma version that assesses the financial impact had these changes occurred in 2013-14. In this future-looking pro forma, we make additional calculations beyond our net profit/loss, to include increased ticket sales commensurate with 2014-15, an estimate for CFP revenue, and estimates for added costs from COA Stipends and Unlimited Food Allowances (discussed below).
63 The calculation is an approximation: Per the most recent public data for C-USA, 2012-13 Revenue was slightly over $3.3 million of which ~$900,000 is already accounted for on UAB’s AUP and another ~$600,000 is accounted for in the NCAA impact detailed above. That leaves an additional $1.8 million of C-USA money not accounted for. We assume that the replacement revenue for a typical MVC team not making the tournament is on the order of $100,000. The result is an additional $1.7 million net impact on conference distribution revenue.
64 In 2008, UAB actually studied the possibility of joining the MVC in a report prepared for Chancellor Portera. At the time, the loss of revenue was estimated at $1.5 million. (Portera Report, 2008, p. 11). Of course, since 2008, football revenue has grown at a much faster rate than the rest of the college sports ecosystem.
65 This figure is approximately $1 million larger than the impact assumed in the Carr report.
66 The 2008 report for Chancellor Portera also estimated these costs at $150,000 per year. This seems quite low based on the actual West Virginia experience.(Portera Report, 2008, p. 11)
67 Based on 14 schools.
| Page 40 |
Royalties on Logoed Apparel (NCAA Category 12) We understand that UAB has a licensing deal for logoed apparel that does not run through its IMG contract. Furthermore, we understand that something on the order of $70,000 per year in revenue is credited to athletics but none of that is attributed to football. Based on our preliminary discussions with the Athletic Department, we have estimated that 40% of those royalties are likely driven by football, and so we add $28,000 to football’s revenue for this category.68
Other Operating Revenues and Expenses (NCAA Categories 15 and 35)
In the 2013-14 year that forms our base case for analysis, UAB experienced far higher than normal levels of “other operating revenue” and “other operating expense.” According to UAB CFO Allan Bolton, the sharp increase in these line items was driven by the departure of then-current football coach Garrick McGee, which resulted in a one-time payment to UAB of $550,000.69 Expenses were similarly driven up by the resulting recruitment of his replacement, Bill Clark, which in turn resulted in a one-time payment from UAB of $400,00070 and estimated additional expenses (for moving expenses and the like) on the order of $350,000. Leaving this as-is assumes the difference of $200,000 is an ongoing, annual cost. Obviously, it would be a strange program which annually changed coaches71 if this was an annual event, but to call the various buy-out clauses true “one-time” events is also inconsistent with the patterns of FBS football.72 Rather that naively remove these payments as if they won’t recur, we’ve made the adjustment to assume that, on average, UAB will experience about one-third of the “one-time” net expense. That is, we’ve reduced Other Operating Income by the full $550,000 that represents McGee’s buyout and reduced Other Operating Expense by the full $750,000 associated with the hiring of Clark, but then added back in one-third of the net (that is $67,000 – approximately one-third of $200,000) to represent an ongoing average annual expense. The net impact is reflected under “Other Operating Expenses” and reflects improved cash flow of $133,000.
68 The school does have a column for royalties on its AUP report, and as best we have been able to determine, the money credited specifically to football flows from the university’s contract with IMG College. We believe this $28,000 is separate. The Carr report appears to include a similar adjustment ($21,000) at Exhibit 2, page 19.
69 See http://www.cbssports.com/collegefootball/writer/jon-solomon/25098025/death-of-uab-football-will-new-consultants-study-lead-to-revival, stating UAB received “a one-time, unbudgeted $550,000 payment from Louisville related to former football coach Garrick McGee’s buyout”
70 See http://www.al.com/sports/index.ssf/2014/01/new_uab_head_football_coach.html: “He has a buyout of $400,000, but UAB was paid $550,000 after McGee resigned on Jan. 9.”
71 Other than Arkansas State! http://espn.go.com/college-sports/recruiting/football/story/_/id/10331891/arkansas-state-keeps-recruiting-winning-new-coaches
72 Indeed, we recommend the Suzanne Vega song “Cracking” for an understanding of these charges. Ms. Vega sings “It’s a one-time thing. It just happens a lot.” See https://www.youtube.com/watch?v=gBjqtAjSYzY
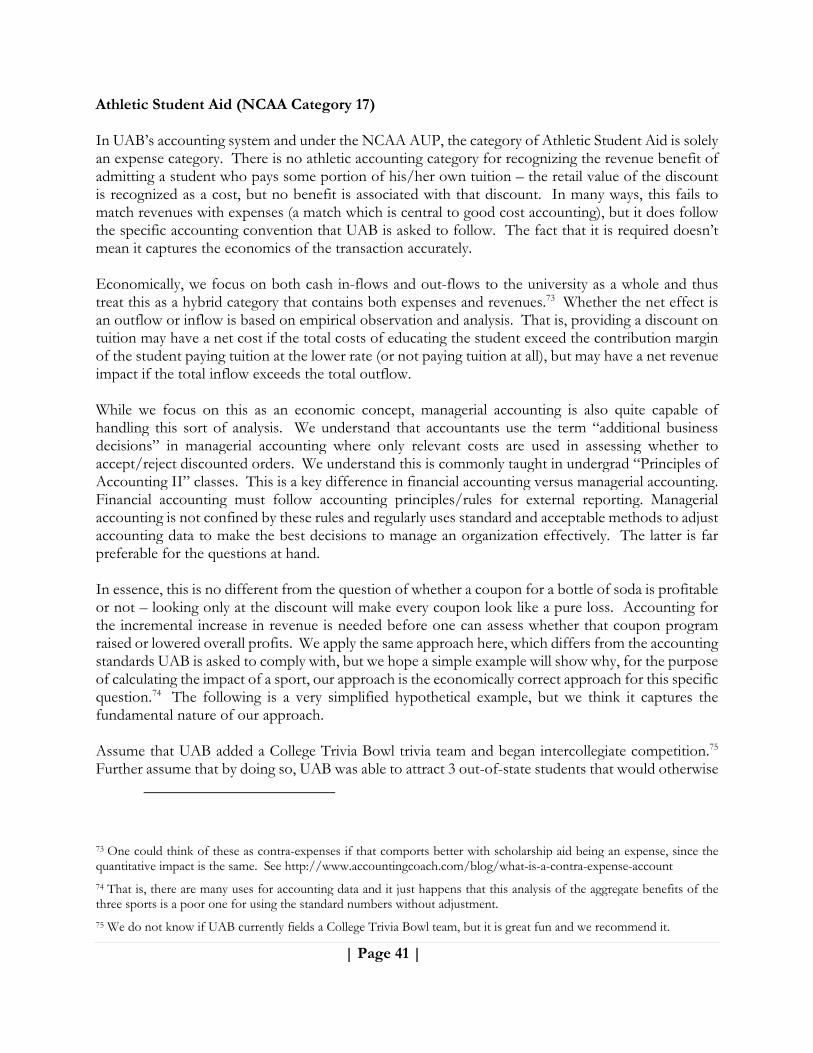
| Page 41 |
Athletic Student Aid (NCAA Category 17) In UAB’s accounting system and under the NCAA AUP, the category of Athletic Student Aid is solely an expense category. There is no athletic accounting category for recognizing the revenue benefit of admitting a student who pays some portion of his/her own tuition – the retail value of the discount is recognized as a cost, but no benefit is associated with that discount. In many ways, this fails to match revenues with expenses (a match which is central to good cost accounting), but it does follow the specific accounting convention that UAB is asked to follow. The fact that it is required doesn’t mean it captures the economics of the transaction accurately. Economically, we focus on both cash in-flows and out-flows to the university as a whole and thus treat this as a hybrid category that contains both expenses and revenues.73 Whether the net effect is an outflow or inflow is based on empirical observation and analysis. That is, providing a discount on tuition may have a net cost if the total costs of educating the student exceed the contribution margin of the student paying tuition at the lower rate (or not paying tuition at all), but may have a net revenue impact if the total inflow exceeds the total outflow. While we focus on this as an economic concept, managerial accounting is also quite capable of handling this sort of analysis. We understand that accountants use the term “additional business decisions” in managerial accounting where only relevant costs are used in assessing whether to accept/reject discounted orders. We understand this is commonly taught in undergrad “Principles of Accounting II” classes. This is a key difference in financial accounting versus managerial accounting. Financial accounting must follow accounting principles/rules for external reporting. Managerial accounting is not confined by these rules and regularly uses standard and acceptable methods to adjust accounting data to make the best decisions to manage an organization effectively. The latter is far preferable for the questions at hand. In essence, this is no different from the question of whether a coupon for a bottle of soda is profitable or not – looking only at the discount will make every coupon look like a pure loss. Accounting for the incremental increase in revenue is needed before one can assess whether that coupon program raised or lowered overall profits. We apply the same approach here, which differs from the accounting standards UAB is asked to comply with, but we hope a simple example will show why, for the purpose of calculating the impact of a sport, our approach is the economically correct approach for this specific question.74 The following is a very simplified hypothetical example, but we think it captures the fundamental nature of our approach. Assume that UAB added a College Trivia Bowl trivia team and began intercollegiate competition.75 Further assume that by doing so, UAB was able to attract 3 out-of-state students that would otherwise
73 One could think of these as contra-expenses if that comports better with scholarship aid being an expense, since the quantitative impact is the same. See http://www.accountingcoach.com/blog/what-is-a-contra-expense-account
74 That is, there are many uses for accounting data and it just happens that this analysis of the aggregate benefits of the three sports is a poor one for using the standard numbers without adjustment.
75 We do not know if UAB currently fields a College Trivia Bowl team, but it is great fun and we recommend it.
| Page 42 |
attend a college outside of Alabama, simply because of their interest in competitive trivia contests. That is, absent a discount, UAB’s revenues and costs associated with the trivia team will drop to zero. Figure 6: Example of Non-Discounted Tuition for Non-Athlete Generating No Profit
However, if UAB offers a 10% scholarship (akin to a coupon) to each of these mental “athletes,” we estimate they would pay approximately $36,000 to the University. Standard Athletic accounting would record as a “cost” the dollar value of those three 10% scholarships, $4,000, but would neither include the revenue received from their 90% payments, nor would it calculate the actual cost to the University of adding three trivia students to the UAB student body. (NOTE: In what follows, we assume the full-price for all of the elements of an education is $40,000 and for ease of explanation, we assume the marginal cost of providing those elements is $20,000. In our actual analysis, we find much lower marginal costs.) It is those latter revenues and expenses – that is, the net cash in from the students and the net cost out of providing them with educational services, that represents the benefit or cost of their tuition and financial aid. While the cost of the discount provided may represent a good estimate of the cost of providing educational services, it likely does not – certainly whatever that cost is, it does not greatly differ by whether the students are from in-state or out-of-state, and yet the accounting for this cost would differ greatly if these trivia mavens were from within Alabama. The following diagrams show why the internal transfer payment has little to do with the net cost or benefit. Figure 7: Examples of Non-Discounted and Discounted Tuition for Non-Athlete

| Page 43 |
The concept is no different if instead of College Trivia Bowl, the student’s sport is Women’s Bowling and the University levies an internal charge to cover the value of the discount.
Figure 8: Example of Discounted Tuition for Athlete

| Page 44 |
Although standard university accounting of these two transactions differs, in that in one case athletics is charged $0 and in another athletics is charged $4,000, from the university perspective the actual cash flow is identical: both the trivia maven and the lane master will pay $36,000 and receive one unit of educational services. But because only the apparent “cost” of the discount is assigned to athletics (and only for the bowler, not for the Trivia Bowl participant) and neither the true marginal revenue nor the true marginal costs are used, that specific accounting entry has little or no bearing on the actual net revenue/cost driven by providing a scholarship. On paper, the profits to central accounting have increased by $4,000 just as the costs to athletics have increased by the same amount. In reality, the institution as a whole is unaffected by a journal entry that moves the impact of the discount from one division to another. Under our economic approach, we focus on total cash in/out with and without the program. Because without the trivia team, these students would have gone elsewhere (and no revenue at all would be generated), we would value the team at a positive $36,000 less the $20,000 in (hypothetical) marginal costs – an incremental profit of $16,000 per trivia team member (i.e., $48,000 profits). Under the AUP process, the same economic activity would be valued as a $4,000 loss per student from the trivia team (i.e., a $12,000 loss), if it were housed within the Athletic Department.76
76 Our very first discussion with the Athletic Department confirmed that UAB’s accounting method specifically suffers from this specific problem that they treat increased revenue from athletes on partial scholarship as an increased cost.
| Page 45 |
This example, while perhaps trivial,77 illustrates our approach to the three sports in question with respect to the cost of athletic aid and the revenue generated through the admission of athletes. We treat the accounting for the “cost” of a scholarship with some critical suspicion and would only consider it a true cost if the economic analysis showed it to be a fair assessment of the net impact on cash flow. Generally in a university with an unmet desire to expand attendance, this will not be true.78 Thus, we look at the listed cost to athletics of a scholarship primarily as a means of estimating the net revenue to the school. (We use the aid figures to determine the list price of the scholarships given, and use that to estimate the portion paid by students.)79 We also rely on the economic literature and our own estimates for the net impact to the University of providing the goods and services inherent in an athletic scholarship. This is a second-best method; we had intended to interview University personal to make a much more precise estimate of the true cost of a scholarship.80 This, more than any other aspect of the cancelled project, would help shed light on the true cost of providing athletic scholarships at UAB, and we greatly regret that the project was cancelled just as we were poised to get answers to these specific questions. The Limitations of Using Public Data
The correct approach to unpacking the true incremental revenues and costs of providing scholarships is to look at each component of each athletes’ individual grant and assess the in-flow and/or out-flow associated with just that element. For example, if an out-of-state student receives a 25% scholarship, in theory that could cover some larger percentage of tuition/fees and 0% of the other elements of a Grant-in-Aid (room, board, and required books). Since the marginal costs of each Grant-in-Aid (GIA) component likely differ greatly, this student-by-student, component-by-component analysis is the best approach to really understanding the economic impact to UAB of providing grants-in-aid. Without cooperation from the University, in terms of access to data and also conceptual discussions with financial decision-makers, such an approach is not possible. We fall back on public data and immediately it becomes clear that the public data, by itself, cannot provide the answer as to whether a 25% scholarship means a 25% discount on each of the components of a GIA or is instead focused in one element. As a result, the first step to applying our method to public data is to divide up the listed price of a Full GIA across the various components and to assume a partial scholarship covers each component in equal proportion.
77 Pun 100% intended.
78 In contrast, at a university at full capacity, where every athlete admitted displaces another student paying full price, then the list price and the actual economic cost can align. We do not think UAB falls into this category.
79 This is a second-best method because the detailed internal data are not available to us. First best would be to work student-by-student to determine actual revenue received and whether those revenues would remain absent the sports program. Unfortunately, our engagement with the university ended just as this process was beginning.
80 However, our estimates are consistent with our understanding of the cost of instruction estimates used by the Alabama Commission on Higher Education (ACHE) in their standard calculation of recommended funding for UAB.
| Page 46 |
Future Research Project: Detailed Analysis of How Partial Scholarships Work Understand whether partial grant recipients receive an equal percentage discount on each piece, or receive a higher discount on (for example, say) tuition and a lower discount on (for example) housing.
This task is complicated by the fact that one of the largest components of a GIA, the price of tuition and fees, varies greatly based on major of study but also, more importantly, based on whether the student’s price is based on in-state or out-of-state fees. Based on public data, in-state tuition/fees average $8,900 per year while out-of-state tuition was approximately $20,400. Looking across 92 football scholarship recipients to determine what portion of the $31,868 (per UAB’s AUP) in GIA price was driven by tuition is a complicated task. However, in order to cut through this difficulty, we have made the following assumptions, again based solely on the public data related to the listed price at UAB of each component. If internal data become available, we expect the precision of this exercise will be greatly improved. Future Research Project: Analysis of How Much Each Athlete Pays to University for Partial GIA
Understand the athlete‐by‐athlete list price, discounted price, and athletics contribution. Understand the specific sub‐components of that price: price of dorm, food, books, tuition, fees. Where is summer aid included, and what are the subcomponents of summer aid?
Based on this public information, we assume that the retail price of room is based on the list price of residence in Rast Hall, and comes to an annual total of $6,200.81 We assume the price of board is based on a full plan of 19 meals per week, and comes to an annual total of $3,500,82 and that athletes receive a further $700 in cash per year to cover remaining meals. We further assume that the provided price of books per year is $1,600, based on our understanding that the required book component of the grant is capped at $800/semester; to this we have added $200 for books for summer courses. This means that within each full GIA, there are an estimated $12,200 in non-tuition components that are relatively stable regardless of the specific circumstance of the athlete.83 We then assume the rest of each student’s GIA price is an assessment of the tuition/fees component. Summer aid further complicates the process, but in the case of summer aid, as will be discussed below, most schools are not at full capacity and so the marginal cost of, say, providing housing or space in a classroom is
81 https://www.uab.edu/students/housing/residence-halls/rast-hall
82 http://www.uab.edu/students/announcements/item/1618-meal-plans-adjusted-for-fall-2015-based-on-student-feedback
83 Obviously, there is room for error here. If an athlete lives in a less expensive dorm, the room component of a GIA will be lower. If he/she lives off campus, the provided housing stipend may differ as well. This, once again, is a spot where a small amount of access to the internal data would go a long way to resolving these issues.

| Page 47 |
usually quite low. Nevertheless, because the data do not let us be precise, these estimates are inherently approximate and should be used as such.84 With those caveats in mind, the first step then is to determine the list price per scholarship athlete for each of the sports in question and then to estimate the price of each component based on the assumptions laid out above. The prices for the three sports (and a few other comparison points) are as follows: Table 5: Average level of GIA for Selected UAB Sports (per UAB’s 2013-14 AUP)
Sport Total Dollars
Total Equivalencies
Total Recipients
Dollars/Equiv.
Dollars/Recipient Average GIA %
Football 2,650,160 83.16 92 31,868 28,806 90.4%
MBB 406,347 13.42 14 30,279 29,025 95.9%
Baseball 318,444 12.48 27 25,516 11,794 46.2%
WBB 492,174 15 15 32,812 32,812 100.0%
Bowling 97,348 2.47 8 39,412 12,169 30.9%
Women’s Golf 145,415 4.79 7 30,358 20,774 68.4%
Rifle 76,011 3.82 9 19,898 8,446 42.4%
Sand VB 80,900 2 2 40,450 40,450 100.0%
Women’s Soccer 408,218 14.3 27 28,547 15,119 53.0%
As for the list price of each scholarship provided, the nature of the public data is good but not ideal. UAB’s AUP report to the NCAA provides three key data points: (1) the number of athletes receiving some form of athletic aid, (2) the full GIA equivalent of that aid (i.e., how many athletes (or fractions of an athlete) would have gotten aid if every scholarship had been 100%) and (3) the dollar amount of the aid, at full list price. For the last of these three, discussions with the athletic department made us aware that the department receives a bill for each athlete equal to the actual full tuition charge for that athlete, multiplied by the fraction of the scholarship covered. The bill itself can vary widely based on whether the athlete is from in- or out-of-state, whether he/she attends summer school or not, and based on the student’s major, as UAB prices tuition differently across different majors. Meaning if a team consists of three out of state and one in-state scholarship athletes and all received a full GIA, the total amount would be equal to three times the list price for out of state students for each component of the GIA, plus one times the price for those same components for an in-state student. Thus the aggregate list price is simply a sum of each athlete’s specific list-price amount.85
84 The Carr report provides some insight into the relative mix of regular and summer support. According to Carr, in 2013-14, summer aid for football was budgeted at 15% of total athletic aid, and, as best can be determined, 0% for bowling and rifle. Summer aid comes with low opportunity costs, such that treating summer components like fall/spring tuition is likely a good approximation.
85 This helps explain why two different teams can show very different costs per student equivalent for their athletic aid, as illustrated in the 2013-14 data used in the table above.
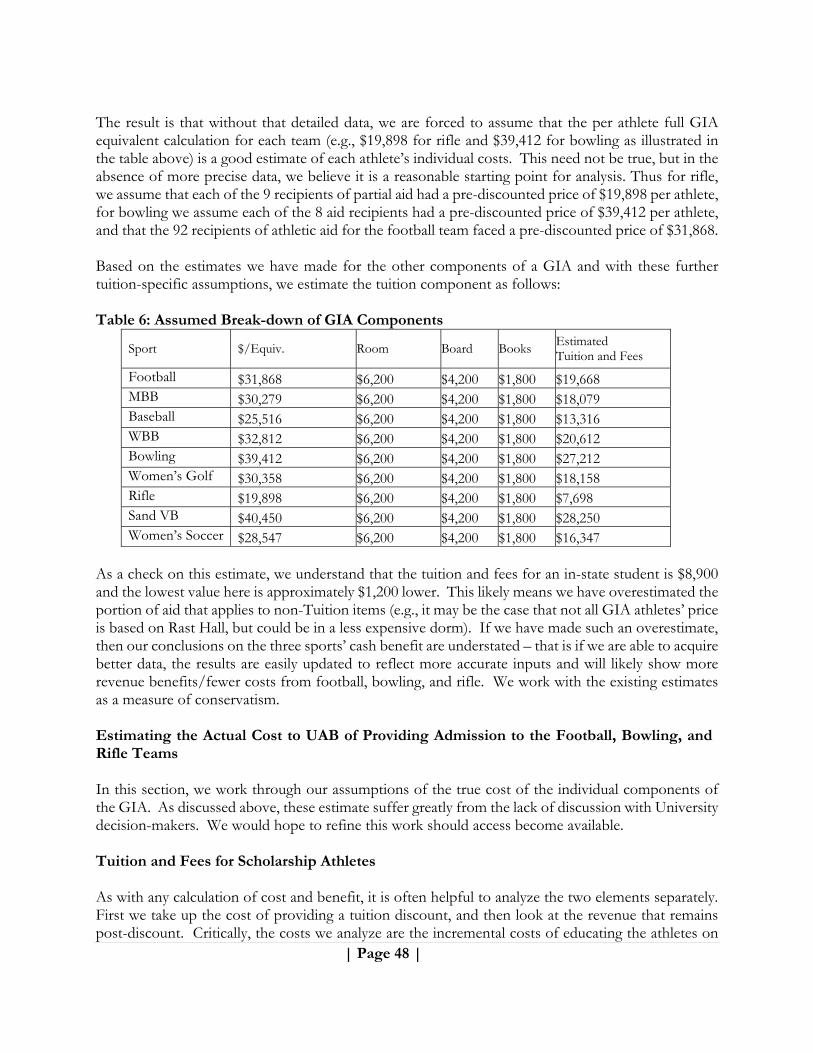
| Page 48 |
The result is that without that detailed data, we are forced to assume that the per athlete full GIA equivalent calculation for each team (e.g., $19,898 for rifle and $39,412 for bowling as illustrated in the table above) is a good estimate of each athlete’s individual costs. This need not be true, but in the absence of more precise data, we believe it is a reasonable starting point for analysis. Thus for rifle, we assume that each of the 9 recipients of partial aid had a pre-discounted price of $19,898 per athlete, for bowling we assume each of the 8 aid recipients had a pre-discounted price of $39,412 per athlete, and that the 92 recipients of athletic aid for the football team faced a pre-discounted price of $31,868. Based on the estimates we have made for the other components of a GIA and with these further tuition-specific assumptions, we estimate the tuition component as follows:
Table 6: Assumed Break-down of GIA Components
Sport $/Equiv. Room Board Books Estimated Tuition and Fees
Football $31,868 $6,200 $4,200 $1,800 $19,668 MBB $30,279 $6,200 $4,200 $1,800 $18,079 Baseball $25,516 $6,200 $4,200 $1,800 $13,316 WBB $32,812 $6,200 $4,200 $1,800 $20,612 Bowling $39,412 $6,200 $4,200 $1,800 $27,212 Women’s Golf $30,358 $6,200 $4,200 $1,800 $18,158 Rifle $19,898 $6,200 $4,200 $1,800 $7,698 Sand VB $40,450 $6,200 $4,200 $1,800 $28,250 Women’s Soccer $28,547 $6,200 $4,200 $1,800 $16,347
As a check on this estimate, we understand that the tuition and fees for an in-state student is $8,900 and the lowest value here is approximately $1,200 lower. This likely means we have overestimated the portion of aid that applies to non-Tuition items (e.g., it may be the case that not all GIA athletes’ price is based on Rast Hall, but could be in a less expensive dorm). If we have made such an overestimate, then our conclusions on the three sports’ cash benefit are understated – that is if we are able to acquire better data, the results are easily updated to reflect more accurate inputs and will likely show more revenue benefits/fewer costs from football, bowling, and rifle. We work with the existing estimates as a measure of conservatism. Estimating the Actual Cost to UAB of Providing Admission to the Football, Bowling, and Rifle Teams In this section, we work through our assumptions of the true cost of the individual components of the GIA. As discussed above, these estimate suffer greatly from the lack of discussion with University decision-makers. We would hope to refine this work should access become available.
Tuition and Fees for Scholarship Athletes As with any calculation of cost and benefit, it is often helpful to analyze the two elements separately. First we take up the cost of providing a tuition discount, and then look at the revenue that remains post-discount. Critically, the costs we analyze are the incremental costs of educating the athletes on
| Page 49 |
these teams (that is, marginal cost), rather than costs that allocate some element of fixed costs that would remain with or without the three sports in question.
Costs Associated with Tuition and Fees The marginal cost of providing full or partial tuition remission depends greatly on what would happen to that “slot” if the grant wasn’t given. Would the athlete him/herself stay and pay? Would he/she pay full price or some reduced amount? Instead, would the school offer that slot to someone else? Would the replacement student pay the full price used to calculate the value of a GIA, or would university-provided non-athletic aid to reduce the price? Would the slot go unused entirely? If the school is not turning away academically qualified non-athletes and the athlete him/herself would go elsewhere, then the potential savings from cancelling a scholarship drop to the marginal impact of a student on overall costs, which is very low because of the fixed cost aspect of running a university. Moreover, for sports with partial scholarships (like rifle and bowling), the cost savings may be more than offset by the lost partial tuition payment by the athlete on a partial scholarship. That is, under conditions similar to those at UAB, the “savings” from cancelling the partial scholarship of an athlete may actually be negative, costing the university money rather than saving any. As with all components of a GIA, the answer to this question is an empirical one, relying on data. However, even though we are forced to rely on the public data available for UAB, we believe this is a spot where accounting costs and marginal costs likely differ substantially.
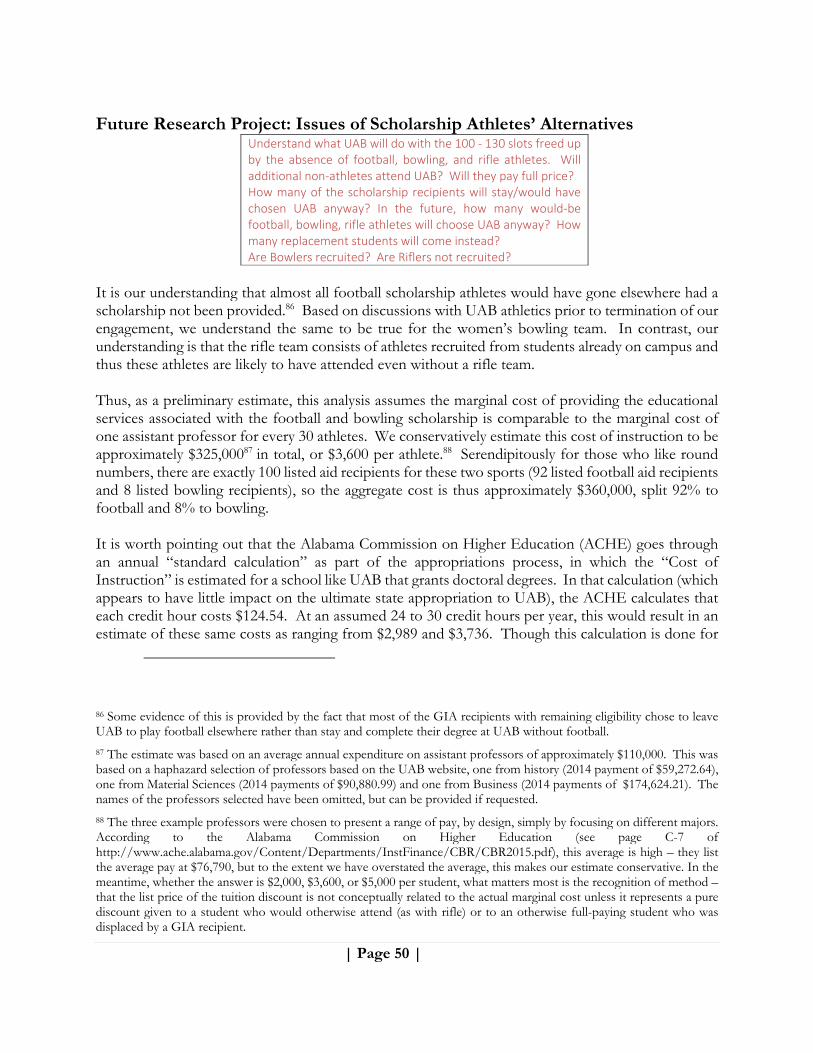
| Page 50 |
Future Research Project: Issues of Scholarship Athletes’ Alternatives
Understand what UAB will do with the 100 ‐ 130 slots freed up by the absence of football, bowling, and rifle athletes. Will additional non‐athletes attend UAB? Will they pay full price? How many of the scholarship recipients will stay/would have chosen UAB anyway? In the future, how many would‐be football, bowling, rifle athletes will choose UAB anyway? How many replacement students will come instead? Are Bowlers recruited? Are Riflers not recruited?
It is our understanding that almost all football scholarship athletes would have gone elsewhere had a scholarship not been provided.86 Based on discussions with UAB athletics prior to termination of our engagement, we understand the same to be true for the women’s bowling team. In contrast, our understanding is that the rifle team consists of athletes recruited from students already on campus and thus these athletes are likely to have attended even without a rifle team. Thus, as a preliminary estimate, this analysis assumes the marginal cost of providing the educational services associated with the football and bowling scholarship is comparable to the marginal cost of one assistant professor for every 30 athletes. We conservatively estimate this cost of instruction to be approximately $325,00087 in total, or $3,600 per athlete.88 Serendipitously for those who like round numbers, there are exactly 100 listed aid recipients for these two sports (92 listed football aid recipients and 8 listed bowling recipients), so the aggregate cost is thus approximately $360,000, split 92% to football and 8% to bowling. It is worth pointing out that the Alabama Commission on Higher Education (ACHE) goes through an annual “standard calculation” as part of the appropriations process, in which the “Cost of Instruction” is estimated for a school like UAB that grants doctoral degrees. In that calculation (which appears to have little impact on the ultimate state appropriation to UAB), the ACHE calculates that each credit hour costs $124.54. At an assumed 24 to 30 credit hours per year, this would result in an estimate of these same costs as ranging from $2,989 and $3,736. Though this calculation is done for
86 Some evidence of this is provided by the fact that most of the GIA recipients with remaining eligibility chose to leave UAB to play football elsewhere rather than stay and complete their degree at UAB without football.
87 The estimate was based on an average annual expenditure on assistant professors of approximately $110,000. This was based on a haphazard selection of professors based on the UAB website, one from history (2014 payment of $59,272.64), one from Material Sciences (2014 payments of $90,880.99) and one from Business (2014 payments of $174,624.21). The names of the professors selected have been omitted, but can be provided if requested.
88 The three example professors were chosen to present a range of pay, by design, simply by focusing on different majors. According to the Alabama Commission on Higher Education (see page C-7 of http://www.ache.alabama.gov/Content/Departments/InstFinance/CBR/CBR2015.pdf), this average is high – they list the average pay at $76,790, but to the extent we have overstated the average, this makes our estimate conservative. In the meantime, whether the answer is $2,000, $3,600, or $5,000 per student, what matters most is the recognition of method – that the list price of the tuition discount is not conceptually related to the actual marginal cost unless it represents a pure discount given to a student who would otherwise attend (as with rifle) or to an otherwise full-paying student who was displaced by a GIA recipient.

| Page 51 |
different purposes, it provides a form of reasonableness check on our assumption that $3,600 is a solid estimate. For rifle, the net incremental cost is equal to the listed amount of financial aid (which we discuss immediately below), which was $29,407 across nine athletes, or $3,267 per athlete. Understanding this distinction and why a rifle scholarship has much higher cash-flow impact than a football scholarship (because rifle athletes are assumed to attend with or without the inducement of a GIA and thus only for them is their discount an actual cost) is critical to understanding the difference between accounting standards and actual value impact. Revenues Associated with Tuition and Fees Our estimated list price of each scholarship provided has been discussed in great detail above. We repeat the results here for ease of reading, but refer the reader to the fuller analysis above. Table 7: Estimated List-Price of Tuition by Sport
Sport Estimated Tuition and Fees
Football $19,668
Bowling $27,212
Rifle $7,698
The average football player received a discount (in the form of a GIA) of 90.4% (based on an average list-price for tuition and fees of $19,668). Thus, our best estimate for the sort of “co-pay” those football scholarship athletes paid in to UAB is equal to 9.6% of the estimated full tuition price, which over 92 football aid recipients comes to an estimated total of $173,867.89 For Bowling, across 8 women, the revenue-in was $150,483 and for rifle the value is zero, not because a calculation cannot be performed (it can – it sums to $39,876), but because, as discussed above, this report assumes these revenues would persist even in the absence of the rifle, based on our understanding that rifle athletes are not recruited, but instead are encouraged to join the team after the admission/acceptance decision. With the estimated costs and revenues from providing tuition assistance to athletes on the three teams, we can now assess the net cost or benefit of providing 89.45 scholarships across 109 recipients:
89 92 athletes * $19,668 * 9.6% = $173,867.
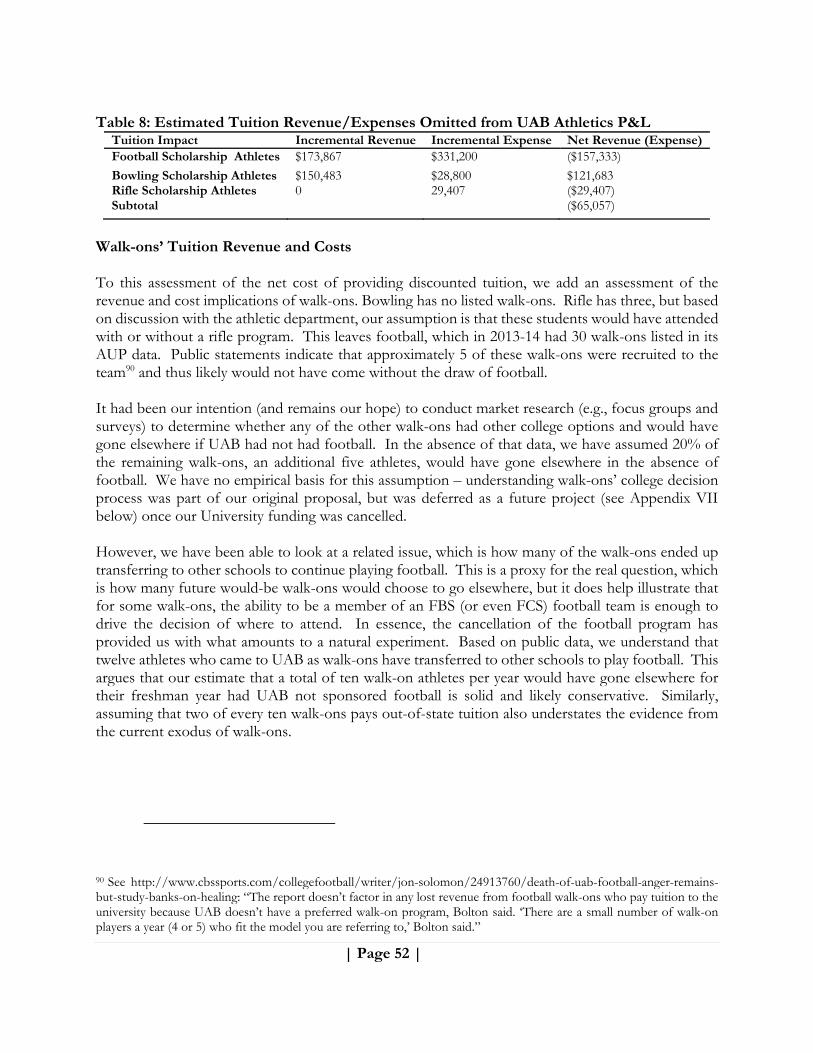
| Page 52 |
Table 8: Estimated Tuition Revenue/Expenses Omitted from UAB Athletics P&L
Tuition Impact Incremental Revenue Incremental Expense Net Revenue (Expense)Football Scholarship Athletes $173,867 $331,200 ($157,333)
Bowling Scholarship Athletes $150,483 $28,800 $121,683 Rifle Scholarship Athletes 0 29,407 ($29,407) Subtotal ($65,057)
Walk-ons’ Tuition Revenue and Costs To this assessment of the net cost of providing discounted tuition, we add an assessment of the revenue and cost implications of walk-ons. Bowling has no listed walk-ons. Rifle has three, but based on discussion with the athletic department, our assumption is that these students would have attended with or without a rifle program. This leaves football, which in 2013-14 had 30 walk-ons listed in its AUP data. Public statements indicate that approximately 5 of these walk-ons were recruited to the team90 and thus likely would not have come without the draw of football. It had been our intention (and remains our hope) to conduct market research (e.g., focus groups and surveys) to determine whether any of the other walk-ons had other college options and would have gone elsewhere if UAB had not had football. In the absence of that data, we have assumed 20% of the remaining walk-ons, an additional five athletes, would have gone elsewhere in the absence of football. We have no empirical basis for this assumption – understanding walk-ons’ college decision process was part of our original proposal, but was deferred as a future project (see Appendix VII below) once our University funding was cancelled. However, we have been able to look at a related issue, which is how many of the walk-ons ended up transferring to other schools to continue playing football. This is a proxy for the real question, which is how many future would-be walk-ons would choose to go elsewhere, but it does help illustrate that for some walk-ons, the ability to be a member of an FBS (or even FCS) football team is enough to drive the decision of where to attend. In essence, the cancellation of the football program has provided us with what amounts to a natural experiment. Based on public data, we understand that twelve athletes who came to UAB as walk-ons have transferred to other schools to play football. This argues that our estimate that a total of ten walk-on athletes per year would have gone elsewhere for their freshman year had UAB not sponsored football is solid and likely conservative. Similarly, assuming that two of every ten walk-ons pays out-of-state tuition also understates the evidence from the current exodus of walk-ons.
90 See http://www.cbssports.com/collegefootball/writer/jon-solomon/24913760/death-of-uab-football-anger-remains-but-study-banks-on-healing: “The report doesn’t factor in any lost revenue from football walk-ons who pay tuition to the university because UAB doesn’t have a preferred walk-on program, Bolton said. ‘There are a small number of walk-on players a year (4 or 5) who fit the model you are referring to,’ Bolton said.”
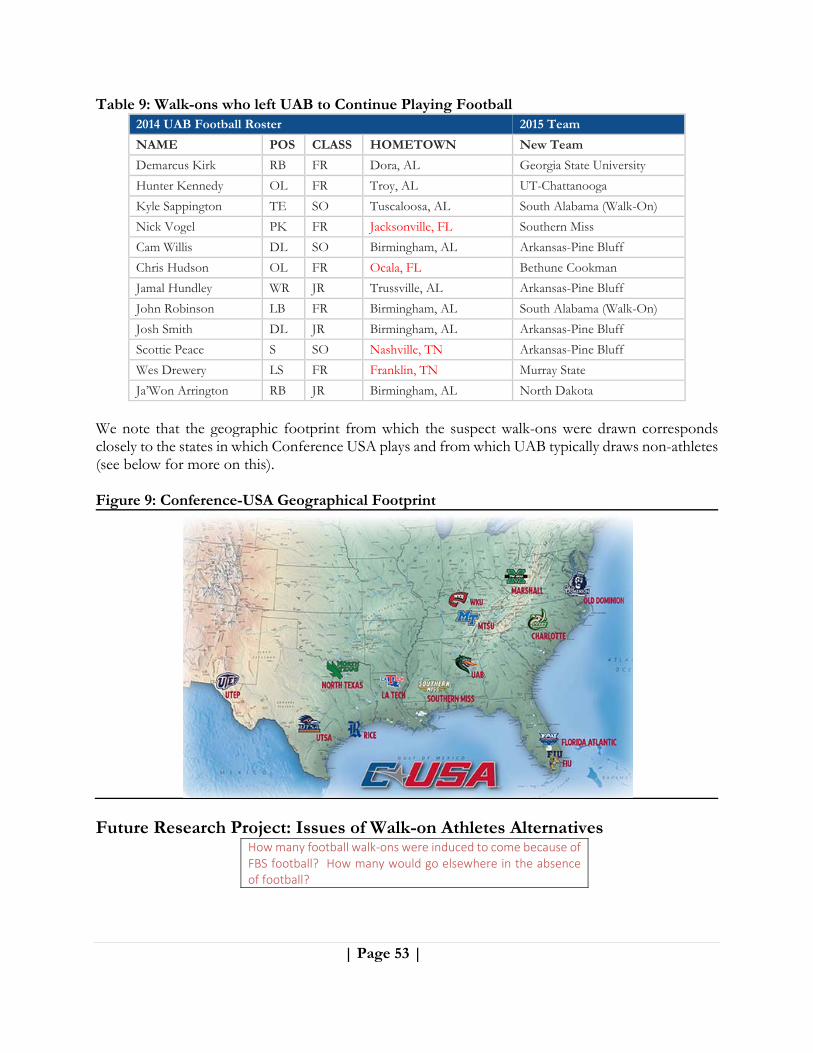
| Page 53 |
Table 9: Walk-ons who left UAB to Continue Playing Football 2014 UAB Football Roster 2015 Team
NAME POS CLASS HOMETOWN New Team
Demarcus Kirk RB FR Dora, AL Georgia State University
Hunter Kennedy OL FR Troy, AL UT-Chattanooga
Kyle Sappington TE SO Tuscaloosa, AL South Alabama (Walk-On)
Nick Vogel PK FR Jacksonville, FL Southern Miss
Cam Willis DL SO Birmingham, AL Arkansas-Pine Bluff
Chris Hudson OL FR Ocala, FL Bethune Cookman
Jamal Hundley WR JR Trussville, AL Arkansas-Pine Bluff
John Robinson LB FR Birmingham, AL South Alabama (Walk-On)
Josh Smith DL JR Birmingham, AL Arkansas-Pine Bluff
Scottie Peace S SO Nashville, TN Arkansas-Pine Bluff
Wes Drewery LS FR Franklin, TN Murray State
Ja’Won Arrington RB JR Birmingham, AL North Dakota
We note that the geographic footprint from which the suspect walk-ons were drawn corresponds closely to the states in which Conference USA plays and from which UAB typically draws non-athletes (see below for more on this).
Figure 9: Conference-USA Geographical Footprint
Future Research Project: Issues of Walk-on Athletes Alternatives How many football walk‐ons were induced to come because of FBS football? How many would go elsewhere in the absence of football?
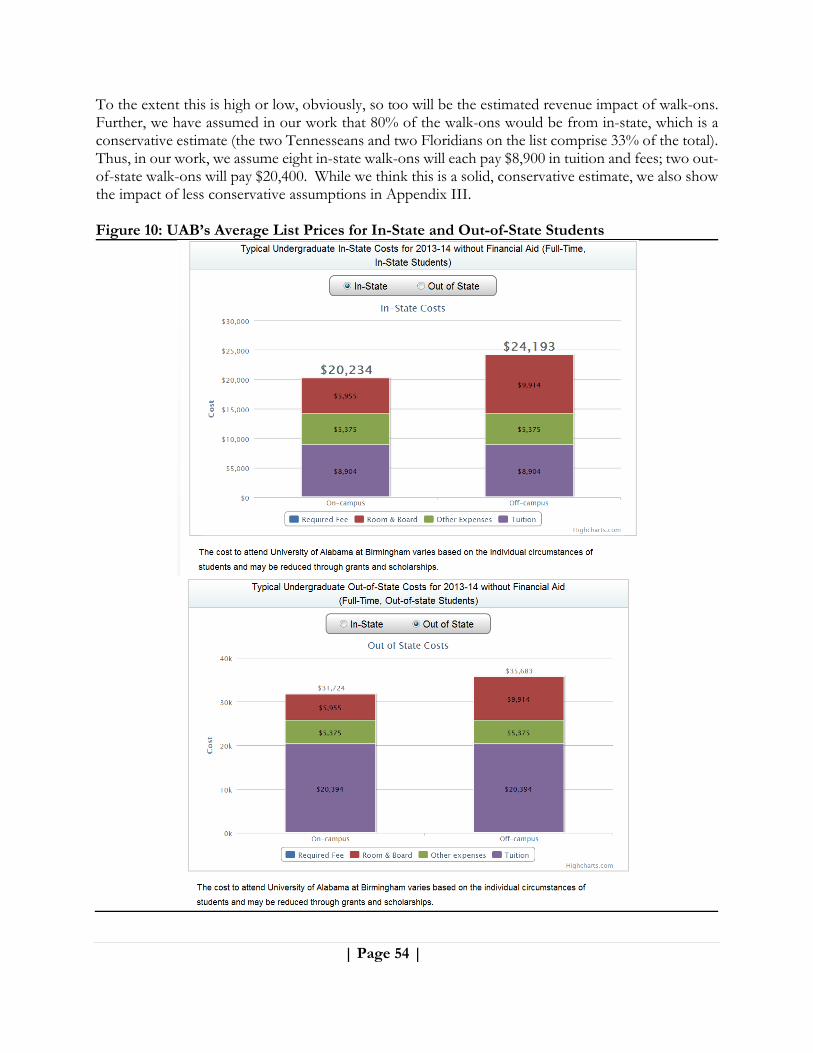
| Page 54 |
To the extent this is high or low, obviously, so too will be the estimated revenue impact of walk-ons. Further, we have assumed in our work that 80% of the walk-ons would be from in-state, which is a conservative estimate (the two Tennesseans and two Floridians on the list comprise 33% of the total). Thus, in our work, we assume eight in-state walk-ons will each pay $8,900 in tuition and fees; two out-of-state walk-ons will pay $20,400. While we think this is a solid, conservative estimate, we also show the impact of less conservative assumptions in Appendix III. Figure 10: UAB’s Average List Prices for In-State and Out-of-State Students
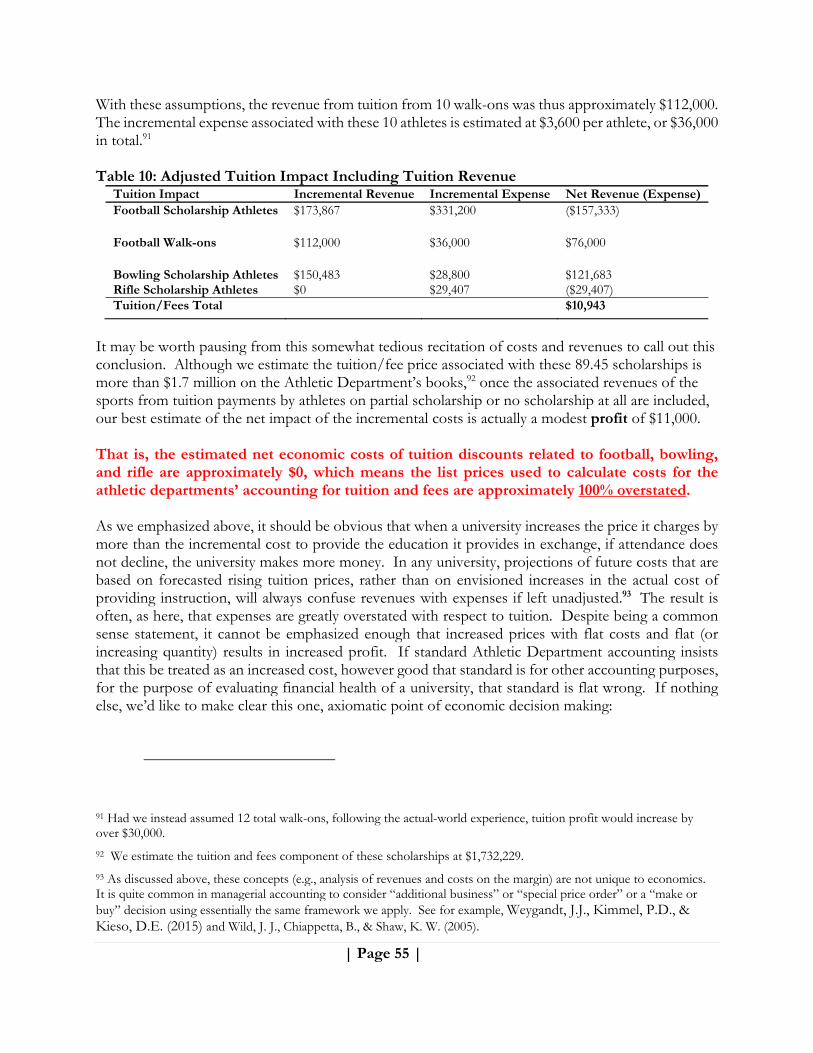
| Page 55 |
With these assumptions, the revenue from tuition from 10 walk-ons was thus approximately $112,000. The incremental expense associated with these 10 athletes is estimated at $3,600 per athlete, or $36,000 in total.91 Table 10: Adjusted Tuition Impact Including Tuition Revenue
Tuition Impact Incremental Revenue Incremental Expense Net Revenue (Expense)Football Scholarship Athletes $173,867 $331,200 ($157,333)
Football Walk-ons $112,000 $36,000 $76,000
Bowling Scholarship Athletes $150,483 $28,800 $121,683 Rifle Scholarship Athletes $0 $29,407 ($29,407) Tuition/Fees Total $10,943
It may be worth pausing from this somewhat tedious recitation of costs and revenues to call out this conclusion. Although we estimate the tuition/fee price associated with these 89.45 scholarships is more than $1.7 million on the Athletic Department’s books,92 once the associated revenues of the sports from tuition payments by athletes on partial scholarship or no scholarship at all are included, our best estimate of the net impact of the incremental costs is actually a modest profit of $11,000. That is, the estimated net economic costs of tuition discounts related to football, bowling, and rifle are approximately $0, which means the list prices used to calculate costs for the athletic departments’ accounting for tuition and fees are approximately 100% overstated. As we emphasized above, it should be obvious that when a university increases the price it charges by more than the incremental cost to provide the education it provides in exchange, if attendance does not decline, the university makes more money. In any university, projections of future costs that are based on forecasted rising tuition prices, rather than on envisioned increases in the actual cost of providing instruction, will always confuse revenues with expenses if left unadjusted.93 The result is often, as here, that expenses are greatly overstated with respect to tuition. Despite being a common sense statement, it cannot be emphasized enough that increased prices with flat costs and flat (or increasing quantity) results in increased profit. If standard Athletic Department accounting insists that this be treated as an increased cost, however good that standard is for other accounting purposes, for the purpose of evaluating financial health of a university, that standard is flat wrong. If nothing else, we’d like to make clear this one, axiomatic point of economic decision making:
91 Had we instead assumed 12 total walk-ons, following the actual-world experience, tuition profit would increase by over $30,000.
92 We estimate the tuition and fees component of these scholarships at $1,732,229.
93 As discussed above, these concepts (e.g., analysis of revenues and costs on the margin) are not unique to economics. It is quite common in managerial accounting to consider “additional business” or “special price order” or a “make or buy” decision using essentially the same framework we apply. See for example, Weygandt, J.J., Kimmel, P.D., & Kieso, D.E. (2015) and Wild, J. J., Chiappetta, B., & Shaw, K. W. (2005).
| Page 56 |
If the interpretation of standard accounting information can’t properly distinguish between improved revenues and increased expenses, do not rely on it to make important financial decisions correctly.
If Coca-Cola raised prices on soda and then gave some portion of the customers a coupon to bring their net price back where it previously had been, there is no net expense associated with those coupons – the net price is unchanged. For those customers who get a smaller coupon that does not cover the full increase, or no coupon at all, the price increase is profitable to Coca-Cola if it does not decrease the quantity demanded. In a tuition increase scenario, Athletic Department accounting focuses on the face value of the coupons, and not on the net cash increase it generates. Any report that makes this fundamental error should be viewed with extreme suspicion and very likely should be disregarded. With that said, tuition is not the only component of a GIA and in the case of the other components (Room, Board, and Books) there are typically greater hard costs such that this particular disconnect is less dramatic. Tuition at a school like UAB just happens to be a spot where the economics and the accounting standard diverge the most: slack capacity and low opportunity costs result in real costs that are far lower than standard accounting costs. As will be seen below, for other components of cost, the gap between the accounting and the economics is not nearly as large.
Room The marginal cost of a dorm room to UAB is heavily dependent on university-specific facts. If a school has built new dorm facilities with the expectation of future growth (which we understand to be the case at UAB) and in the short- to medium-term, these dorms are not at capacity (which we also suspect may be the case), the marginal cost of providing space to an athlete may be close to zero. In contrast, if the school is chronically at or over-capacity (which we understand was the case prior to the new dorms coming on line), and every dorm room is full, then each bed that goes to an athlete potentially represents the loss of dorm revenue that would be earned if that bed were instead available for sale to the general student body. Complicating things, schools often can have space constraints for freshman but not for upperclassmen. This may mean that while something like 100 athletes receive a bed as part of a grant in aid, only 25-30 of those (the freshmen) are actually displacing a paying non-athlete. The analysis may also be complicated if upperclassmen athletes are required to live in a dorm (we understand this may be the case for athletes with lower GPA’s, as a means of ensuring better access to on-campus educational support) and that requirement (or strong suggestion) results in walk-ons (who might otherwise live off campus) paying for surplus upperclassman housing that would otherwise be unoccupied.
| Page 57 |
Finally, if athletes live off campus and receive a monthly stipend for housing, then that cost is best measured simply as the amount paid out.94 Future Research Project: Housing Details
Does UAB have excess dorm capacity for freshmen? For upperclassmen? Will that change when the new dorms are opened? How long will any slack capacity last? Where do walk‐ons choose to live? Is there slack housing capacity in summer? Do athletes live on campus in summer? Could they? What is the actual list price of housing charged to athletics on an athlete by athlete basis? How about in summer?
Based on information posted on the UAB website, our understanding is that UAB’s residential housing has been at full capacity for the last four years, but that starting in 2015, space will increase by approximately 33%, growing from 2,180 to over 2,880 beds.95 However, while we are unaware of whether the University forecasts that additional capacity will be immediately filled, we believe some slack capacity may exist for the first few years. Nevertheless, the calculations that follow assume the new dorms will also immediately be filled to capacity; to the extent that is not true, our calculations overstate the opportunity costs associated with athletic scholarships, and thus understate the profitability of the sports in question. To ballpark the impact of this assumption, in Appendix III we provide an alternative calculation that lowers the opportunity cost of housing by $600 per year per room. These are easily answered questions, but they rely heavily on knowledge and data internal to UAB. In the absence of these data, we fall back on a very conservative assumption based on the economic literature which says that of all of the components of a GIA, the room component is most likely to involve the loss of revenue due to capacity constraints. Thus for this analysis we assume that the listed price of room for an athlete, which we have estimated at $6,200,96 is also the exact amount of revenue that could be earned if the athlete had not occupied the bed. Thus, for the 89.45 scholarship equivalents, the cost (in forgone revenue) is $554,590.97 There is no revenue benefit (despite the payments by partial scholarship recipients or walk-ons) because in the absence of the athlete, this analysis assumes the full payment would be made by a non-athlete.
94 We assume the housing stipend is equal to the cost of the Rast Hall; that is $6,200 per year.
95 “The new Freshman Residence Hall, scheduled to open for the fall 2015 semester, will help meet increased demand for on-campus housing, which has been filled to capacity for the last four years. The proposed plans will allow more than 700 students to join the 2,180 students housed in UAB’s five other residence halls” from https://www.uab.edu/news/facilities/item/5890
96 $6,200 is two times the list price of a semester of dorm space in Rast Hall. https://www.uab.edu/students/housing/residence-halls/rast-hall. Based on our discussions with the athletic department, our understanding is that all underclassmen athletes live in Rast Hall and that any upperclassman with a GPA less than 2.5 also must live in this dorm
97 This is split across the three sports as follows: $515,592 for football, $15,314 for bowling, and $23,684 for rifle.
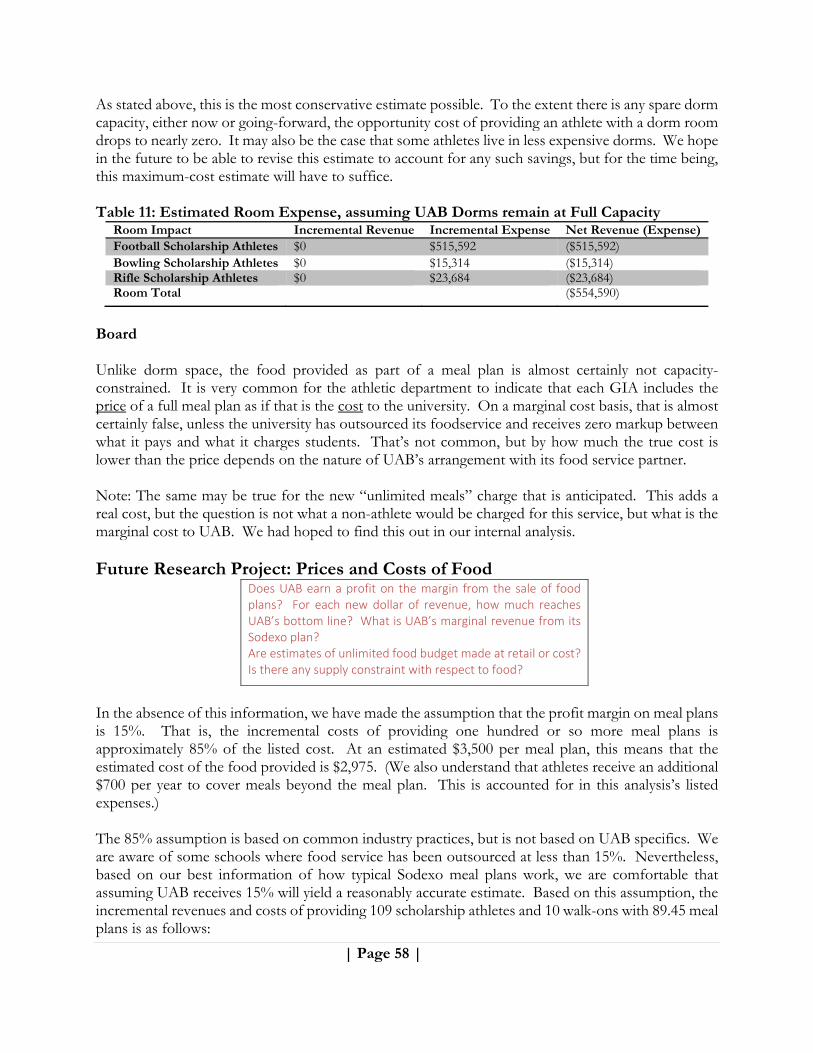
| Page 58 |
As stated above, this is the most conservative estimate possible. To the extent there is any spare dorm capacity, either now or going-forward, the opportunity cost of providing an athlete with a dorm room drops to nearly zero. It may also be the case that some athletes live in less expensive dorms. We hope in the future to be able to revise this estimate to account for any such savings, but for the time being, this maximum-cost estimate will have to suffice.
Table 11: Estimated Room Expense, assuming UAB Dorms remain at Full Capacity
Room Impact Incremental Revenue Incremental Expense Net Revenue (Expense)Football Scholarship Athletes $0 $515,592 ($515,592) Bowling Scholarship Athletes $0 $15,314 ($15,314) Rifle Scholarship Athletes $0 $23,684 ($23,684) Room Total ($554,590)
Board Unlike dorm space, the food provided as part of a meal plan is almost certainly not capacity-constrained. It is very common for the athletic department to indicate that each GIA includes the price of a full meal plan as if that is the cost to the university. On a marginal cost basis, that is almost certainly false, unless the university has outsourced its foodservice and receives zero markup between what it pays and what it charges students. That’s not common, but by how much the true cost is lower than the price depends on the nature of UAB’s arrangement with its food service partner. Note: The same may be true for the new “unlimited meals” charge that is anticipated. This adds a real cost, but the question is not what a non-athlete would be charged for this service, but what is the marginal cost to UAB. We had hoped to find this out in our internal analysis. Future Research Project: Prices and Costs of Food
Does UAB earn a profit on the margin from the sale of food plans? For each new dollar of revenue, how much reaches UAB’s bottom line? What is UAB’s marginal revenue from its Sodexo plan? Are estimates of unlimited food budget made at retail or cost? Is there any supply constraint with respect to food?
In the absence of this information, we have made the assumption that the profit margin on meal plans is 15%. That is, the incremental costs of providing one hundred or so more meal plans is approximately 85% of the listed cost. At an estimated $3,500 per meal plan, this means that the estimated cost of the food provided is $2,975. (We also understand that athletes receive an additional $700 per year to cover meals beyond the meal plan. This is accounted for in this analysis’s listed expenses.) The 85% assumption is based on common industry practices, but is not based on UAB specifics. We are aware of some schools where food service has been outsourced at less than 15%. Nevertheless, based on our best information of how typical Sodexo meal plans work, we are comfortable that assuming UAB receives 15% will yield a reasonably accurate estimate. Based on this assumption, the incremental revenues and costs of providing 109 scholarship athletes and 10 walk-ons with 89.45 meal plans is as follows:

| Page 59 |
Table 12: Estimated Board Expense, assuming 15% Contribution Margin
Board Impact Incremental Revenue Incremental Expense Net Revenue (Expense)Football Scholarship Athletes $48,300 $349,272 $(300,972)
Football Walk-ons98 $5,250 $- $5,250
Bowling Scholarship Athletes $4,200 $10,374 $(6,174) Rifle Scholarship Athletes $4,725 $16,044 $(11,319) Board Total $(313,215)
However, as with Room, if the athlete lives off campus and receives a check, that check is the best estimate of the cost of that benefit to the school. And in that case, the school receives no profit margin (similar to the lack of university profit for Room if a student rents a private apartment). This has a non-trivial impact (the cost of writing 89.45 checks for $4,200 each would be $375,690 rather than $313,215), but this also argues that operationally, to the extent the school chooses to keep the three sports in question, it would be advised to provide the bulk of the board benefit in university scrip for a food plan rather than in cash.
Books Books are similar to board, in that both are (effectively) infinite in supply and have no opportunity cost (each book provided to an athlete has zero impact on how many books can be sold to other students). Cost is thus whatever the marginal cost of book acquisition is to the school. This is likely just the wholesale price, but will depend on whether UAB outsources its book purchases to a third-party (like Barnes and Noble) and what that third party charges/pays the school. Future Research Project: Books Costs and Revenues
What is the nature of UAB’s contract with Barnes and Noble? On the margin, for each additional dollar of sales, what is UAB’s share? Does UAB bear any costs of items sold in book store? Does B&N charge UAB full retail price for books given to athletes as part of GIA? If not, what is the discount? Is that discount reflected in the price UAB charges Athletics? Also important for other elements of this study: how is the sale of sports‐related merchandise accounted for under B&N deal? Does sale of a UAB hoodie generate revenue for UAB? For athletics?
Based on discussions with athletic personnel, we understand that Barnes and Noble does provide bookstore services on a contract basis. Our investigation was cancelled prior to determining the share of revenue the university receives, but for the purposes of this analysis we assume the UAB contract
98 In the case of a walk-on who purchases a meal plan himself, we assume UAB pays nothing and receives 15%. The food service vendor covers all costs in exchange for keeping 85% of UAB’s revenue, hence zero expenses for walk-ons’ food.
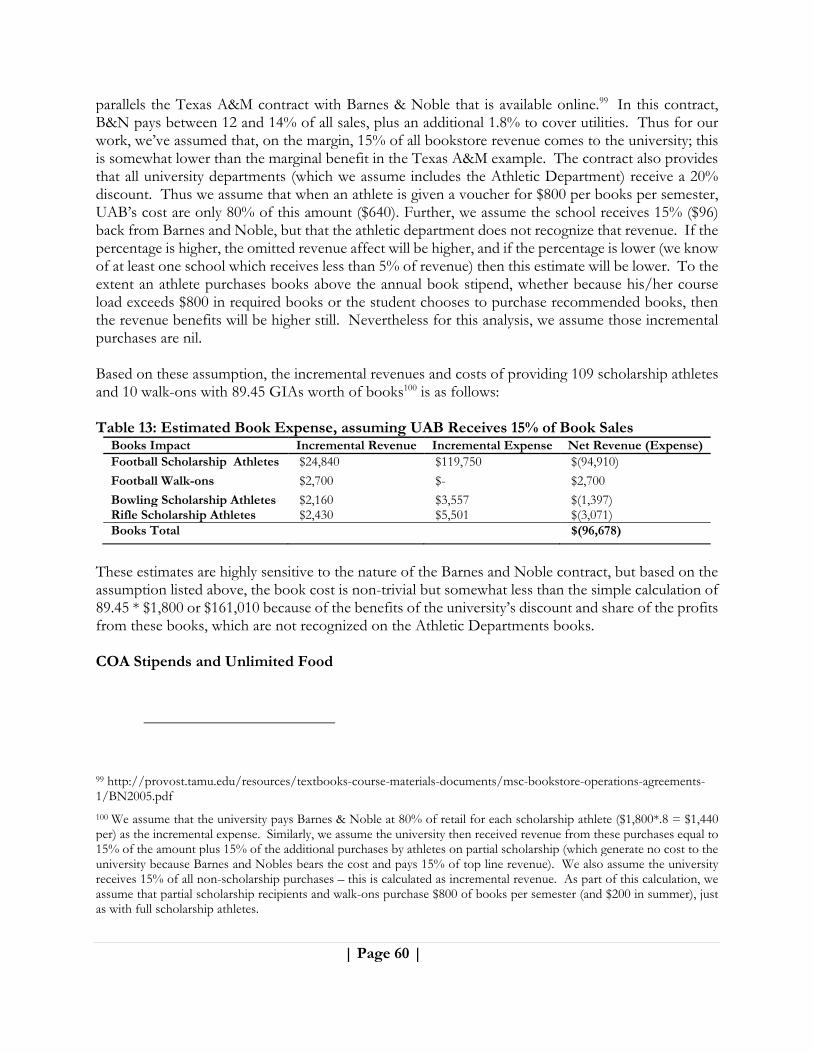
| Page 60 |
parallels the Texas A&M contract with Barnes & Noble that is available online.99 In this contract, B&N pays between 12 and 14% of all sales, plus an additional 1.8% to cover utilities. Thus for our work, we’ve assumed that, on the margin, 15% of all bookstore revenue comes to the university; this is somewhat lower than the marginal benefit in the Texas A&M example. The contract also provides that all university departments (which we assume includes the Athletic Department) receive a 20% discount. Thus we assume that when an athlete is given a voucher for $800 per books per semester, UAB’s cost are only 80% of this amount ($640). Further, we assume the school receives 15% ($96) back from Barnes and Noble, but that the athletic department does not recognize that revenue. If the percentage is higher, the omitted revenue affect will be higher, and if the percentage is lower (we know of at least one school which receives less than 5% of revenue) then this estimate will be lower. To the extent an athlete purchases books above the annual book stipend, whether because his/her course load exceeds $800 in required books or the student chooses to purchase recommended books, then the revenue benefits will be higher still. Nevertheless for this analysis, we assume those incremental purchases are nil. Based on these assumption, the incremental revenues and costs of providing 109 scholarship athletes and 10 walk-ons with 89.45 GIAs worth of books100 is as follows: Table 13: Estimated Book Expense, assuming UAB Receives 15% of Book Sales
Books Impact Incremental Revenue Incremental Expense Net Revenue (Expense)Football Scholarship Athletes $24,840 $119,750 $(94,910)
Football Walk-ons $2,700 $- $2,700
Bowling Scholarship Athletes $2,160 $3,557 $(1,397) Rifle Scholarship Athletes $2,430 $5,501 $(3,071) Books Total $(96,678)
These estimates are highly sensitive to the nature of the Barnes and Noble contract, but based on the assumption listed above, the book cost is non-trivial but somewhat less than the simple calculation of 89.45 * $1,800 or $161,010 because of the benefits of the university’s discount and share of the profits from these books, which are not recognized on the Athletic Departments books.
COA Stipends and Unlimited Food
99 http://provost.tamu.edu/resources/textbooks-course-materials-documents/msc-bookstore-operations-agreements-1/BN2005.pdf
100 We assume that the university pays Barnes & Noble at 80% of retail for each scholarship athlete ($1,800*.8 = $1,440 per) as the incremental expense. Similarly, we assume the university then received revenue from these purchases equal to 15% of the amount plus 15% of the additional purchases by athletes on partial scholarship (which generate no cost to the university because Barnes and Nobles bears the cost and pays 15% of top line revenue). We also assume the university receives 15% of all non-scholarship purchases – this is calculated as incremental revenue. As part of this calculation, we assume that partial scholarship recipients and walk-ons purchase $800 of books per semester (and $200 in summer), just as with full scholarship athletes.
| Page 61 |
Historically, UAB has been subject to collective caps on aid imposed by the NCAA, some of which were found in 2014 to violate Federal antitrust law in a district court in Northern California.101 This ruling is now on appeal in the Ninth Circuit and further litigation also exists challenging aspects of these caps. Perhaps in reaction, the NCAA has recently loosened this collective restraint in two relevant ways. The first is that previous restrictions on how much food an athlete could be provided (which led to, inter alia, the notorious bagel rule which banned cream cheese) have been lifted. This means that historical data on the cost of board, as calculated above, understates the forward-going costs by the incremental increase in net cost of food, assuming UAB chooses to provide this new benefit.102 The second is that schools will now be allowed to provide a cash payment to all athletes equal to the difference between that students’ calculated Cost of Attendance and the calculated value of his/her GIA. Future Research Project: Issues of COA Stipends and Unlimited Food
Understand what drives the estimated COA cost.If split into food vs. stipend, how much is food? Is that food valued at retail or cost?
UAB has publicly stated that they estimate the combined cost of these payments will be $5,442 per scholarship.103 This is high compared with the typical school, but it is consistent with the figures reported in UAB’s AUP.104 In other parts of the same report, it is implied that this $5,442 per athlete covers only the stipends, and an additional $1,000 would be required for unlimited food.105 In the absence of access to Athletic Department officials to resolve this dispute, we have assumed the full $6,442 per athlete for the combined costs, but this seems quite high. We assume that if UAB continues its football, bowling, and rifle programs, it will provide these stipends to all GIA recipients. Therefore, the net increase in cash outlay from these stipends is approximately $625,000 spread across the three sports.106
101 This was the O’Bannon case on which this report’s two authors worked as a witness and consultant.
102 We understand UAB does plan to provide this benefit going-forward. Our work makes this assumption as well.
103 The Carr Report relies on this figure as well, see page III-5.
104 For example, in 2013-14, the average in-state GIA was valued at $19,119 and the equivalent COA estimate was $24,539, creating a gap of 5,420.
105 Elsewhere in the Carr Report it appears an additional $1,000 was budgeted, in contradiction to the stated assumption o page III-5, e.g., see Exhibit 1, pages 7-8.
106 Some schools may choose not to provide these stipends for sports like bowling and rifle. For example, the Carr report (Exhibit 1, page 8) presents three COA scenarios, only one of which provides stipends for women in equivalency sports like bowling and rifle. We assume UAB would do so, though obviously this may tend to overstate this expense. Based on this, the splits of these costs are $535,717 for football, $15,912 for bowling and $24,608 for rifle.
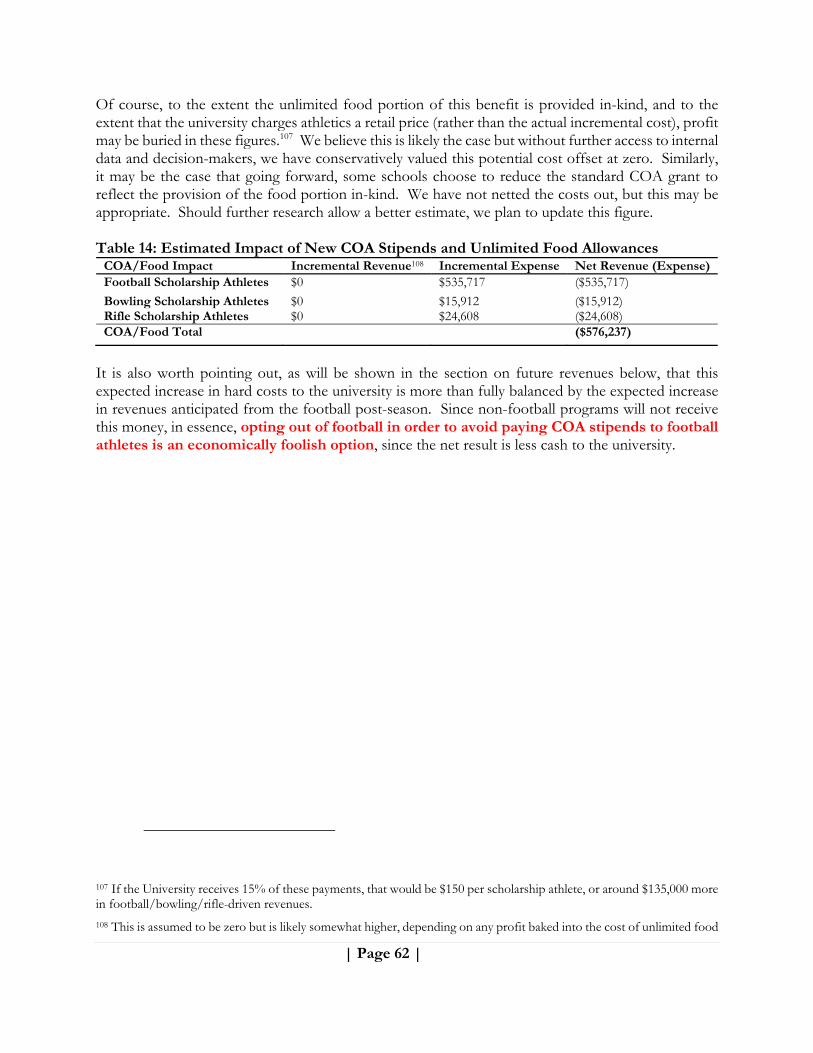
| Page 62 |
Of course, to the extent the unlimited food portion of this benefit is provided in-kind, and to the extent that the university charges athletics a retail price (rather than the actual incremental cost), profit may be buried in these figures.107 We believe this is likely the case but without further access to internal data and decision-makers, we have conservatively valued this potential cost offset at zero. Similarly, it may be the case that going forward, some schools choose to reduce the standard COA grant to reflect the provision of the food portion in-kind. We have not netted the costs out, but this may be appropriate. Should further research allow a better estimate, we plan to update this figure. Table 14: Estimated Impact of New COA Stipends and Unlimited Food Allowances
COA/Food Impact Incremental Revenue108 Incremental Expense Net Revenue (Expense)Football Scholarship Athletes $0 $535,717 ($535,717)
Bowling Scholarship Athletes $0 $15,912 ($15,912) Rifle Scholarship Athletes $0 $24,608 ($24,608) COA/Food Total ($576,237)
It is also worth pointing out, as will be shown in the section on future revenues below, that this expected increase in hard costs to the university is more than fully balanced by the expected increase in revenues anticipated from the football post-season. Since non-football programs will not receive this money, in essence, opting out of football in order to avoid paying COA stipends to football athletes is an economically foolish option, since the net result is less cash to the university.
107 If the University receives 15% of these payments, that would be $150 per scholarship athlete, or around $135,000 more in football/bowling/rifle-driven revenues.
108 This is assumed to be zero but is likely somewhat higher, depending on any profit baked into the cost of unlimited food
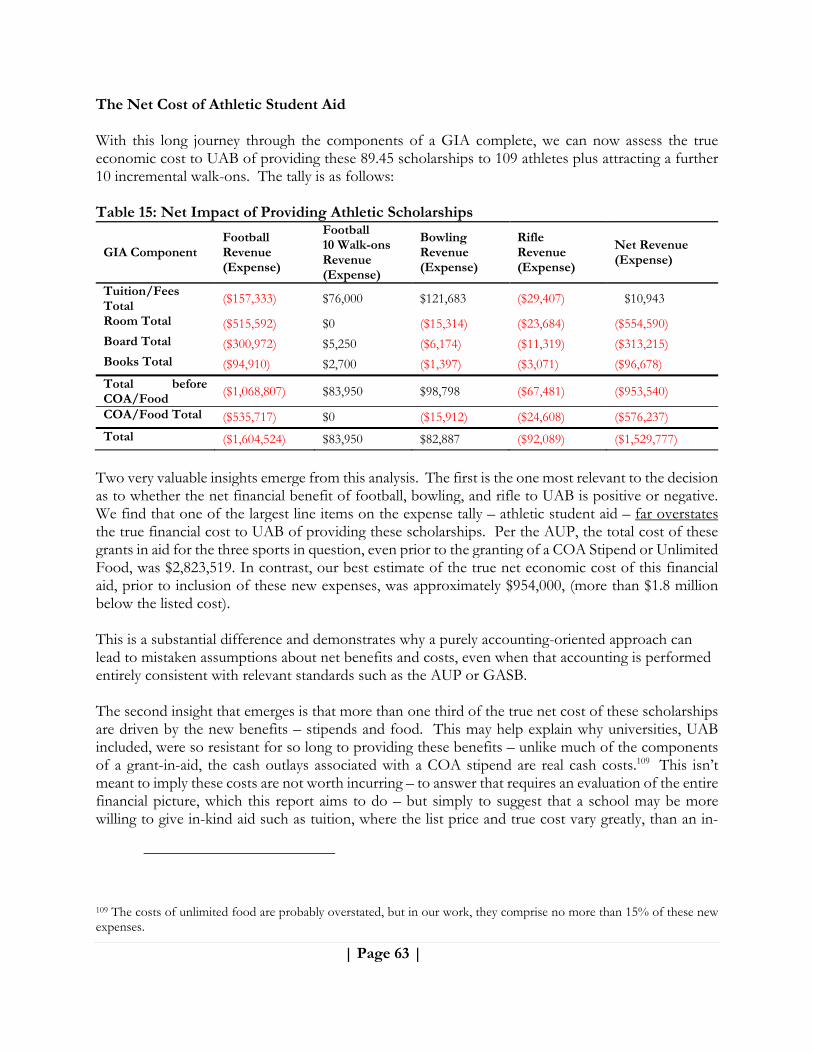
| Page 63 |
The Net Cost of Athletic Student Aid With this long journey through the components of a GIA complete, we can now assess the true economic cost to UAB of providing these 89.45 scholarships to 109 athletes plus attracting a further 10 incremental walk-ons. The tally is as follows: Table 15: Net Impact of Providing Athletic Scholarships
GIA Component Football Revenue (Expense)
Football 10 Walk-ons Revenue (Expense)
Bowling Revenue (Expense)
Rifle Revenue (Expense)
Net Revenue (Expense)
Tuition/Fees Total
($157,333) $76,000 $121,683 ($29,407) $10,943
Room Total ($515,592) $0 ($15,314) ($23,684) ($554,590) Board Total ($300,972) $5,250 ($6,174) ($11,319) ($313,215) Books Total ($94,910) $2,700 ($1,397) ($3,071) ($96,678)
Total before COA/Food
($1,068,807) $83,950 $98,798 ($67,481) ($953,540)
COA/Food Total ($535,717) $0 ($15,912) ($24,608) ($576,237)
Total ($1,604,524) $83,950 $82,887 ($92,089) ($1,529,777)
Two very valuable insights emerge from this analysis. The first is the one most relevant to the decision as to whether the net financial benefit of football, bowling, and rifle to UAB is positive or negative. We find that one of the largest line items on the expense tally – athletic student aid – far overstates the true financial cost to UAB of providing these scholarships. Per the AUP, the total cost of these grants in aid for the three sports in question, even prior to the granting of a COA Stipend or Unlimited Food, was $2,823,519. In contrast, our best estimate of the true net economic cost of this financial aid, prior to inclusion of these new expenses, was approximately $954,000, (more than $1.8 million below the listed cost). This is a substantial difference and demonstrates why a purely accounting-oriented approach can lead to mistaken assumptions about net benefits and costs, even when that accounting is performed entirely consistent with relevant standards such as the AUP or GASB. The second insight that emerges is that more than one third of the true net cost of these scholarships are driven by the new benefits – stipends and food. This may help explain why universities, UAB included, were so resistant for so long to providing these benefits – unlike much of the components of a grant-in-aid, the cash outlays associated with a COA stipend are real cash costs.109 This isn’t meant to imply these costs are not worth incurring – to answer that requires an evaluation of the entire financial picture, which this report aims to do – but simply to suggest that a school may be more willing to give in-kind aid such as tuition, where the list price and true cost vary greatly, than an in-
109 The costs of unlimited food are probably overstated, but in our work, they comprise no more than 15% of these new expenses.
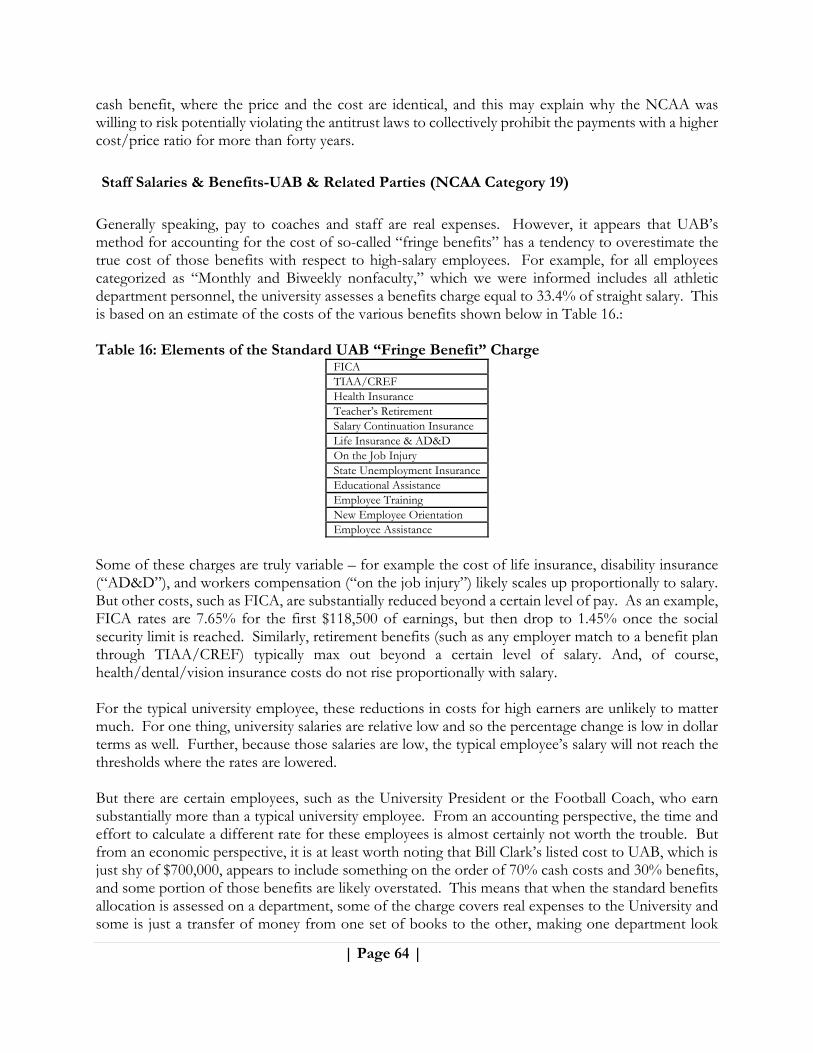
| Page 64 |
cash benefit, where the price and the cost are identical, and this may explain why the NCAA was willing to risk potentially violating the antitrust laws to collectively prohibit the payments with a higher cost/price ratio for more than forty years.
Staff Salaries & Benefits-UAB & Related Parties (NCAA Category 19)
Generally speaking, pay to coaches and staff are real expenses. However, it appears that UAB’s method for accounting for the cost of so-called “fringe benefits” has a tendency to overestimate the true cost of those benefits with respect to high-salary employees. For example, for all employees categorized as “Monthly and Biweekly nonfaculty,” which we were informed includes all athletic department personnel, the university assesses a benefits charge equal to 33.4% of straight salary. This is based on an estimate of the costs of the various benefits shown below in Table 16.: Table 16: Elements of the Standard UAB “Fringe Benefit” Charge
FICA TIAA/CREF Health Insurance Teacher’s Retirement Salary Continuation Insurance Life Insurance & AD&D On the Job Injury State Unemployment InsuranceEducational Assistance Employee Training New Employee Orientation Employee Assistance
Some of these charges are truly variable – for example the cost of life insurance, disability insurance (“AD&D”), and workers compensation (“on the job injury”) likely scales up proportionally to salary. But other costs, such as FICA, are substantially reduced beyond a certain level of pay. As an example, FICA rates are 7.65% for the first $118,500 of earnings, but then drop to 1.45% once the social security limit is reached. Similarly, retirement benefits (such as any employer match to a benefit plan through TIAA/CREF) typically max out beyond a certain level of salary. And, of course, health/dental/vision insurance costs do not rise proportionally with salary. For the typical university employee, these reductions in costs for high earners are unlikely to matter much. For one thing, university salaries are relative low and so the percentage change is low in dollar terms as well. Further, because those salaries are low, the typical employee’s salary will not reach the thresholds where the rates are lowered. But there are certain employees, such as the University President or the Football Coach, who earn substantially more than a typical university employee. From an accounting perspective, the time and effort to calculate a different rate for these employees is almost certainly not worth the trouble. But from an economic perspective, it is at least worth noting that Bill Clark’s listed cost to UAB, which is just shy of $700,000, appears to include something on the order of 70% cash costs and 30% benefits, and some portion of those benefits are likely overstated. This means that when the standard benefits allocation is assessed on a department, some of the charge covers real expenses to the University and some is just a transfer of money from one set of books to the other, making one department look

| Page 65 |
more profitable and one (in this case, Athletics) look less profitable, with no actual financial impact on the university. When this happens, “saving” this expense for the Athletic Department comes with a perfectly off-setting “loss” of revenue for the school’s benefits department. To the extent the benefit charge is above any actual cost, the savings are illusory. Future Research Project: Allocated Cost of Benefits
Discuss what portion of Athletic Department charges for “fringe benefits” are truly marginal costs vs. allocated fixed costs. Determine viability of moving high‐paid employees to private foundation, determine impact on allocated charges, see if savings possible.
With that said, it is almost certainly impossible to ask the University to change its policy towards assessing a cost for fringe benefits just to make the football numbers more accurate. Universities are large, complex entities and making an exception for one or two key employees is likely untenable. But that doesn’t mean that the University cannot make a smart economics decision with a recognition that some of those expenses represent real costs and some are just a transfer. A wise manager can follow the accounting rules but also make necessary managerial adjustments to those numbers when a strict adherence to them will result in a bad decision. This is why in our analysis of the football program, we have reduced the actual expenses related to coaching salary by an estimated $100,000. This report has not had access to sufficient internal data to calculate the projected saving from this shift in coaching compensation, though we believe the listed expense exceeds $500,000. The overstated portion could easily exceed $100,000. We would hope that further research will be possible, but for the purpose of this report, we have assumed $100,000 and fully intend to update as better data become available. To the extent the university disagrees and feels the entire portion of the 34% “fringe benefit” assessment for Coach Clark is a true expense, the community can step in and cover the bulk of Coach Clark’s salary, leaving him on the UAB books for, say, the maximum social security annual tax limit of $118,500.110 This is the specific spot at which FICA payroll tax rates for employers drops from 7.65% to 1.45%. To the extent a separate foundation were to cover the rest of Coach Clark’s reported direct salary of $ 41,666.67 per month111 ($500,000 per year) and as a result, the remaining $381,500 were assessed only the marginal FICA tax of 1.45%, the assessed charge would be reduced by a net of $23,653. Just making this one change reduces the effective “fringe benefit” charge for Coach Clark from 34% to 29.3%. Without access to inside information about the elements of the 34% assessment, it is impossible to assess how many football employees’ paychecks are being “taxed” by the university such that the charge to Athletics exceeds the actual expense incurred by the university. As a second example, whatever percentage rate is used for “New Employee Orientation” does not scale up such that Coach
110 http://www.socialsecurity.gov/planners/maxtax.html
111 http://strepas1.it.uab.edu/pls/strep/f?p=140:1:2370826598229348::NO:RP::
| Page 66 |
Clark Clark’s orientation cost ten times as much as a $50,000 per year employees when he first started, nor does that cost continue into the future. Again, this is not an indictment of an accounting system that simplifies reality by assessing a charge against compensation to cover ongoing costs like new employee orientation. All large institutions do so. But treating this as a variable cost for accounting purposes and understanding that it is actually a fixed cost in disguise are two different concepts; both can be true. Good managerial decision-making requires the ability to distinguish costs that are truly variable from costs that are fixed and will just move around when a specific cost driver is reduced. A careful analyst within UAB, or an outside consultant with access to inside information, could likely isolate the fixed cost element and make a very precise estimate. In that absence of that access, we’ve assumed $100,000 of these charges are fixed and do not represent actual savings from eliminating football. To some, our estimate that $100,000 of these expenses are not actually driven by football, or our suggestion that highly paid employees be paid by a separate foundation may feel like gaming the accounting system by avoiding a “fair share” of allocated fixed costs (or avoiding subsidizing other, lower-paid employees’ costs). But this highlights the difference between the two approaches – in the economic approach, if football is cancelled, 100% of those fixed costs remain and football will contribute nothing to covering them; this “savings” will simply increase the allocation to other departments. Moving the variable costs to a separate entity will have no better or worse impact on UAB than cancelling football. To the extent that accounting conventions make it look like cutting allocated fixed costs generates savings; that is a fiction. Taking the upper end of highly paid coaches off the books with the result that the total cost of providing identical compensation drops to the combined entities illustrates that the “expense” is an accounting illusion, not an economic reality.112
112 As a similar finding, it appears UAB provides its athletic department personnel with cell phone service at a cost of $125/month/employee. It would seem that a private non-profit could acquire identical cell service at a lower monthly cost. However, the numbers in this report do not reflect any anticipated savings from such a change.
| Page 67 |
Athletic Academic Center (NCAA Category 21)
The Athletic Department houses a fairly robust Athletic Academic Center, with a sizable cost in salary and benefits. Based on preliminary discussions, we understand that the cost approaches $1 million per year. Our work was terminated prior to diving in deep enough to determine the likely post-football staffing level, but we assume that some portion of these expenses, currently listed as “NABSOG” are actually driven by football, bowling and rifle. In our work, we ball-parked the savings at an approximate $325,000 per year, which approximates the three sports’ pro rata share of the Athletic Academic Center’s expenses, proportional to number of athletes on each team.113 Future Research Project: Tutoring
Determine likely layoff‐driven gains from terminating support staff focused on football, bowling, and rifle students.
Team Travel (NCAA Category 28)
One likely impact of cancelling football is a change in the Athletic Department’s team travel expense. On the one hand, the athletic department will save money because the three cancelled sports will no longer be traveling to away games. This potential expense reduction is already accounted for in the listed expenses of each cancelled sport, so no further adjustment is needed. However, because the most likely result of cancelling football is that UAB will have to leave Conference USA, a further adjustment is needed to account for the potential increase in travel expenses for the remaining teams if UAB lands in a geographically more remote conference such as the Ohio Valley or Missouri Valley Conference. Future Research Project: Team Travel
Undertake case study of travel cost increases for joining a less geographically central conference.
We would imagine the UAB Athletic Department has already begun, or soon will begin, estimating the impact of this shift. However, our work with the department ended before we could determine UAB’s best estimate of this cost. To provide a proxy assumption, we’ve gathered data for the impact on the non-football expenses of West Virginia University of moving from the Big East to the Big XII. That particular switch appears to have resulted in an annual average increase of nearly $2 million in team travel expenses, not including any football expenses. This represents a 63% increase, and is illustrated in the chart below:
113 We’ve heard a ballpark figure that approximately five FTEs within the non-coaching ranks will be laid off across all elements of the Athletic department (administrators, tutors, trainers, etc.). If the cost of those FTE’s averages $65,000 or below, this tutoring expense likely captures the full savings from the envisioned layoffs.

| Page 68 |
Figure 11: Impact of Conference Switch on West Virginia non-Football Travel Expense
Of course, the extent of any increase in expenses will depend heavily on which conference (or conferences) UAB chooses and which sports end up where. And it should be remembered that conference membership is a two-way process; UAB may have a preferred destination but UAB will need to persuade those target conferences to accept it as a member. Based on the conference footprints presented below, it appears that the community favorite second choice (after Conference USA), the Missouri Valley Conference, is likely to increase travel expenses by more than would, for example, rejoining UAB’s old home, the Sun Belt. To the extent the school moves forward without football, travel expenses are a major consideration, as the difference in expense may exceed the difference in conference non-football revenues. The specifics of the West Virginia experience may be more extreme than UAB’s future. Morgantown, West Virginia is likely a less convenient travel hub than Birmingham, Alabama. West Virginia, as a member of a power conference, may be flying more alumni with the team to events, etc. As an example, even in the period prior to West Virginia’s conference move, West Virginia was averaging almost twice as much in non-football travel expenses as UAB. Moreover, we understand UAB harbors hopes of joining the MVC for just men’s and women’s basketball, and would then seek to find another less remote conference willing to accept UAB’s remaining sports, as a means of moderating the anticipated increase in travel expenses. It should be remembered that UAB won’t only be increasing its own travel expenses. Its candidacy for membership in any conference will be judged not just on the revenue UAB can add to the new conference’s schools’ revenue distributions, but also on the travel expenses it will impose on existing members, who will have to add flights to Birmingham to their annual budget. This may make UAB’s
| Page 69 |
first-choice a money loser for the target conference. The two-sided wooing involved in conference re-alignment is not as simple as simply ordering a new conference sport-by-sport on an a la carte basis from room service. We note that in 2008, a report prepared for then-Chancellor Portera estimated the increased travel costs associated with joining the MVC at $150,000 per year. This seems quite low based on the actual West Virginia experience. With that said, we think an appropriate estimate is to assume UAB will be successful in finding a prestigious home for its basketball programs, such as the MVC, and then finding a low-expense home for the rest of its sports. As a result, in our base case, we assume only basketball expenses will increase, and rather than assuming that UAB’s expenses would increase at the same rate as West Virginia (63%), we estimate UAB’s increase at 50% of current expenses. This results in an estimated increase in expenses of $320,000. That is, going forward, instead of the Athletic Department’s post-football travel expenses averaging $1.8 million, we estimate they will increase to approximately $2.1 million annually because of increases only to men’s and women’s basketball expenses. In Appendix III, we assume UAB is unable to thread the needle perfectly by finding two separate conferences willing to accept its teams. Instead we model the travel expenses (for all sports other than football, bowling, and rifle) based on the higher expenses anticipated from full entry into the MVC and based on the same rate of increase (but still lower dollar impact) as West Virginia experienced. This estimate of the outer-bound of possible costs exceeds $1 million in added travel expenses. Though by definition, these expenses will be incurred outside of football, for our analysis we treat this as an offset to football expenses, since the shift in conference is driven by the absence of football (which in turn ends C-USA affiliation) rather than by non-football causes.
Fund Raising, Promotion and Marketing (NCAA Category 28)
Future Research Project: Fundraising/Marketing
Discuss with university personnel the anticipated savings in this category from cancelling the sports in question.
All Fundraising, Promotion, and Marketing within UAB Athletics is unallocated by sport or gender. Discussions with Athletic Department Staff and preliminary review of the numbers makes clear that among these expenses is a large, six-figure advertising/PR expense that was not assigned to any individual sport. Just as much of the revenue generation of UAB is likely focused on football and men’s basketball, it is likely that some of this expense should be similarly allocated. Had our project continued, this would have been a spot where discussions with decision-makers and insider data would have informed our analysis. In the absence of that insight, we’ve estimated $125,000 of this expense category is properly assigned to football.
| Page 70 |
Spirit Groups (NCAA Category 31)
This may seem like a small category, but as best we can tell from discussion with the athletic department, the football team is charged approximately $350,000 of the costs of the marching band, which appears as a charge on the AUP under “Spirit Groups.” Internally, we understand that the school then adjusts this by around $100,000 by asking the provost office to cover some portion of this cost. Our understanding based on information from the community is that as of now, the marching band is not being phased out,114 and so these expenses will persist even in the absence of the three sports in question. This could represent as much as $250,000 in continued expenses being treated as savings from terminating football. They should be (and have been) added back in.115 There is also a second question we had hoped to address through our focus group work, but that in the absence of those projects we simply raise as a future research note. Our understanding is that UAB has a distinct cheerleading squad for football, distinct from, say, the basketball cheerleaders. As best we can tell, cheerleading expenses are not charged directly to football, so we’ve had no expenses to adjust downward. However, just as with any other student, if football cheerleaders included the opportunity to be cheerleaders for an FBS team (complete with that higher level of competition and greater media exposure) and as a result UAB earned more revenue than it will in the absence of football, then those cheerleaders’ paid tuition should be treated as lost revenue from cancelling football. Our work has not put a number on this, but we leave it as an exercise for future research. Future Research Project: Marching Band & Cheerleaders
Discuss with University personnel the anticipated savings with respect to the marching band from cancelling the sports in question. What band costs were included in the “savings” from cancelling football? Understand marching band scholarships (if any) sufficiently to assess whether Marching Band, like Women’s Bowling, generated incremental revenue. Will future Marching Band students attend elsewhere? Are there any football‐specific cheerleaders whose choice of college would have been different if UAB had not had football? Going forward, will UAB lose a few of these potential tuition‐paying students? How much?
To the extent the Marching Band is eventually considered for termination, many of the same “partial scholarship” effects we see for women’s bowling should be taken into account. Did any members of the marching band choose UAB over other schools for the opportunity to be part of an FBS marching band? Will tuition revenues decline? This analysis isn’t possible without qualitative research into the
114 “Bolton said on Dec. 29 that UAB’s marching band has operated on a discreet [sic] budget with shared costs paid for by the athletic department and the intent is to ‘keep support at the current levels.’” http://www.cbssports.com/collegefootball/writer/jon-solomon/24913760/death-of-uab-football-anger-remains-but-study-banks-on-healing
115 The entire question of the accounting treatment of the marching band is one that requires information from within UAB to form a firmer estimate of cost impact. This was on our list of requests to UAB when the project was terminated.
| Page 71 |
marching band members’ decision-making process. Interviews were planned with band members prior to the termination of the project. The same is true for cheerleading. For the purposes of this analysis, the $250,000 in marching band savings has been removed from football. To the extent this money truly is saved, it should be considered, but it will improve the analysis to think of this as a saved cost of marching band, not football. We’ve made no adjustment related to cheerleading.
Medical Expenses and Insurance (NCAA Category 33)
Future Research Project: Medical Expenses
Discuss with university personnel the anticipated savings in this category from cancelling the sports in question. Are these services provided by UAB‐owned facilities? Is profit built into these charges too?
No sport is charged specifically for Medical expenses (instead everything is lumped into NABSOG), and we understand that the primary driver of these costs is a charge for patient care at local medical facilities. Given the physical nature of football, and in the absence of solid information from UAB as to a more precise figure, we have allocated $300,000 of these costs (approximately 50% of the total) to football, on the theory that football likely generated a large fraction of the trips to medical facilities.116
116 As mentioned above, to the extent the athletic department is charged full retail price by a UAB-owned facility and there is profit built into those prices, all of the RTP issues apply. Making this determination is beyond the scope of this study.

| Page 72 |
The Bottom Line: How much do the three sports actually gain or lose for UAB? Generally speaking, there is room to investigate every element of an accounting statement to determine whether standard accounting has properly captured the economic costs and benefits involved. This report has focused on several major elements: contributions (which were found to be overstated), NCAA/Conference distributions (which were found to be substantially understated), Athletic Scholarships expenses (which were found to be substantially overstated), travel expenses (which were found to be overstated because post-football expenses were understated) and then the smaller items of logoed royalty revenues, tutoring expenses, employee benefits, fundraising, marketing and promotion, spirit groups, and medical expenses. The result is a much altered P&L for the sports under consideration, with the general conclusion that the losses on UAB’s books far overstate any actual losses for football, bowling and rifling. Rather than creating a huge deficit that will require millions of dollars of institutional support to fund, the three sports in question appear to have essentially covered their costs. This conclusion strengthens on a pro forma basis that considers the additional expense of COA Stipends and unlimited food as well as additional revenue from the College Football Playoffs and stronger ticket sales commensurate with 2014-15. Adding in these new benefits and costs shows the three sports would have generated a moderate level of positive cash for the university. The summary of these results follows. It is important to note that there are other sources of revenue that may not be accounted for. These include sports-related items, like the sale of licensed merchandise through the bookstore;117 here it appears that little or no revenue recognized by the Athletic Department.118 These potential revenues also include non-sports items, such as any increase in attendance by non-athletes because of the draw of a football, bowling, or rifle program. In the original version of this study as proposed, it was envisioned that qualitative research, primarily focus groups, would identify the magnitude of these effects, but leave for a later project the specific quantification of the cash benefits of these less easily measured sources of revenue. However, in the absence of university cooperation, this qualitative assessment has been deferred. Nevertheless, it should be recognized that the numbers above are before accounting for any of these additional benefits. We take up a limited assessment of these harder-to-quantify benefits in Research Project 2, which follows after the summary table below.
117 There are two components to this – the profit on the sale of the apparel at the bookstore (which appears not to be accounted for) and the license payment by the apparel manufacturer (which we believe is captured by Athletics but not attributed to football). We adjust the former here; the latter was addressed in Project 1.
118 Until 2009-10, the University of Oregon kept all of its licensing revenue and just allotted athletics $200,000 per year. Now the athletic department keeps 50%. Total School licensing has grown from $740,000 in 2005 to $2.25 million in 2011. Thus, athletics gets credited with about $1 million now, a five-fold increase.
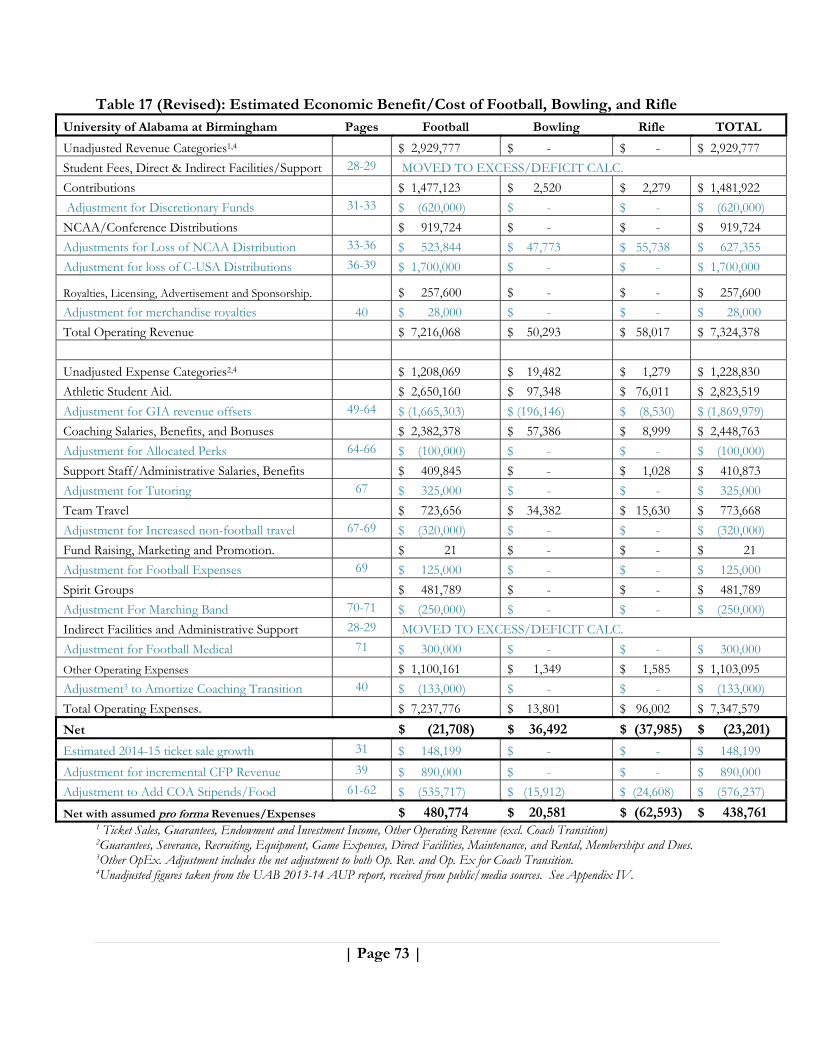
| Page 73 |
Table 17 (Revised): Estimated Economic Benefit/Cost of Football, Bowling, and Rifle University of Alabama at Birmingham Pages Football Bowling Rifle TOTAL
Unadjusted Revenue Categories1,4 $ 2,929,777 $ - $ - $ 2,929,777
Student Fees, Direct & Indirect Facilities/Support 28-29 MOVED TO EXCESS/DEFICIT CALC.
Contributions $ 1,477,123 $ 2,520 $ 2,279 $ 1,481,922
Adjustment for Discretionary Funds 31-33 $ (620,000) $ - $ - $ (620,000)
NCAA/Conference Distributions $ 919,724 $ - $ - $ 919,724
Adjustments for Loss of NCAA Distribution 33-36 $ 523,844 $ 47,773 $ 55,738 $ 627,355
Adjustment for loss of C-USA Distributions 36-39 $ 1,700,000 $ - $ - $ 1,700,000
Royalties, Licensing, Advertisement and Sponsorship. $ 257,600 $ - $ - $ 257,600
Adjustment for merchandise royalties 40 $ 28,000 $ - $ - $ 28,000
Total Operating Revenue $ 7,216,068 $ 50,293 $ 58,017 $ 7,324,378
Unadjusted Expense Categories2,4 $ 1,208,069 $ 19,482 $ 1,279 $ 1,228,830
Athletic Student Aid. $ 2,650,160 $ 97,348 $ 76,011 $ 2,823,519
Adjustment for GIA revenue offsets 49-64 $ (1,665,303) $ (196,146) $ (8,530) $ (1,869,979)
Coaching Salaries, Benefits, and Bonuses $ 2,382,378 $ 57,386 $ 8,999 $ 2,448,763
Adjustment for Allocated Perks 64-66 $ (100,000) $ - $ - $ (100,000)
Support Staff/Administrative Salaries, Benefits $ 409,845 $ - $ 1,028 $ 410,873
Adjustment for Tutoring 67 $ 325,000 $ - $ - $ 325,000
Team Travel $ 723,656 $ 34,382 $ 15,630 $ 773,668
Adjustment for Increased non-football travel 67-69 $ (320,000) $ - $ - $ (320,000)
Fund Raising, Marketing and Promotion. $ 21 $ - $ - $ 21
Adjustment for Football Expenses 69 $ 125,000 $ - $ - $ 125,000
Spirit Groups $ 481,789 $ - $ - $ 481,789
Adjustment For Marching Band 70-71 $ (250,000) $ - $ - $ (250,000)
Indirect Facilities and Administrative Support 28-29 MOVED TO EXCESS/DEFICIT CALC.
Adjustment for Football Medical 71 $ 300,000 $ - $ - $ 300,000
Other Operating Expenses $ 1,100,161 $ 1,349 $ 1,585 $ 1,103,095
Adjustment3 to Amortize Coaching Transition 40 $ (133,000) $ - $ - $ (133,000)
Total Operating Expenses. $ 7,237,776 $ 13,801 $ 96,002 $ 7,347,579
Net $ (21,708) $ 36,492 $ (37,985) $ (23,201)
Estimated 2014-15 ticket sale growth 31 $ 148,199 $ - $ - $ 148,199
Adjustment for incremental CFP Revenue 39 $ 890,000 $ - $ - $ 890,000
Adjustment to Add COA Stipends/Food 61-62 $ (535,717) $ (15,912) $ (24,608) $ (576,237)
Net with assumed pro forma Revenues/Expenses $ 480,774 $ 20,581 $ (62,593) $ 438,761 1 Ticket Sales, Guarantees, Endowment and Investment Income, Other Operating Revenue (excl. Coach Transition) 2Guarantees, Severance, Recruiting, Equipment, Game Expenses, Direct Facilities, Maintenance, and Rental, Memberships and Dues. 3Other OpEx. Adjustment includes the net adjustment to both Op. Rev. and Op. Ex for Coach Transition. 4Unadjusted figures taken from the UAB 2013-14 AUP report, received from public/media sources. See Appendix IV.
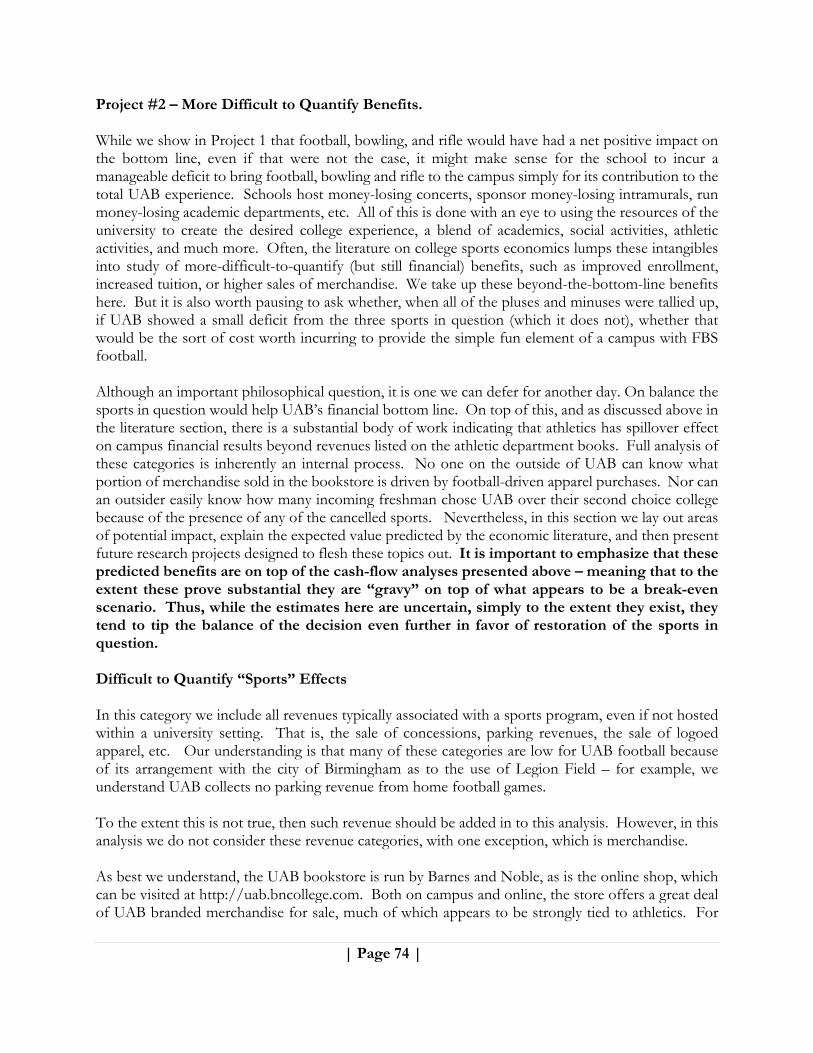
| Page 74 |
Project #2 – More Difficult to Quantify Benefits. While we show in Project 1 that football, bowling, and rifle would have had a net positive impact on the bottom line, even if that were not the case, it might make sense for the school to incur a manageable deficit to bring football, bowling and rifle to the campus simply for its contribution to the total UAB experience. Schools host money-losing concerts, sponsor money-losing intramurals, run money-losing academic departments, etc. All of this is done with an eye to using the resources of the university to create the desired college experience, a blend of academics, social activities, athletic activities, and much more. Often, the literature on college sports economics lumps these intangibles into study of more-difficult-to-quantify (but still financial) benefits, such as improved enrollment, increased tuition, or higher sales of merchandise. We take up these beyond-the-bottom-line benefits here. But it is also worth pausing to ask whether, when all of the pluses and minuses were tallied up, if UAB showed a small deficit from the three sports in question (which it does not), whether that would be the sort of cost worth incurring to provide the simple fun element of a campus with FBS football. Although an important philosophical question, it is one we can defer for another day. On balance the sports in question would help UAB’s financial bottom line. On top of this, and as discussed above in the literature section, there is a substantial body of work indicating that athletics has spillover effect on campus financial results beyond revenues listed on the athletic department books. Full analysis of these categories is inherently an internal process. No one on the outside of UAB can know what portion of merchandise sold in the bookstore is driven by football-driven apparel purchases. Nor can an outsider easily know how many incoming freshman chose UAB over their second choice college because of the presence of any of the cancelled sports. Nevertheless, in this section we lay out areas of potential impact, explain the expected value predicted by the economic literature, and then present future research projects designed to flesh these topics out. It is important to emphasize that these predicted benefits are on top of the cash-flow analyses presented above – meaning that to the extent these prove substantial they are “gravy” on top of what appears to be a break-even scenario. Thus, while the estimates here are uncertain, simply to the extent they exist, they tend to tip the balance of the decision even further in favor of restoration of the sports in question. Difficult to Quantify “Sports” Effects In this category we include all revenues typically associated with a sports program, even if not hosted within a university setting. That is, the sale of concessions, parking revenues, the sale of logoed apparel, etc. Our understanding is that many of these categories are low for UAB football because of its arrangement with the city of Birmingham as to the use of Legion Field – for example, we understand UAB collects no parking revenue from home football games. To the extent this is not true, then such revenue should be added in to this analysis. However, in this analysis we do not consider these revenue categories, with one exception, which is merchandise. As best we understand, the UAB bookstore is run by Barnes and Noble, as is the online shop, which can be visited at http://uab.bncollege.com. Both on campus and online, the store offers a great deal of UAB branded merchandise for sale, much of which appears to be strongly tied to athletics. For
| Page 75 |
example, in the wake of UAB’s recent victory in the Conference USA men’s basketball championship, the UAB bookstore put the following t-shirt up for sale: Figure 12: Example of Merchandise Sales Apparently Not Attributed to Athletics
While as outsider’s we are unable to verify this, it is our understanding that none of the proceeds of the sale of these t-shirts are credited to the men’s basketball program, and yet clearly these sales are entirely driven by the success of that team. Instead, it is our understanding that Barnes and Noble provides some form of payment to the University as a whole (our best estimate is 15% – see above, in our discussion of the Books component of a GIA), and to the extent that payment grows with increased sales, then the profits to the University from these sales are recognized by whichever department houses the bookstore royalties on its books.119
119 This is discussed in greater detail above, in the section on the books component of an athletic scholarship.
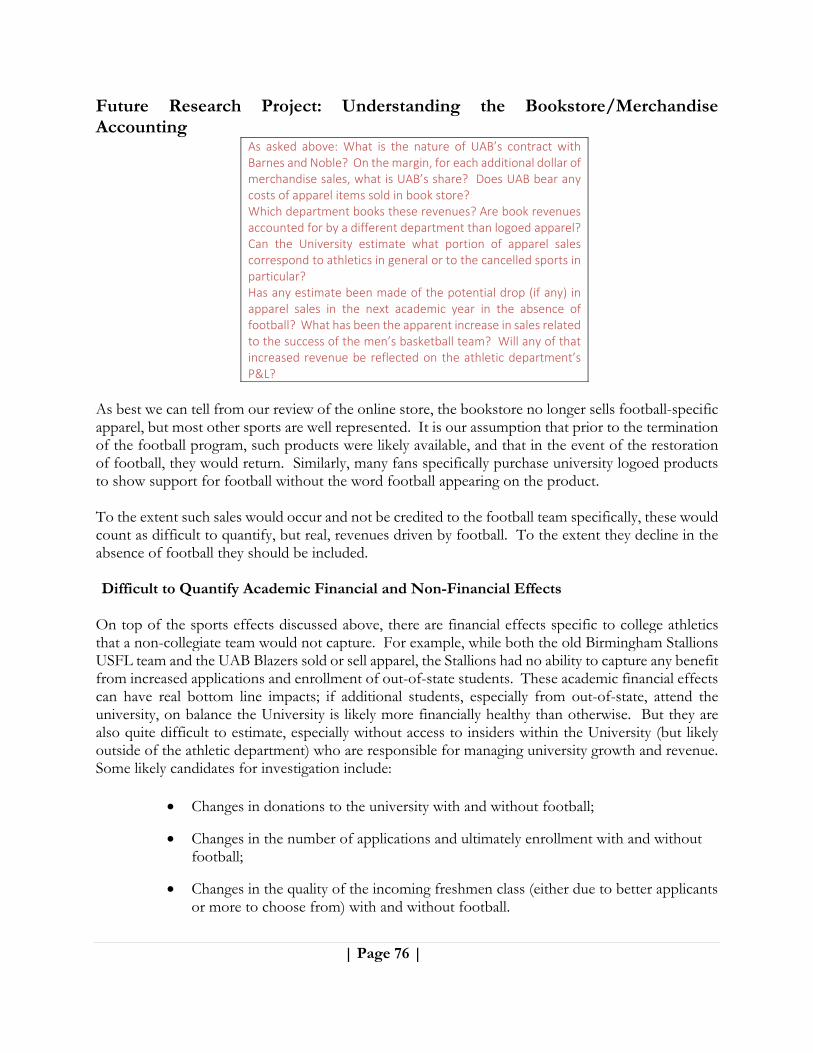
| Page 76 |
Future Research Project: Understanding the Bookstore/Merchandise Accounting
As asked above: What is the nature of UAB’s contract with Barnes and Noble? On the margin, for each additional dollar of merchandise sales, what is UAB’s share? Does UAB bear any costs of apparel items sold in book store? Which department books these revenues? Are book revenues accounted for by a different department than logoed apparel? Can the University estimate what portion of apparel sales correspond to athletics in general or to the cancelled sports in particular? Has any estimate been made of the potential drop (if any) in apparel sales in the next academic year in the absence of football? What has been the apparent increase in sales related to the success of the men’s basketball team? Will any of that increased revenue be reflected on the athletic department’s P&L?
As best we can tell from our review of the online store, the bookstore no longer sells football-specific apparel, but most other sports are well represented. It is our assumption that prior to the termination of the football program, such products were likely available, and that in the event of the restoration of football, they would return. Similarly, many fans specifically purchase university logoed products to show support for football without the word football appearing on the product. To the extent such sales would occur and not be credited to the football team specifically, these would count as difficult to quantify, but real, revenues driven by football. To the extent they decline in the absence of football they should be included. Difficult to Quantify Academic Financial and Non-Financial Effects
On top of the sports effects discussed above, there are financial effects specific to college athletics that a non-collegiate team would not capture. For example, while both the old Birmingham Stallions USFL team and the UAB Blazers sold or sell apparel, the Stallions had no ability to capture any benefit from increased applications and enrollment of out-of-state students. These academic financial effects can have real bottom line impacts; if additional students, especially from out-of-state, attend the university, on balance the University is likely more financially healthy than otherwise. But they are also quite difficult to estimate, especially without access to insiders within the University (but likely outside of the athletic department) who are responsible for managing university growth and revenue. Some likely candidates for investigation include:
Changes in donations to the university with and without football;
Changes in the number of applications and ultimately enrollment with and without football;
Changes in the quality of the incoming freshmen class (either due to better applicants or more to choose from) with and without football.
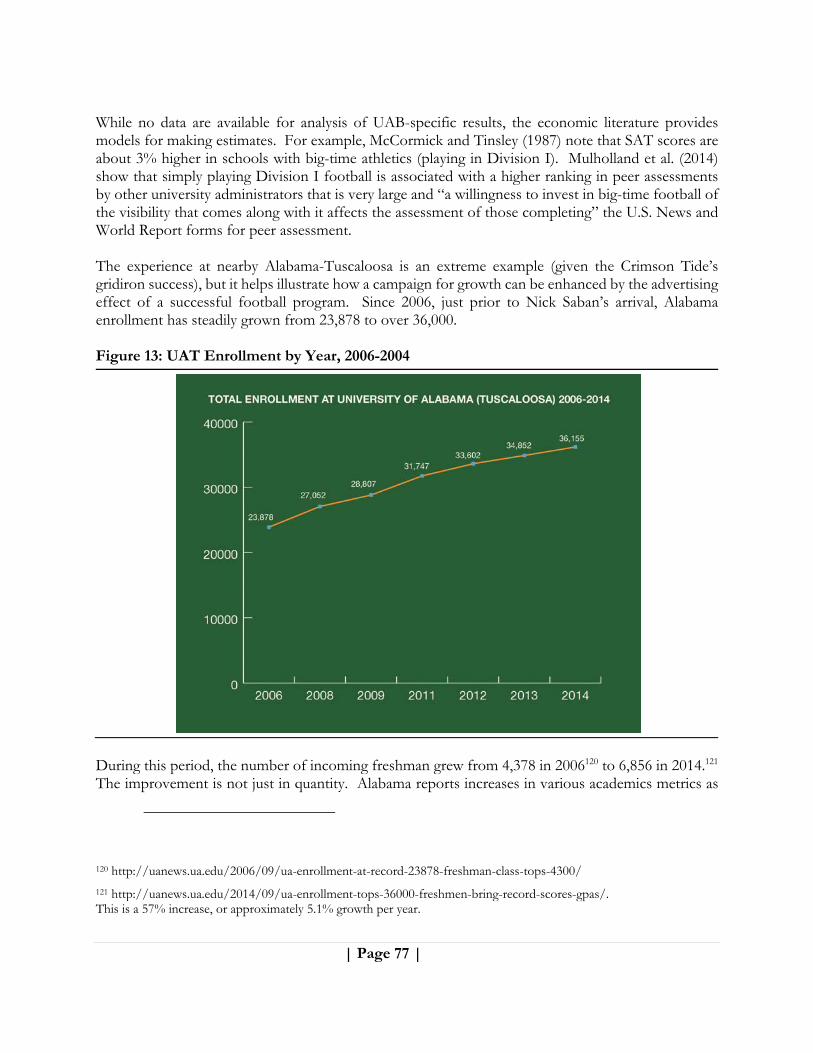
| Page 77 |
While no data are available for analysis of UAB-specific results, the economic literature provides models for making estimates. For example, McCormick and Tinsley (1987) note that SAT scores are about 3% higher in schools with big-time athletics (playing in Division I). Mulholland et al. (2014) show that simply playing Division I football is associated with a higher ranking in peer assessments by other university administrators that is very large and “a willingness to invest in big-time football of the visibility that comes along with it affects the assessment of those completing” the U.S. News and World Report forms for peer assessment. The experience at nearby Alabama-Tuscaloosa is an extreme example (given the Crimson Tide’s gridiron success), but it helps illustrate how a campaign for growth can be enhanced by the advertising effect of a successful football program. Since 2006, just prior to Nick Saban’s arrival, Alabama enrollment has steadily grown from 23,878 to over 36,000. Figure 13: UAT Enrollment by Year, 2006-2004
During this period, the number of incoming freshman grew from 4,378 in 2006120 to 6,856 in 2014.121 The improvement is not just in quantity. Alabama reports increases in various academics metrics as
120 http://uanews.ua.edu/2006/09/ua-enrollment-at-record-23878-freshman-class-tops-4300/
121 http://uanews.ua.edu/2014/09/ua-enrollment-tops-36000-freshmen-bring-record-scores-gpas/. This is a 57% increase, or approximately 5.1% growth per year.
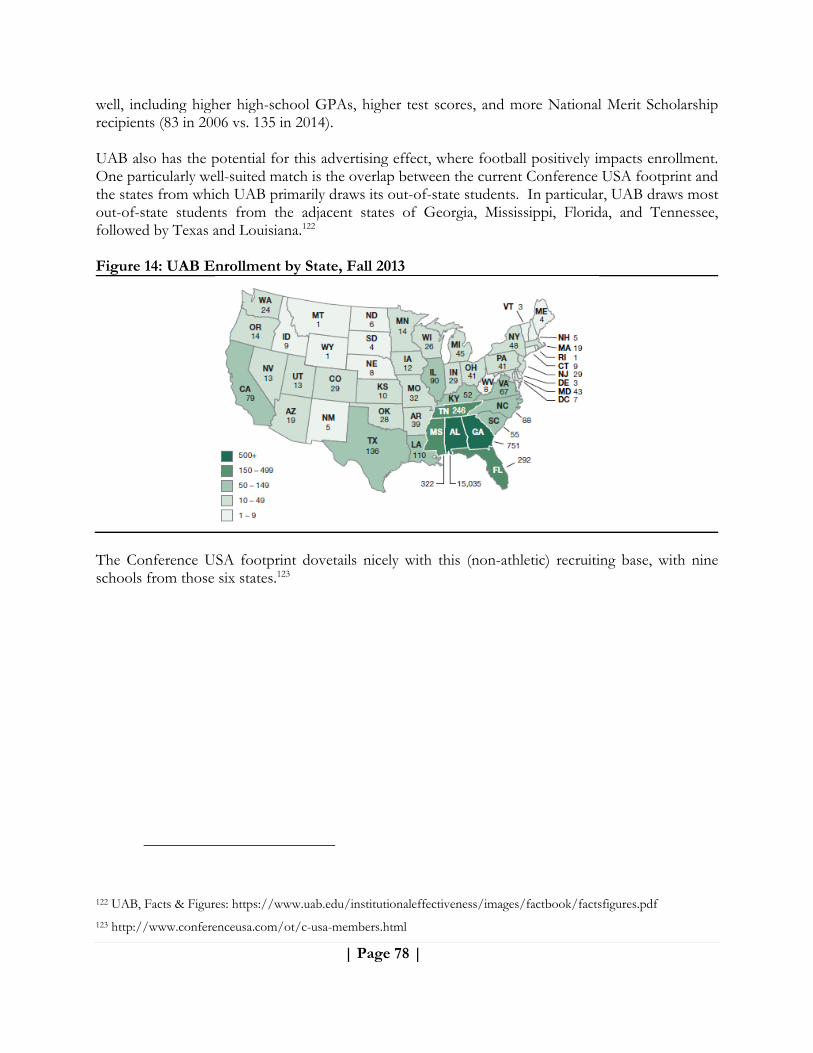
| Page 78 |
well, including higher high-school GPAs, higher test scores, and more National Merit Scholarship recipients (83 in 2006 vs. 135 in 2014). UAB also has the potential for this advertising effect, where football positively impacts enrollment. One particularly well-suited match is the overlap between the current Conference USA footprint and the states from which UAB primarily draws its out-of-state students. In particular, UAB draws most out-of-state students from the adjacent states of Georgia, Mississippi, Florida, and Tennessee, followed by Texas and Louisiana.122 Figure 14: UAB Enrollment by State, Fall 2013
The Conference USA footprint dovetails nicely with this (non-athletic) recruiting base, with nine schools from those six states.123
122 UAB, Facts & Figures: https://www.uab.edu/institutionaleffectiveness/images/factbook/factsfigures.pdf
123 http://www.conferenceusa.com/ot/c-usa-members.html
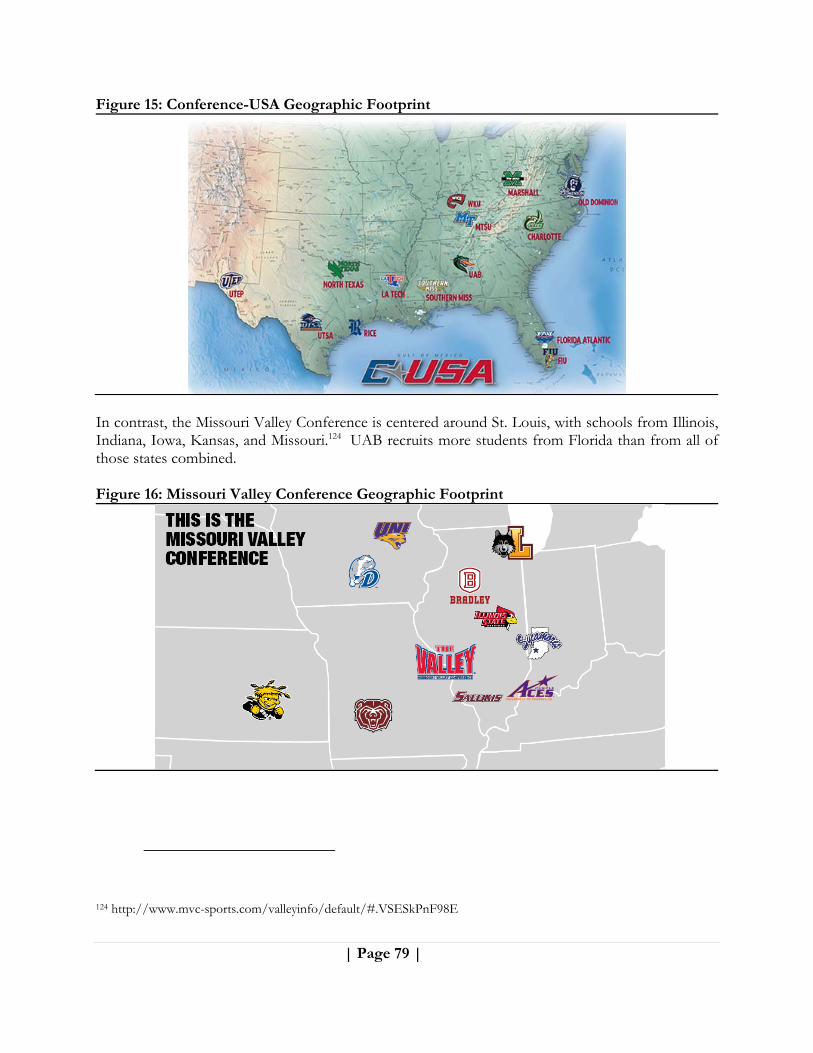
| Page 79 |
Figure 15: Conference-USA Geographic Footprint
In contrast, the Missouri Valley Conference is centered around St. Louis, with schools from Illinois, Indiana, Iowa, Kansas, and Missouri.124 UAB recruits more students from Florida than from all of those states combined. Figure 16: Missouri Valley Conference Geographic Footprint
124 http://www.mvc-sports.com/valleyinfo/default/#.VSESkPnF98E
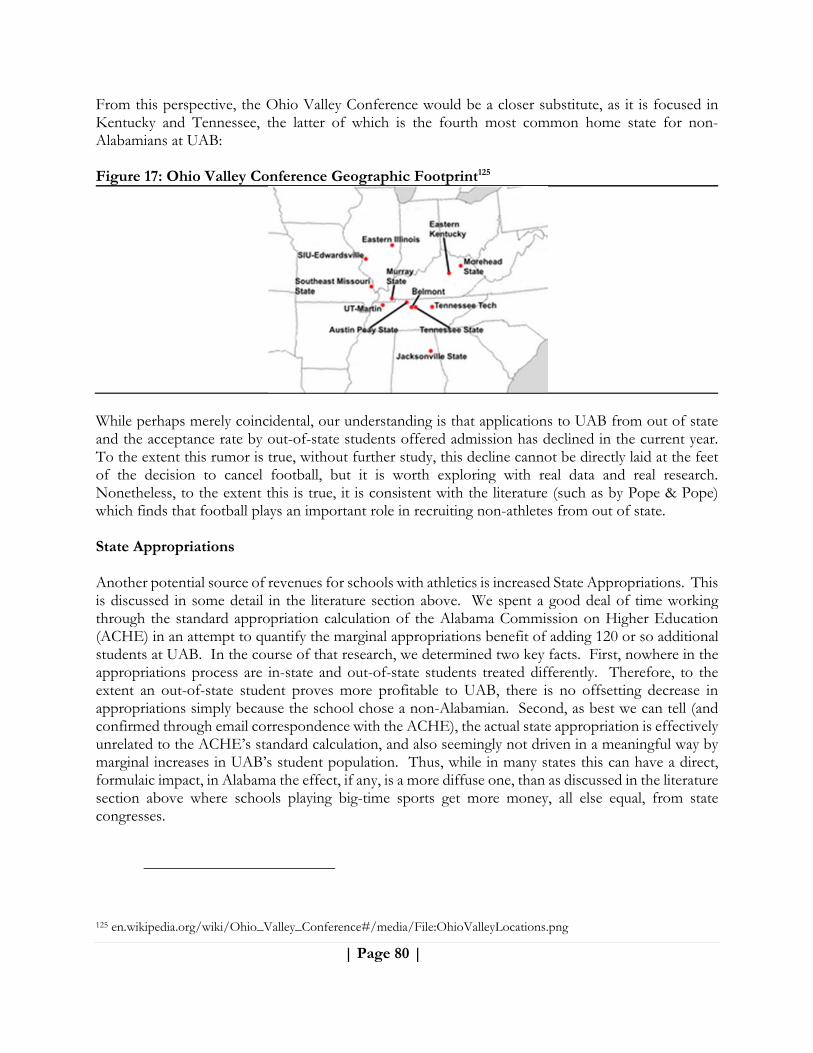
| Page 80 |
From this perspective, the Ohio Valley Conference would be a closer substitute, as it is focused in Kentucky and Tennessee, the latter of which is the fourth most common home state for non-Alabamians at UAB: Figure 17: Ohio Valley Conference Geographic Footprint125
While perhaps merely coincidental, our understanding is that applications to UAB from out of state and the acceptance rate by out-of-state students offered admission has declined in the current year. To the extent this rumor is true, without further study, this decline cannot be directly laid at the feet of the decision to cancel football, but it is worth exploring with real data and real research. Nonetheless, to the extent this is true, it is consistent with the literature (such as by Pope & Pope) which finds that football plays an important role in recruiting non-athletes from out of state. State Appropriations Another potential source of revenues for schools with athletics is increased State Appropriations. This is discussed in some detail in the literature section above. We spent a good deal of time working through the standard appropriation calculation of the Alabama Commission on Higher Education (ACHE) in an attempt to quantify the marginal appropriations benefit of adding 120 or so additional students at UAB. In the course of that research, we determined two key facts. First, nowhere in the appropriations process are in-state and out-of-state students treated differently. Therefore, to the extent an out-of-state student proves more profitable to UAB, there is no offsetting decrease in appropriations simply because the school chose a non-Alabamian. Second, as best we can tell (and confirmed through email correspondence with the ACHE), the actual state appropriation is effectively unrelated to the ACHE’s standard calculation, and also seemingly not driven in a meaningful way by marginal increases in UAB’s student population. Thus, while in many states this can have a direct, formulaic impact, in Alabama the effect, if any, is a more diffuse one, than as discussed in the literature section above where schools playing big-time sports get more money, all else equal, from state congresses.
125 en.wikipedia.org/wiki/Ohio_Valley_Conference#/media/File:OhioValleyLocations.png
| Page 81 |
Project #3 – Media Coverage of UAB – Athletics and Non-Athletics The literature discussed above reveals that for most universities the majority of media coverage is focused on sports rather than academic programs. For example, according to research across 58 universities with big-time football by Clotfelter (2011), fully 87% of all New York Times articles discussing these schools focused on athletics. Although a much more in-depth analysis could be undertaken with more resources and time, as a first pass we performed a Google News analysis of UAB media coverage during the academic year July 1 2013-June 30 2014126 reveals a heavy emphasis on football and athletics. Among more than 100,000 unique articles that year containing the word UAB, some 47% contained the word football, with 21% containing the exact phrase “UAB football”—more than double the coverage of other keywords such as business school, campus, faculty, medical school, and student. Basketball showed slightly lower levels of popularity: 44% contained the word basketball, though the exact phrases “men’s basketball” and “women’s basketball” each appeared in less than 1% of all media coverage. From this, we conclude that sports are a primary driver of news coverage of UAB. This conclusion is consistent with the literature and unsurprising, but nevertheless, it is important to recognize that for all of UAB’s strength in healthcare or in business, the football team was in the news more often, even prior to the controversy surrounding the termination of the program. Loss of coverage of the football team will almost certainly result in reduced media exposure for UAB as a whole.
126 We picked this year prior to the current controversy to avoid the heavy coverage of the decision to cancel football..

| Page 82 |
Table 18: Google News Estimate of UAB Media Coverage Search Term All Words Anywhere Exact Phrase Anywhere
UAB 101,000 101,000
UAB Athletics 20,600 139
UAB Basketball 45,000 1,030
UAB Men's Basketball 27,900 537
UAB Women's Basketball 33,600 57
UAB Blazers 11,500 4,960
UAB Business School 22,600 2
Collat School of Business 58 37
UAB Campus 11,800 1,050
UAB Faculty 3,710 146
UAB Football 47,100 21,200
UAB Hospital 7,650 703
UAB Med School 5,310 8
UAB Medical School 5,190 26
UAB School of Medicine 4,160 171
UAB Professor 3,000 45
UAB Professors 307 5
UAB Sports 49,200 2,390
UAB Student 13,800 980
UAB Students 10,700 86
Source: Google News Advanced Search Date Range: July 1, 2013 - June 30, 2014.
Alongside basketball, UAB football received prominent viewership in select games. Sports Media Watch estimates that UAB playing LSU on September 7th, 2013 drew 659,000 viewers on ESPNU.127 They also estimate that UAB playing Rice on November 21st, 2013, drew 79,000 viewers on FS1.128
127 Sports Media Watch. “College Football TV Ratings”. bit.ly/1ao4XLU. Accessed 4/13/2015.
128 Sports Media Watch. “College Football TV Ratings”. bit.ly/1ao4XLU. Accessed 4/13/2015.
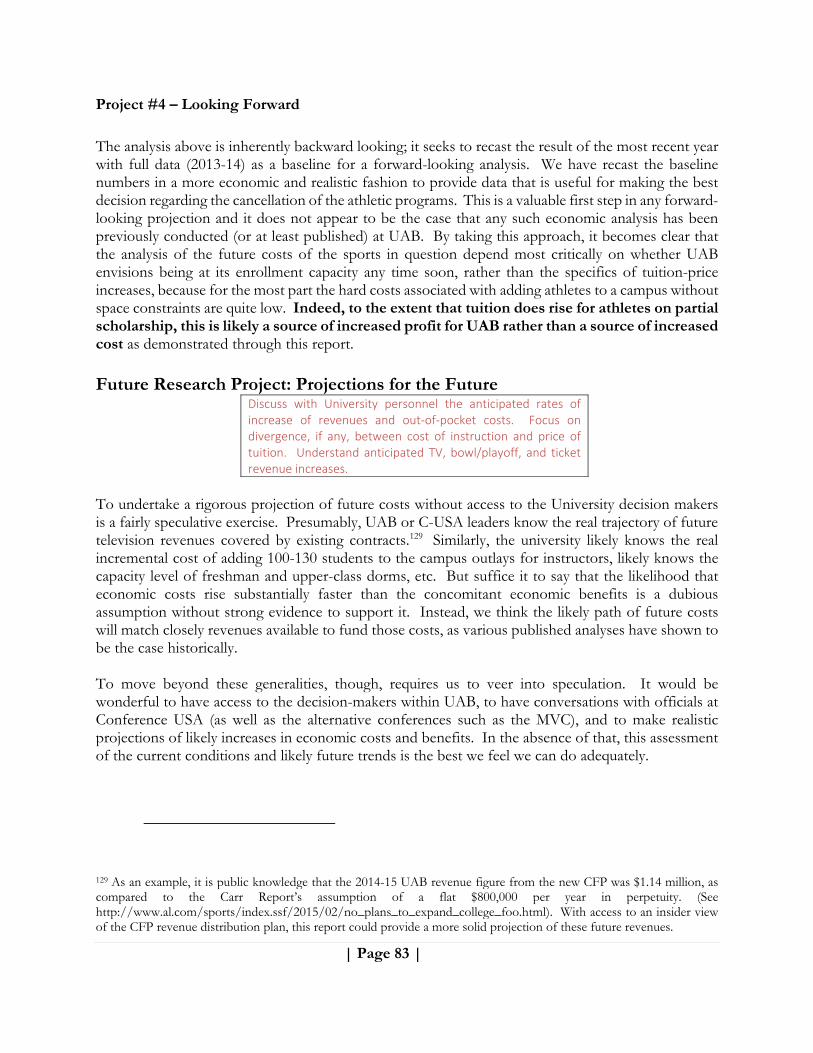
| Page 83 |
Project #4 – Looking Forward
The analysis above is inherently backward looking; it seeks to recast the result of the most recent year with full data (2013-14) as a baseline for a forward-looking analysis. We have recast the baseline numbers in a more economic and realistic fashion to provide data that is useful for making the best decision regarding the cancellation of the athletic programs. This is a valuable first step in any forward-looking projection and it does not appear to be the case that any such economic analysis has been previously conducted (or at least published) at UAB. By taking this approach, it becomes clear that the analysis of the future costs of the sports in question depend most critically on whether UAB envisions being at its enrollment capacity any time soon, rather than the specifics of tuition-price increases, because for the most part the hard costs associated with adding athletes to a campus without space constraints are quite low. Indeed, to the extent that tuition does rise for athletes on partial scholarship, this is likely a source of increased profit for UAB rather than a source of increased cost as demonstrated through this report. Future Research Project: Projections for the Future
Discuss with University personnel the anticipated rates of increase of revenues and out‐of‐pocket costs. Focus on divergence, if any, between cost of instruction and price of tuition. Understand anticipated TV, bowl/playoff, and ticket revenue increases.
To undertake a rigorous projection of future costs without access to the University decision makers is a fairly speculative exercise. Presumably, UAB or C-USA leaders know the real trajectory of future television revenues covered by existing contracts.129 Similarly, the university likely knows the real incremental cost of adding 100-130 students to the campus outlays for instructors, likely knows the capacity level of freshman and upper-class dorms, etc. But suffice it to say that the likelihood that economic costs rise substantially faster than the concomitant economic benefits is a dubious assumption without strong evidence to support it. Instead, we think the likely path of future costs will match closely revenues available to fund those costs, as various published analyses have shown to be the case historically. To move beyond these generalities, though, requires us to veer into speculation. It would be wonderful to have access to the decision-makers within UAB, to have conversations with officials at Conference USA (as well as the alternative conferences such as the MVC), and to make realistic projections of likely increases in economic costs and benefits. In the absence of that, this assessment of the current conditions and likely future trends is the best we feel we can do adequately.
129 As an example, it is public knowledge that the 2014-15 UAB revenue figure from the new CFP was $1.14 million, as compared to the Carr Report’s assumption of a flat $800,000 per year in perpetuity. (See http://www.al.com/sports/index.ssf/2015/02/no_plans_to_expand_college_foo.html). With access to an insider view of the CFP revenue distribution plan, this report could provide a more solid projection of these future revenues.
| Page 84 |
However, this is not to say that economics cannot shed light on some of the assumptions behind the theory that the future health of the athletic department can be strengthened by eliminating the expense (and the benefits) of football, bowling, and rifle. Impact of Economic Base Case on Long-term Projections Proper calculation of the base case is essential for any longer-term projection, so it should be remembered that the most recent year for which we have data is 2013-14 and not 2014-15. In 2013-14, the football team won just two games, and attendance was quite low. In contrast, the 2014-15 squad won six games, attendance doubled and ticket revenues grew by a reported 30%. Our base case ignores this effect to revenue, though our pro forma model adds them in. What one assumes about the future – will it look more like 2013-14 or 2014-15? – is important for projecting financial results. Thus, it is at least possible that a profitable UAB football, bowling, or rifle team could become less profitable, or even money-losing over time. For example, in the analysis above, we calculate that football, bowling, and rifle showed negative cash-flow of approximately $25,000 in 2012-13, the most recent year for which complete data are available. This is an imprecise estimate and so if the difference between go or no-go decision is based on whether the true answer is $200,000 to the negative or $150,000 to the positive, UAB should take care to shore up the foundational assumptions of our analysis before making a final decision. Nevertheless, directionally, we are confident that the accounting data has taken three sports that would have been at least mildly cash-positive (in aggregate on a going forward basis) and created the misleading appearance of substantial losses. That is, after including future revenues that hinge on football, the in-flow of cash from these sports will exceed current costs plus future additional costs of COA stipends and unlimited food for football, bowling and rifle. As Yogi Berra is credited for saying: “It’s tough to make predictions, especially about the future.” It is even more difficult to make predictions about a university without input from the people controlling the future of that institution. Thus, we’ve refrained from developing a full-scale, five-year pro forma. For this limited portion of our work, we’ve instead chosen to review the forecast made by CarrSports (alternatively dated September 3, 2014 and November 18, 2014) and simply to point out the economic impact of two key but questionable growth assumptions, namely the growth in the price of scholarships and the absence of estimated growth in conference revenue which makes Carr’s steep projection of rapidly growing losses a highly dubious assumption. Impact of Projected Growth in the Price of Scholarships In our analysis of the base case for football, bowling, and rifle, we found that listed scholarship expenses of $2.8 million overlooked approximately $1.8 million in revenue benefits (thus these costs are better valued at under $1 million). To that we then added a projected future cost for COA/Food of approximately $575,000 to find a net pro forma expense of around $1.5 million. Drilling in, these costs came primarily from the above-listed COA impact, as well as the opportunity cost of lost dorm revenue. Tuition, specifically, was found to be effectively break-even once true costs (not prices) were estimated and revenue benefits included. The projections from CarrSports built in two steep increases in the cost of scholarships that drove up the accounting expense. From 2013-14 to 2014-15, Carr’s projected cost of each scholarship rose by

| Page 85 |
17%. This projected increase was not based on adding in cost-of-attendance stipends or unlimited food impact, since those changes did not show up on the CarrSports report until the following year (and appear to be separately accounted for as stand-alone expense items rather than being built into the cost of scholarships). Carr was not incorrect with respect to the accounting; UAB’s public data reflect a similar increase. However, to the extent this increase was driven by increases in tuition that were not met by equivalent increases in the actual cost of education, especially on the margin, this increase reflects increased profitability rather than increased costs. To the extent athletic scholarship recipients are not displacing paying customers from being on campus, tuition increases beyond any cost increases make partial athletic scholarships more profitable and have no impact on full scholarships.
For a University, increases in tuition that are not met by equivalent increases in the actual cost of education reflects increased profitability rather than increased costs.
In any event, because we use 2013-14 as out base scenario, these expense increases (but also any offsetting revenue benefits) are built into our base. But the confusion that the accounting can create, where price increases can seem like cost increases, and money making choices can look like money losers, requires that we reiterate our axiom from above.
If the interpretation of standard accounting information can’t properly distinguish between improved revenues and increased expenses, do not rely on it to make important financial decisions correctly.
The following year is projected (by Carr) to show another 14% jump in the cost of a scholarship Again, no detail is provided for the source of the price increase, whether the university feels it will raise tuition by $3,400 per student, or get this increase through a combination of tuition, room, and board. (COA and unlimited food remain separately accounted for). To the extent this increase is focused on tuition rises above and beyond the actual marginal cost of educating 130 football, bowling, and rifle students, then regardless of how fast this listed cost rises, the impact on the Athletic department’s accounting (an apparent increase in expenses) is completely backward from the actual impact on UAB (increased revenue from partial scholarship at higher prices). That is, if the price of tuition were to rise $3,400 per athlete between the current year and the next, our estimated impact on the cash position of UAB as a whole from maintaining football, bowling, and rifle (and receiving increased payments from scholarship recipients and a fraction of walk-ons) is an increase in net cash of over $70,000, rather than an increase in expenses (as would be listed by UAB) of approximately $300,000. In the grand scheme of a billion dollar institution, a $370,000 swing is unremarkable, but for a program that is somewhat above break-even, a systematic inability to record these revenues (and instead treat them as increased expenses) tells a distorted picture. Another small but revealing element built into the CarrSports numbers is the assumption that the three sports in question, football, bowling, and rifle, will change their historical scholarship usage. Per CarrSports, in 2013-14, UAB was projected to grant 79.12 football GIAs (excluding medical redshirts, etc.), 2.47 bowling GIAs, and 3.6 Rifle GIAs. This tracks well with the actual results for that year, where UAB reported 78.5 football GIAs (again, excluding medical redshirts), 2.47 bowling, and 3.6
| Page 86 |
rifle scholarships. However, for the following year, CarrSports assumed that UAB would max out its allowed scholarships under NCAA rules, giving out a full 85 football scholarships, 5 bowling, and 3.6 rifle. The same assumption was made for all other sports as well - the result being that CarrSports assumed the total number of scholarships granted would increase by 17. Perhaps. But it’s not clear that such increases will actually occur, nor whether they will be necessary. As one example, we understand the Women’s Bowling team finished in the top 20 nationally at 2.47 scholarships. Doubling the number of scholarships to 5 would likely turn that program from profitable to money losing, especially if it simply involved giving more scholarship aid to the same athletes (those who proved willing to attend at a lower discount). We would surmise the eight women bowlers, as well as the coach, would have preferred the current level of funding, a top-20 finish, and net positive cash-flow over a projection of an increase in funding that had the ironic result of terminating the program, driving scholarships and payments to the coach down to zero. Sometimes a projected quest for excellence is anything but. From this point on, CarrSports projects scholarship expense increases of ~3% annually. To the extent these bear out across all categories of a GIA, the effect of costs and revenues will tend to offset. This seems a more reasonable assumption for the entirety of the pro forma period. In other words, the projected growth in the list price of an athletic scholarship from now until 2018-19 is unlikely to have any major impact on the net cost of the three programs under study, and to the extent the list price grows faster than marginal costs, this likely makes the cash impact of the sports a net positive impact rather than Carr’s projected negative impact. Thus, based on our outsider’s perspective, we do not see a strong case that the future growth of the “Athletic Financial Aid” line will drive up the true cost to UAB of having a football, bowling, or rifle team, or indeed, of adding a financially well-crafted new women’s sport. Impact of Projected Growth in NCAA/Conference Revenue UAB’s growth projections from the NCAA and Conference USA in a “with football” scenario was extremely tepid. The 2013-14 total in Carr was listed at a budgeted $2.7 million. The actual value was $2.9 million. For 2014-15, the first year in which new College Football Playoff (CFP) money was distributed, CarrSports projected that annual revenue would jump to $3.5 million, which assumed an additional $800,000 in CFP playoff money (off of a lower C-USA base). The final numbers from C-USA are not available, but the payoff piece is known to have actually hit $1.1 million.130 From this point on, CarrSports assumed mild NCAA revenue growth and perfectly flat C-USA growth. These figures strike us as very, very conservative, to the point of being demonstrably incorrect. Our understanding is even if C-USA is the worst performing conference in all of FBS, the minimum distribution to UAB will be in excess of $800,000 per year, and that minimum is set to grow moderately
130 http://www.al.com/sports/index.ssf/2015/02/no_plans_to_expand_college_foo.html).

| Page 87 |
each year. We understand that the MAC conference, another non-power football conference, recently renewed its ESPN TV contract and received something like an eight-fold increase.131 A jump like that may not be possible for C-USA, but it is hard to imagine the steady increases in television revenue that pervades the college football world will somehow completely evade C-USA. With that said, Carr’s projections for UAB without football were based on the extremely questionable assumption that UAB would continue to receive distributions from C-USA even without a football program. We think zero is a much more realistic estimate for future C-USA distributions given that continued membership in Conference USA is anything but assured if football is cancelled. Even if UAB is given a grace year to help it transition (either back to full membership or out to a new conference), it is possible that Conference USA will distribute far less than the generous pro rata levels assumed in the Carr report132 – perhaps no distribution at all would be made for the interim year of 2015-16.133 As shown above, as best can be determined from public data, a strong basketball-only conference like the OVC or the MVC distributed far less to its conference members than CarrSports’ projected figures for ongoing operations without football. Thus, while we think the with-football scenario likely understates future revenues, the without football scenario much more likely overstates them.
Future Impact of Projected Growth Without these two doubtful assumptions, there really isn’t much difference between the UAB projected future and the present. Revenues and expenses otherwise grow moderately and in sync, with the exception of COA Stipends already built into our pro forma base scenario. Thus, from an outside perspective, we see no reason that the present level of more-or-less break-even to slightly profitable economics would not continue throughout the five-year period, especially if the University chooses to run a program with an eye to the bottom line. Of course, the cautions of Yogi Berra should be borne in mind, especially with the additional caveat that we have no access at all to UAB’s own internal projections of the future, nor did our limited period of access provide us with an opportunity to understand these elements of the school’s thinking. Our conclusion is thus limited by our reliance on public data. But suffice it to say that based on those public data, we see no compelling reason to assume the 2018-19 position of the three sports in question would be qualitatively different from the current break-even levels, given that we’ve pre-burdened the present pro forma case with anticipated future costs of providing COA stipends.
131 See www.chicagotribune.com/news/watchdog/ct-mac-espn-contract-20150318-story.html: “Though MAC schools would not say how much they’re receiving and whether that money will cover the costs of their new production obligations, public records suggest annual payouts will start between $830,000 and $845,000 per school — eight times more than the previous deal”
132 The foreseen lost NCAA/Conference revenue from Carr for the last year before CFP revenues was $1.35 million (Carr Report, Exhibit 2, p. 19. Compare also 2013-14 budget (2.7 million) with 2016-17 projections ($1.35 million) at Exhibit 2, p.5). This is less of a reduction in revenue than projected in the 2008 report prepared for Chancellor Portera (which was $1.5 million), despite six years of rapid revenue growth for college sports (Portera Report, 2008, p. 11).
133 It is our understanding that one possible outcome is that UAB is given a year’s grace period (2015-16) to stay in C-USA without football, but that in return, UAB will forfeit its share of all conference distributions.
| Page 88 |
Short-term Impact of Cancelling Football The exercise of generating annual pro forma projections can often be fairly mechanical. Without a good sense of how, say, the cost of athletic trainer salaries will grow over the next several years, an analyst might assume the projected rate of wage inflation throughout the deep south is a reasonable estimate. Given the unlikelihood of this estimate being materially wrong, there isn’t much reason to dig deeper. Past is often assumed to be prologue when analysts grow out the present into the future. But one element of the UAB football program that makes the base case a more tenuous projection of the near future is the short-term damage done to the programs finances by the abrupt cancellation of existing contracts, both with athletes who have already transferred away from UAB (which we address below) and with schools to which UAB was contracted to travel to play game. These include away “guarantee” games – where UAB was slated to receive a guaranteed payment and the home games, where UAB in turn guaranteed a payment to the visitors. Our understanding is that the process of unwinding the existing contracts UAB has resulted in a series of payments from UAB to third-parties with substantial negative impact to UAB’s finances:134
“UAB will have to pay $2.425 million for canceling future games with Tennessee, Kentucky, Troy, South Alabama and Georgia State, sources told ESPN’s Brett McMurphy. UAB was scheduled to play Tennessee in Nashville in 2015 and at Kentucky in 2016. UAB must pay Tennessee $925,000 and Kentucky $500,000 to get out of those games. The Blazers also must pay for canceling future home-and-home series in 2015 and 2016 with Troy ($400,000), South Alabama ($300,000) and Georgia State ($300,000), which will cost UAB a total of $1 million to end.”
Unlike much of the intra-UAB accounting entries, these are real, hard cash payments to outside entities. By itself, these payments look to have cost UAB more money than would have five years of COA stipends, the primary new cost of running the three programs. But more importantly, they leave a hole in any future projection, in that if UAB restores football, new non-conference contracts will need to be signed in an environment where supply of appropriate home-game opponents may be tight and where demand from schools for UAB may be (temporarily) depressed because other opponents have been scheduled into would-be UAB slots. This could result in lower-than-historical guarantee payments (which were $1.7 million in 2013-14) and higher-than-historical guarantee expenses (which were approximately $300,000 in 2013-14). Our report cannot solve this problem with a spreadsheet. This will require hard work from the UAB athletics department to get UAB back to the level of revenue generation it had achieved prior to the termination of the program, and to sustain and grow that level going forward. It may be the case that regional power-five schools, recognizing the value of having healthy FBS opponents for their own non-conference schedules, may work to help UAB regain its historical level of revenue-generation,
134 http://espn.go.com/college-football/story/_/id/11967626/uab-blazers-shut-football-program

| Page 89 |
but to the extent this takes time, UAB could experience a short-term revenue gap. The school and its donor community should be prepared for this as a real consequence of the abrupt cancellation of the programs and should prepare to meet any short-term gap with increased funding. Future Research Project: Guarantee Games
Discuss with university personnel the likely time to restore UAB to full health with respect to guaranteed away game contracts and guaranteed home game payments.
Similarly, the football team effectively cancelled its contracts with dozens of football athletes with remaining eligibility. These athletes were the foundation of the next years’ on-field product. It is not uncommon for a start-from-scratch FBS team to need several years of recruiting to build to a respectable level of on-field quality. The exodus of talent from Birmingham is a temporary but real loss that can only be repaired by dint of hard recruiting work and through the passage of time. Important questions remain. Will the NCAA allow departed UAB athletes to return if they wish without penalty, or would they need to sit out a year as a normal transfer student? Will those athletes, some of whom are now projected starters at comparable or higher-level programs, even want to return given the nature of their departure? Will UAB be allowed to exceed the annual twenty-five initial counters to which FBS programs are normally restricted? If not, the school will need several years before it can reach a full complement of 85 scholarship athletes. Can the school fill the gap with junior college transfers? Future Research Project: Replacing Lost On-field Talent
Discuss with NCAA, C‐USA, university personnel and Coach Clark the anticipated exceptions to standard recruiting and transfer rules. Understand better the time frame to return the team to the same level of quality as the 6‐6 squad.
The lost revenue-generation potential of away-game contracts and of an on-field football product that had positive momentum appear to be what tennis fans would call “unforced errors” that cost the school in the short-term and likely will impede the rapid resurgence of the program if it is restored. In the biblical Book of Job, once the Lord is finished with his test of Job, he replaces Job’s wealth and lost children with greater wealth, and with ten new children. In the end, “Job lived 140 years, and saw his sons, and his sons’ sons, four generations. And Job died, an old man, and full of days.”135 Unstated in the Bible is how long it took Job and his wife to restore their life to its former glory. Just as it likely took Job time to replace ten new children and to heal the wounds from the first loss, so too UAB will likely face a period of recovery, in which its wounds, emotional and financial, will take time to heal. However, it is also possible that the broader FBS community of universities steps in to help UAB regain its spot in the football program pecking order, rather than starting from scratch, and that the Birmingham community can provide funding (and high fan interest) to bridge the gap while the team
135 Book of Job, 42:16-17.

| Page 90 |
rebuilds its schedule and its talent pool. And so we discuss the potential short-term benefits of reminding the community of its love for the football program and harnessing the renewed appreciation of what was lost and now may be regained, illustrating this with a case study of the University of California-Berkeley’s threat to cancel programs that ultimately led to restored health for many sports at Cal. Improving Fund-Raising through the Threat to Cancel Sports: UC-Berkeley Case Study Sometimes, a community can take an athletics program for granted and the result may be that outward signs of community interest – ticket sales, donations, etc., – can begin to decline. This does not seem to have been the case in Birmingham, but in a recent example in Berkeley (home of the flagship school of the University of California system and the Golden Bears sports program) illustrates how, even if interest appears low, often all it takes is a credible threat that sports may be in jeopardy to re-awaken community passion. In late September 2010,136 the University of California-Berkeley (UC-Berkeley) announced, with little or no prior communication to the community, that the budget crisis brought on by the late 2000’s recession was going to result in the cancellation of five sports: baseball, rugby, women’s lacrosse and men’s and women’s gymnastics. The UC-Berkeley community reacted with anger and a sense of frustration, similar to what has been experienced in Birmingham, and with a similar focus on feeling disempowered from the decision process, but also eager to undertake whatever fund-raising was necessary to help bridge the funding gap for the sports in question. The University cancelled all five sports – and in many cases the most-sought-after athletes transferred to rival programs – but based on the strong emotions generated in the alumni community, the university agreed to restore the sports if sufficient funds could be raised. The community responded. Within four months, sufficient funds were raised to restore all five sports at different levels of activity. Based on discussion with the Athletic Department, we’ve learned that the Cal Baseball program raised about $10 million as a quasi-endowment for the team, and has the goal to raise another $2 to $3 million. About $900,000 was used in the most recent year to pay for scholarships and other gaps between listed revenues and listed costs. In essence – the money that Cal would otherwise be labeling as “direct institutional support” has been converted to a charitable donation drawn from the fund. This fund raising has created a new revenue stream for Cal Athletics (and UC-Berkeley as a whole). UC-Berkeley is particularly well-known for its Rugby team and has a strong Rugby alumni community. Because of this, the school was able to ask Rugby to make a special commitment. The community has committed to covering the Rugby program’s funding gap, but also to cover an additional $150,000 per year to help pay for the cost of women’s lacrosse and gymnastics. This does not cover the entirety of those two sports’ needs (which is on the order of $1 million), but it makes a dent in that funding gap and thus also covers the Title IX “matching costs” associated with having Rugby as a varsity men’s sport.
136 http://www.sfgate.com/collegesports/article/Cal-cuts-sports-baseball-gymnastics-lacrosse-3173025.php

| Page 91 |
The Athletic Department was quick to emphasize to us in our discussions that it will continue to insist on community support for these sports. The agreement to keep these five sports is conditional on continued community funding. While this keeps the program’s feet to the fire, it also seems to have rallied the community into greater interest in the sports themselves, now that they are partners with the university. For example, the Department feels that baseball is more popular than before (attendance is certainly higher), possibly because of the crystallizing effect of cutting the sport had on its fan base. The teachings of the UC-Berkeley experience is that even a surprising and community-displeasing decision to cancel sports can be turned around if the community and the university work together to ensure that sports (if they have sufficient community backing) are allowed to thrive, while also ensuring that the community “puts its money where its mouth is.” Obviously, no college town has an entitlement to any specific sport. The best way to ensure that demand for a given sport like football is met with supply is to help fund that supply. The UC-Berkeley experience teaches us that such cooperative efforts are possible, and that even the dramatic act of cancelling an entire sport and letting athletes transfer away need not be fatal. Economic Analysis of Past Efforts to Cancel Football to Improve Rest of University Professor Michael Hutchinson and one of the co-authors of this report (Daniel Rascher) have analyzed twenty-one universities which compete in athletics in Division I, but which dropped football at some point during 1985-2010. The analysis examines the five years prior to the dropping of football and the five years after. The focus is on whether the decision improved other outcomes on campus.
1. Did the men’s basketball program improve vis-à-vis its competitors after dropping football?
2. Did the U.S. News & World Report’s ranking of the schools academics improve after dropping football?
3. Did the SAT scores for incoming freshmen improve for the school after dropping football?
4. Did the school increase enrollments after dropping football?
The answer to each of these questions is “no.” (which we explain in more detail) after first presenting a list of the universities in the study.

| Page 92 |
Table 19: Schools That Have Dropped Football But Remained in Division I Institution First Year Without Football
University of Texas at Arlington 1986-1987 Southeastern Louisiana University 1986-1987 Wichita State University 1987-1988 Lamar University 1990-1991 California State University, Long Beach
1992-1993
California State University, Fullerton 1993-1994 University of the Pacific 1996-1997 Boston University 1998-1999 University of Evansville 1998-1999 California State University, Northridge 2002-2003 Canisius College 2003-2004 Fairfield University 2003-2004 St. John’s University 2003-2004 East Tennessee State University 2004-2005 Siena College 2004-2005 St. Mary’s College of California 2004-2005 St. Peter’s University 2007-2008 La Salle University 2008-2009 Iona College 2009-2010 Northeastern University 2010-2011 Hofstra University 2010-2011
Question 1: Did the men’s basketball program improve after dropping football? The schools on the list averaged being ranked 148 in the Sagarin Men’s Basketball Rankings during the 5 years prior to dropping football. After dropping football, those same schools averaged being ranked at 176 (median comparisons were 135 and 183, respectively). The pre- and post-rankings are statistically significantly different from each other, and show that the men’s basketball programs did not benefit, and actually suffered, from football being cut.
Question 2: Did U.S. News & World Report’s ranking improve after dropping football? The sample size is only eleven for the question of the US News & World Report (USNWR) rankings because earlier football drop dates in the 1980s don’t correspond with USNWR actually putting out rankings, or those schools were not ranked by USNWR. The average pre-drop rankings were 66, with the post-drop rankings being 70 (median was 60 and 63, respectively). These are not statistically significantly different from each other. Thus, the schools did not improve their academic ranking after having dropped football.
| Page 93 |
Question 3: Did SAT scores for incoming freshmen improve after dropping football For the fifteen schools which reported SAT scores for the sample of schools, the average SAT score rose from 1,078 to 1,105 (with the media rising from 1,095 to 1,104). This is not statistically significant, implying that there was no change in SAT scores during the 5 years prior to dropping football compared with the 5 years afterwards. It is important to note that the average SAT score for all schools grew from 994 in 1980 to 1,028 in 2005.137
Question 4: Did the school increase enrollments after dropping football Eighteen schools reported enrollments for the years preceding and after dropping football. Those enrollments averaged 15,728 prior to dropping football and 16,081 afterwards, a growth of 2.2% over those time periods (median is 9,993 and 10,233). The difference is not statistically significant, thus dropping football did not correspond with an increase in enrollments. Importantly, during 5-year increments from 1985 through 2000, average enrollment grew by 6.2%, meaning that on average, the schools which dropped football grew more slowly than the average school across the U.S.
Economic Impact of UAB Football on the Birmingham Community This analysis looks beyond the borders of the University itself into the City of Birmingham for the impact that UAB football has on the community. A typical economic impact analysis of a football program would rely on survey data of football patrons attending a football game (and assess their spending habits).138 This analysis is a secondary study, meaning that it relies on research from other relevant studies. Economic impact is based on the theory that a dollar flowing into a local economy from outside of the local economy is a benefit to the locality. In order to measure economic impact, the cause of the impact must first be identified. The most important underlying principle in evaluating economic impact is to measure new economic benefits that accrue to the region that would not have otherwise occurred. While this sounds simple, part of the difficulty lies in measuring what would have happened to the region without the event having taken place, considering that the situation is purely hypothetical. Therefore, the question at hand is: how is the local economy (i.e., the City of Birmingham) financially impacted by UAB having football (and playing half of a dozen games in the city each year)? These impacts typically occur by visitors to the city spending money in hotels, restaurants, bars, retailers, gas stations, within the stadium itself on concessions, etc. Legion Field generates revenues (unknown to us) by having those six or so games each year. Those revenues, we believe, are captured by the City of Birmingham and represent direct positive financial impacts to the City.
137 http://www.infoplease.com/ipa/A0883611.html
138 Our firms have deep experience in conducting these studies, but this is well beyond the scope of our current assignment. We would be eager to do follow up work if called for.
| Page 94 |
Additionally, visiting teams spend money staying overnight, as do media entities producing the game or covering it. Moreover, sponsors often activate their sponsorship of college football programs by hosting ancillary events pre- or post-game, such as the fan experience zone hosted by Carlisle’s BBQ. If any of these situations causes money to be spent in Birmingham that would not have otherwise been spent, then there is potentially positive economic impact from the football games. In the 2014 football season, the six home games averaged 21,841 in attendance. We assume that 25% of those fans were visitors from outside of the City of Birmingham who would not have come to Birmingham that day/weekend had there not been a football game.139 This is an assumption we would typically expect to replace with empirical data through an on-site survey, but instead we have based this assumption on information from the University of South Alabama and a Pac-12 university noting 25% and 33% of fans attending games were visitors, respectively.140 This conservative estimate implies that about 32,750 visitors came to Birmingham because of UAB football over the course of a season. We’ve ball-parked an average level of spending by those fans to be $42 per person; this is an intentionally low estimate based on studies that include Penn State, LSU, University of Georgia, Ohio State, University of Missouri, and the University of Tennessee where out-of-town fans spent an average of $85 per game. Our estimate of $42 does not include spending inside of the stadium (which may add another $10 or more per person). Thus, from this very conservative method, total spending by visitors to Birmingham because of UAB football is estimated to be about $1.375 million per year. Additionally, spending by visiting teams, sponsors activating sponsorships, visiting media covering the game and producing the game, and even UAB itself in order to host the game is assumed to be $100,000 for the entire season. (This may be extremely conservative in that a report by WBHM notes that “UAB alone projects that the school spent $1.3 million in the city each game day.”141 That alone would amount to $7.8 million for the entire season.) The additional $100,000 in non-spectator spending brings the Direct Economic Impact to nearly $1.5 million.142 To be clear, this $1.5 million may be well shy of the true impact of UAB football on the City of Birmingham. If we had relied on the average of the other secondary studies without imposing conservative downward adjustments, the Direct Economic Impact would be closer to $7 million.
139 And it did not replace another visit to the City.
140 The University of Nebraska-Lincoln determined that 57% of fans come from outside of the Lincoln metro area.
141 https://www.wbhm.org/News/2014/uabfootballbusiness
142 It is common to then calculate what happens to those initial expenditures. Typical findings from the Bureau of Economic Analysis shows that 60% of that money gets re-spent within the local economy, netting a Total Economic Impact of nearly $2.4 million for the season.
| Page 95 |
The implication is that the City of Birmingham has a financial vested interest in having UAB play football in the City, separate from any possible public consumption benefits that equate to quality-of-life enhancements to the community – that is, separate from the general fun of having a home-town FBS team. If the University calls upon the community to support the team, in turn the community can know that a probable $1.5 million (and likely more) per year in economic benefits will flow into the City from football. Title IX issues: Would a UAB with Football need to add an additional Women’s Sport? The authors of this report are not attorneys. Nothing anywhere in this report should be mistaken for legal advice, especially in this section. However, because Title IX as applied to collegiate sports programs has a strong economic element, this section lays out the economic choices facing UAB with respect to Title IX based on our economic understanding of how the law has been implemented. Please do not mistake this for legal advice. Our understanding of the practical implementation of Title IX comes from study of universities’ conduct and from specific statements made by the Department of Education (DoE). Key resources include the following DoE sites:
http://www2.ed.gov/about/offices/list/ocr/docs/clarific.html
http://www2.ed.gov/about/offices/list/ocr/docs/bowlgrn.html
http://www2.ed.gov/about/offices/list/ocr/docs/interath.html
According to the DoE:143
“The Title IX regulation provides that if an institution sponsors an athletic program it must provide equal athletic opportunities for members of both sexes. Among other factors, the regulation requires that an institution must effectively accommodate the athletic interests and abilities of students of both sexes to the extent necessary to provide equal athletic opportunity.”
The DOE explains that it has made a three-prong test to determine whether a school is compliant with the above goal. In the words of the DoE,144 the three-prongs are as follows:
1. Whether intercollegiate level participation opportunities for male and female students are provided in numbers substantially proportionate to their respective enrollments; or
2. Where the members of one sex have been and are underrepresented among intercollegiate athletes, whether the institution can show a history and continuing practice of program expansion which is demonstrably responsive to the developing interests and abilities of the members of that sex; or
143 http://www2.ed.gov/about/offices/list/ocr/docs/clarific.html
144 http://www2.ed.gov/about/offices/list/ocr/docs/clarific.html#two
| Page 96 |
3. Where the members of one sex are underrepresented among intercollegiate athletes, and the institution cannot show a history and continuing practice of program expansion, as described above, whether it can be demonstrated that the interests and abilities of the members of that sex have been fully and effectively accommodated by the present program.
The first prong is the simplest to explain — is the male/female (M/F) ratio of the athletic department “substantially proportionate” to the M/F ratio of the undergraduate population? (As shown below, the DoE interprets “substantially proportionate” to be within one percentage point of a comparison ratio). Alternatively, two other prongs exist to show compliance. One (Prong Three above) is that “it can be demonstrated that the interests and abilities of the members of that sex have been fully and effectively accommodated.” Often this is shown via a survey. And the other (Prong Two) is a “progress” standard, which basically amounts to a requirement that the number of women participating has been increasing (at least increasing monotonically, i.e., either flat or up) each year in a steady way, i.e., “a history and continuing practice of program expansion.” The DoE has made it clear that:
“… institutions need to comply only with any one part of the three-part test in order to provide nondiscriminatory participation opportunities for individuals of both sexes. The first part of the test—substantial proportionality—focuses on the participation rates of men and women at an institution and affords an institution a “safe harbor” for establishing that it provides nondiscriminatory participation opportunities. An institution that does not provide substantially proportional participation opportunities for men and women may comply with Title IX by satisfying either part two or part three of the test.”145
Because the authors of the study no longer have access to internal UAB resources, we do not know under which prong UAB currently complies with Title IX, to the extent it is in compliance.
145 http://www2.ed.gov/about/offices/list/ocr/docs/clarific.html
| Page 97 |
Future Research Project: Title IX compliance Discuss with university personnel under which prong (if any) the university believes it complies with Title IX. Discuss with university personnel the apparent need for additional female participation and financial aid to work towards better compliance with Title IX. Understand current assessment of compliance. Understand the true economic costs (and benefits) of adding a women’s sport. Can it be done in such a way that the net cash impact is actually positive by focusing on recruiting out‐of‐state women to compete using partial scholarships based on more profitable out‐of‐state rates?
Based on our understanding, Prong One is subject to simple, objective verification: it is essentially an arithmetic exercise. We undertake this analysis below, both for the current UAB and for a scenario without the three sports in question.
The Three-part Test of Nondiscriminatory Participation Opportunities Prong One: The “… institution provides intercollegiate level athletic participation opportunities for male and female students in numbers substantially proportionate to their respective full-time undergraduate enrollments” Like a great number of U.S. universities in the 21st century, UAB has more undergraduate women than men. According to 2013-14 data,146 UAB had 3,501 male undergraduates and 4,856 female undergraduates. Thus men comprised only 41.9% of the undergraduate population. In the same report, UAB lays out that in terms of participation, it had 214 male and 205 female athletes (though in some cases, a single athletes counts more than once by playing multiple sports). Thus UAB reports that males comprised 51.1% of participants. Obviously, if the test requires male participation to be within one percentage point of the undergraduate ratio, 51.1% is not with one percentage point of 41.9%.
146 UAB states it used Fall Semester 2013 data.
| Page 98 |
In the absence of the three sports in question, UAB’s participation levels would drop. 116 men and 20 women participated in those sports (and to our knowledge, none of these athletes were included on a second roster for Title IX purposes). This would leave 98 men and 185 women, and thus change the male participation rate from 51.1% to 34.6%. This would leave UAB out of compliance, but now men would be underrepresented athletically, since 34.6% is more than one percentage point below the male undergraduate rate of 41.9%. We believe this is why UAB has suggested it would implement a men’s cross country program.147 From a pure numbers perspective, it appears that cross country program would do the trick if approximately 30 men participated. That is, if UAB’s non-football male athlete population were increased to 128 men, the male ratio would reach 40.9% and thus be within one percentage point of the undergraduate male population. Future Research Project: Is UAB without football in compliance with Title IX
Discuss with university personnel the impact of Title IX compliance from cancelling the sports in question.
We also note that the DOE has listed the time needed to start a program as a potential excuse for short-term non-compliance, but then also adds:
“… if a university asserts the phase-in of scholarships for a new team as a justification for a disparity, the university may be required to demonstrate that the time frame for phasing-in of scholarships is reasonable in light of college sports practices to aggressively recruit athletes to build start-up teams quickly.”148
Prongs Two and Three In the absence of compliance with Prong One, a school can point to either of the other two prongs as evidence of compliance. The other two prongs are far more subjective and thus difficult for an outsider to assess. Nevertheless, our understanding is that there may be some internal concern that the university meets none of these criteria. In such a situation, our understanding is that taking steps to resume compliance with Prong Two may be an option for schools. Those criteria include:
“OCR will review the entire history of the athletic program, focusing on the participation opportunities provided for the underrepresented sex. First, OCR will assess whether past actions of the institution have expanded participation opportunities for the underrepresented sex in a manner that was demonstrably responsive to their developing interests and abilities…. There are no fixed intervals of time within which an institution must have added participation opportunities. Neither is a particular number of sports dispositive. Rather, the focus is on whether the program expansion was responsive to developing interests and abilities of the
147 We also understand that UAB needs to add cross country just to meet the basic Division I requirement that schools sponsor at least 14 sports. We understand that UAB plans to offer 5 scholarships in this sport. To the best of our knowledge, this proposal has now been enacted, with Cross Country set to begin for 2015-16. See http://www.uab.edu/students/announcements/item/1629-uab-athletics-will-add-mens-cross-country-fall-2015
148 http://www2.ed.gov/about/offices/list/ocr/docs/bowlgrn.html
| Page 99 |
underrepresented sex. In addition, the institution must demonstrate a continuing (i.e., present) practice of program expansion as warranted by developing interests and abilities.”149
Thus, to the extent a school believes it is currently out of compliance with all three prongs, one straightforward way to resume compliance is resume compliance with Prong Two by adding an additional women’s sport that is “responsive to developing interests and abilities of the underrepresented sex.”150 In essence, to the extent a school is out of compliance, we understand a school can restart the Prong Two clock by adding a sport and then remaining responsive thereafter. This is our understanding for why it has been recommended that UAB add women’s swimming as a sport if the three sports in question are resumed. Only legal counsel can answer whether adding such a sport would suffice to resume compliance with this prong. However, we feel it is imperative to point out that, as is the case with women’s bowling, that properly managed, adding a modest women’s sport program can be neutral (or even positive) to the school’s overall financial position. Since, as the Department of Education and the Office for Civil Rights make clear it has a preference for compliance from adding overall opportunities, rather than reducing them,151 if adding a women’s program is revenue neutral or better, it is our understanding that this is more in the spirit with the policy underlying implementation of Title IX than cutting both men’s and women’s opportunity to reach compliance. Should UAB take this approach, a well-managed process emphasizing partial scholarships to athletes from out of state has the possibility of adding sufficient outside revenue (from tuition, from additional NCAA grants for sports sponsorship and additional grants-in-aid) to offset much or all of the cost of operating a team, including a coach, team travel, etc. Making precise estimates of the necessary start-up costs and of the long-run ongoing profit or loss of an additional team is beyond the scope of this report, but would be an excellent next step if UAB makes the decision to restore the three sports programs under study. Future Research Project: Can a Women’s Sport be Added Profitably
Work with university personnel to identify an appropriate women’s sport program where revenues and costs can be approximately balanced.
149 http://www2.ed.gov/about/offices/list/ocr/docs/clarific.html#two
150 Technically one can also be out of compliance with Title IX if male athletes are underrepresented and needs are not being met. We will discuss this below, as the cancelling of football might tend to put a school with demand for football at risk, but for the present discussion, we look at the historical UAB (not the future UAB if football is cancelled) in which men make up the majority of varsity athletes on campus.
151 “OCR hereby clarifies that nothing in Title IX requires the cutting or reduction of teams in order to demonstrate compliance with Title IX, and that the elimination of teams is a disfavored practice.” http://www2.ed.gov/about/offices/list/ocr/title9guidanceFinal.html

| Page 100 |
“Substantially Proportionate” Financial Assistance In addition to requirements with respect to participation, the DOE explains that Title IX also brings a financial requirement:
“To the extent that a college or university provided athletic scholarships, it is required to provide reasonable opportunities for such awards to members of each sex in proportion to the participation rate of each sex in intercollegiate athletics. This does not require the same number of scholarships for men and women or individual scholarships of equal value. However, the total amount of assistance awarded to men and women must be substantially proportionate to their participation rates in athletic programs. In other words, if 60 percent of an institution’s intercollegiate athletes are male, the total amount of aid going to male athletes should be approximately 60 percent of the financial aid dollars the institution awards.”152
Holding 2013-14 levels of participation constant (i.e., accepting the current 51.1% male participation ratio), this would require that male financial aid comprise between 50.1% and 52.1% of the total. As currently stated, UAB provides men with financial aid with a list price of $4,058,861 and women with aid at a list price of $2,731,142. Thus men receive 59.8% of scholarship aid. It is our understanding that this would not be considered as meeting the test for substantially proportionate financial aid. In the absence of the three sports in question, the financial aid amounts for both genders would be lowered. Men’s aid would drop to $1,408,701, and women’s to $2,557,783. The resulting male ratio would be 35.5% (compared to a hypothetical participation rate without the three sport of 34.6%). This would appear to be in compliance with the financial aid proportionality guidelines. However, to the extent UAB needs to add men’s cross country to avoid lack of compliance with the test of nondiscriminatory participation opportunities, it would need to avoid giving financial aid of more than about $30,000 or else male financial aid would again exceed one percentage point above male participation rates. This is obviously a tricky balancing act – UAB would need to rapidly recruit men for cross country to get around 30 athletes, all without providing more than around $30,000 in financial aid. One low-cost (or even profitable) approach is to focus athletic recruiting on women from outside of Alabama, and where possible, do the reverse with male recruits, especially when those recruits are on full scholarship.153 For example, while UAB granted only two sand volleyball scholarships (according to UAB’s most recent public data), the value of this aid was $80,900 – at $40,450 per athlete this is likely due to the athletes being from out of state. In contrast, the 3.82 scholarships shared across rifle team scholarship recipients totaled only $76,011; consistent with our belief that the rifle team is recruited from on-campus and consists entirely of in-state athletes. Had the rifle team’s scholarships
152 http://www2.ed.gov/about/offices/list/ocr/docs/interath.html
153 Out-of-state male athletes on partial scholarship generate more actual cash flow than otherwise identical in-state athletes. Focusing on full-scholarship men has less of a cash impact because they pay no direct tuition in either case.

| Page 101 |
been priced comparably with those of the sand volleyball team, the funding value used for calculating financial aid would have increased to $154,519, almost double the actual value. Across the 95.64 female full-scholarship equivalencies, if all athletes had been charged the sand volleyball price, women’s funding would have increased to $3,868,638, fully $1.1 million more than the actual listed price. At this level, UAB’s male funding ratio would have declined to 51.2%, well within one percentage point of the participation rate of 51.1%. Moreover, as discussed in detail in Project 1, recruiting out-of-state athletes on partial scholarships also generates additional cash flow for the university. The non-scholarship portion of tuition associated with those 95.64 scholarships (and paid into UAB across 143 recipients) would have increased from under $1.4 million to over $1.9 million, providing an additional $560,000 in additional (real) cash to the school. Obviously, as a policy matter, UAB may not want every single women’s athlete to come from out of state. But to the extent the school can prioritize out-of-state grants for women athletes, it can profit at the same time as reaching better Title IX compliance. Or, put differently, if more out-of-state women receive partial scholarships, the increased tuition those women bring into the system could then be used to increase scholarship funding for in-state women, providing multiple benefits – better funding for Alabamians and better Title IX compliance. Again using the Sand Volleyball standard, if UAB split the difference and converted half of the in-state women’s scholarship to out-of-state scholarship, list-price funding would increase by $570,000, cash flow would increase by $280,000 and that increase in funds, if funneled back into increased financial aid for in-state women (At rifle-team levels of aid, this would cover the price of more than 14 additional full GIAs), would then bring UAB to the point where women’s funding exceeded men’s, which would provide a cushion to absorb any disproportionate use of COA stipends (e.g., for football). Nevertheless, this is definitely a spot where the community should consider directing substantial resources in the event football is restored, in terms of fundraising to create a specific ongoing women’s scholarship donation campaign with the understanding that providing additional funding for women’s scholarships may be a necessary cost of having a football team. However, to ignore the strong financial incentives within the Title IX framework to provide more women with out-of-state grants covering some but not all of the list price of a grant-in-aid is to miss a straightforward way to improve Title IX compliance with minimal cost, and potentially even in a profitable fashion.
Future Research Project: understanding UAB’s Accounting for Summer Aid
Discuss with university personnel the amounts of summer aid included in all listed athletic aid awards and how UAB accounts for summer aid within the Title IX financial proportionality test.
An important caveat to all of the above is the question of summer aid. Our understanding is that the Department of Education may allow Summer Aid dollar amounts to be carved out from the financial proportionality requirements, but that as a default, the reporting system used by most schools includes this funding. As discussed above, Summer Aid costs far less to provide, relative to the list price, than the rest of the academic calendar, because of the lower level of aid that has true opportunity costs. To the extent Summer Aid is used within UAB’s calculations, another additional means of boosting UAB’s female financial aid levels is to offer more summer aid to women athletes. Of course, this is of great benefit to those athletes, as it may allow them to finish a degree sooner, to double-major, or

| Page 102 |
to begin work on a graduate degree prior to completion of eligibility. To the extent it provides a low-cost way to improve compliance with Title IX, UAB benefits as well. Future Fund Raising Needs The general conclusion of the work above is that UAB likely has put itself in a worse financial position by cancelling football, bowling, and rifle than if those programs had been maintained. It appears that the listed “subsidy” to the sports of around $3.75 million reported by UAB is properly characterized as only $25,000 in 2012-13, which will grow into a surplus of around $435,000 when future conference revenues and expenses are added in. To summarize this dramatic swing, in the table below we focus solely on omitted revenues and overstated expenses (not forecasted new ones), which net out to approximately $3.7 million in recurring net costs university will incur because it terminated the programs, not including the one-time charges of breaking existing contracts nor the anticipated net financial benefit that would come from the surplus of CFP revenue over estimated increase costs from COA Stipends and Unlimited Food, if UAB were to continue with football. Table 20 (Revised): Estimated Benefits (Costs) of Cancelling Football, Bowling, and Rifle Not Captured by Athletic Department Accounting
Adjustment Pages Football Bowling Rifle TOTAL
Regained Discretionary Funds 31-33 $620,000 $0 $0 $620,000
Loss of NCAA Distribution 33-36 ($523,844) ($47,773) ($55,738) ($627,355)
Loss of C-USA Distributions 36-39 ($1,700,000) $0 $0 ($1,700,000)
Adjustment for Merchandise Royalties 40 ($28,000) $0 $0 ($28,000)
Loss of GIA Revenue Offsets 46-64 ($1,665,303) ($196,146) ($8,530) ($1,869,979)
Lost Coverage of Fixed Benefits Costs 65-67 ($100,000) $0 $0 ($100,000)
Adjustment for Tutoring 67 $325,000 $0 $0 $325,000
Increase in Cost of Non-football Travel 68-70 ($320,000) $0 $0 ($320,000)
Reduced Expenses from Marketing 70 $125,000 $0 $0 $125,000
Ongoing Cost of Marching Band 70-71 ($250,000) $0 $0 ($250,000)
Reduced Expenses from Medical 71 $300,000 $0 $0 $300,000
Coaching Transition Amortization 40 ($133,000) $0 $0 ($133,000)Net Losses to UAB from Cancelling FB/Bowling/Rifle not Captured by Athletic Department Accounting
($3,350,147) ($243,919) ($64,268) ($3,658,334)
Note that on the table above, figures in black represent likely future savings not properly captured by the existing accounting. Red figures represent likely future costs created by cancelling football or anticipated savings unlike to materialize. Thus, because the net is red (negative), the total omitted money represents a loss to the school that is greater than the level of “subsidy” saved. Thus any cost savings envisioned appear to be more than offset by forgone revenue opportunities. This is especially true if the school is unable to remain in Conference USA in the wake of cancelling football. As a caveat, while our work looks precise (we estimate a number that can be shown down to the penny), that mischaracterizes what is a necessarily imprecise estimate, made all the less precise by the inability to work with UAB insiders after the March 13 termination of the original project. But
| Page 103 |
directionally, we strongly believe these data are correct, in that we found a substantial overstatement of the true expenses of the cancelled program. Once we undo those systematic misstatements, the conclusion is that continuing the three sports in question does not appear to need any specific fundraising to maintain current levels of self-funding, nor will the new expenses envisioned for COA stipends and Unlimited Food be a net drain as long as CFP revenue is not jeopardized by leaving Conference-USA. That is, if the university were willing to attribute the portion of its gains from having a football team to the Athletic Department’s books, the Department would show these sports having a break-even or slightly net positive financial position. In other words, cancelling football (and bowling and rifle) may look penny wise, but it is clearly pound foolish. On top of these we would add the unquantified marketing benefits that accrue to schools with FBS as discussed in Project 2. Moreover, the very act of cancelling the programs has created costs and lost revenue opportunities. That is, a one-time outlay of cash was needed for the university to terminate programs that would have generated net positive cash flow. Worse still, these steps may be difficult to reverse in a costless fashion. As an example, it is our understanding that a contract with the University of Tennessee, which would have paid UAB $925,000154 was terminated and a termination penalty then kicked in, costing $925,000.155 Simply restoring football cannot as simply restore that money. As stated above, these were unforced errors. However, as shown in the UC-Berkeley example above, the threat to cancel a valued program (or in this case, more than the threat – the actual cancellation), can be a catalyst for a great deal of positive community support if the situation is managed properly to bring donors into the process rather than hold them at bay. Our understanding is that the community has pledged to purchase over 4,300 season tickets (to the point of putting down $25 deposits for a $150 purchase).156 This is a good sign that the community recognizes there may be a few years of rebuilding necessary before the momentum of 2014-15 is regained. Regardless of whether a well-managed football program “needs” additional outside funding, UAB would be wise to take advantage of the outside support for football (regardless of whether it has always been present and strong or whether it is recently reinvigorated) to improve further the cash positive nature of the three sports in question.
154 This piece of the impact is properly captured by the standard accounting.
155 This penalty, however, is not and represents an additional one-time (negative) impact from the decision to cancel football. The fact that the two dollar amounts are identical should not confuse the reader into thinking this is a double count – the net impact is $1.85 million in lost cash.
156 We also understand the university threatened legal action against these community leaders in what can only be described as a “shake our heads” moment. Cal’s embrace of community fund-raising seems the wiser financial decision.

| Page 104 |
A Funding Campaign to provide a cushion for short-term needs associated with new costs Because our economic analysis establishes that, based on the assumption in this report, the historical net impact of the three sports in question has been effectively break even, then it is difficult to find any real need for specific fundraising to cover cost of the programs. Nevertheless, while our bottom line answer is that no additional funding is needed, we would recommend strongly that community fundraising create a Cost-of-Attendance campaign, aimed at raising $5,400 per athlete,157 to credibly ensure that the three sports in question do not add a COA stipend burden to UAB athletics. This sums to approximately $500,000. To be clear, assigning this fund specifically to COA Stipends is more marketing than finance – absent a community fund, UAB’s new revenues from CFP will more than cover these sports’ COA stipends. Creating such a fund that explicitly ties new community revenues to new expenses makes that transition simpler for the university, and also makes clear to the community that, for example, student fees haven’t been diverted to cover these costs. But to be clear: this infusion of new funds is a way for the community to help UAB to make more money from sports, not to cover specific cost deficits.
A Capital Campaign to fund perceived longer-term structural needs In the longer term, we understand the university has identified approximately $22.2 million in what it called “incremental capital investment … in Football facilities (Football practice field, Multi-Sport Indoor Practice Facility and a Football administration building)” needed to “build and sustain competitiveness.” Further, we understand the community as a whole has expressed an interest in building a smaller-footprint, on-campus football stadium commensurate with expected long-term demand of approximately 30,000 seats, and that capital costs associated with the stadium are not included within the estimated $22.2 million. Based on discussions with members of the Birmingham community, we also understand that there exist blueprints for the proposed capital improvements and bids for the work at $8.8 million, far less than half of the UAB estimate. In what follows, we use $12 million as a conservative estimate of the real costs once over-runs, etc., are taken into account. Based on discussions with an expert in large construction finance, we estimate that $12 million in bond financing would have a likely ten-year amortization schedule in the neighborhood of $1.4 million per year. Such projects tend to be described by something called an “annual factor” which captures the percentage of the total cost the annual debt service (interest plus amortized principal payments) will cost. For example, the annual factor for a ten-year bond at 3% interest is 11.59, meaning that each annual payment is 11.59% of the total bond proceeds. That translates to paying the lender $1,390,800 per year in fixed repayment terms, and then at the end of ten years, the bond is fully paid off.
157 We have taken at face value the university’s claim that $5,400 represents the true anticipated cost of a COA stipend. We have no insight into how accurate that statement is, but it does generally comport with data the university provides annually to the NCAA.
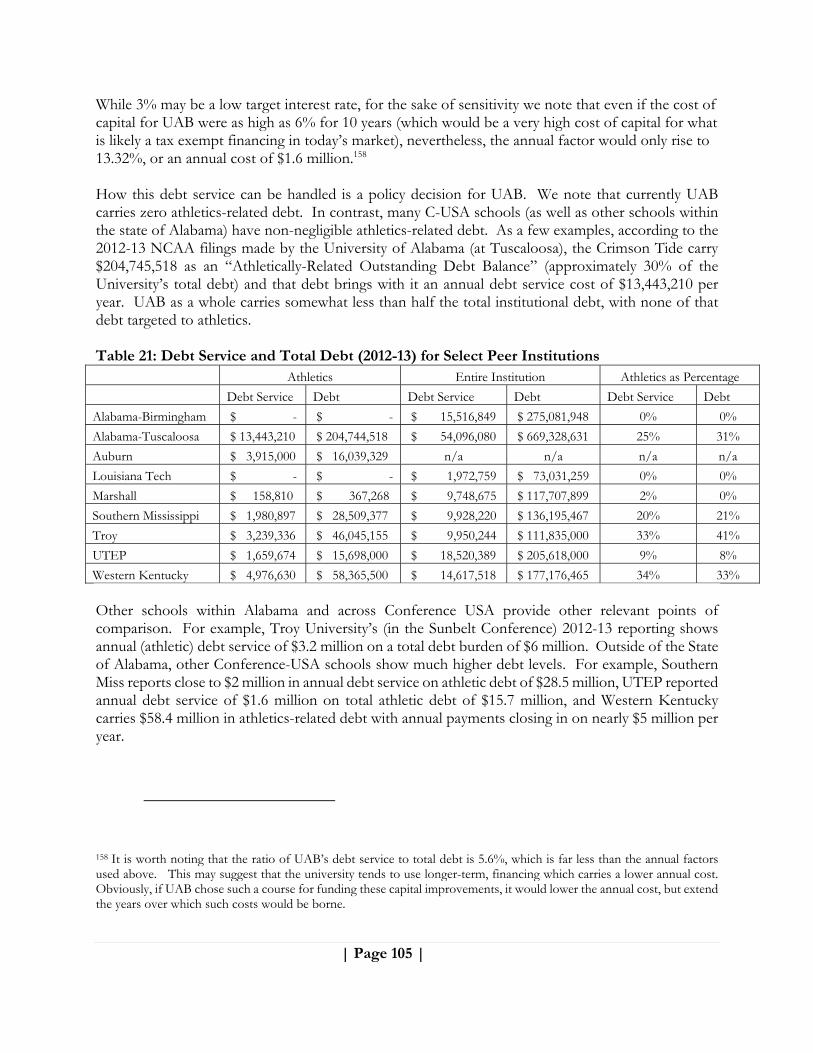
| Page 105 |
While 3% may be a low target interest rate, for the sake of sensitivity we note that even if the cost of capital for UAB were as high as 6% for 10 years (which would be a very high cost of capital for what is likely a tax exempt financing in today’s market), nevertheless, the annual factor would only rise to 13.32%, or an annual cost of $1.6 million.158 How this debt service can be handled is a policy decision for UAB. We note that currently UAB carries zero athletics-related debt. In contrast, many C-USA schools (as well as other schools within the state of Alabama) have non-negligible athletics-related debt. As a few examples, according to the 2012-13 NCAA filings made by the University of Alabama (at Tuscaloosa), the Crimson Tide carry $204,745,518 as an “Athletically-Related Outstanding Debt Balance” (approximately 30% of the University’s total debt) and that debt brings with it an annual debt service cost of $13,443,210 per year. UAB as a whole carries somewhat less than half the total institutional debt, with none of that debt targeted to athletics.
Table 21: Debt Service and Total Debt (2012-13) for Select Peer Institutions Athletics Entire Institution Athletics as Percentage
Debt Service Debt Debt Service Debt Debt Service Debt
Alabama-Birmingham $ - $ - $ 15,516,849 $ 275,081,948 0% 0%
Alabama-Tuscaloosa $ 13,443,210 $ 204,744,518 $ 54,096,080 $ 669,328,631 25% 31%
Auburn $ 3,915,000 $ 16,039,329 n/a n/a n/a n/a
Louisiana Tech $ - $ - $ 1,972,759 $ 73,031,259 0% 0%
Marshall $ 158,810 $ 367,268 $ 9,748,675 $ 117,707,899 2% 0%
Southern Mississippi $ 1,980,897 $ 28,509,377 $ 9,928,220 $ 136,195,467 20% 21%
Troy $ 3,239,336 $ 46,045,155 $ 9,950,244 $ 111,835,000 33% 41%
UTEP $ 1,659,674 $ 15,698,000 $ 18,520,389 $ 205,618,000 9% 8%
Western Kentucky $ 4,976,630 $ 58,365,500 $ 14,617,518 $ 177,176,465 34% 33% Other schools within Alabama and across Conference USA provide other relevant points of comparison. For example, Troy University’s (in the Sunbelt Conference) 2012-13 reporting shows annual (athletic) debt service of $3.2 million on a total debt burden of $6 million. Outside of the State of Alabama, other Conference-USA schools show much higher debt levels. For example, Southern Miss reports close to $2 million in annual debt service on athletic debt of $28.5 million, UTEP reported annual debt service of $1.6 million on total athletic debt of $15.7 million, and Western Kentucky carries $58.4 million in athletics-related debt with annual payments closing in on nearly $5 million per year.
158 It is worth noting that the ratio of UAB’s debt service to total debt is 5.6%, which is far less than the annual factors used above. This may suggest that the university tends to use longer-term, financing which carries a lower annual cost. Obviously, if UAB chose such a course for funding these capital improvements, it would lower the annual cost, but extend the years over which such costs would be borne.
| Page 106 |
However, some C-USA members carry little or no debt. As of 2012-13, Louisiana Tech reported it had zero athletics-related debt. Marshall showed negligible debt service of $159,000 on a similarly low level of athletic debt of $367,000. As outsiders, it is difficult for us to say what the “right” level of athletics-related debt is for UAB. Given that it appears the three sports in question would generate positive cash flow sufficient to support around $400,000 in debt service after accounting for new revenues and expenses, and given that the evidence suggests the school also receives additional non-negligible but difficult to measure off-the-books benefits, it may make sense for UAB to incur a medium-term debt to finance perceived capital-improvement needs, with the recognition that new fundraising and the off-the-books operating profits un-captured by Athletic Department accounting can ensure such financing is itself not a financial burden on UAB. As a simple example, if the debt service were to cost UAB $1.4 million per year, and the community were able to cover $700,000 of this amount (and also pay $500,000 towards the cost of COA stipends), this would leave $700,000 million for the University to cover from the surplus of total revenues over costs from the football program, from any other athletics surpluses, or from the general fund. We estimate the university would still be in a positive cash position, even before consideration of additional merchandise sales, tuition from non-athletes who would otherwise not attend, etc. That is, with sufficient community support, the debt would be effectively self-servicing. It would be foolish for us to make a definitive recommendation based on this vacuum of internal data and projections. But we think if the Birmingham community could commit to annual debt service fund-raising in the range of $500,000 to $1 million per year in addition to funding COA stipends to the tune of $500,000, it would be difficult for even the most detailed, internal analysis to show the remaining burden to be beyond the ability of the football program to support, especially in light of the reinvigorated community support for the team.
A Stand-alone Non-profit for Athletics? One proposal we recommend considering as part of funding any perceived gap is that the community consider creating an outside organization that can capture the off-the-books revenues generated by athletics and then pass them through to the athletic department in a way that the University can capture as generated revenues. For example, if it is feasible within Alabama law, we would recommend that a stand-alone not-for-profit organization be created, similar to the structure used at the University of Florida, such that a level of distinct transparency can be maintained for athletics. This would allow for the donor and the alumni community to have confidence that donations made for the express purpose of re-instating the football, bowling, and rifle programs, or for a parallel Title IX fund to support any added cost of Title IX matching funds, be dedicated to those purposes rather than controlled by, say, the UABEF which has no specific mandate to fund football. Of course, the university would need to maintain ultimate authority over this foundation, but the distinct legal structure may provide for the ability for athletics to be more transparent without forcing the university as a whole to adopt the same standard. Doing so likely will increase trust within the greater Birmingham community. A second benefit of such an arrangement could be (again, if Alabama law permits) that the economic relationship between athletics and academics could be made more explicit, such that
| Page 107 |
standard accounting methods would recognize the off-the-books revenues currently generated by, but not credited to, athletics. As an example from the business world, a firm can often book the purchase value of a patent acquired from a third party as an asset at a higher value than it can value the identical patent developed in-house; this is because in accounting if there is a transaction, it creates an opportunity for market valuation. Effectively, by setting up a separate stand-alone entity, UAB might be able to create transactions that generate athletic department accounting entries where currently none exist. If such a structure allowed the “co-pay” portion of a partial scholarship recipients funding to be recognized as athletic department revenue, then the true economic benefit of women’s bowling would move from an economic reality un-captured by the accounting, to a standard, recognized accounting profit. We leave this proposal for those more versed in Alabama law and politics to develop, but we strongly suggest such an arrangement be considered because the closer the accounting and economics align, the less counter-intuitive a report such as this will look. The more the accounting captures the true economics, the less there is to argue about. The Bottom Line: What Should UAB ask of the Outside Community It is our view that a university that was committed to having a football program would not find it difficult to finance the estimated future costs, if any, of ongoing football, bowling, rifle, and even an additional women’s sport (for Title IX purposes) purely from a recognition of the cash flow benefits those sports provide and a moderate level of new community funding. We also are fully aware that as an institution, the UAB decision-makers have shown that such a commitment does not currently exist. That is a potentially valid policy choice, and just as it may make sense for some schools to run a deficit to support football, in UAB’s case it may make sense for the school to risk creating a larger deficit by terminating the program. But we don’t see any evidence to support that strategy (and the economic literature suggests it will have negative consequences), nor do we see a huge outpouring of community support for the decision. Thus, to the extent that the community needs to encourage the university to restore football by offering additional funding (effectively to ensure football becomes and remains even more profitable), our very preliminary analysis shows that a COA stipend fund of $500,000 and a similar capital contribution fund of $700,000 would likely ensure that the net financial impact of restoring football, bowling, and rifle is far greater than terminating those sports. In essence, we would recommend that the pro-football community within Birmingham commit to an annual payment to UAB (or to a stand-alone entity to serve as a potentially more trustworthy intermediary) of something approximating $1.2 million per year. Our analysis shows that if the university provided $700,000 in matching funds for debt service, the university would still show net positive cash flow from these three sports (and also from the community payment), as long as the decision to keep football is the difference between staying in or leaving Conference USA. This analysis is even before including any benefits from the difficult to estimate revenue sources (e.g., merchandise sales, increased non-athlete attendance). In other words, this $1.2 million payment is not needed to support athletics in the current facilities. Instead, it would cover half the debt service, and allow the university to cover the other half while remaining in the black. Thus, the fund would serve as a strong financial inducement to the University to keep football by covering any short-term football deficits as the program ramped up, and then once football was back to steady state, would provide $1.2 million in funding for other programs as a quid-pro-quo for keeping football healthy. It would create “at-risk” funds that the university would know it would forfeit if football is terminated in the future.

| Page 108 |
No action should be taken on the basis of our rough estimates alone. Rather, we suggest that after the University completes its own financial assessment that a serious look be taken at what it would take to make sure these capital improvements can be funded. Nevertheless, our initial assessment is that $1.2 million per year is far more than needed to restore profitably the three sports in question and cover the debt service on the projected new training facilities. V. Conclusions
This report set out to address the key question of whether UAB football, women’s bowling, and rifle teams provide a net positive or negative contribution to UAB’s overall financial strength. We approached this task by first reviewing the extensive economic literature on the question of sports’ role, benefits, and costs to a university. After this we applied those teachings, as well as our experience in working with college sports financial data, to ask specifically what the impact of these sports were to UAB as a whole. We found: Typical Athletic Department financial reporting has a systematic tendency to understate revenues and overstate costs from athletics. The result is that standard athletic department accounting provides poor insight into the financial impact of sports programs on the university as a whole.
The economics literature provides some evidence for positive effect from athletics on (a) applications, enrollment, and student quality; (b) on donations; and (c) on media attention to and exposure for the university, especially among key demographic groups seeking admission to college.
The three sports in question did not cost the university anywhere near the $3.75 million indicated on UAB’s accounting statements. Instead, after making the sort of adjustments suggested by the economics literature, we conclude that the three sports were effectively break-even (with an aggregate deficit of just $25,000). The key drivers of this conclusion are:
- Athletic Scholarships cost UAB far less than their listed prices.
- Conference USA membership is far superior, financially, to any alternative non-FBS conference. C-USA membership very likely hinges on UAB fielding an FBS football team.
Anticipated improvement in ticket sales from 2013-14 (in which UAB went 2-10) and new College Football Playoff revenues should outpace new expenses from Cost of Attendance (COA) stipends and unlimited food allowances. Once these new revenues and expenses kick in, we anticipate the aggregate football, bowling, and rifle surplus would exceed $400,000, even without including many hard-to-quantify benefits to admissions and enrollment.
Based on this surplus, we see no specific need for any new funding for the three sports to resume in a profitable fashion. Nevertheless, we recommend the community commit to provide UAB with $1.2 million annually, to cover the new COA stipends for these three sports and provide a substantial portion of anticipated new debt service for desired facilities improvements. Doing so will likely keep these three sports in the black even as the university covers its share of the anticipated debt service. It will also provide funding during the recovery from the financial setbacks caused by the cancellation of the three sports.

| Page 109 |
Though many others contributed with assistance and input, the work product and opinions expressed in this report are solely those of Daniel A. Rascher and Andrew D. Schwarz.
Daniel A. Rascher, Ph.D. Andrew D. Schwarz April 22, 2015 (revised 4/30/15) April 22, 2015 (revised 4/30/15)
About the Authors Daniel Rascher teaches and publishes research on sports business topics, and consults to the sports industry. He specializes in economics and finance and more specifically in industrial organization, antitrust, M&As, valuation, economic impact, market readiness, feasibility research, marketing research, damage analysis, strategy, and labor issues in the sports industry. Dr. Rascher founded SportsEconomics to enable sports enterprises to capitalize on the sports industry's transition from hobby status to multi-billion dollar industry. As Founder and President of SportsEconomics, LLC, Partner at OSKR, LLC, and former Principal at LECG,
LLC, his clients have included organizations involved in the NBA, NFL, MLB, NHL, NCAA, NASCAR, MLS, PGA, professional boxing, minor league baseball, NHRA, AHL, Formula One racing, Indy Car racing, American Le Mans racing, Premier League Football (soccer), professional cycling, endurance sports, IPL, media, ticketing, IHRSA, as well as sports commissions, local and state government, convention and visitors bureaus, tourism businesses, entrepreneurs, and B2B enterprises.
Dr. Rascher has testified as an expert witness in federal and state courts, in arbitration proceedings, and provided public testimony numerous times to state and local governments.
Dr. Rascher received his Ph.D. in Economics from the University of California at Berkeley. He is Director of Academic Programs and Professor in the Sport Management Program at the University of San Francisco (USF), where he also teaches courses in sports economics and finance and research methods. He has also taught at Northwestern University, the IE Business School in Madrid, and the University of Massachusetts (Amherst). He has authored articles for academic and professional journals, book chapters, and a text book in the sport management and economics fields, has been interviewed hundreds of times by the media for his opinion on various aspects of the business of sports, and has given over fifty presentations at professional and academic conferences. Dr. Rascher has served on the editorial boards of Case Studies in Sport Management, Journal of Sport Management, Sport Management Review, International Journal of Sport Finance, International Journal of Sport Management and Marketing, and the Journal of the Quantitative Analysis of Sports. He has been named Research Fellow of the North American Society for Sport Management. Dan is also certified as a valuation analyst (CVA) by the National Association of Certified Valuators and Analysts.
| Page 110 |
Andy Schwarz specializes in antitrust, class actions, and damages analysis. Mr. Schwarz has built a practice as a consulting expert, providing privileged advice to counsel and working with experts in very large, complex litigation matters in antitrust, intellectual property, sports and entertainment, and banking and insurance. He has extensive experience in class action litigation, providing assistance to counsel for defendants and for plaintiffs. In many cases, Mr. Schwarz has played a parallel role to the testifying expert, working with counsel to assist in their development of testimony from unaffiliated experts.
Most notably among his many sport-related engagements, Mr. Schwarz was the case manager for the NFL’s economic expert in L.A. Raiders v. NFL and for Plaintiffs in O’Bannon v. NCAA. He has served as an expert on a variety of litigation matters for issues of class certification, liability, and damages. Mr. Schwarz has given expert depositions on issues of statistical sampling in federal cases on ADA compliance issues and on class certification in a case of alleged price-fixing, and has served as an expert on other issues in a variety of cases, both state and federal. He has served as a class certification and damages expert in an insurance class action in California. He has testified on college sports economics to the U.S. House of Representatives’ Committee on Education and the Workforce and served on another U.S. Congressional panel on college sports and antitrust. He has also testified in California state court.
Mr. Schwarz has been featured on ESPN, in the New York Times, the Wall Street Journal, Bloomberg News, Sports on Earth, and USA Today analyzing sports economic issues. He is a frequent contributor to Vice Sports and Deadspin and has also written for Slate, Forbes.com and ESPN.com. He has published academic papers on secondary ticket markets, the Twombly standard and the implications for litigation costs, on the impact of the US v. Oracle trial on the doctrine of unilateral effects, on the antitrust implications of NCAA bylaws, and on the antitrust and intellectual property lessons to be learned from the emerging markets in virtual goods. He has co-authored a chapter on price discrimination in the Oxford Handbook of Sports Economics. He has been a litigation economist since 1997. Mr. Schwarz holds an M.B.A. from the Anderson School of Management at UCLA as well as an A.B. in History from Stanford University and an M.A. in History from Johns Hopkins.