Embed Size (px)
Citation preview
The International Trade in Knowledge
Licensing, Technology Services Trade and the Role of Intellectual
Property
Suma Athreye
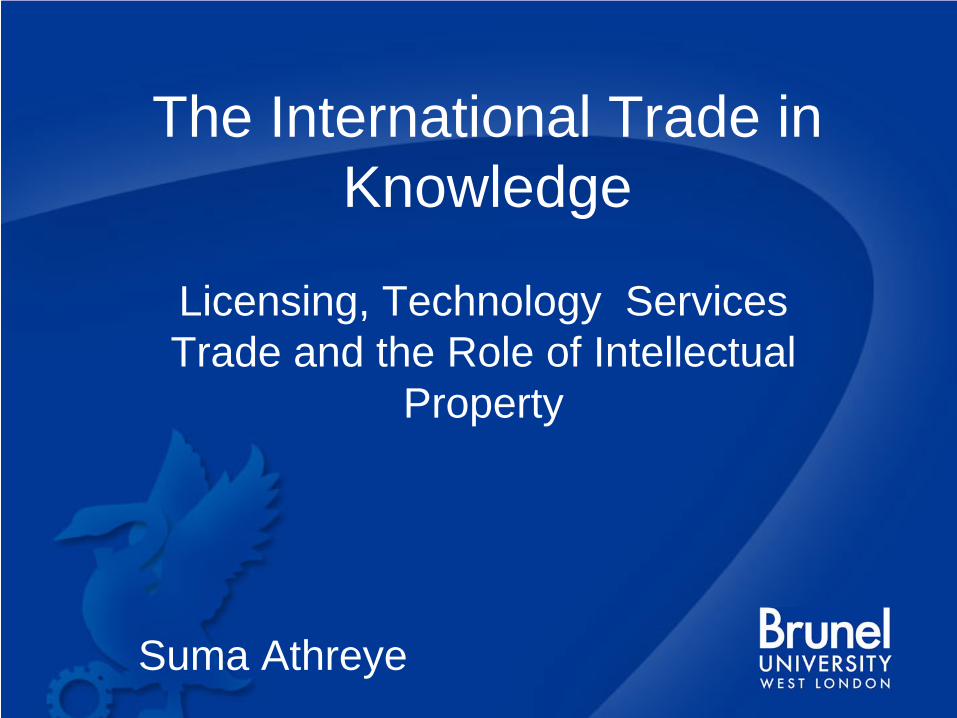
The International Trade in Knowledge
• Why is the international trade in technological knowledge of interest?
• Magnitude of this trade• Forms of the trade in technological
knowledge• Direction of trade in technological
knowledge• Role of Intellectual Property Protection

Why is the international trade in technological knowledge of
interest?
The impossibility of trading technological knowledge?
• Technology imbued FDI and international licensing dominant modes of technology transfer
• Fear of leakage and IPR protection• Technology transfer literature - Role of absorptive capacity and capability- Tacit technology and the limits to
contracting
Technology entrepreneurship and new business models
• Large integrated firms are the dominant model of innovation
• IP based licensing became popular in small technology niches- biotechnology, software, telecoms
• Mixture of licensing (backed by patents) and customised technology services
Technology services trade trade compare with trade in
services in general• Joint production & burden of proximity• Arms length export not the only mode of
supply . Other modes include- movement of customer to country of service provision- service through offshore affiliates-temporary movement of people to provide the services.
Magnitude of the trade in technological knowledge
Data sources
• Country level data:- IMF BoP statistics collated by World
bank in their WDI- Technology balance of payments by
OECD• Firm level data- MERIT/CATI database- Thompson SDC
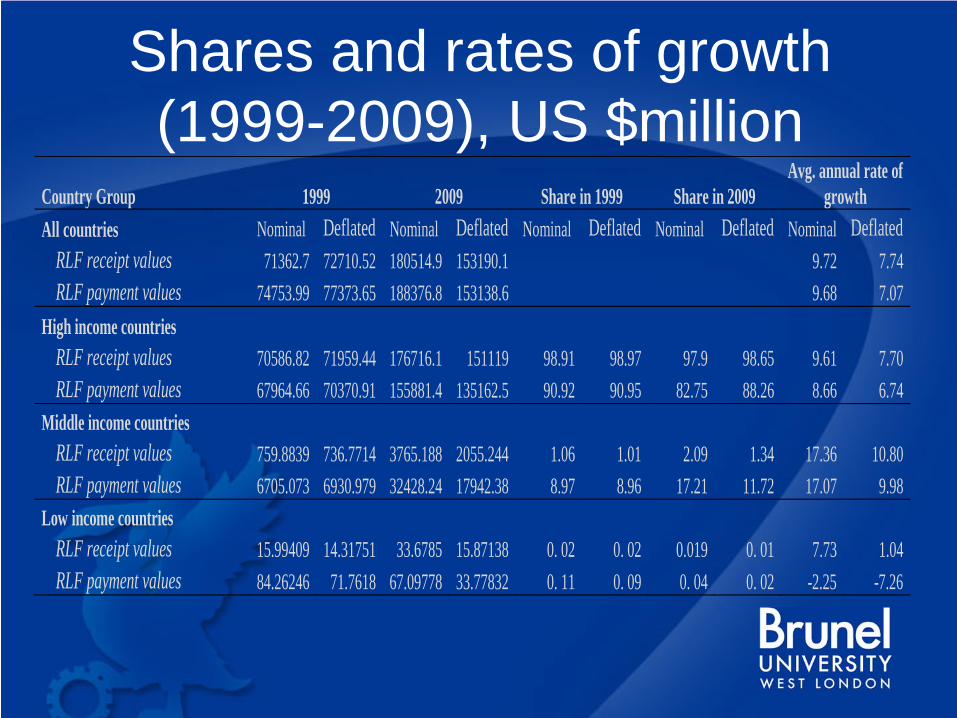
Shares and rates of growth (1999-2009), US $million
Country Group 1999 2009 Share in 1999 Share in 2009 Avg. annual rate of
growth All countries Nominal Deflated Nominal Deflated Nominal Deflated Nominal Deflated Nominal Deflated
RLF receipt values 71362.7 72710.52 180514.9 153190.1 9.72 7.74 RLF payment values 74753.99 77373.65 188376.8 153138.6 9.68 7.07
High income countries RLF receipt values 70586.82 71959.44 176716.1 151119 98.91 98.97 97.9 98.65 9.61 7.70 RLF payment values 67964.66 70370.91 155881.4 135162.5 90.92 90.95 82.75 88.26 8.66 6.74
Middle income countries RLF receipt values 759.8839 736.7714 3765.188 2055.244 1.06 1.01 2.09 1.34 17.36 10.80 RLF payment values 6705.073 6930.979 32428.24 17942.38 8.97 8.96 17.21 11.72 17.07 9.98
Low income countries RLF receipt values 15.99409 14.31751 33.6785 15.87138 0. 02 0. 02 0.019 0. 01 7.73 1.04 RLF payment values 84.26246 71.7618 67.09778 33.77832 0. 11 0. 09 0. 04 0. 02 -2.25 -7.26
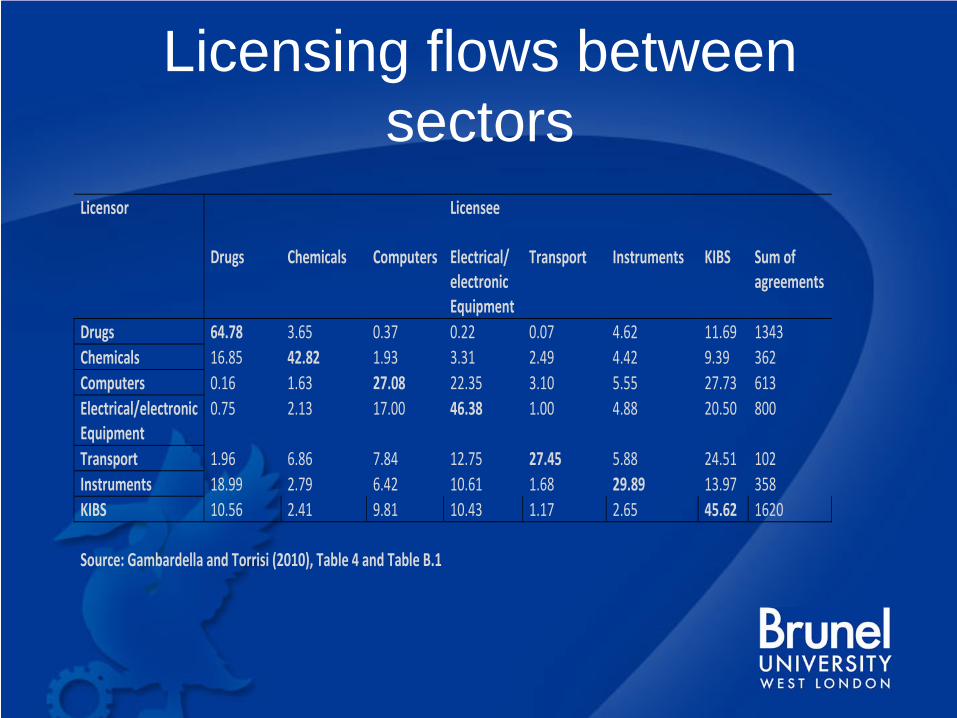
Licensing flows between sectors
Licensor Licensee Drugs Chemicals Computers Electrical/
electronic Equipment
Transport Instruments KIBS Sum of agreements
Drugs 64.78 3.65 0.37 0.22 0.07 4.62 11.69 1343 Chemicals 16.85 42.82 1.93 3.31 2.49 4.42 9.39 362Computers 0.16 1.63 27.08 22.35 3.10 5.55 27.73 613 Electrical/electronic Equipment
0.75 2.13 17.00 46.38 1.00 4.88 20.50 800
Transport 1.96 6.86 7.84 12.75 27.45 5.88 24.51 102 Instruments 18.99 2.79 6.42 10.61 1.68 29.89 13.97 358 KIBS 10.56 2.41 9.81 10.43 1.17 2.65 45.62 1620 Source: Gambardella and Torrisi (2010), Table 4 and Table B.1
Forms of the trade in Technological knowledge

Different components of the TBP: Technology Receipts

Different components of the TBP: payments
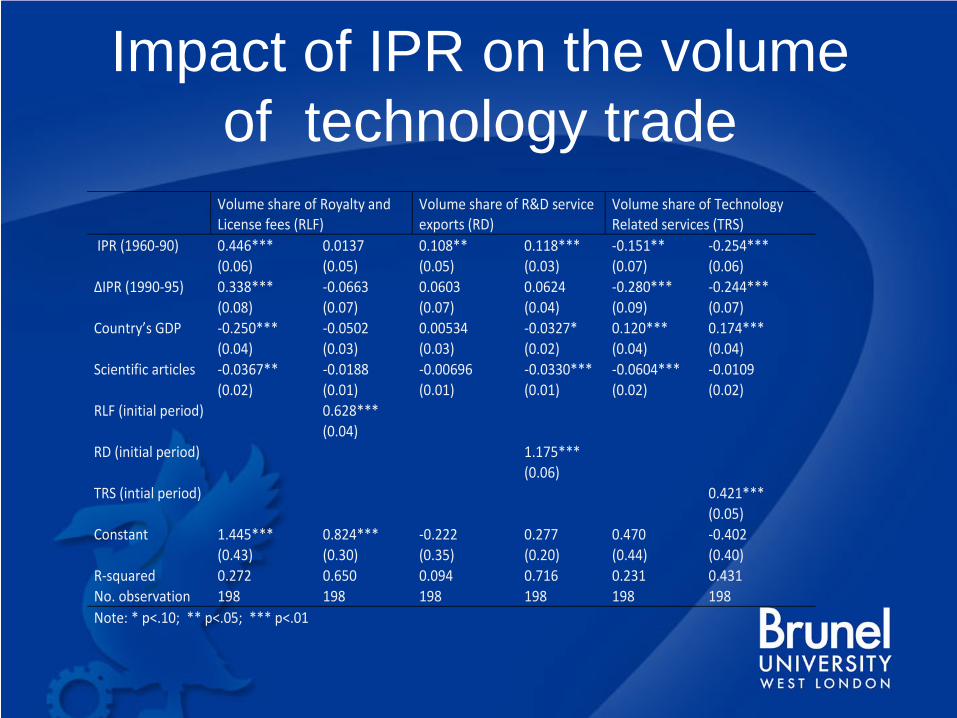
Impact of IPR on the volume of technology trade
Volume share of Royalty and License fees (RLF)
Volume share of R&D service exports (RD)
Volume share of Technology Related services (TRS)
IPR (1960‐90) 0.446*** 0.0137 0.108** 0.118*** ‐0.151** ‐0.254*** (0.06) (0.05) (0.05) (0.03) (0.07) (0.06) ΔIPR (1990‐95) 0.338*** ‐0.0663 0.0603 0.0624 ‐0.280*** ‐0.244*** (0.08) (0.07) (0.07) (0.04) (0.09) (0.07) Country’s GDP ‐0.250*** ‐0.0502 0.00534 ‐0.0327* 0.120*** 0.174*** (0.04) (0.03) (0.03) (0.02) (0.04) (0.04) Scientific articles ‐0.0367** ‐0.0188 ‐0.00696 ‐0.0330*** ‐0.0604*** ‐0.0109 (0.02) (0.01) (0.01) (0.01) (0.02) (0.02) RLF (initial period) 0.628*** (0.04) RD (initial period) 1.175*** (0.06) TRS (intial period) 0.421*** (0.05) Constant 1.445*** 0.824*** ‐0.222 0.277 0.470 ‐0.402 (0.43) (0.30) (0.35) (0.20) (0.44) (0.40) R‐squared 0.272 0.650 0.094 0.716 0.231 0.431 No. observation 198 198 198 198 198 198 Note: * p<.10; ** p<.05; *** p<.01
Direction of trade in technological knowledge

Direction of trade - Technology receipts
Region of trade (shares in %)
Country ( year) North America EU(15) EU(25) Japan Asia Others
Australia(2007) 33.4 12.7 1.9 0.2 51.8Austria(2006) 6.6 56.7 0.3 0.8 35.6Belgium(2007) 17 68.8 1 0.4 12.9Czech Republic(2007) 11.4 49.4 0.2 0 38.9France(2002) 38.7 39.5 8.8 0.4 12.6Germany(2007) 21.7 38 3.8 1 35.6Greece(2007) 10.5 51.5 0.3 0 37.7Hungary (2007) 11.7 56.8 16.1 1.3 14.1Ireland (2006) 67.5 32.5Italy (2007) 49.2 1.2 49.5Japan(2006) 46 2.6 51.5Poland(2007) 15.9 66.8 0.1 0.1 17.1Slovak Republic(2005) 19.1 45.1 0.1 0 35.7Sweden(2007) 18.6 37.6 1.5 0.8 41.4USA(2006) 10 42.4 13.2 3.3 31.1
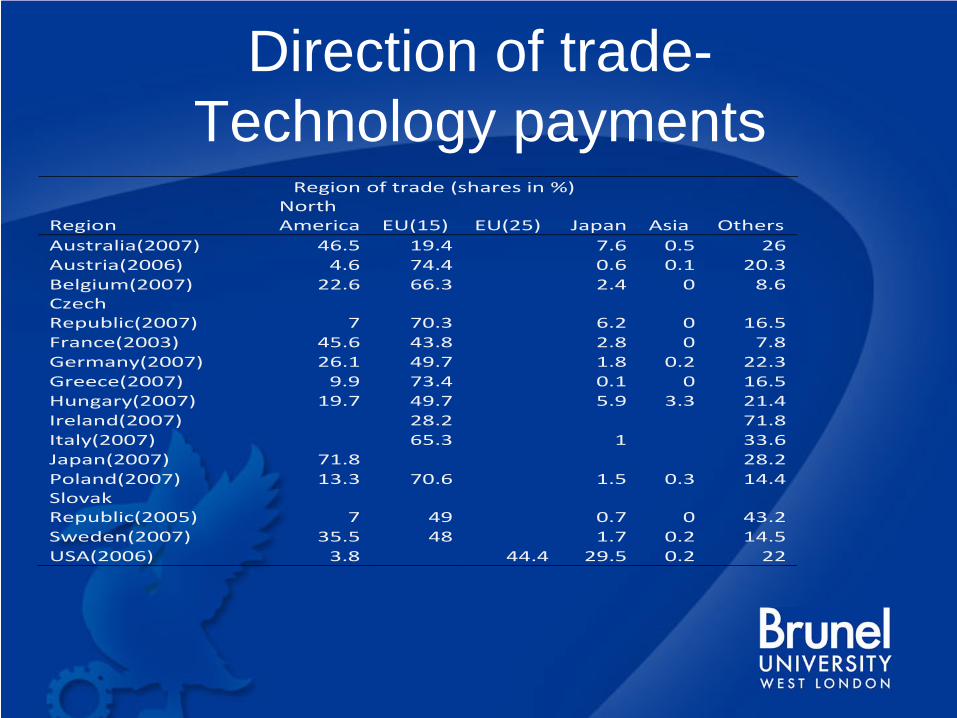
Direction of trade- Technology payments
Region of trade (shares in %)
Region North America EU(15) EU(25) Japan Asia Others
Australia(2007) 46.5 19.4 7.6 0.5 26Austria(2006) 4.6 74.4 0.6 0.1 20.3Belgium(2007) 22.6 66.3 2.4 0 8.6Czech Republic(2007) 7 70.3 6.2 0 16.5France(2003) 45.6 43.8 2.8 0 7.8Germany(2007) 26.1 49.7 1.8 0.2 22.3Greece(2007) 9.9 73.4 0.1 0 16.5Hungary(2007) 19.7 49.7 5.9 3.3 21.4Ireland(2007) 28.2 71.8Italy(2007) 65.3 1 33.6Japan(2007) 71.8 28.2Poland(2007) 13.3 70.6 1.5 0.3 14.4Slovak Republic(2005) 7 49 0.7 0 43.2Sweden(2007) 35.5 48 1.7 0.2 14.5USA(2006) 3.8 44.4 29.5 0.2 22

Using firm level data• Branstetter et. al. (2006) find that IPR reform
in 17 countries increased US affiliate transfers to these countries. No effect on unaffiliated transactions
• Athreye et al (2010) control for perceived effectiveness of patenting and find the IPR in destination country is important in explaining the destination of R&D services transfers as well as licensing transfers among unaffiliated firms.

Role of Intellectual Property Protection
Some qualifications• Intellectual property protection is problematic
to measure as- it typically evolves with a country’s technological capability-perceptions of IR vary much more slowly than actual signing up
• The data we have are limited (on cross border licensing) and so its centrality in the literature should be interpreted with caution
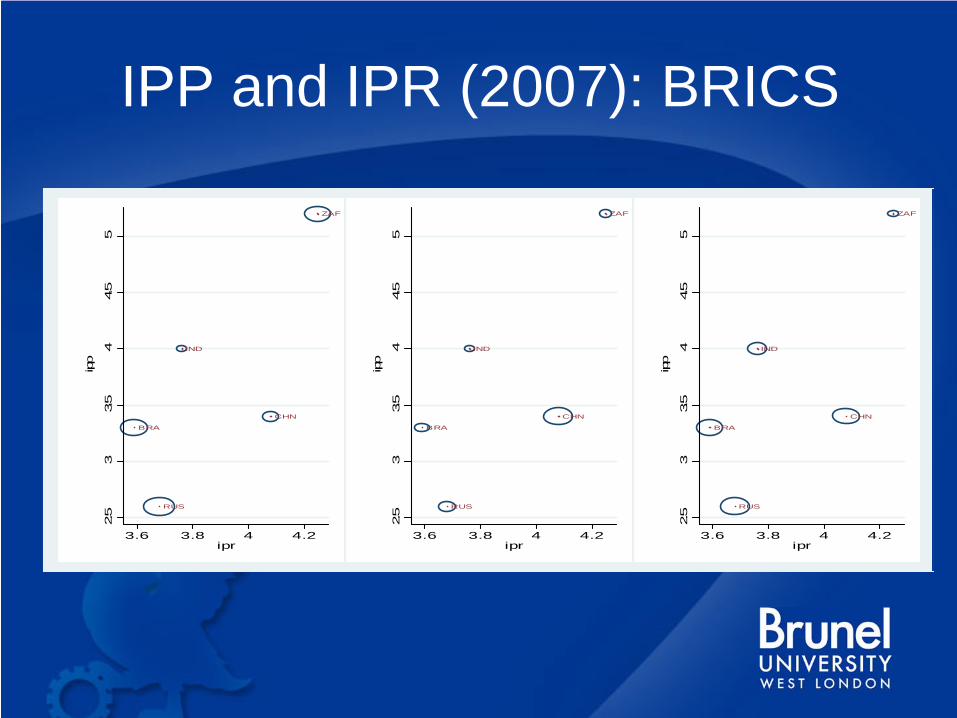
IPP and IPR (2007): BRICS
BRA
CHN
IND
RUS
ZAF
2.5
33.5
44.5
5
ipp
3.6 3.8 4 4.2ipr
BRA
CHN
IND
RUS
ZAF
2.5
33.5
44.5
5
ipp
3.6 3.8 4 4.2ipr
BRA
CHN
IND
RUS
ZAF
2.5
33.5
44.5
5
ipp
3.6 3.8 4 4.2ipr
Role of IPR in cross border transactions
• Influences the form of technology service traded in favour of R&D services and licensing which are also higher value-added services
• Strong IPR is crucial in securing the larger value transactions
• Whether IPR is central when we take into account sector-specific elements of the innovative process needs more investigation