Embed Size (px)
Citation preview
EPV Technologies
The Major CPU Exceptions in EPV 1
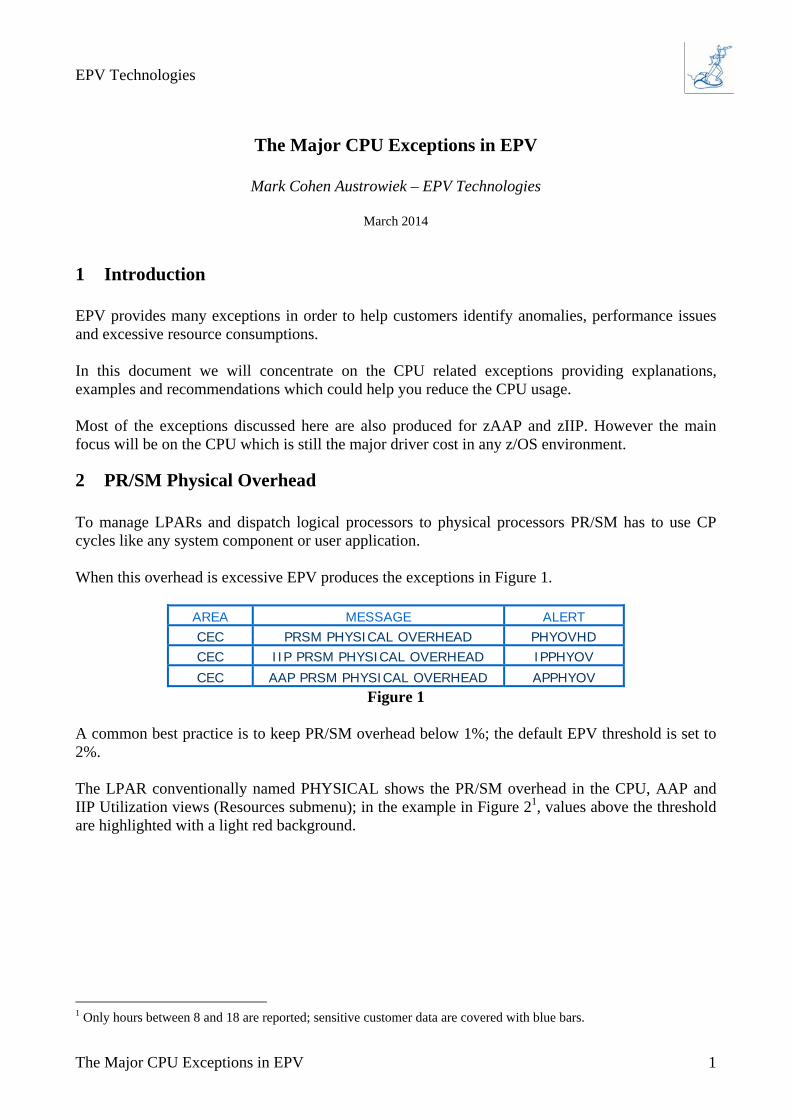
The Major CPU Exceptions in EPV
Mark Cohen Austrowiek – EPV Technologies
March 2014
1 Introduction EPV provides many exceptions in order to help customers identify anomalies, performance issues and excessive resource consumptions. In this document we will concentrate on the CPU related exceptions providing explanations, examples and recommendations which could help you reduce the CPU usage. Most of the exceptions discussed here are also produced for zAAP and zIIP. However the main focus will be on the CPU which is still the major driver cost in any z/OS environment.
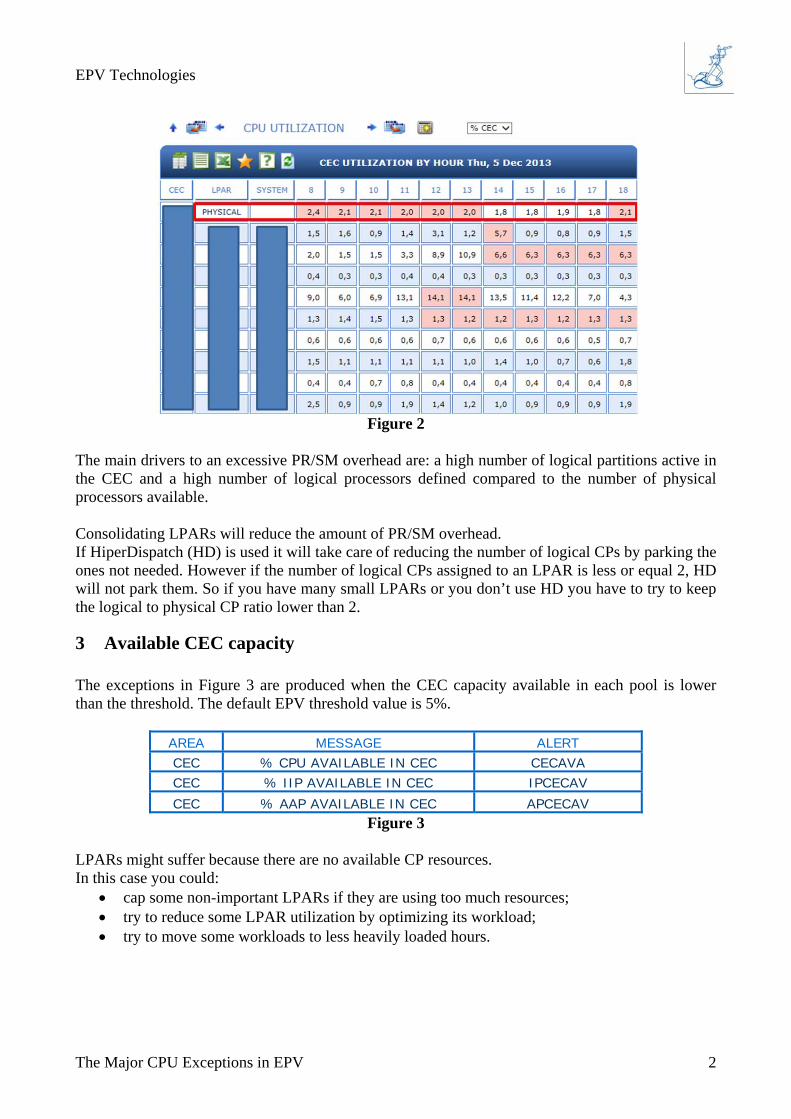
2 PR/SM Physical Overhead To manage LPARs and dispatch logical processors to physical processors PR/SM has to use CP cycles like any system component or user application. When this overhead is excessive EPV produces the exceptions in Figure 1.
AREA MESSAGE ALERT CEC PRSM PHYSICAL OVERHEAD PHYOVHD CEC IIP PRSM PHYSICAL OVERHEAD IPPHYOV CEC AAP PRSM PHYSICAL OVERHEAD APPHYOV
Figure 1 A common best practice is to keep PR/SM overhead below 1%; the default EPV threshold is set to 2%. The LPAR conventionally named PHYSICAL shows the PR/SM overhead in the CPU, AAP and IIP Utilization views (Resources submenu); in the example in Figure 21, values above the threshold are highlighted with a light red background.
1 Only hours between 8 and 18 are reported; sensitive customer data are covered with blue bars.
EPV Technologies
The Major CPU Exceptions in EPV 2
Figure 2
The main drivers to an excessive PR/SM overhead are: a high number of logical partitions active in the CEC and a high number of logical processors defined compared to the number of physical processors available. Consolidating LPARs will reduce the amount of PR/SM overhead. If HiperDispatch (HD) is used it will take care of reducing the number of logical CPs by parking the ones not needed. However if the number of logical CPs assigned to an LPAR is less or equal 2, HD will not park them. So if you have many small LPARs or you don’t use HD you have to try to keep the logical to physical CP ratio lower than 2.
3 Available CEC capacity The exceptions in Figure 3 are produced when the CEC capacity available in each pool is lower than the threshold. The default EPV threshold value is 5%.
AREA MESSAGE ALERT CEC % CPU AVAILABLE IN CEC CECAVA CEC % IIP AVAILABLE IN CEC IPCECAV CEC % AAP AVAILABLE IN CEC APCECAV
Figure 3 LPARs might suffer because there are no available CP resources. In this case you could:
cap some non-important LPARs if they are using too much resources; try to reduce some LPAR utilization by optimizing its workload; try to move some workloads to less heavily loaded hours.
EPV Technologies
The Major CPU Exceptions in EPV 3
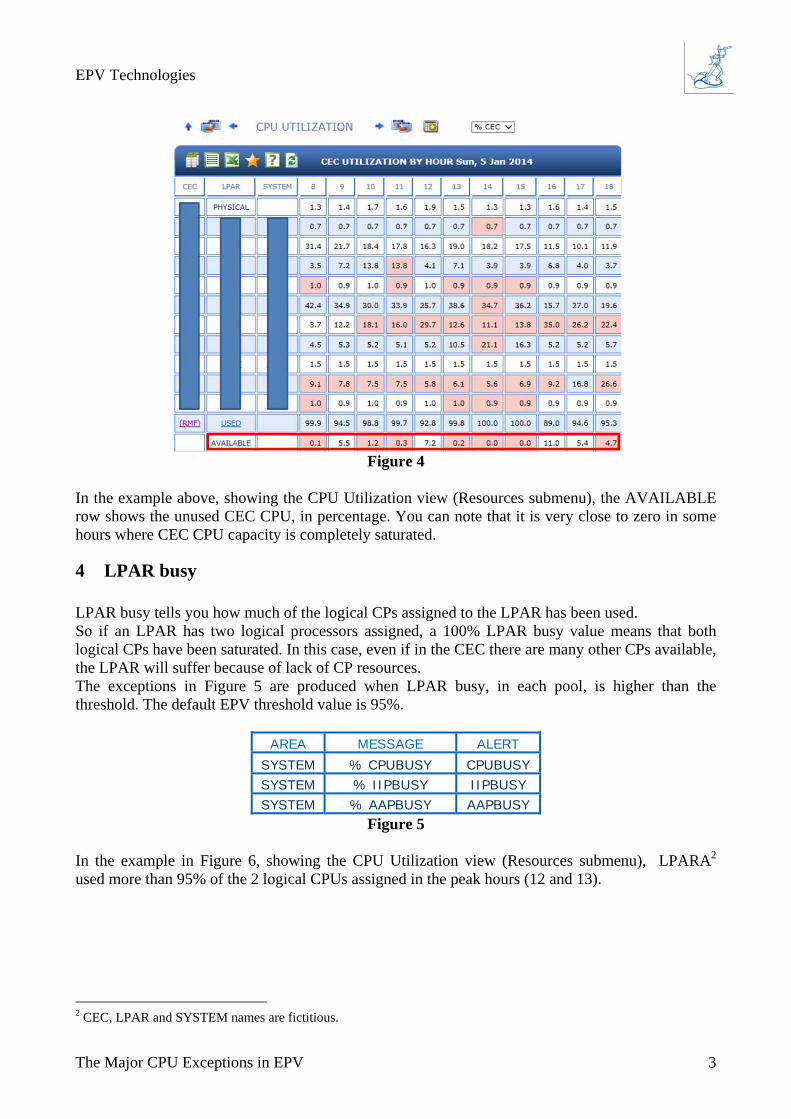
Figure 4
In the example above, showing the CPU Utilization view (Resources submenu), the AVAILABLE row shows the unused CEC CPU, in percentage. You can note that it is very close to zero in some hours where CEC CPU capacity is completely saturated.
4 LPAR busy LPAR busy tells you how much of the logical CPs assigned to the LPAR has been used. So if an LPAR has two logical processors assigned, a 100% LPAR busy value means that both logical CPs have been saturated. In this case, even if in the CEC there are many other CPs available, the LPAR will suffer because of lack of CP resources. The exceptions in Figure 5 are produced when LPAR busy, in each pool, is higher than the threshold. The default EPV threshold value is 95%.
AREA MESSAGE ALERT SYSTEM % CPUBUSY CPUBUSY SYSTEM % IIPBUSY IIPBUSY SYSTEM % AAPBUSY AAPBUSY
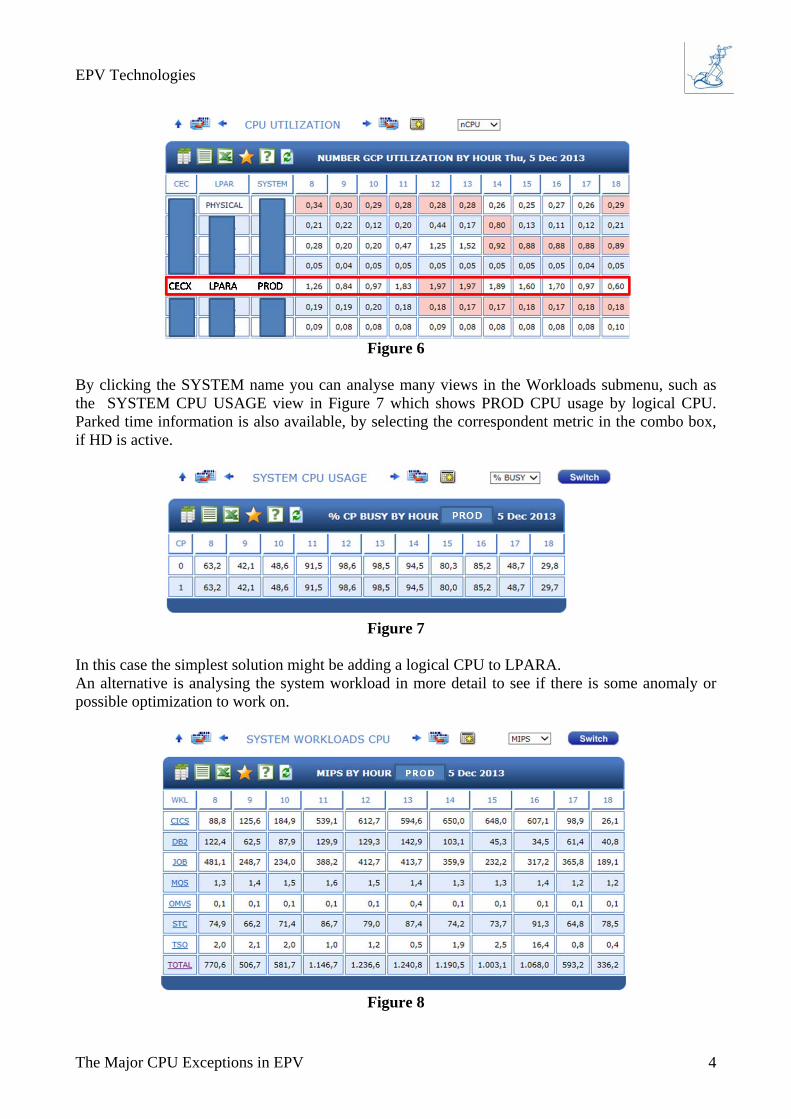
Figure 5 In the example in Figure 6, showing the CPU Utilization view (Resources submenu), LPARA2 used more than 95% of the 2 logical CPUs assigned in the peak hours (12 and 13).
2 CEC, LPAR and SYSTEM names are fictitious.
EPV Technologies
The Major CPU Exceptions in EPV 4
Figure 6
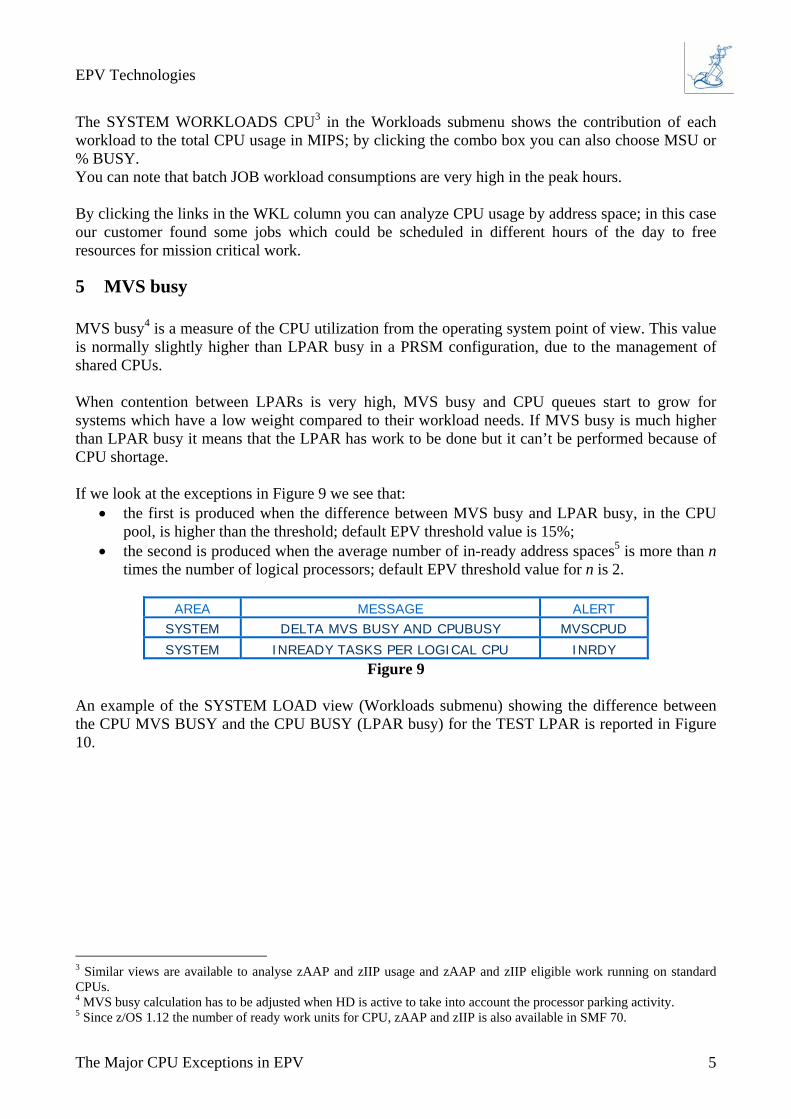
By clicking the SYSTEM name you can analyse many views in the Workloads submenu, such as the SYSTEM CPU USAGE view in Figure 7 which shows PROD CPU usage by logical CPU. Parked time information is also available, by selecting the correspondent metric in the combo box, if HD is active.
Figure 7
In this case the simplest solution might be adding a logical CPU to LPARA. An alternative is analysing the system workload in more detail to see if there is some anomaly or possible optimization to work on.
Figure 8
EPV Technologies
The Major CPU Exceptions in EPV 5
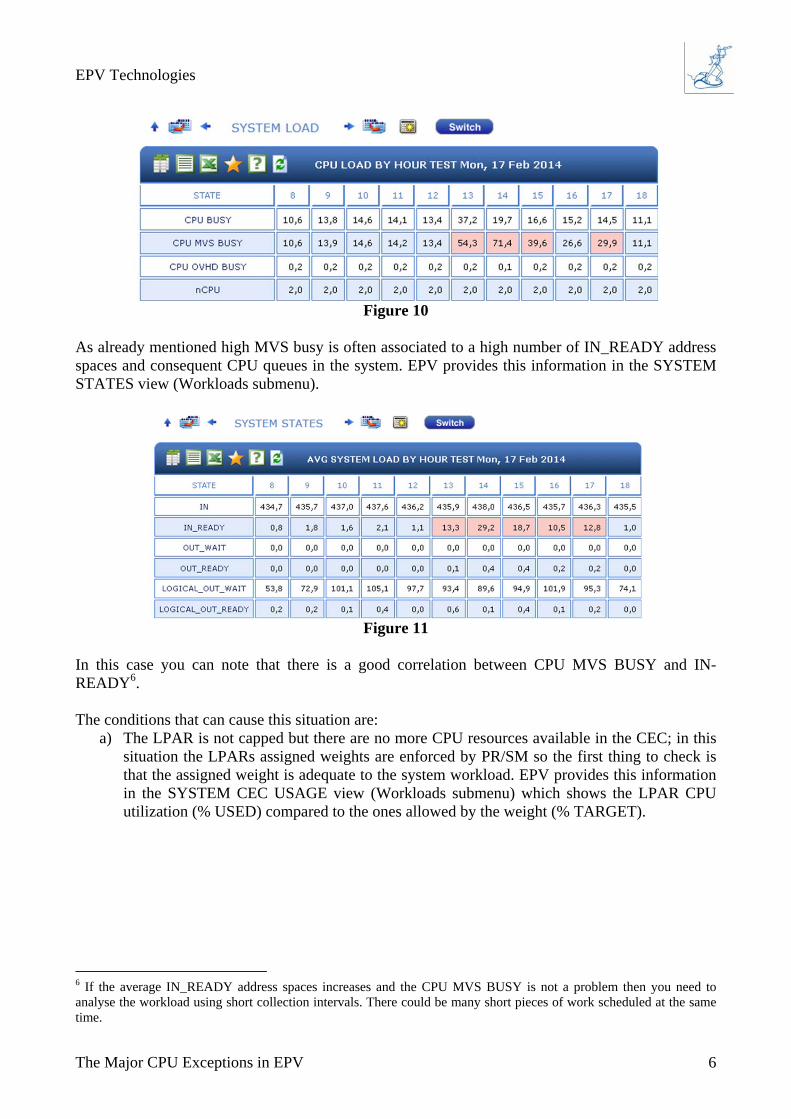
The SYSTEM WORKLOADS CPU3 in the Workloads submenu shows the contribution of each workload to the total CPU usage in MIPS; by clicking the combo box you can also choose MSU or % BUSY. You can note that batch JOB workload consumptions are very high in the peak hours. By clicking the links in the WKL column you can analyze CPU usage by address space; in this case our customer found some jobs which could be scheduled in different hours of the day to free resources for mission critical work.
5 MVS busy MVS busy4 is a measure of the CPU utilization from the operating system point of view. This value is normally slightly higher than LPAR busy in a PRSM configuration, due to the management of shared CPUs. When contention between LPARs is very high, MVS busy and CPU queues start to grow for systems which have a low weight compared to their workload needs. If MVS busy is much higher than LPAR busy it means that the LPAR has work to be done but it can’t be performed because of CPU shortage. If we look at the exceptions in Figure 9 we see that:
the first is produced when the difference between MVS busy and LPAR busy, in the CPU pool, is higher than the threshold; default EPV threshold value is 15%;
the second is produced when the average number of in-ready address spaces5 is more than n times the number of logical processors; default EPV threshold value for n is 2.
AREA MESSAGE ALERT
SYSTEM DELTA MVS BUSY AND CPUBUSY MVSCPUD SYSTEM INREADY TASKS PER LOGICAL CPU INRDY
Figure 9 An example of the SYSTEM LOAD view (Workloads submenu) showing the difference between the CPU MVS BUSY and the CPU BUSY (LPAR busy) for the TEST LPAR is reported in Figure 10.
3 Similar views are available to analyse zAAP and zIIP usage and zAAP and zIIP eligible work running on standard CPUs. 4 MVS busy calculation has to be adjusted when HD is active to take into account the processor parking activity. 5 Since z/OS 1.12 the number of ready work units for CPU, zAAP and zIIP is also available in SMF 70.
EPV Technologies
The Major CPU Exceptions in EPV 6
Figure 10
As already mentioned high MVS busy is often associated to a high number of IN_READY address spaces and consequent CPU queues in the system. EPV provides this information in the SYSTEM STATES view (Workloads submenu).
Figure 11
In this case you can note that there is a good correlation between CPU MVS BUSY and IN-READY6. The conditions that can cause this situation are:
a) The LPAR is not capped but there are no more CPU resources available in the CEC; in this situation the LPARs assigned weights are enforced by PR/SM so the first thing to check is that the assigned weight is adequate to the system workload. EPV provides this information in the SYSTEM CEC USAGE view (Workloads submenu) which shows the LPAR CPU utilization (% USED) compared to the ones allowed by the weight (% TARGET).
6 If the average IN_READY address spaces increases and the CPU MVS BUSY is not a problem then you need to analyse the workload using short collection intervals. There could be many short pieces of work scheduled at the same time.
EPV Technologies
The Major CPU Exceptions in EPV 7
Figure 12
As you can see % USED is higher than % TARGET only at 13 so in this case the problem is not the TEST LPAR weight value.
b) The LPAR is hard-capped. Also in this case it would be best to analyse the SYSTEM CEC
USAGE view in WORKLOADS table which shows the LPAR CPU utilization compared to the capped target weight. By looking at Figure 12 we can say that, at least at 13, the LPAR is not hard-capped because otherwise the maximum % USED value could never exceed the % TARGET value (3.5%).
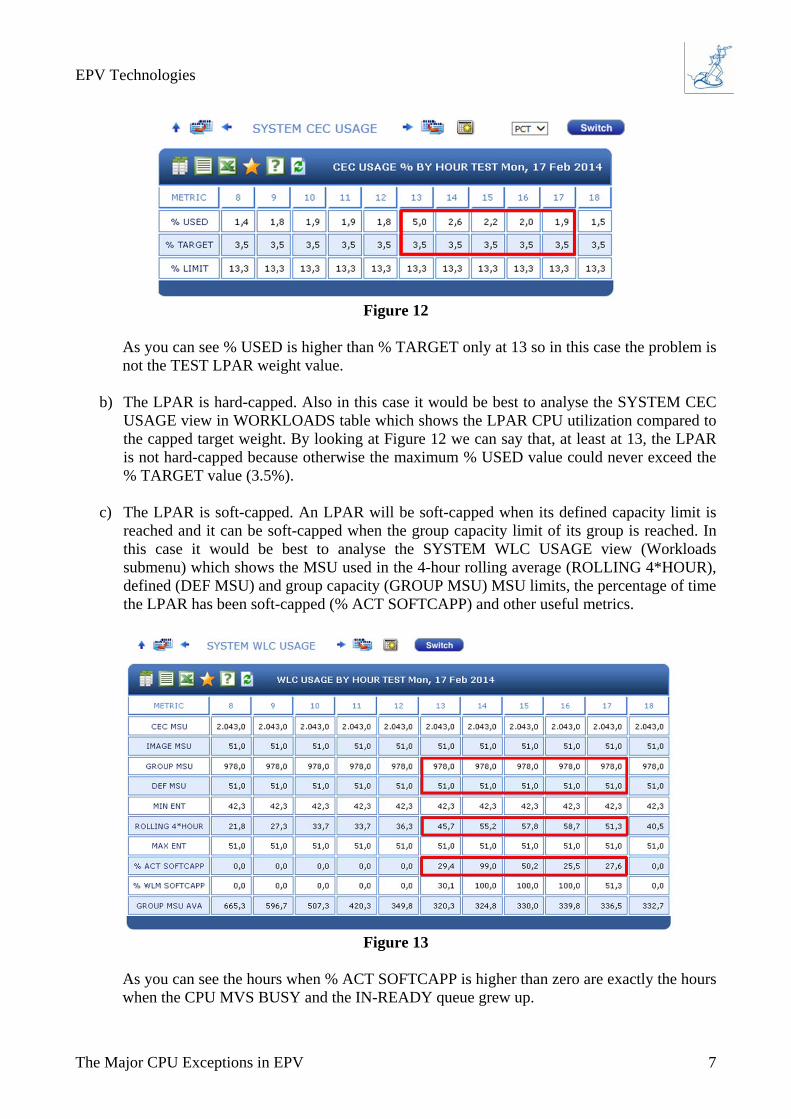
c) The LPAR is soft-capped. An LPAR will be soft-capped when its defined capacity limit is reached and it can be soft-capped when the group capacity limit of its group is reached. In this case it would be best to analyse the SYSTEM WLC USAGE view (Workloads submenu) which shows the MSU used in the 4-hour rolling average (ROLLING 4*HOUR), defined (DEF MSU) and group capacity (GROUP MSU) MSU limits, the percentage of time the LPAR has been soft-capped (% ACT SOFTCAPP) and other useful metrics.
Figure 13
As you can see the hours when % ACT SOFTCAPP is higher than zero are exactly the hours when the CPU MVS BUSY and the IN-READY queue grew up.
EPV Technologies
The Major CPU Exceptions in EPV 8
The TEST LPAR was soft-capped because the MSU used in the 4-hour rolling average (ROLLING 4*HOUR) exceeded the defined capacity limit MSU (DEF MSU).
6 System capture ratio The system capture ratio is an inverted measure of the internal system overhead. So the higher the capture ratio the lower the overhead. When the capture ratio is too low7 EPV produces the exceptions in Figure 14.
AREA MESSAGE ALERT SYSTEM GCP CAPTURE RATIO FOR SMF 72 RECORDS CPCPR72 SYSTEM AAP CAPTURE RATIO FOR SMF 72 RECORDS APCPR72 SYSTEM IIP CAPTURE RATIO FOR SMF 72 RECORDS IPCPR72
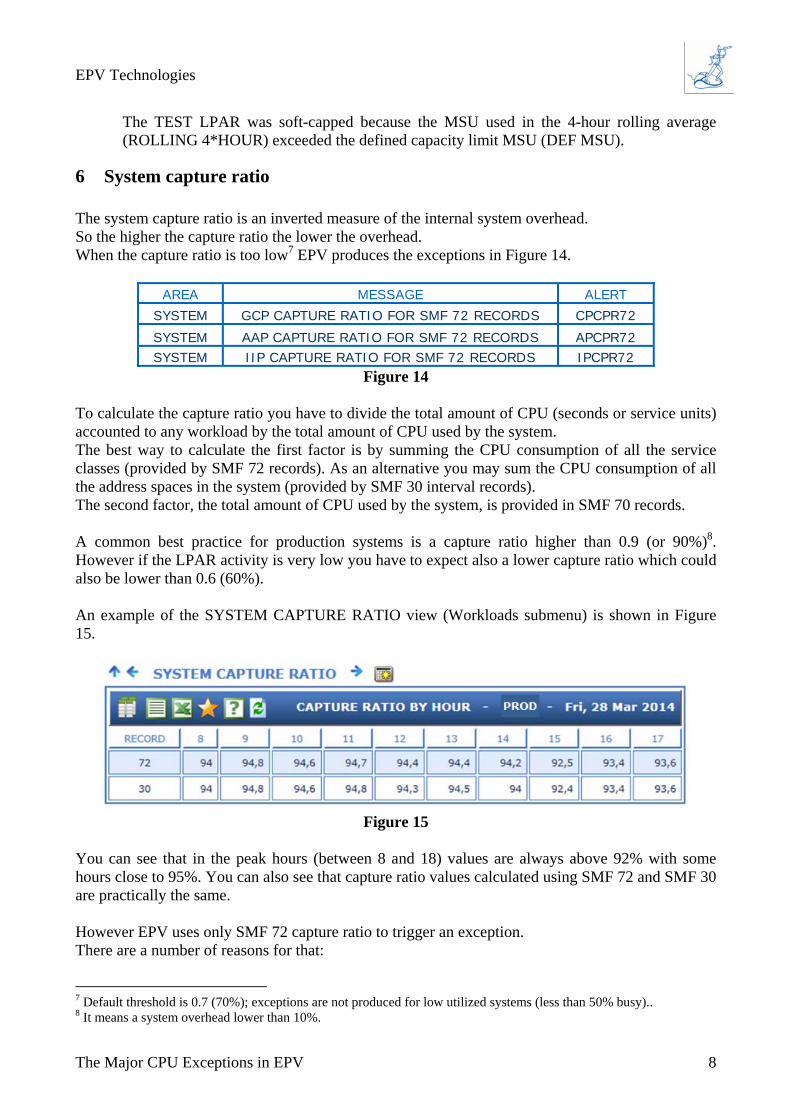
Figure 14 To calculate the capture ratio you have to divide the total amount of CPU (seconds or service units) accounted to any workload by the total amount of CPU used by the system. The best way to calculate the first factor is by summing the CPU consumption of all the service classes (provided by SMF 72 records). As an alternative you may sum the CPU consumption of all the address spaces in the system (provided by SMF 30 interval records). The second factor, the total amount of CPU used by the system, is provided in SMF 70 records. A common best practice for production systems is a capture ratio higher than 0.9 (or 90%)8. However if the LPAR activity is very low you have to expect also a lower capture ratio which could also be lower than 0.6 (60%). An example of the SYSTEM CAPTURE RATIO view (Workloads submenu) is shown in Figure 15.
Figure 15
You can see that in the peak hours (between 8 and 18) values are always above 92% with some hours close to 95%. You can also see that capture ratio values calculated using SMF 72 and SMF 30 are practically the same. However EPV uses only SMF 72 capture ratio to trigger an exception. There are a number of reasons for that:
7 Default threshold is 0.7 (70%); exceptions are not produced for low utilized systems (less than 50% busy).. 8 It means a system overhead lower than 10%.
EPV Technologies
The Major CPU Exceptions in EPV 9
SMF 30 interval records may be not synchronized with RMF records (SMF 70 and 72); for some address spaces SMF 30 interval records may not be collected when an address space is swapped out for long periods of time, SMF 30 interval records,
even if synchronized with RMF, may go out of synch sometimes showing values greater than 100% (see Capture Ratio using Address Space interval records - EPV Technologies white paper).
The amount of un-captured CPU may depends on many factors. The most common of them are:
- high paging activity (much less likely in systems nowadays); - high I/O activity; - parameter settings; - anomalies.
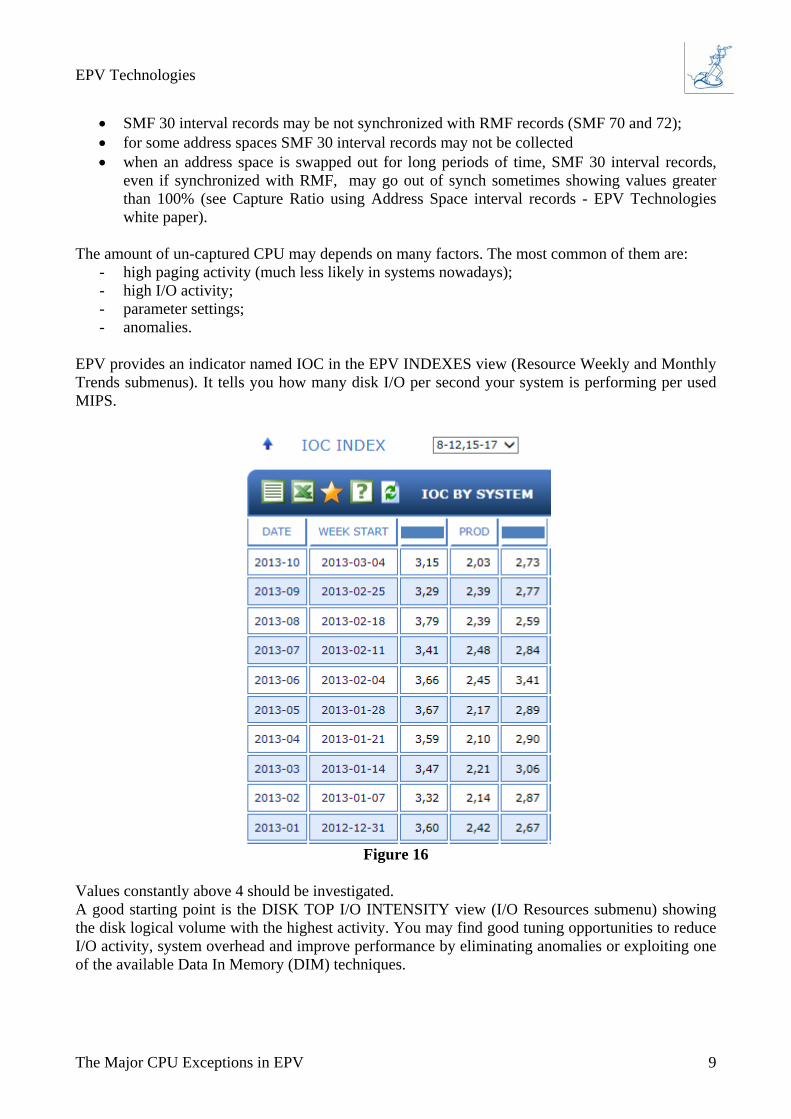
EPV provides an indicator named IOC in the EPV INDEXES view (Resource Weekly and Monthly Trends submenus). It tells you how many disk I/O per second your system is performing per used MIPS.
Figure 16
Values constantly above 4 should be investigated. A good starting point is the DISK TOP I/O INTENSITY view (I/O Resources submenu) showing the disk logical volume with the highest activity. You may find good tuning opportunities to reduce I/O activity, system overhead and improve performance by eliminating anomalies or exploiting one of the available Data In Memory (DIM) techniques.
EPV Technologies
The Major CPU Exceptions in EPV 10
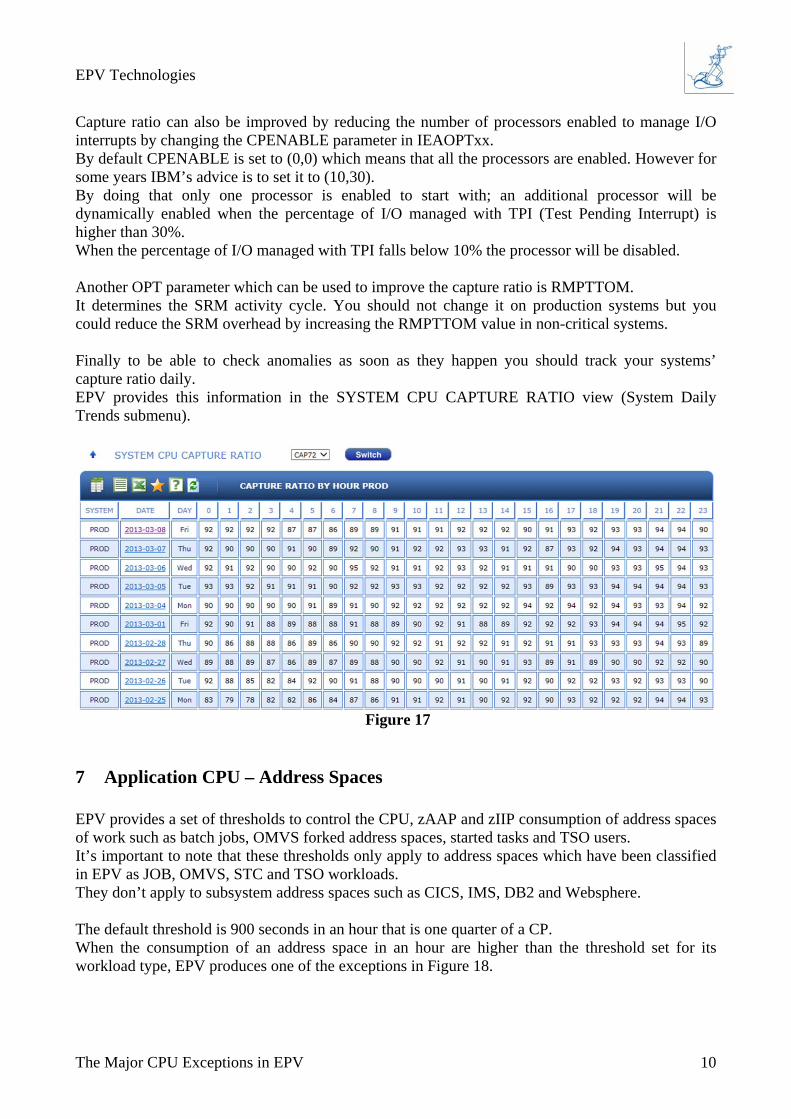
Capture ratio can also be improved by reducing the number of processors enabled to manage I/O interrupts by changing the CPENABLE parameter in IEAOPTxx. By default CPENABLE is set to (0,0) which means that all the processors are enabled. However for some years IBM’s advice is to set it to (10,30). By doing that only one processor is enabled to start with; an additional processor will be dynamically enabled when the percentage of I/O managed with TPI (Test Pending Interrupt) is higher than 30%. When the percentage of I/O managed with TPI falls below 10% the processor will be disabled. Another OPT parameter which can be used to improve the capture ratio is RMPTTOM. It determines the SRM activity cycle. You should not change it on production systems but you could reduce the SRM overhead by increasing the RMPTTOM value in non-critical systems. Finally to be able to check anomalies as soon as they happen you should track your systems’ capture ratio daily. EPV provides this information in the SYSTEM CPU CAPTURE RATIO view (System Daily Trends submenu).
Figure 17
7 Application CPU – Address Spaces EPV provides a set of thresholds to control the CPU, zAAP and zIIP consumption of address spaces of work such as batch jobs, OMVS forked address spaces, started tasks and TSO users. It’s important to note that these thresholds only apply to address spaces which have been classified in EPV as JOB, OMVS, STC and TSO workloads. They don’t apply to subsystem address spaces such as CICS, IMS, DB2 and Websphere. The default threshold is 900 seconds in an hour that is one quarter of a CP. When the consumption of an address space in an hour are higher than the threshold set for its workload type, EPV produces one of the exceptions in Figure 18.
EPV Technologies
The Major CPU Exceptions in EPV 11
AREA MESSAGE ALERT APPLICATION CPU JOB BATCH CPU TIME USED IN ONE HOUR CPUJOB
APPLICATION CPU OMVS ADDRESS SPACE CPU TIME USED IN ONE HOUR CPUOMVS
APPLICATION CPU STC ADDRESS SPACE CPU TIME USED IN ONE HOUR CPUSTC
APPLICATION CPU TSO ADDRESS SPACE CPU TIME USED IN ONE HOUR CPUTSO
APPLICATION CPU JOB BATCH AAP TIME USED IN ONE HOUR AAPJOB
APPLICATION CPU OMVS ADDRESS SPACE AAP TIME USED IN ONE HOUR AAPOMVS
APPLICATION CPU STC ADDRESS SPACE AAP TIME USED IN ONE HOUR AAPSTC
APPLICATION CPU TSO ADDRESS SPACE AAP TIME USED IN ONE HOUR AAPTSO
APPLICATION CPU JOB BATCH IIP TIME USED IN ONE HOUR IIPJOB
APPLICATION CPU OMVS ADDRESS SPACE IIP TIME USED IN ONE HOUR IIPOMVS
APPLICATION CPU STC ADDRESS SPACE IIP TIME USED IN ONE HOUR IIPSTC
APPLICATION CPU TSO ADDRESS SPACE IIP TIME USED IN ONE HOUR IIPTSO
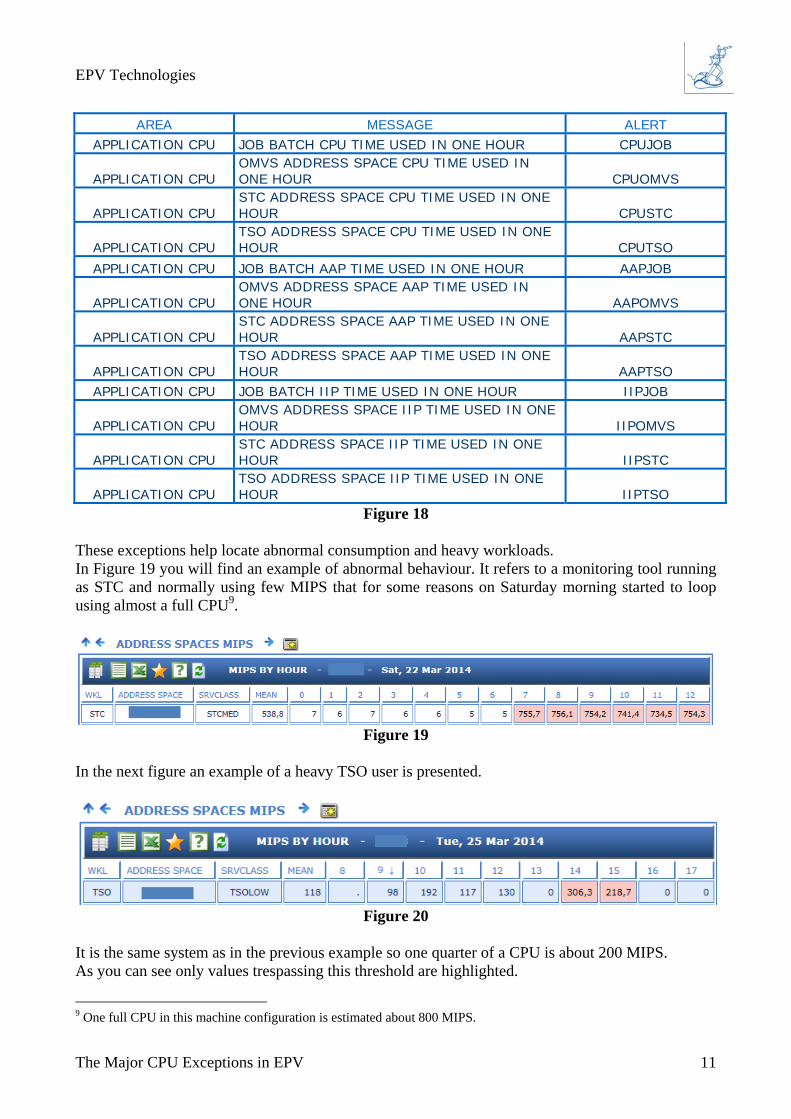
Figure 18 These exceptions help locate abnormal consumption and heavy workloads. In Figure 19 you will find an example of abnormal behaviour. It refers to a monitoring tool running as STC and normally using few MIPS that for some reasons on Saturday morning started to loop using almost a full CPU9.
Figure 19
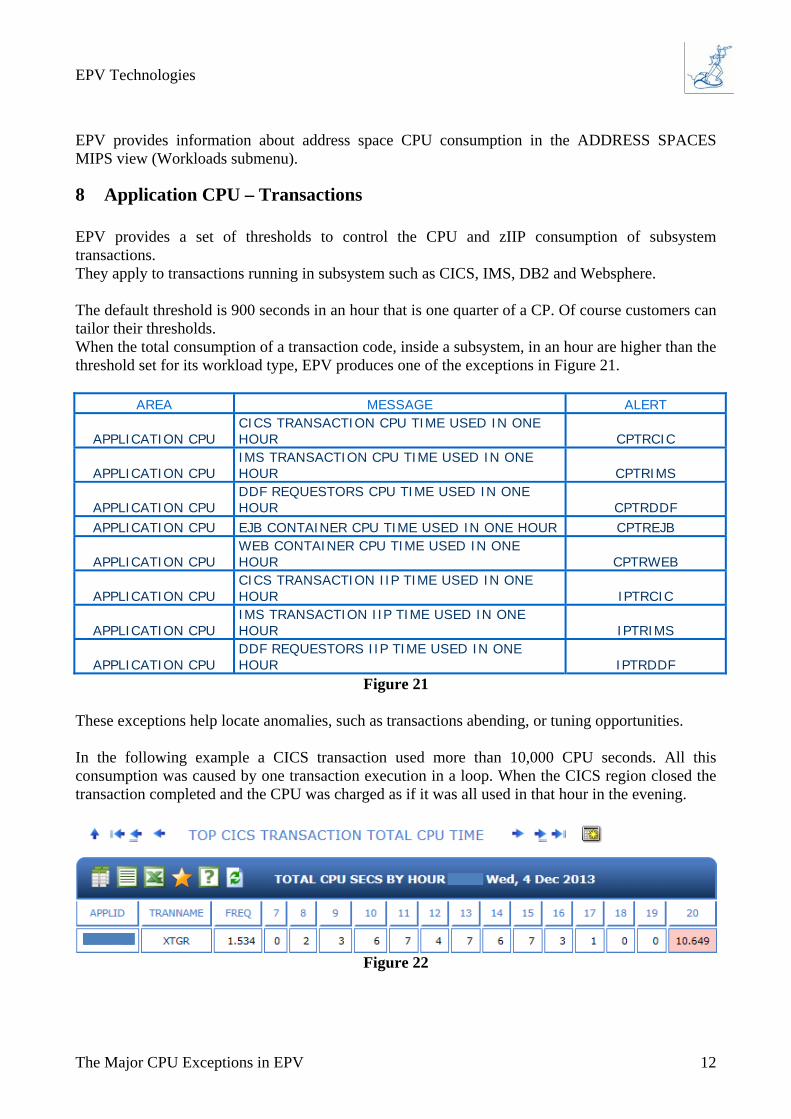
In the next figure an example of a heavy TSO user is presented.
Figure 20
It is the same system as in the previous example so one quarter of a CPU is about 200 MIPS. As you can see only values trespassing this threshold are highlighted.
9 One full CPU in this machine configuration is estimated about 800 MIPS.
EPV Technologies
The Major CPU Exceptions in EPV 12
EPV provides information about address space CPU consumption in the ADDRESS SPACES MIPS view (Workloads submenu).
8 Application CPU – Transactions EPV provides a set of thresholds to control the CPU and zIIP consumption of subsystem transactions. They apply to transactions running in subsystem such as CICS, IMS, DB2 and Websphere. The default threshold is 900 seconds in an hour that is one quarter of a CP. Of course customers can tailor their thresholds. When the total consumption of a transaction code, inside a subsystem, in an hour are higher than the threshold set for its workload type, EPV produces one of the exceptions in Figure 21.
AREA MESSAGE ALERT
APPLICATION CPU CICS TRANSACTION CPU TIME USED IN ONE HOUR CPTRCIC
APPLICATION CPU IMS TRANSACTION CPU TIME USED IN ONE HOUR CPTRIMS
APPLICATION CPU DDF REQUESTORS CPU TIME USED IN ONE HOUR CPTRDDF
APPLICATION CPU EJB CONTAINER CPU TIME USED IN ONE HOUR CPTREJB
APPLICATION CPU WEB CONTAINER CPU TIME USED IN ONE HOUR CPTRWEB
APPLICATION CPU CICS TRANSACTION IIP TIME USED IN ONE HOUR IPTRCIC
APPLICATION CPU IMS TRANSACTION IIP TIME USED IN ONE HOUR IPTRIMS
APPLICATION CPU DDF REQUESTORS IIP TIME USED IN ONE HOUR IPTRDDF
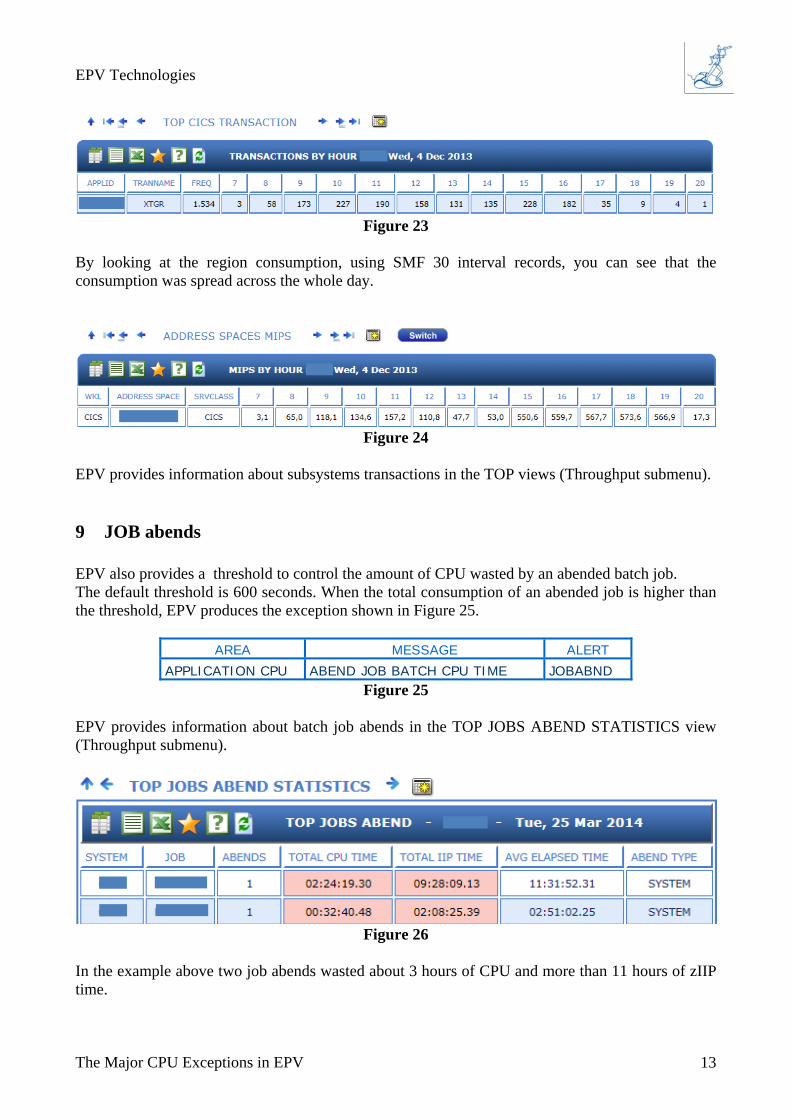
Figure 21 These exceptions help locate anomalies, such as transactions abending, or tuning opportunities. In the following example a CICS transaction used more than 10,000 CPU seconds. All this consumption was caused by one transaction execution in a loop. When the CICS region closed the transaction completed and the CPU was charged as if it was all used in that hour in the evening.
Figure 22
EPV Technologies
The Major CPU Exceptions in EPV 13
Figure 23
By looking at the region consumption, using SMF 30 interval records, you can see that the consumption was spread across the whole day.
Figure 24
EPV provides information about subsystems transactions in the TOP views (Throughput submenu).
9 JOB abends EPV also provides a threshold to control the amount of CPU wasted by an abended batch job. The default threshold is 600 seconds. When the total consumption of an abended job is higher than the threshold, EPV produces the exception shown in Figure 25.
AREA MESSAGE ALERT APPLICATION CPU ABEND JOB BATCH CPU TIME JOBABND
Figure 25 EPV provides information about batch job abends in the TOP JOBS ABEND STATISTICS view (Throughput submenu).
Figure 26
In the example above two job abends wasted about 3 hours of CPU and more than 11 hours of zIIP time.
EPV Technologies
The Major CPU Exceptions in EPV 14
10 zAAP and zIIP eligible time Exploitation of specialty engines is one of the best ways of reducing z/OS cost. For this reason EPV provides specific thresholds to help control the amount of zAAP and zIIP eligible work running on standard CPU. The default threshold is 1,800 seconds in an hour, that is half a CPU. When the zAAP or zIIP eligible time in an hour is higher than the threshold EPV produces one of the exceptions in Figure 27.
GROUP AREA MESSAGE ALERT HTML CEC AAP ELIGIBLE TIME USED IN ONE HOUR CECELAPHTML CEC IIP ELIGIBLE TIME USED IN ONE HOUR CECELIP
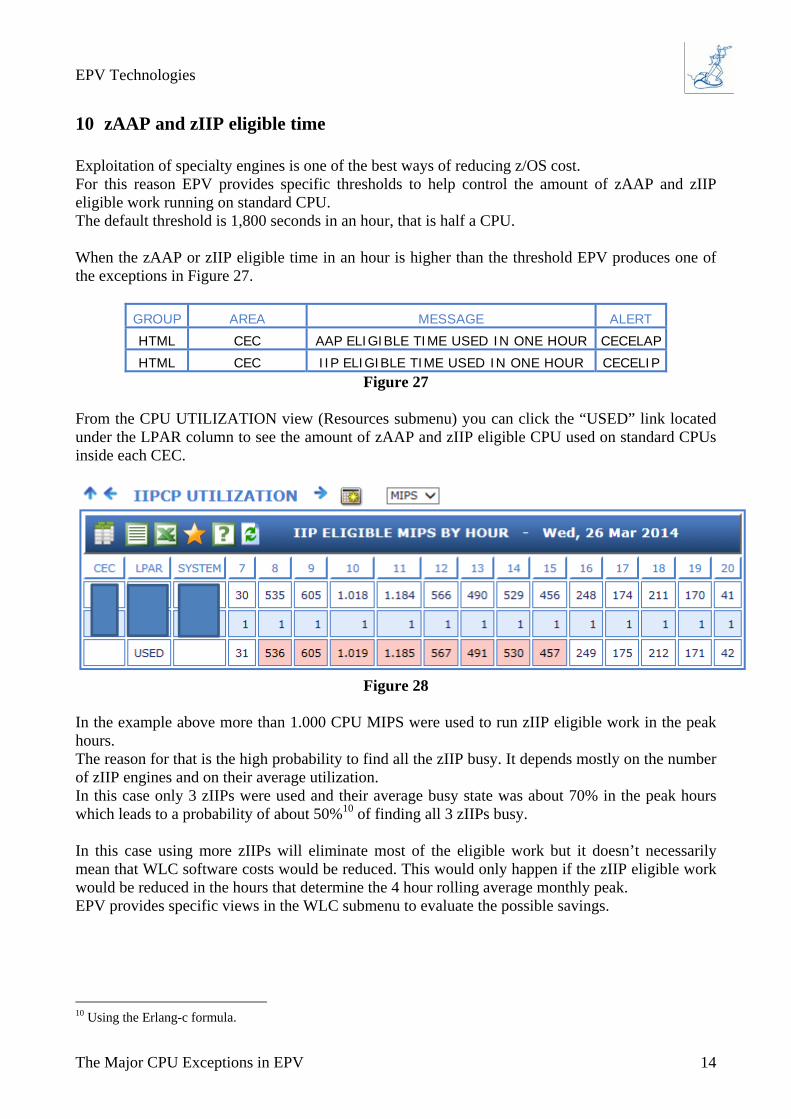
Figure 27 From the CPU UTILIZATION view (Resources submenu) you can click the “USED” link located under the LPAR column to see the amount of zAAP and zIIP eligible CPU used on standard CPUs inside each CEC.
Figure 28
In the example above more than 1.000 CPU MIPS were used to run zIIP eligible work in the peak hours. The reason for that is the high probability to find all the zIIP busy. It depends mostly on the number of zIIP engines and on their average utilization. In this case only 3 zIIPs were used and their average busy state was about 70% in the peak hours which leads to a probability of about 50%10 of finding all 3 zIIPs busy. In this case using more zIIPs will eliminate most of the eligible work but it doesn’t necessarily mean that WLC software costs would be reduced. This would only happen if the zIIP eligible work would be reduced in the hours that determine the 4 hour rolling average monthly peak. EPV provides specific views in the WLC submenu to evaluate the possible savings.
10 Using the Erlang-c formula.
EPV Technologies
The Major CPU Exceptions in EPV 15
11 Conclusions This document discusses the major CPU exceptions in EPV providing explanations, examples and recommendations which could help you reduce the CPU usage. While this document has been written mainly to help EPV for z/OS customers we think that all the concepts discussed here could be useful for everyone involved in z/OS performance analysis and tuning.