Embed Size (px)
Citation preview

SoutheaSt aSian J trop Med public health
574 Vol 44 No. 4 July 2013
Correspondence: Mullica Jaroensutasinee, Center of Excellence for Ecoinformatics, School of Science, Walailak University, 222 Thaiburi, Thasala, Nakhon Si Thammarat 80161, Thai-land.Tel: +66 (0) 75 672005-6; Fax: +66 (0) 75 672004E-mail: [email protected]
THE MOSQUITO ONLINE ADVANCED ANALYTIC SERVICE: A CASE STUDY FOR SCHOOL RESEARCH
PROJECTS IN THAILAND
Siriwan Wongkoon, Mullica Jaroensutasinee and Krisanadej Jaroensutasinee
Center of Excellence for Ecoinformatics, School of Science, Walailak University, Nakhon Si Thammarat, Thailand
Abstract. The Mosquito Online Advanced Analytic Service (MOAAS) provides an essential tool for querying, analyzing, and visualizing patterns of mosquito larval distribution in Thailand. The MOAAS was developed using Structured Query Language (SQL) technology as a web-based tool for data entry and data access, webMathematica technology for data analysis and data visualization, and Google Earth™ and Google Maps™ for Geographic Information System (GIS) visualization. Fifteen selected schools in Thailand provided test data for MOAAS. Users performed data entry using the web-service, data analysis, and data visu-alization tools with webMathematica, data visualization with bar charts, mosquito larval indices, and three-dimensional (3D) bar charts overlaying on the Google Earth™ and Google Maps™. The 3D bar charts of the number of mosquito larvae were displayed along with spatial information. The mosquito larvae information may be useful for dengue control efforts and health service communities for plan-ning and operational activities.
Keywords: mosquito, web database, Aedes larvae, Google Earth™, Google Maps™
INTRODUCTION
Aedes mosquitoes transmit dengue virus, responsible for dengue infection. Dengue fever is a leading cause for hospi-talizations of children in Thailand (Phua-nukoonnon et al, 2005). With the absence of an effective vaccine or chemotherapy, prevention of dengue is currently only possible by control of the principal vector (Aedes aegypti) and secondary vector (Ae.
albopictus) (Hay et al, 2000; Stephenson et al, 2003; WHO, 2009), and by using per-sonal protection from the bites of infected mosquitoes (WHO, 2009).
Active participation by the at risk human population is essential for con-trol, especially by elimination of vector breeding sites (Chiaravalloti-Neto, 1997). A previous study showed education of students is a crucial factor for initiating community engagement and participation in the control of mosquito vectors (Regis et al, 1996). The school environment is ideal for development of dengue educa-tion modules, principally because of its division by age and level of knowledge, allowing teaching to be conducted at dif-ferent levels of complexity. The teacher

MoSquito online advanced analytic Service
Vol 44 No. 4 July 2013 575
pupil relationship is conducive of par-ticipation in mosquito larva reduction efforts in their homes (Madeira et al, 2002). However, information alone is insufficient to effect behavioral changes. In this study, we developed the Mosquito Online Ad-vanced Analytic Service (MOAAS) as an advanced tool for querying, analyzing, and visualizing patterns of mosquito larva distribution in Thailand.
MATERIALS AND METHODS
System architectureThe MOAAS was programmed using
the computer languages Hypertext Mark-up Language (HTML), Java Server Page (JSP), and webMathematica technology, while Apache Tomcat 6.0 and Microsoft SQL Server 2008 were used as the web server software and database manage-ment system, respectively (Fig 1).
JSP technology provides an easy way to create dynamic web pages and simplify the task of building web applications that work with a wide variety of web servers, application servers, browsers, and devel-opment tools (McPherson, 2012). A JSP page is simply an HTML web page that contains additional bits of code, which ex-ecute application logic to generate dynamic content. When the page is displayed in a user’s browser, it contains both the static HTML content, and the dynamic informa-tion retrieved from the database. While HTML tags are processed by a user’s web browser to display the page, JSP tags are used by the web server to generate dynam-ic content (Sun Developer Network, 2011).
WebMathematica offers access to spe-cific Mathematica applications through a web browser or other web clients. Web-Mathematica adds interactive calculations and visualizations to websites by integrat-
ing Mathematica with the latest web server technology (Wolfram Research, 2011).
JSP is used for contacting Apache Tomcat and Microsoft SQL Server. Scripts written in JSP interpret the query keys input in the home page and retrieve suit-able data from the Microsoft SQL Server database. In the system, we make JSP work in partnership with webMathematica technology, so it generates graphic images and advanced statistical tools, such as the chi-square test, regression analysis and time series analysis.System evaluation
The objective of the study was to eval-uate student perceptions of the MOAAS. A questionnaire was given to the students after they had used the MOAAS for ap-proximately one year. The questionnaire consisted of 13 questions under four main headings: evaluation of education materi-als, user-program interaction satisfaction, evaluation of MOAAS’s features, and evaluation of the educational process.
We randomly selected four out of 15 schools from four regions in Thailand. A total of 124 students took part in the system evaluation. The questionnaire was given to the participants by their teachers. Participants were asked to fill out the questionnaire indicating their level of agreement with a statement using a five-point Likert scale. The students’ anonymous responses were collected by their teachers, who then forwarded them to the system administrator.
RESULTS
We have developed a GLOBE (Global Learning and Observations to Benefit the Environment) Mosquito Protocol for Thailand in collaboration with scientists from the GLOBE Seasons and Biomes

SoutheaSt aSian J trop Med public health
576 Vol 44 No. 4 July 2013
Web browser Apache Tomcat
Web ServerHTML, JSP,
WebMathematicaMosquito database
Users
Fig 1–Overview of the system architecture.
The number of mosquito larvae in differenttypes of water containers
High and low risk transmission level
Menu
Login
Data entry
Site definitiondatasheet
Mosquito larvadatasheet
Data analysis
Simple linearregression analysis
Univariate time seriesanalysis
Non-login Mosquito protocol
Datasheet
Mosquito larval key
School research projects
Data summary
Mosquito larval indices
Data representation with bar chart
Data representation with bar chart
3D bar chart number of mosquito larvae onGoogle EarthTM and Google MapsTM
Chi-square test
Download
Fig 2–Summary of the functions of the system.
program, as well as those in Thailand. Participating teachers and students had a chance to learn about mosquito research and to conduct school research projects through the Mosquito Protocol, which the Institute for the Promotion of Teaching Science and Technology (IPST) in Thai-
land has explored in science classrooms. All certified participants are required to complete the Thailand GLOBE Mosquito Protocol Training in the mosquito larval survey, identification of mosquito larval species, data entry, data representation, data analysis and data interpretation.
MoSquito online advanced analytic Service
Vol 44 No. 4 July 2013 577
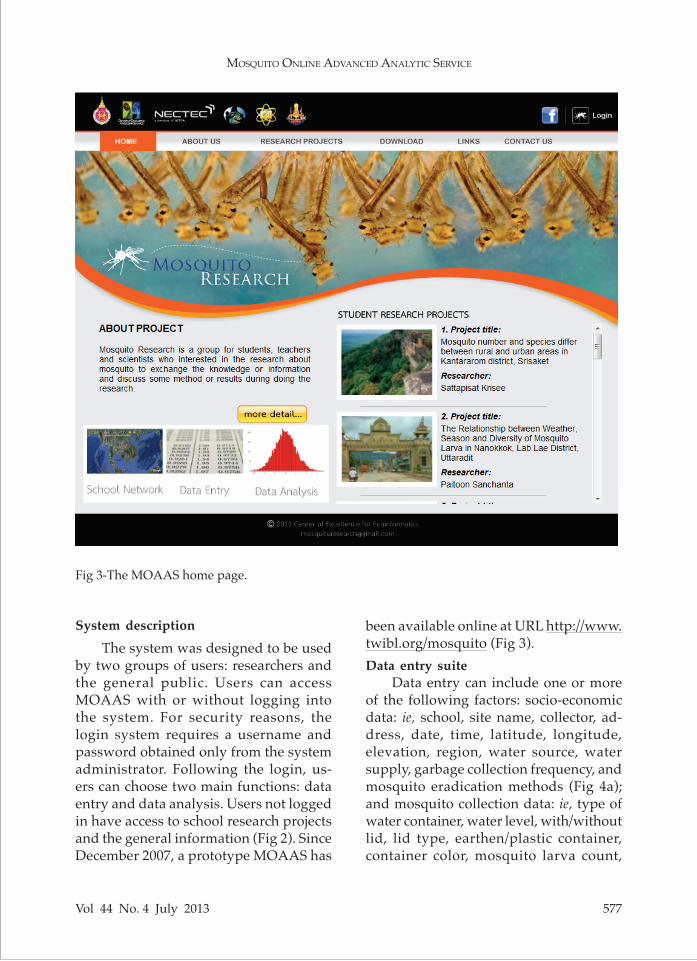
Fig 3-The MOAAS home page.
System description
The system was designed to be used by two groups of users: researchers and the general public. Users can access MOAAS with or without logging into the system. For security reasons, the login system requires a username and password obtained only from the system administrator. Following the login, us-ers can choose two main functions: data entry and data analysis. Users not logged in have access to school research projects and the general information (Fig 2). Since December 2007, a prototype MOAAS has
been available online at URL http://www.twibl.org/mosquito (Fig 3).Data entry suite
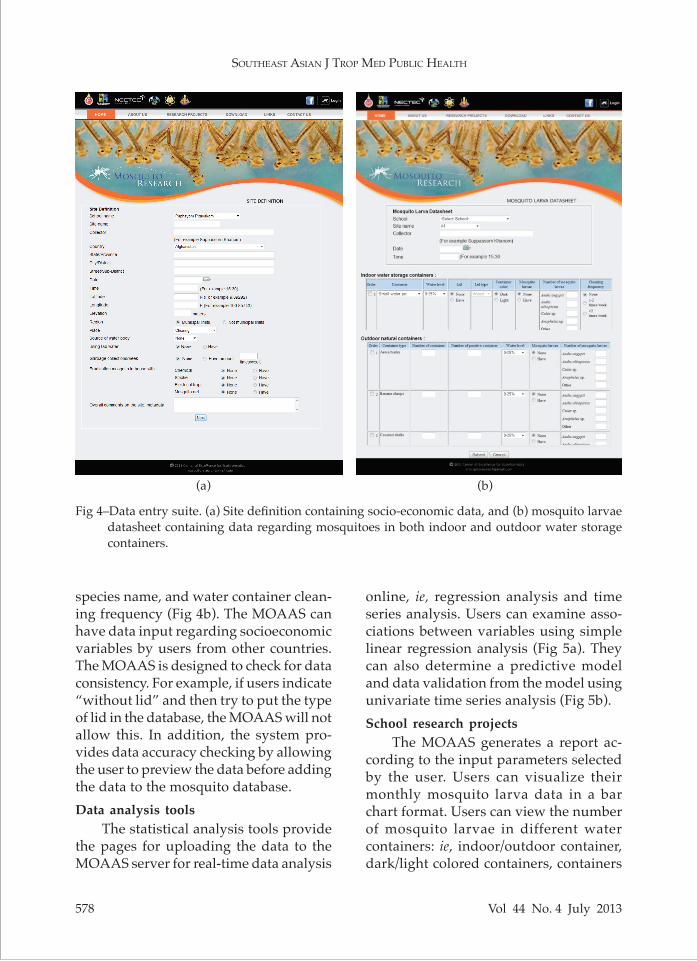
Data entry can include one or more of the following factors: socio-economic data: ie, school, site name, collector, ad-dress, date, time, latitude, longitude, elevation, region, water source, water supply, garbage collection frequency, and mosquito eradication methods (Fig 4a); and mosquito collection data: ie, type of water container, water level, with/without lid, lid type, earthen/plastic container, container color, mosquito larva count,
SoutheaSt aSian J trop Med public health
578 Vol 44 No. 4 July 2013
Fig 4–Data entry suite. (a) Site definition containing socio-economic data, and (b) mosquito larvae datasheet containing data regarding mosquitoes in both indoor and outdoor water storage containers.
species name, and water container clean-ing frequency (Fig 4b). The MOAAS can have data input regarding socioeconomic variables by users from other countries. The MOAAS is designed to check for data consistency. For example, if users indicate “without lid” and then try to put the type of lid in the database, the MOAAS will not allow this. In addition, the system pro-vides data accuracy checking by allowing the user to preview the data before adding the data to the mosquito database.Data analysis tools
The statistical analysis tools provide the pages for uploading the data to the MOAAS server for real-time data analysis
online, ie, regression analysis and time series analysis. Users can examine asso-ciations between variables using simple linear regression analysis (Fig 5a). They can also determine a predictive model and data validation from the model using univariate time series analysis (Fig 5b).School research projects
The MOAAS generates a report ac-cording to the input parameters selected by the user. Users can visualize their monthly mosquito larva data in a bar chart format. Users can view the number of mosquito larvae in different water containers: ie, indoor/outdoor container, dark/light colored containers, containers
(a) (b)

MoSquito online advanced analytic Service
Vol 44 No. 4 July 2013 579
Fig 5–Data analysis tools. (a) Regression analysis tool and (b) time series analysis tool.
with lids/without lids, earthen/plastic containers, and artificial/natural contain-ers; mosquito larval indices (House Index, Container Index, and Breteau Index); and the mosquito larva distribution in 3D bar charts on Google Earth™. The users can visualize the number of mosquito larvae by 3D bar charts online via Google Earth™ and Google Maps™ by selecting the pe-riod and the mosquito larval species or by viewing all species (Fig 6a). Users can
download the number of mosquito larvae in the 3D bar chart on Google Earth™ onto their local disk in the Keyhole Markup Language (KML) files format to display on Google Earth™. Users can compare the number of mosquito larvae in the different types of water containers using the chi-square test (Fig 6b, c). Users can “Share”, “Like,” or “Comment” on the results page via social networking services (ie, Facebook). Users can post the results
(a) (b)

SoutheaSt aSian J trop Med public health
580 Vol 44 No. 4 July 2013
Fig 6−School research projects. (a) GIS tool display-
ing the number and distribution of mosquito larva using 3D bar charts on Google Earth™, (b) graphic tool displaying the monthly mosquito larvae in indoor and outdoor containers and (c) statistical tool showing the max/min/mean results and the results from the chi-square test.
of the MOAAS to a Facebook page. They can view abstracts, posters, and conference proceedings. The system can report a data summary in a print-able format.System evaluation
The MOAAS was tested with ac-tual data collected from 15 randomly selected schools from four regions in Thailand (Fig 7). Entomological and socio-economic data associated with dengue fever were collected by stu-dents at the selected schools.
Table 1 shows the results of the quantitative study derived from the questionnaires of the 124 students. The mean and standard deviation results for each statement, in a five-point Likert scale are also shown in Table 1. Students appeared to be satisfied with the quality of educa-tional materials. They expressed their satisfaction with the interaction with the program’s interface from which they could more easily adapt the data to suit the needs of their science classwork. They specifically indicated that the GIS tool and school research project sections were the most useful parts of the MOAAS features (Table 1), and were of the opinion the system provided valuable knowledge (4.290). The use of the MOAAS provided a high level of motivation for their learning process (4.306). Overall, the participating students found the MOAAS useful for conducting research regarding mosquito larvae and related fields (4.427) (Table 1).
DISCUSSION
The internet is an integral part of daily life in many countries. It is an increasingly important tool to reduce
(a)
(b)
(c)

MoSquito online advanced analytic Service
Vol 44 No. 4 July 2013 581
technological barriers and make it easier for users from different geographical loca-tions to access decision support models and tools (Papic et al, 2009). Databases are an essential, widely used technology for biomedical research projects (O’Connor et al, 2009). A web database and Geo-graphic Information System (GIS) tech-nology are increasingly used in medical and health education, health science, and environmental science research (Harris et al, 2009; Herzberg et al, 2009; Ng et al, 2009; Papic et al, 2009; Simão et al, 2009; Wang et al, 2009; Wright et al, 2009).
The system can be accessed from anywhere via the internet. Web-based solutions result in significantly lower deployment costs. Web browsers are available for most popular hardware and operating systems and provide access to a variety of servers. It is not necessary to install vender-specific database access
drivers on individual client computers, thereby lowering both licensing costs and administrative overhead. A variety of simple and complex user interfaces (check boxes, radio buttons, pull down menus and text boxes) can easily be designed using HTML. The HTML interface can accommodate multimedia information in the display.This allows even beginners to successfully complete their operation (Inoue et al, 2003).
As part of the Java technology family, JSP technology enables rapid develop-ment of web-based applications that are platform independent. JSP technology separates the user interface from content generation, enabling designers to change the overall page layout without altering the underlying dynamic content. Besides JSP, there are other software programs for creating a web-based server system, such as Active Server Page (ASP) or Hyper-
Fig 7−The 15 selected schools from four regions in Thailand with a description of the school project.

SoutheaSt aSian J trop Med public health
582 Vol 44 No. 4 July 2013
text Preprocessor (PHP) (Sun Developer Network, 2011). We adopted JSP because webMathematica is based on Mathematica and two standard Java technologies: Java Servlets and JSP. Servlets are special Java programs that run in a Java-enabled web server, which is typically called a “servlet container” or sometimes a “servlet en-gine”. There are different types of servlet containers that can run on different op-erating systems and architectures. The servlet containers can also be integrated into other web servers, such as the Apache web server (Wolfram Research, 2011). JSP can easily generate KML files for the GIS tool and advanced statistical tests by us-ing webMathematica. KML files are used to display geographic data in many appli-cations, including Google Earth, Google Maps, Google Maps for mobile, NASA WorldWind, ESRI ArcGIS Explorer, Adobe
PhotoShop, AutoCAD, and Yahoo! Pipes (Google Developers, 2012).
In 1992, the Ministry of Public Health and the Ministry of Education in Thailand began to integrate information about den-gue into the primary school curriculum. Since 1998, vector control and health edu-cation specialists have worked throughout the country, applying larvicide and fog-ging during the epidemic season (Nagao et al, 2003). The intervention has not been sufficient for dengue control, and high risks of dengue transmission continue to exist in several regions of Thailand (WHO, 2009). Therefore, the MOAAS was devel-oped to create online data entry and data visualization regarding Aedes mosquito larvae associated with dengue transmis-sion. The mosquito larval occurrence data in the study sites are suitable for monitor-ing epidemics for early warning purposes
Evaluation of educational materials Mean ± SD
Is the quality of the educational material (texts, images) adequate? 3.895±0.844 How compatible is the educational material with the mosquito project? 4.234±0.664User-program interaction satisfaction Is information structured in a meaningful and consistent way? 4.234±0.688 How easily were the materials adapted to the science class? 4.113±0.665 How familiar do you feel with the terminology used? 4.492±0.821Evaluation of MDS’s features How useful is the data entry suite? 4.048±0.835 How useful is the data analysis tool? 4.250±0.792 How useful is the GIS tool? 4.468±0.801 How useful is the school research project section? 4.339±0.697 How useful is the download section? 4.137±0.790Evaluation of educational process Does the system stimulate your search for knowledge? 4.290±0.814 Does the system provide motivation for participating in the mosquito project? 4.306±0.745 Do you find the system useful for doing research about mosquito larvae 4.427±0.723 or related fields?
Table 1Questionnaire about students’ perceptions towards the MOAAS. Each statement was
given a score of 1-5 using a five point Likert scale.

MoSquito online advanced analytic Service
Vol 44 No. 4 July 2013 583
(Nagao et al, 2003). These monitoring products are automatically updated when new data become available.
Vector-borne and other infectious diseases place tremendous public health burdens on developing countries. Even when management solutions are avail-able, many are not economically feasible to implement in areas with the greatest need. Therefore, a part of the new fron-tier in infectious disease research must be adapting technologically advanced and costly concepts for disease manage-ment to operational use in resource-poor environments through the development of low-cost tools and solutions (Lozano-Fuentes et al, 2008).
The emergence of Virtual Globe software systems (ie, Google Earth™) has revolutionized the traditional way of using geospatial information, making global geospatial information accessible to and usable by the general public instead of only by highly-skilled domain experts (Boulos, 2005). Google Earth™ is an ex-cellent example of a freely accessible tool with great potential for improving public health (Lozano-Fuentes et al, 2008). The MOAAS has integrated Google Earth™ and Google Maps™ to display geospatial information, showing mosquito larval distribution in 3D bar charts on Google Earth™ and Google Maps™, which has helped scientists, teachers, and students visualize the dengue risk areas. Previous findings showed topography, season, and type of water container impacted the num-ber of Aedes larvae in Thailand (Thavara et al, 2001; Wongkoon et al, 2005, 2007). Together with the mosquito larvae data in the system, a 3D bar chart can be created in Google Earth™ and Google Maps™ as an interactive map that displays the num-ber of mosquito larvae, and the monthly number of mosquito larvae, in different
types of water containers. Users may gain insight into how these conditions affect the Aedes larval occurrence. These tools can be used for vector control programs to guide prevention, surveillance, and control efforts in high risk areas. They can also be used to inform public health offices or local decision-makers about spatial risk patterns (Lozano-Fuentes et al, 2008). The results of real-time on-line statistical test-ing are useful for the users to find some immediate relationship.
In conclusion, this system helps to identify dengue risk areas and design effective dengue control strategies. The MOAAS provides advanced tools for querying, analyzing, and visualizing patterns of mosquito larval distribution in Thailand. If there were more data in the system for other areas of Thailand and other countries in the world, the ad-ditional information could be used for bet-ter decision-making regarding mosquito larva control and dengue transmission prevention.
ACKNOWLEDGEMENTS
We thank Thana na Nagara, John Endler, Leslie Gordon, and Sherri Conklin for comments on previous versions of this manuscript. We thank Visut Baimai and Usavadee Thavara for their valuable com-ments on the Thailand GLOBE Mosquito Protocol. Financial support was obtained from the Thailand Research Fund through the Royal Golden Jubilee PhD Program (Grant No. PHD/0201/2548) for Siriwan Wongkoon and Mullica Jaroensutasinee, Walailak University Fund 06/2552, the GLOBE Thailand Program, the Institute for the Promotion of Teaching Science and Technology (IPST), Center of Excellence for Ecoinformatics, NECTEC/Walailak University and the Institute of Research

SoutheaSt aSian J trop Med public health
584 Vol 44 No. 4 July 2013
and Development, Walailak University (Grant no. WU 55702). We also thank the teachers and students of Thailand for their collaboration with this project.
REFERENCES
Boulos MN. Web GIS in practice III: creating a simple interactive map of England’s Strategic Health Authorities using Google Maps API, Google Earth KML, and MSN Virtual Earth Map Control. Int J Health Geogr 2005; 4: 22.
Chiaravalloti-Neto F. The population’s know- ledge concerning dengue fever, vectors, and control measures in São José do Rio Preto, São Paulo State. Cad Saúde Pública 1997; 13: 447-53.
Google Developers. Keyhole Markup Lan-guage. Mountain View, CA: Google, 2012. [Cited 2012 Nov 20]. Available from: URL: https://developers.google.com/kml/docu-mentation/
Harris PA, Taylor R, Thielke R, Payne J, Gonza-lez N, Conde JG. Research electronic data capture (REDCap)-A metadata-driven methodology and workflow process for providing translational research infor-matics support. J Biomed Inform 2009; 42: 377-81.
Hay SI, Myers MF, Burke DS, et al. Ethology of interepidemic periods of mosquito-borne disease. PNAS 2000; 97: 9335-9.
Herzberg D, Marsden N, Kübler P, et al. Specify-ing computer based counselling systems in health care: A new approach to user-interface and interaction design. J Biomed Inform 2009; 42: 347-55.
Inoue M, Hasegawa S, Suyama A, Meshitsuka S. Automated graphic image generation system for effective representation of in-fectious disease surveillance data. Comput Meth Prog Bio 2003; 72: 251-6.
Lozano-Fuentes S, Elizondo-Quiroga D, Farfan-Ale JA, et al. Use of Google Earth™ to strengthen public health capacity and facilitate management of vector-borne
diseases in resource-poor environments. Bull World Health Organ 2008; 86: 718-25.
Madeira NG, Macharelli CA, Pedras JF, Delfino MCN. Education in primary school as a strategy to control dengue. Rev Soc Bras Med Trop 2002; 35: 221-6.
McPherson S. JavaServer Pages: a developer’s perspective. Redwood City: Oracle, 2012. [Cited 2012 May 20]. Available from: URL: http://www.oracle.com/technetwork/ar-ticles/javase/jsp-135132.html
Nagao Y, Thavara U, Chitnumsup P, Tawatsin A, Chansang C, Campbell-Lendrum D. Climatic and social risk factors for Aedes infestation in rural Thailand. Trop Med Int Health 2003; 8: 650-9.
Ng CKC, White P, Mckay JC. Development of a web database portfolio system with PACS connectivity for undergraduate health education and continuing professional development. Comput Meth Prog Bio 2009; 94: 26-38.
O’Connor MJ, Shankar RD, Parrish DB, Das AK. Knowledge-data integration for temporal reasoning in a clinical trial system. Int J Med Inform 2009; 78S: S77-85.
Papic V, Rogulj N, Pleatina V. Identification of sport talents using a web-oriented expert system with a fuzzy module. Expert Syst Appl 2009; 36: 8830-8.
Phuanukoonnon S, Meuller I, Bryan JH. Ef-fectiveness of dengue control practices in household water containers in Northeast Thailand. Trop Med Int Health 2005; 10: 755-63.
Regis L, Furtado AF, Oliveira CMF, et al. Inte-grated control of the filariasis vector with community participation in an urban area of Recife, Pernambuco, Brazil. Cad Saüde Püblica 1996; 12: 473-82.
Simão A, Densham PJ, Haklay M. Web-based GIS for collaborative planning and public participation: An application to the strate-gic planning of wind farm sites. J Environ Manage 2009; 90: 2027-40.
Stephenson I, Roper J, Fraser M, Nicholson K, Wiselka M. Dengue fever in febrile return-

MoSquito online advanced analytic Service
Vol 44 No. 4 July 2013 585
ing travellers to a UK regional infectious diseases unit. Travel Med Infect Dis 2003; 1: 89-93.
Sun Developer Network. Java Server Pages Technology - Comparison with ASP. Red-mond: Microsoft, 2011. [Cited 2011 Sep 20]. Available from: URL: http://www.mi-crosoft.com/sqlserver/en/us/default.aspx
Thavara U, Tawatsin A, Chansang C, et al. Lar-val occurrence, oviposition behavior and biting activity of potential mosquito vec-tors of dengue on Samui Island, Thailand. J Vector Ecol 2001; 26: 172-80.
Wang S, Xia J, Yu L, Li C, Xu L, Zheng L. Real-ization of simulations for blinded internal pilot study based on web. J Biomed Inform 2009; 42: 262-71.
World Health Organization (WHO). Dengue: guidelines for diagnosis, treatment, pre-
vention and control. Geneva: WHO, 2009.Wolfram Research. webMathematica technol-
ogy. Champaign: Wolfram Research, 2011. [Cited 2011 Sep 20]. Available from: URL: http://www.wolfram.com/products/web-mathematica/technology/
Wongkoon S, Jaroensutasinee M, Jaroensutas-inee K. Larval infestations of Aedes aegypti and Ae. albopictus in Nakhon Si Thamma-rat, Thailand. Dengue Bull 2005; 29: 169-75.
Wongkoon S, Jaroensutasinee M, Jaroensuta-sinee K, Preechaporn W. Development sites of Aedes aegypti and Ae. albopictus in Nakhon Si Thammarat, Thailand. Dengue Bull 2007; 31: 141-52.
Wright A, Bates DW, Middleton B, et al. Creat-ing and sharing clinical decision support content with Web 2.0: Issues and examples. J Biomed Inform 2009; 42: 334-46.