Embed Size (px)
Citation preview

THE MOST
AGILE GLOBAL TRADE
CREDIT PARTNER IN THE INDUSTRY
—
INVESTOR PRESENTATION
NOVEMBER 2017
Content
9M-2017 RESULTS | PRESENTATION TO FINANCIAL ANALYSTS 2
BUSINESS MODEL
& STRATEGY
1
PERFORMANCE
& SOLVENCY
2 APPENDICES
PART 1 BUSINESS MODEL & STRATEGY

Coface, a publicly listed
company, has been one of
the WORLD’S LEADING
CREDIT INSURANCE
COMPANIES for the last
70 years
We SPECIALISE IN
FACILITATING BUSINESS-
TO-BUSINESS TRADE,
working with our customers
to develop their operations,
both on their domestic
markets and internationally
Our AREAS OF EXPERTISE: We also keep our customers
up-to-date on current market
conditions, leveraging
our INTERNATIONAL
BUSINESS AND RISK
MANAGEMENT EXPERTISE,
COUNTRY AND SECTOR
ASSESSMENTS AND
QUALITY DATA
ON 80 MILLION COMPANIES
WORLDWIDE
4 INVESTOR PRESENTATION | NOVEMBER 2017
WHO ARE WE?
4,300 employees, 70 nationalities
Direct presence in 66 countries
Largest footprint vs. top global competitors BONDING In Austria, France,
Germany & Italy
CREDIT INSURANCE
DEBT COLLECTION
for insured and non-insured
companies
BUSINESS INFORMATION
for insured and non-insured
companies
SINGLE
RISK guarantees
for one-off complex
operations
FACTORING in Germany
& Poland
5 INVESTOR PRESENTATION | NOVEMBER 2017
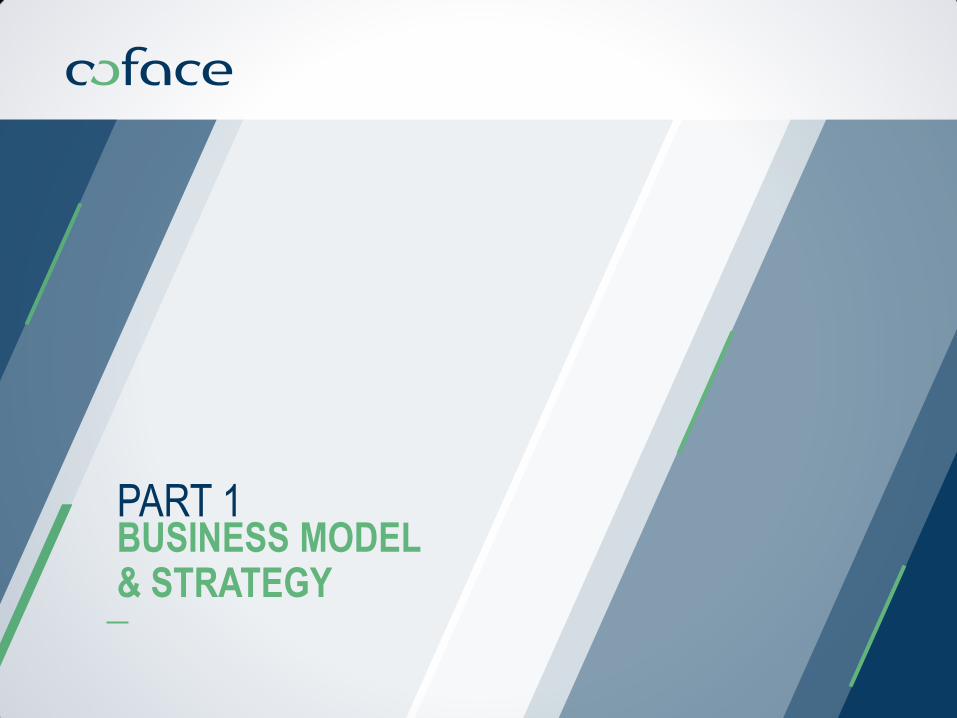
Our geographical footprint is the broadest in the industry
COFACE is present DIRECTLY, or through its PARTNERS, in 100 COUNTRIES, providing support for customers in more than 200 COUNTRIES.
The Group uses its OWN INTERNATIONAL NETWORK, which is complemented by the “COFACE PARTNER” NETWORK
LATIN AMERICA
Argentina
Brazil
Chile
Colombia
Ecuador
Mexico
Panama
Paraguay
Peru
Uruguay
Venezuela
NORTH AMERICA
Canada
USA
WESTERN EUROPE
Belgium
France
Ireland
Luxembourg
Switzerland
United Kingdom
NORTHERN EUROPE
Denmark
Finland
Germany
Iceland
Lichtenstein
Netherlands
Norway
Sweden
CENTRAL EUROPE
Austria
Bulgaria
Croatia
Czech Republic
Estonia
Hungary
Kazakhstan
Latvia
Lithuania
Poland
Romania
Russia
Serbia
Slovakia
Slovenia
ASIA PACIFIC
Australia
Bangladesh
Brunei
China
Hong Kong
India
Indonesia
Japan
Malaysia
New Zealand
Pakistan
Philippines
Singapore
South Korea
Taiwan
Thailand
Vietnam
MEDITERRANEAN AND AFRICA
Albania
Algeria
Bahrain
Benin
Burkina Faso
Cameroon
Chad
Cyprus
Djibouti
Egypt
Gabon
Gambia
Ghana
Greece
Guinea
Israel
Italy
Ivory Coast
Jordan
Kuwait
Lebanon
Libya
Mali
Malta
Mauritania
Morocco
Niger
Nigeria
Portugal
Qatar
Senegal
South Africa
Saudi Arabia
Spain
Tunisia
Turkey
Uganda
United Arab Emirates
Yemen
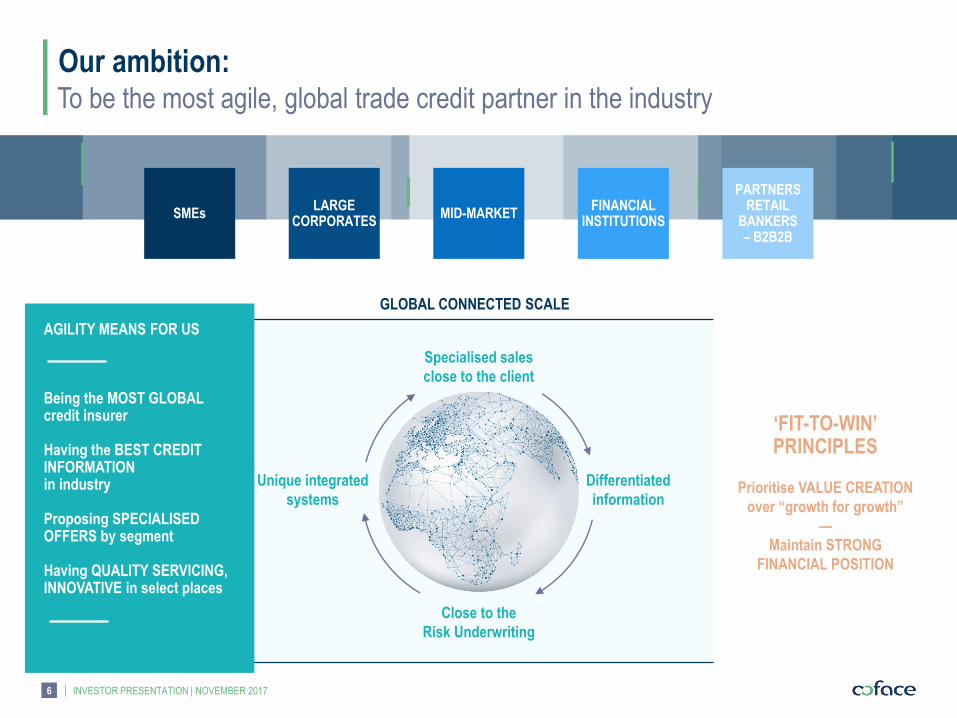
GLOBAL CONNECTED SCALE
Our ambition:
INVESTOR PRESENTATION | NOVEMBER 2017 6
To be the most agile, global trade credit partner in the industry
Specialised sales
close to the client
Close to the
Risk Underwriting
Differentiated
information
Unique integrated
systems
AGILITY MEANS FOR US Being the MOST GLOBAL credit insurer Having the BEST CREDIT INFORMATION in industry Proposing SPECIALISED OFFERS by segment Having QUALITY SERVICING, INNOVATIVE in select places
‘FIT-TO-WIN’ PRINCIPLES
Prioritise VALUE CREATION
over “growth for growth”
—
Maintain STRONG
FINANCIAL POSITION
PARTNERS RETAIL
BANKERS – B2B2B
SMEs MID-MARKET LARGE
CORPORATES FINANCIAL
INSTITUTIONS

INVESTOR PRESENTATION | NOVEMBER 2017 7
Generating attractive sustainable returns and maintain solid financial position
Our value proposition:
CAPITAL OPTIMIZATION TRANSFORMATION
LEVERS OF SHAREHOLDER VALUE CREATION
STRENGTHEN
RISK MANAGEMENT
& INFORMATION —
Bring infrastructure
into coherence
with risk reality
IMPROVE
OPERATIONAL
EFFICIENCY
& CLIENT SERVICE —
Enhance back office
and system capabilities
for client benefit
IMPROVE THE CAPITAL EFFICIENCY OF THE COMPANY —
Leverage reinsurance opportunities
IMPLEMENT
DIFFERENTIATED
GROWTH STRATEGIES —
Capture value from
our Global presence
FIT TO WIN 3-YEAR PLAN IS TARGETING TO POSITION COFACE TO DELIVER ≥ 9% ROATE ACROSS CYCLE
8 INVESTOR PRESENTATION | NOVEMBER 2017
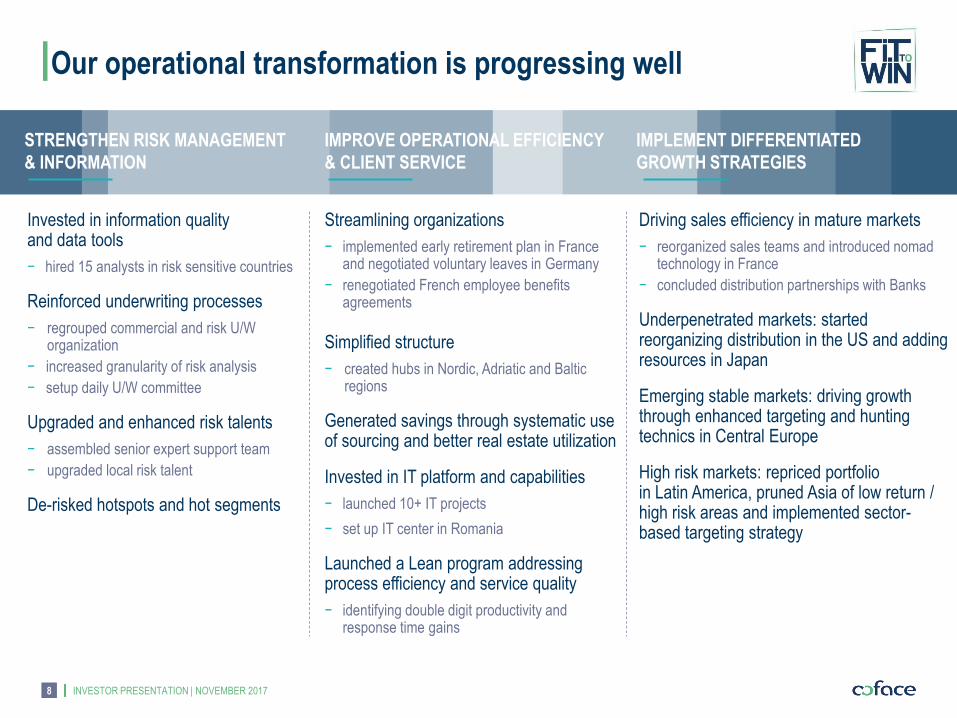
Invested in information quality and data tools
− hired 15 analysts in risk sensitive countries
Reinforced underwriting processes
− regrouped commercial and risk U/W organization
− increased granularity of risk analysis
− setup daily U/W committee
Upgraded and enhanced risk talents
− assembled senior expert support team
− upgraded local risk talent
De-risked hotspots and hot segments
Streamlining organizations
− implemented early retirement plan in France and negotiated voluntary leaves in Germany
− renegotiated French employee benefits agreements
Simplified structure
− created hubs in Nordic, Adriatic and Baltic regions
Generated savings through systematic use of sourcing and better real estate utilization
Invested in IT platform and capabilities
− launched 10+ IT projects
− set up IT center in Romania
Launched a Lean program addressing process efficiency and service quality
− identifying double digit productivity and response time gains
Driving sales efficiency in mature markets
− reorganized sales teams and introduced nomad technology in France
− concluded distribution partnerships with Banks
Underpenetrated markets: started reorganizing distribution in the US and adding resources in Japan
Emerging stable markets: driving growth through enhanced targeting and hunting technics in Central Europe
High risk markets: repriced portfolio in Latin America, pruned Asia of low return / high risk areas and implemented sector-based targeting strategy
Our operational transformation is progressing well
STRENGTHEN RISK MANAGEMENT
& INFORMATION
IMPROVE OPERATIONAL EFFICIENCY
& CLIENT SERVICE
IMPLEMENT DIFFERENTIATED
GROWTH STRATEGIES
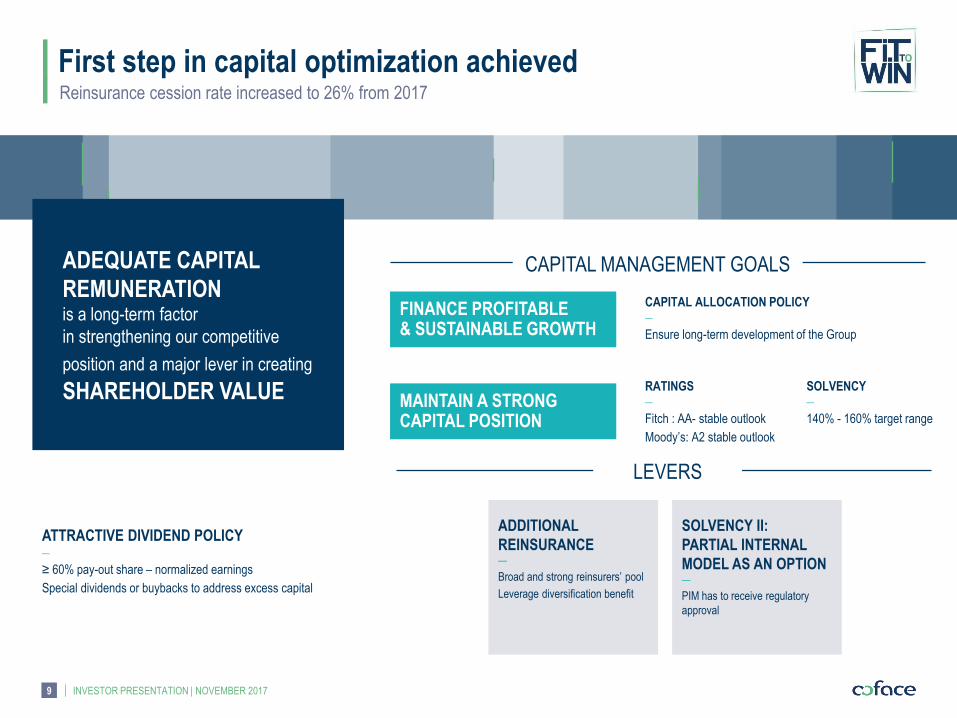
First step in capital optimization achieved
INVESTOR PRESENTATION | NOVEMBER 2017 9
Reinsurance cession rate increased to 26% from 2017
CAPITAL MANAGEMENT GOALS
MAINTAIN A STRONG CAPITAL POSITION
FINANCE PROFITABLE & SUSTAINABLE GROWTH
ADEQUATE CAPITAL
REMUNERATION is a long-term factor
in strengthening our competitive
position and a major lever in creating
SHAREHOLDER VALUE
ATTRACTIVE DIVIDEND POLICY —
≥ 60% pay-out share – normalized earnings
Special dividends or buybacks to address excess capital
LEVERS
RATINGS —
Fitch : AA- stable outlook
Moody’s: A2 stable outlook
SOLVENCY —
140% - 160% target range
ADDITIONAL
REINSURANCE —
Broad and strong reinsurers’ pool
Leverage diversification benefit
SOLVENCY II:
PARTIAL INTERNAL
MODEL AS AN OPTION —
PIM has to receive regulatory
approval
CAPITAL ALLOCATION POLICY —
Ensure long-term development of the Group
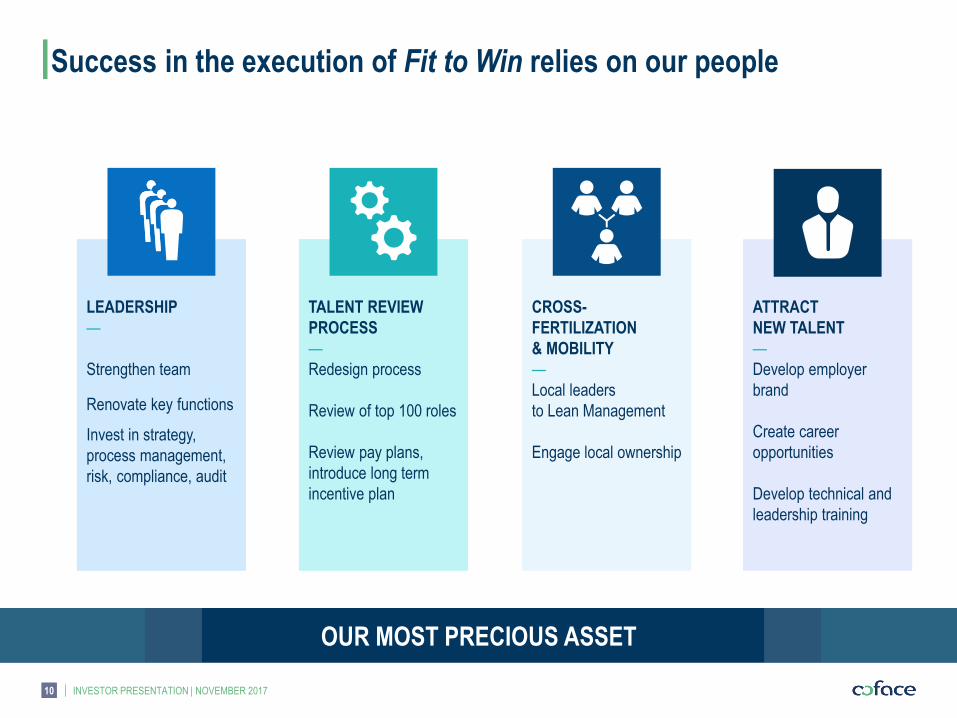
Success in the execution of Fit to Win relies on our people
INVESTOR PRESENTATION | NOVEMBER 2017 10
TALENT REVIEW
PROCESS
—
Redesign process
Review of top 100 roles
Review pay plans,
introduce long term
incentive plan
CROSS-
FERTILIZATION
& MOBILITY
—
Local leaders
to Lean Management
Engage local ownership
ATTRACT
NEW TALENT
—
Develop employer
brand
Create career
opportunities
Develop technical and
leadership training
LEADERSHIP
—
Strengthen team
Renovate key functions
Invest in strategy,
process management,
risk, compliance, audit
OUR MOST PRECIOUS ASSET
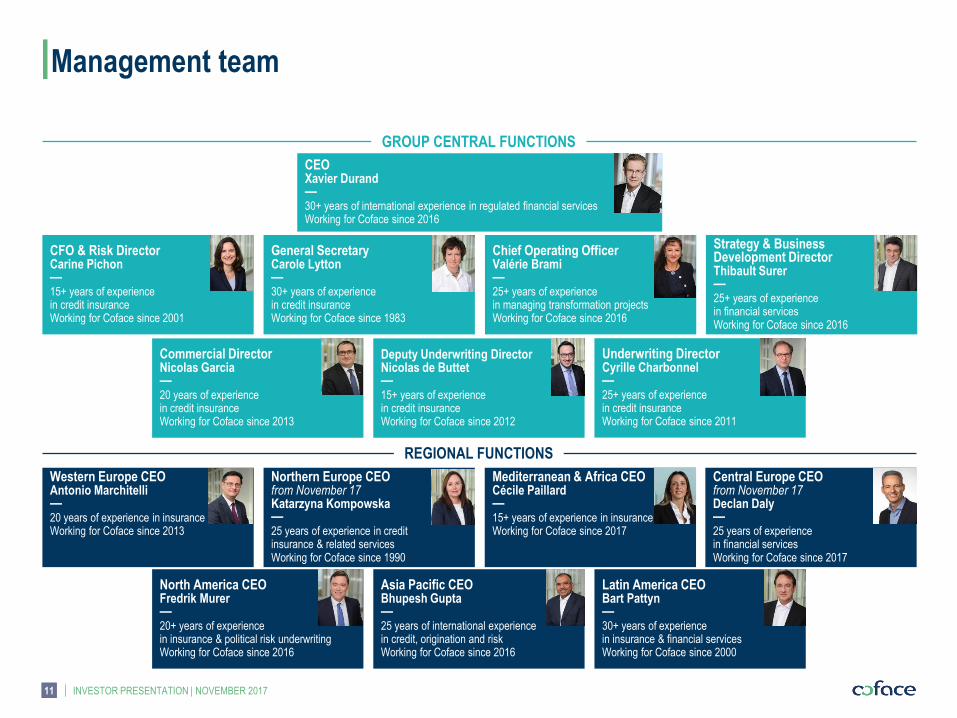
Management team
INVESTOR PRESENTATION | NOVEMBER 2017 11
GROUP CENTRAL FUNCTIONS
Latin America CEO Bart Pattyn — 30+ years of experience in insurance & financial services Working for Coface since 2000
REGIONAL FUNCTIONS
Chief Operating Officer Valérie Brami — 25+ years of experience in managing transformation projects Working for Coface since 2016
Strategy & Business Development Director Thibault Surer — 25+ years of experience in financial services Working for Coface since 2016
Mediterranean & Africa CEO Cécile Paillard — 15+ years of experience in insurance Working for Coface since 2017
Asia Pacific CEO Bhupesh Gupta — 25 years of international experience in credit, origination and risk Working for Coface since 2016
North America CEO Fredrik Murer — 20+ years of experience in insurance & political risk underwriting Working for Coface since 2016
Western Europe CEO Antonio Marchitelli — 20 years of experience in insurance Working for Coface since 2013
CEO Xavier Durand — 30+ years of international experience in regulated financial services Working for Coface since 2016
CFO & Risk Director Carine Pichon — 15+ years of experience in credit insurance Working for Coface since 2001
General Secretary Carole Lytton — 30+ years of experience in credit insurance Working for Coface since 1983
Commercial Director Nicolas Garcia — 20 years of experience in credit insurance Working for Coface since 2013
Deputy Underwriting Director Nicolas de Buttet — 15+ years of experience in credit insurance Working for Coface since 2012
Underwriting Director Cyrille Charbonnel — 25+ years of experience in credit insurance Working for Coface since 2011
Northern Europe CEO from November 17 Katarzyna Kompowska — 25 years of experience in credit insurance & related services Working for Coface since 1990
Central Europe CEO from November 17 Declan Daly — 25 years of experience in financial services Working for Coface since 2017
12 INVESTOR PRESENTATION | NOVEMBER 2017
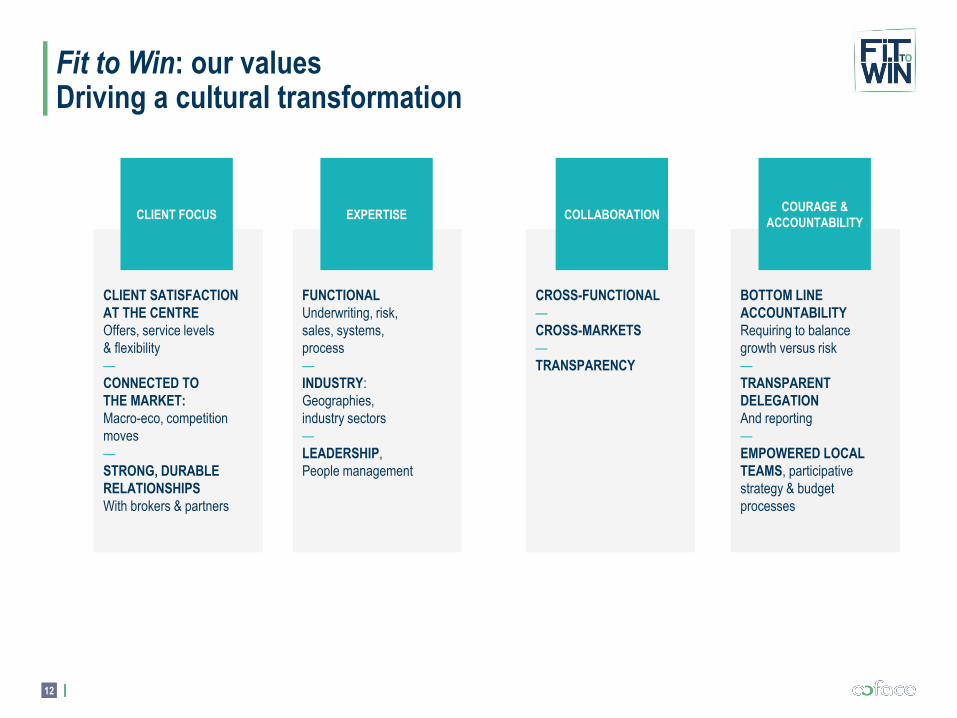
CLIENT SATISFACTION
AT THE CENTRE
Offers, service levels
& flexibility
—
CONNECTED TO
THE MARKET:
Macro-eco, competition
moves
—
STRONG, DURABLE
RELATIONSHIPS
With brokers & partners
CLIENT FOCUS
BOTTOM LINE
ACCOUNTABILITY
Requiring to balance
growth versus risk
—
TRANSPARENT
DELEGATION
And reporting
—
EMPOWERED LOCAL
TEAMS, participative
strategy & budget
processes
COURAGE &
ACCOUNTABILITY
CROSS-FUNCTIONAL
—
CROSS-MARKETS
—
TRANSPARENCY
COLLABORATION
FUNCTIONAL
Underwriting, risk,
sales, systems,
process
—
INDUSTRY:
Geographies,
industry sectors
—
LEADERSHIP,
People management
EXPERTISE
Fit to Win: our values Driving a cultural transformation
INVESTOR PRESENTATION | NOVEMBER 2017 13
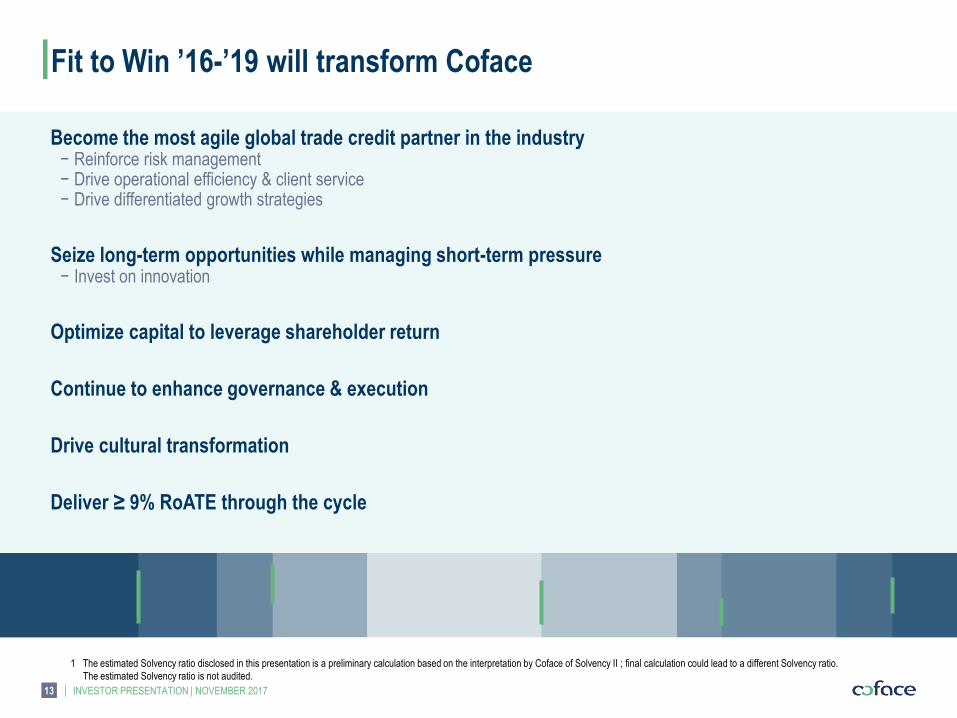
Become the most agile global trade credit partner in the industry − Reinforce risk management − Drive operational efficiency & client service − Drive differentiated growth strategies
Seize long-term opportunities while managing short-term pressure − Invest on innovation
Optimize capital to leverage shareholder return
Continue to enhance governance & execution
Drive cultural transformation
Deliver ≥ 9% RoATE through the cycle
Fit to Win ’16-’19 will transform Coface
1 The estimated Solvency ratio disclosed in this presentation is a preliminary calculation based on the interpretation by Coface of Solvency II ; final calculation could lead to a different Solvency ratio.
The estimated Solvency ratio is not audited.

PART 2 PERFORMANCE & SOLVENCY

INVESTOR PRESENTATION | NOVEMBER 2017
Turnover reaches €1,021.2m, down (0.3)% at constant FX and perimeter1; Q3-2017 up 0.2% y-o-y − Mature markets continue to grow at +2.2%; trends in emerging markets remain unchanged
− Favorable economic environment drives client activity; but with higher premium refunds
Net loss ratio at 54.4%, net combined ratio at 89.8% − Loss ratio at 46.3% shows improvement in Q3-2017, driven by Asia & North America
− Net cost ratio at 35.4% (34.5% ex. one-off in Italy in Q2)
Net income (group share) at €55.0m, of which €34.8m in Q3
Effects of Fit to Win actions now visible; confirming strategic targets − Achieved €12m cost savings to date, ahead of schedule; confirming €30m goal in 2018
− Confirming €30m total investment for the 2017-2019 period:
Expecting lower restructuring expenses than planned
Investing to accelerate digital transformation
9M-2017 highlights
€55.0m year-to-date net profit, driven by loss ratio improvement
15
1 Constant perimeter = Ex. SEGM (excluding State Export Guarantees Management ) : €40.1m revenue in 9M-2016. Coface ceded this activity as from January 1st, 2017.
2016 figures impacted by this activity have been restated so as to be comparable to 2017.
INVESTOR PRESENTATION | NOVEMBER 2017 16
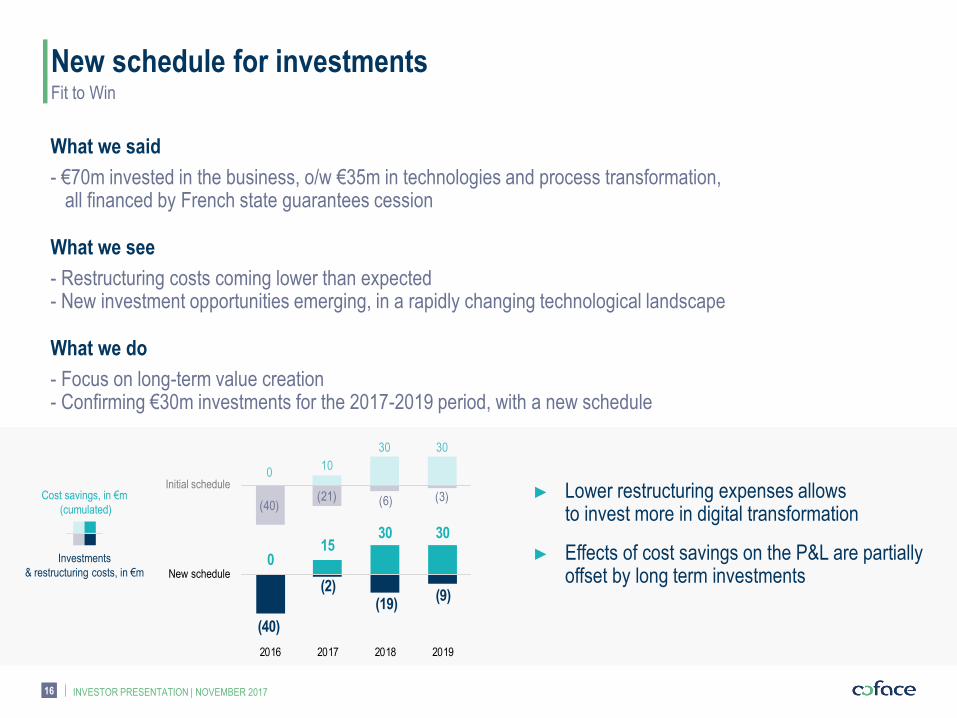
What we said
- €70m invested in the business, o/w €35m in technologies and process transformation, all financed by French state guarantees cession
What we see
- Restructuring costs coming lower than expected - New investment opportunities emerging, in a rapidly changing technological landscape
What we do
- Focus on long-term value creation - Confirming €30m investments for the 2017-2019 period, with a new schedule
Fit to Win
New schedule for investments
Cost savings, in €m
(cumulated)
► Lower restructuring expenses allows to invest more in digital transformation
► Effects of cost savings on the P&L are partially offset by long term investments
010
30 30
(40)(21) (6) (3)
015
30 30
(40)
(2)(19)
(9)
2016 2017 2018 2019
Initial schedule
New schedule
Investments
& restructuring costs, in €m
INVESTOR PRESENTATION | NOVEMBER 2017
Revenue growing in Q3-17, helped by client activity
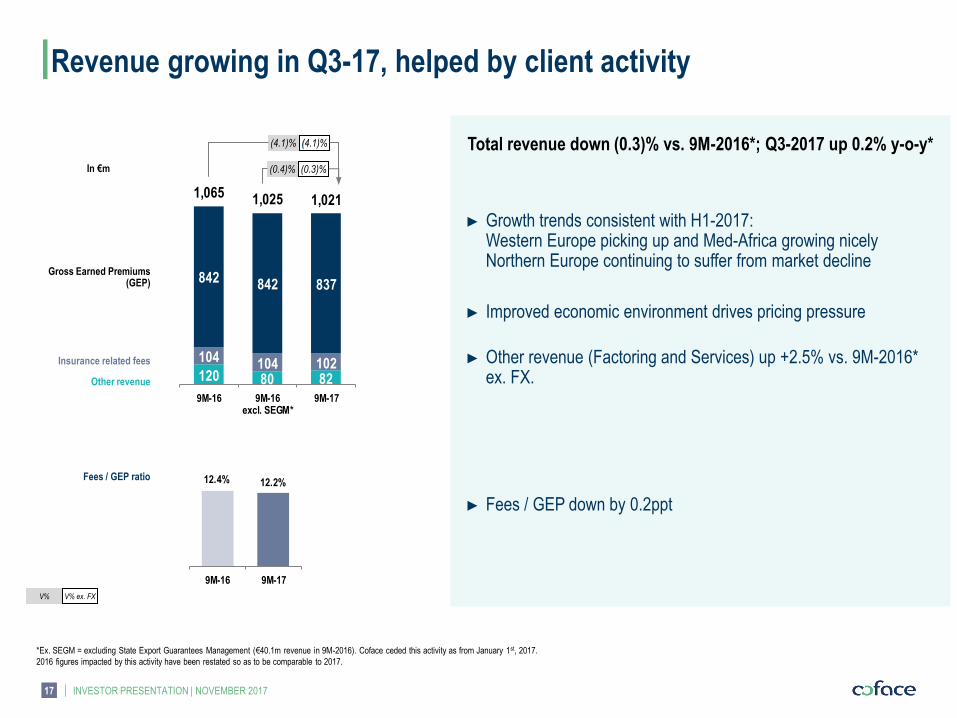
Total revenue down (0.3)% vs. 9M-2016*; Q3-2017 up 0.2% y-o-y*
► Growth trends consistent with H1-2017: Western Europe picking up and Med-Africa growing nicely Northern Europe continuing to suffer from market decline
► Improved economic environment drives pricing pressure
► Other revenue (Factoring and Services) up +2.5% vs. 9M-2016* ex. FX.
► Fees / GEP down by 0.2ppt
(0.3)% (0.4)%
(4.1)% (4.1)%
Gross Earned Premiums (GEP)
Insurance related fees
Other revenue
In €m
V% V% ex. FX
Fees / GEP ratio
*Ex. SEGM = excluding State Export Guarantees Management (€40.1m revenue in 9M-2016). Coface ceded this activity as from January 1st, 2017.
2016 figures impacted by this activity have been restated so as to be comparable to 2017.
17
120 80 82
104 104 102
842 842 837
1,065 1,025 1,021
9M-16 9M-16excl. SEGM*
9M-17
12.4% 12.2%
9M-16 9M-17
INVESTOR PRESENTATION | NOVEMBER 2017
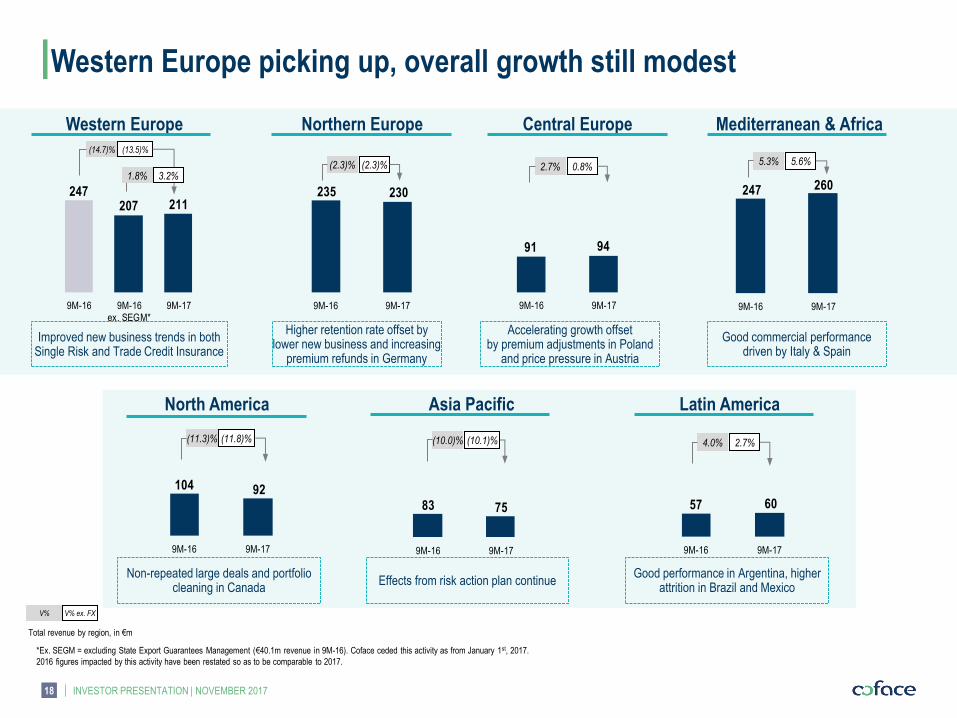
Western Europe picking up, overall growth still modest
Western Europe Northern Europe Central Europe Mediterranean & Africa
North America
Total revenue by region, in €m
Asia Pacific Latin America
Improved new business trends in both Single Risk and Trade Credit Insurance
Good commercial performance driven by Italy & Spain
Accelerating growth offset by premium adjustments in Poland
and price pressure in Austria
Non-repeated large deals and portfolio cleaning in Canada
Effects from risk action plan continue Good performance in Argentina, higher
attrition in Brazil and Mexico
Higher retention rate offset by lower new business and increasing
premium refunds in Germany
V% V% ex. FX
18
*Ex. SEGM = excluding State Export Guarantees Management (€40.1m revenue in 9M-16). Coface ceded this activity as from January 1st, 2017.
2016 figures impacted by this activity have been restated so as to be comparable to 2017.
247207 211
9M-16 9M-16ex. SEGM*
9M-17
(13.5)% (14.7)%
3.2% 1.8%
235 230
9M-16 9M-17
91 94
9M-16 9M-17
247 260
9M-16 9M-17
(2.3)% (2.3)% 0.8% 2.7% 5.6% 5.3%
104 92
9M-16 9M-17
57 60
9M-16 9M-17
83 75
9M-16 9M-17
(11.8)% (11.3)% (10.1)% (10.0)% 2.7% 4.0%
INVESTOR PRESENTATION | NOVEMBER 2017
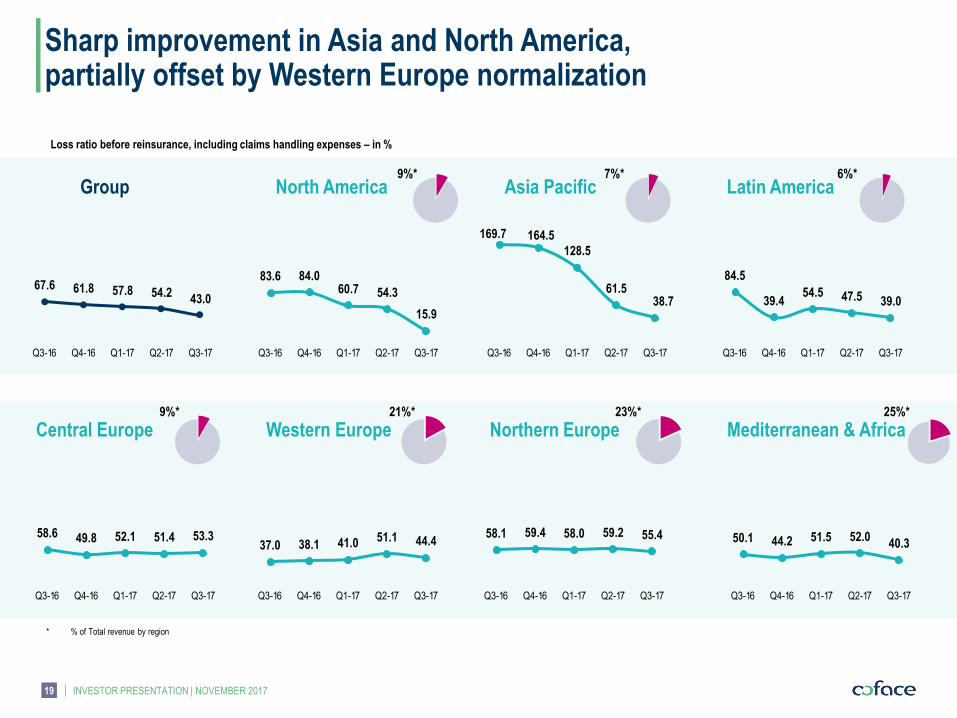
Sharp improvement in Asia and North America, partially offset by Western Europe normalization
Group
* % of Total revenue by region
North America Asia Pacific Latin America
Central Europe Western Europe Northern Europe Mediterranean & Africa
9%* 7%* 6%*
9%* 21%* 23%* 25%*
Loss ratio before reinsurance, including claims handling expenses – in %
19
67.6 61.8 57.8 54.243.0
Q3-16 Q4-16 Q1-17 Q2-17 Q3-17
83.6 84.060.7 54.3
15.9
Q3-16 Q4-16 Q1-17 Q2-17 Q3-17
169.7 164.5
128.5
61.538.7
Q3-16 Q4-16 Q1-17 Q2-17 Q3-17
84.5
39.454.5 47.5 39.0
Q3-16 Q4-16 Q1-17 Q2-17 Q3-17
58.6 49.8 52.1 51.4 53.3
Q3-16 Q4-16 Q1-17 Q2-17 Q3-17
37.0 38.1 41.0 51.1 44.4
Q3-16 Q4-16 Q1-17 Q2-17 Q3-17
58.1 59.4 58.0 59.2 55.4
Q3-16 Q4-16 Q1-17 Q2-17 Q3-17
50.1 44.2 51.5 52.040.3
Q3-16 Q4-16 Q1-17 Q2-17 Q3-17
INVESTOR PRESENTATION | NOVEMBER 2017
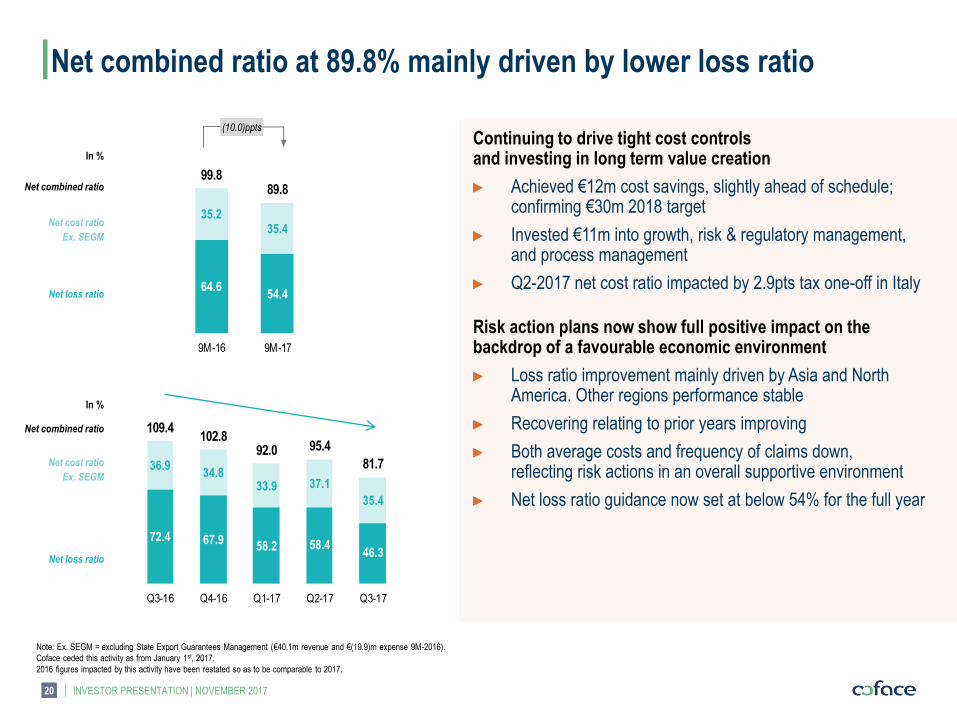
Net combined ratio at 89.8% mainly driven by lower loss ratio
(10.0)ppts
Net cost ratio
Ex. SEGM
Net loss ratio
Net combined ratio
Net cost ratio
Ex. SEGM
Net loss ratio
Net combined ratio
In %
In %
20
Note: Ex. SEGM = excluding State Export Guarantees Management (€40.1m revenue and €(19.9)m expense 9M-2016).
Coface ceded this activity as from January 1st, 2017.
2016 figures impacted by this activity have been restated so as to be comparable to 2017.
1
64.654.4
35.235.4
99.889.8
9M-16 9M-17
72.4 67.958.2 58.4
46.3
36.934.8
33.9 37.1
35.4
109.4102.8
92.0 95.4
81.7
Q3-16 Q4-16 Q1-17 Q2-17 Q3-17
Continuing to drive tight cost controls and investing in long term value creation
► Achieved €12m cost savings, slightly ahead of schedule; confirming €30m 2018 target
► Invested €11m into growth, risk & regulatory management, and process management
► Q2-2017 net cost ratio impacted by 2.9pts tax one-off in Italy
Risk action plans now show full positive impact on the backdrop of a favourable economic environment
► Loss ratio improvement mainly driven by Asia and North America. Other regions performance stable
► Recovering relating to prior years improving
► Both average costs and frequency of claims down, reflecting risk actions in an overall supportive environment
► Net loss ratio guidance now set at below 54% for the full year
INVESTOR PRESENTATION | NOVEMBER 2017
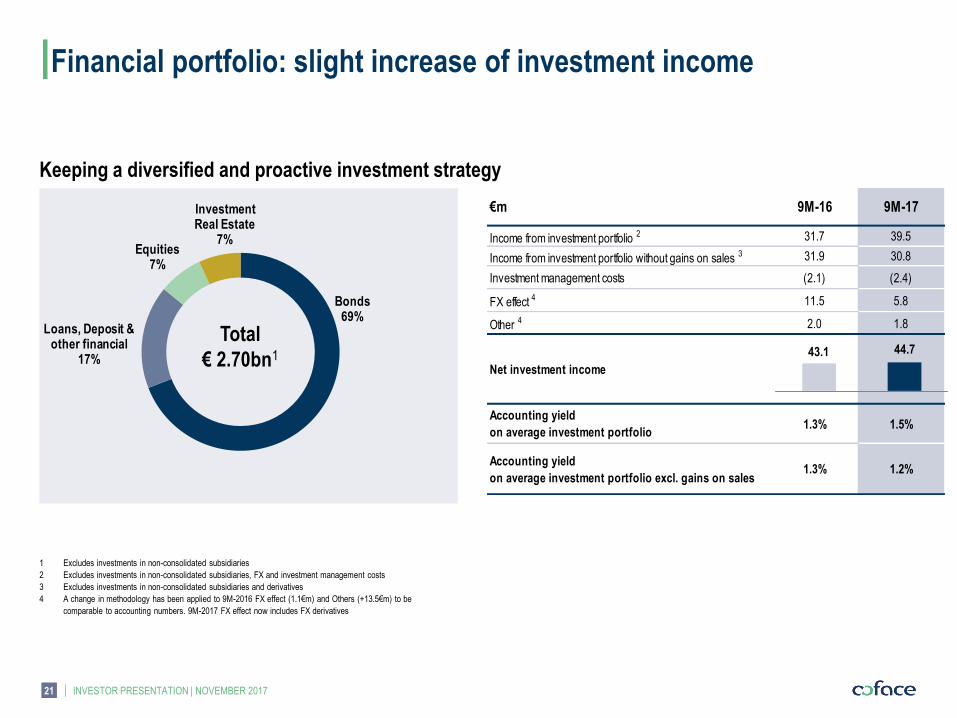
1 Excludes investments in non-consolidated subsidiaries
2 Excludes investments in non-consolidated subsidiaries, FX and investment management costs
3 Excludes investments in non-consolidated subsidiaries and derivatives
4 A change in methodology has been applied to 9M-2016 FX effect (1.1€m) and Others (+13.5€m) to be
comparable to accounting numbers. 9M-2017 FX effect now includes FX derivatives
Keeping a diversified and proactive investment strategy
Financial portfolio: slight increase of investment income
21
Bonds69%
Loans, Deposit & other financial
17%
Equities7%
Investment Real Estate
7%
Total
€ 2.70bn1
€m 9M-16 9M-17
Income from investment portfolio 2 31.7 39.5
Income from investment portfolio without gains on sales 3 31.9 30.8
Investment management costs (2.1) (2.4)
FX effect 4 11.5 5.8
Other 4 2.0 1.8
Net investment income 43.1 44.7
Accounting yield
on average investment portfolio1.3% 1.5%
Accounting yield
on average investment portfolio excl. gains on sales1.3% 1.2%
43.1 44.7
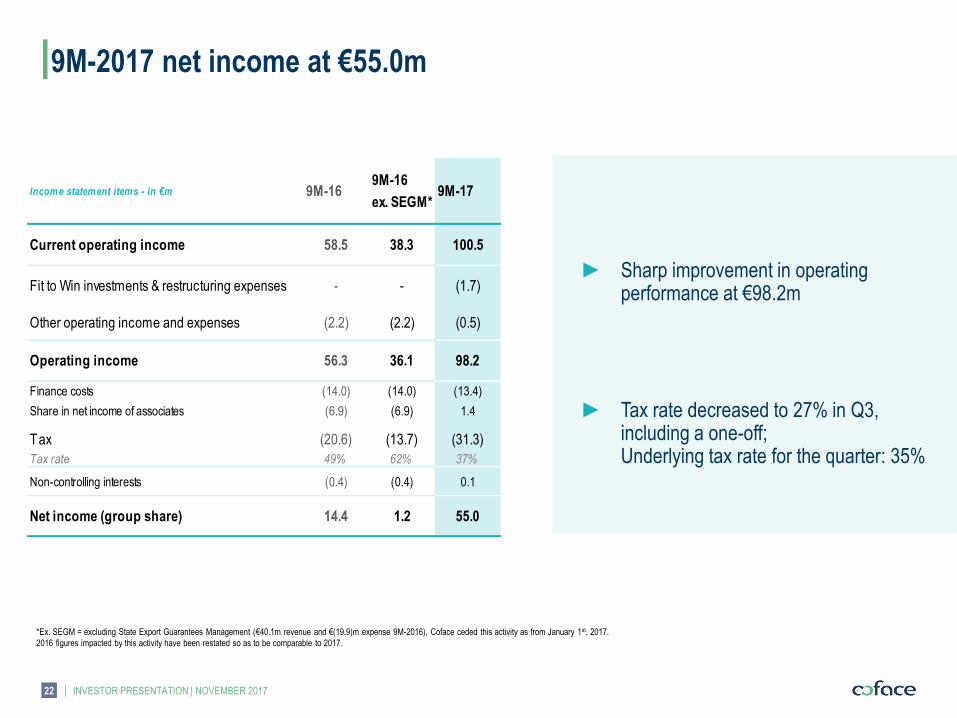
9M-2017 net income at €55.0m
INVESTOR PRESENTATION | NOVEMBER 2017
*Ex. SEGM = excluding State Export Guarantees Management (€40.1m revenue and €(19.9)m expense 9M-2016). Coface ceded this activity as from January 1st, 2017.
2016 figures impacted by this activity have been restated so as to be comparable to 2017.
22
Income statement items - in €m 9M-169M-16
ex. SEGM*9M-17
Current operating income 58.5 38.3 100.5
Fit to Win investments & restructuring expenses - - (1.7)
Other operating income and expenses (2.2) (2.2) (0.5)
Operating income 56.3 36.1 98.2
Finance costs (14.0) (14.0) (13.4)
Share in net income of associates (6.9) (6.9) 1.4
Tax (20.6) (13.7) (31.3)
Tax rate 49% 62% 37%
Non-controlling interests (0.4) (0.4) 0.1
Net income (group share) 14.4 1.2 55.0
► Sharp improvement in operating performance at €98.2m
► Tax rate decreased to 27% in Q3, including a one-off; Underlying tax rate for the quarter: 35%
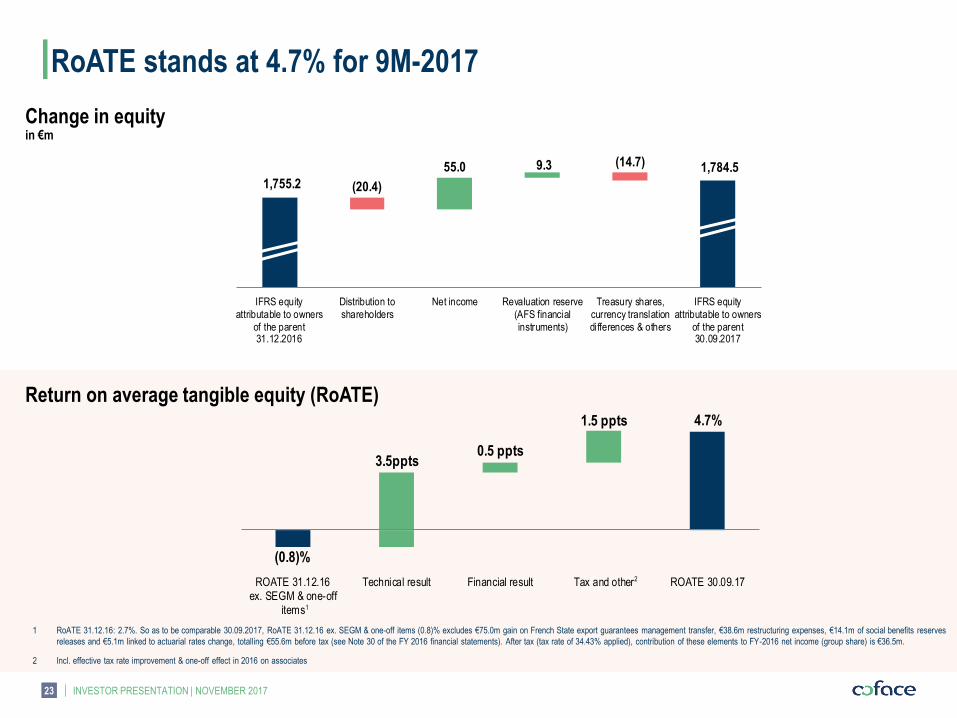
RoATE stands at 4.7% for 9M-2017
INVESTOR PRESENTATION | NOVEMBER 2017
Change in equity in €m
1 RoATE 31.12.16: 2.7%. So as to be comparable 30.09.2017, RoATE 31.12.16 ex. SEGM & one-off items (0.8)% excludes €75.0m gain on French State export guarantees management transfer, €38.6m restructuring expenses, €14.1m of social benefits reserves
releases and €5.1m linked to actuarial rates change, totalling €55.6m before tax (see Note 30 of the FY 2016 financial statements). After tax (tax rate of 34.43% applied), contribution of these elements to FY-2016 net income (group share) is €36.5m.
2 Incl. effective tax rate improvement & one-off effect in 2016 on associates
23
1,784.5
(20.4)
(14.7)
1,755.2
55.0 9.3
IFRS equityattributable to owners
of the parent31.12.2016
Distribution toshareholders
Net income Revaluation reserve(AFS financialinstruments)
Treasury shares,currency translationdifferences & others
IFRS equityattributable to owners
of the parent30.09.2017
1
2
Return on average tangible equity (RoATE)
(0.8)%
4.7%
3.5ppts0.5 ppts
1.5 ppts
ROATE 31.12.16ex. SEGM & one-off
items
Technical result Financial result Tax and other ROATE 30.09.17
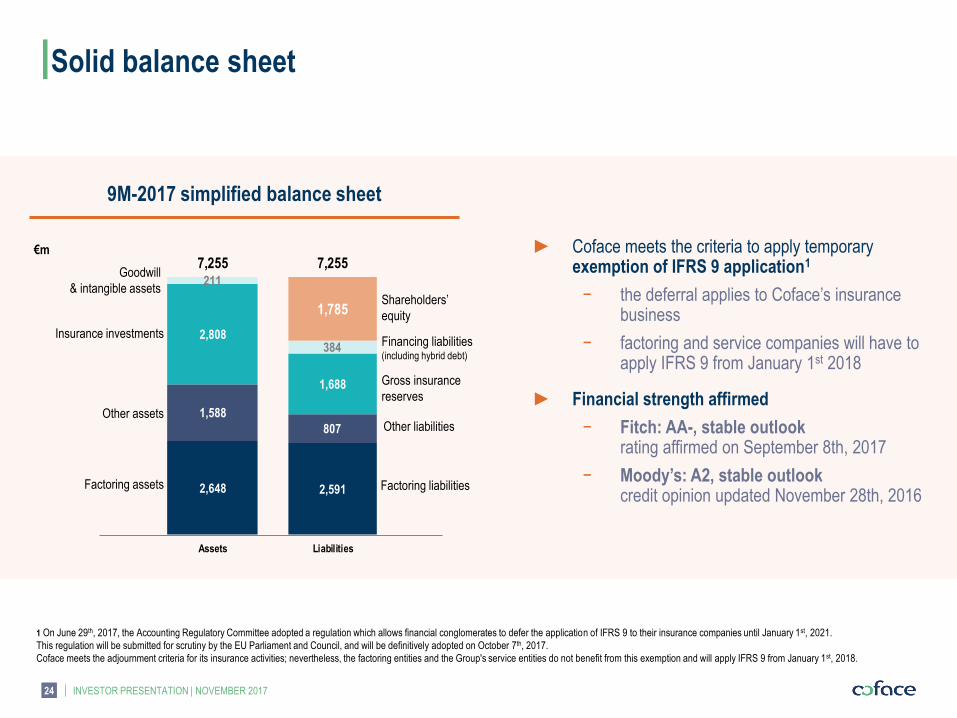
Solid balance sheet
9M-2017 simplified balance sheet
€m
Factoring assets Factoring liabilities
Gross insurance
reserves
Insurance investments
Goodwill
& intangible assets
Other liabilities
Shareholders’
equity
Other assets
Financing liabilities (including hybrid debt)
INVESTOR PRESENTATION | NOVEMBER 2017
► Coface meets the criteria to apply temporary exemption of IFRS 9 application1
− the deferral applies to Coface’s insurance business
− factoring and service companies will have to apply IFRS 9 from January 1st 2018
► Financial strength affirmed
− Fitch: AA-, stable outlook rating affirmed on September 8th, 2017
− Moody’s: A2, stable outlook credit opinion updated November 28th, 2016
24
1 On June 29th, 2017, the Accounting Regulatory Committee adopted a regulation which allows financial conglomerates to defer the application of IFRS 9 to their insurance companies until January 1st, 2021.
This regulation will be submitted for scrutiny by the EU Parliament and Council, and will be definitively adopted on October 7th, 2017.
Coface meets the adjournment criteria for its insurance activities; nevertheless, the factoring entities and the Group's service entities do not benefit from this exemption and will apply IFRS 9 from January 1st, 2018.
2,648
1,588
2,808
211
7,255
Assets
2,591
807
1,688
384
1,785
7,255
Liabilities

Robust solvency over time
INVESTOR PRESENTATION | NOVEMBER 2017 25
120%
160%
140%
H1-2017 148%
Estimated Solvency ratio in target range
► Estimated Solvency ratio in the comfort range
► Insurance SCR stable
► Higher factoring required capital due to increase of outstanding
receivables and higher regulatory minimum ratio (9.25% vs.9%)
The estimated Solvency ratio disclosed in this presentation is a preliminary calculation based on the interpretation by Coface of Solvency II ; final calculation could result in a different Solvency ratio.
The estimated Solvency ratio is not audited.
Low sensitivity to market shocks market sensitivity tested through instantaneous shocks
Solvency requirement respected in crisis scenarios
150%148%
(0.2) ppt (3.1) ppt+1.6 ppt
31/12/2016 InsuranceSCR variation
FactoringSCR variation
Own Fundsvariation
30/06/2017 Coface comfort scale
145%
144%
143%
148%
- 25% stock markets
+100 bps Spreads
+100 bps Interest rates
30/06/17 SCR cover (Std)
127%
111%
1/20 crisis equivalent
2008 crisis equivalent
1 +100 bps on credit and +50 bps for OECD government debt
2 Based on the level of loss ratio observed during 2008 crisis
3 Based on the level of loss ratio corresponding to 95% quantile
1
114% est. CEL impact 2
3
4
INVESTOR PRESENTATION | NOVEMBER 2017
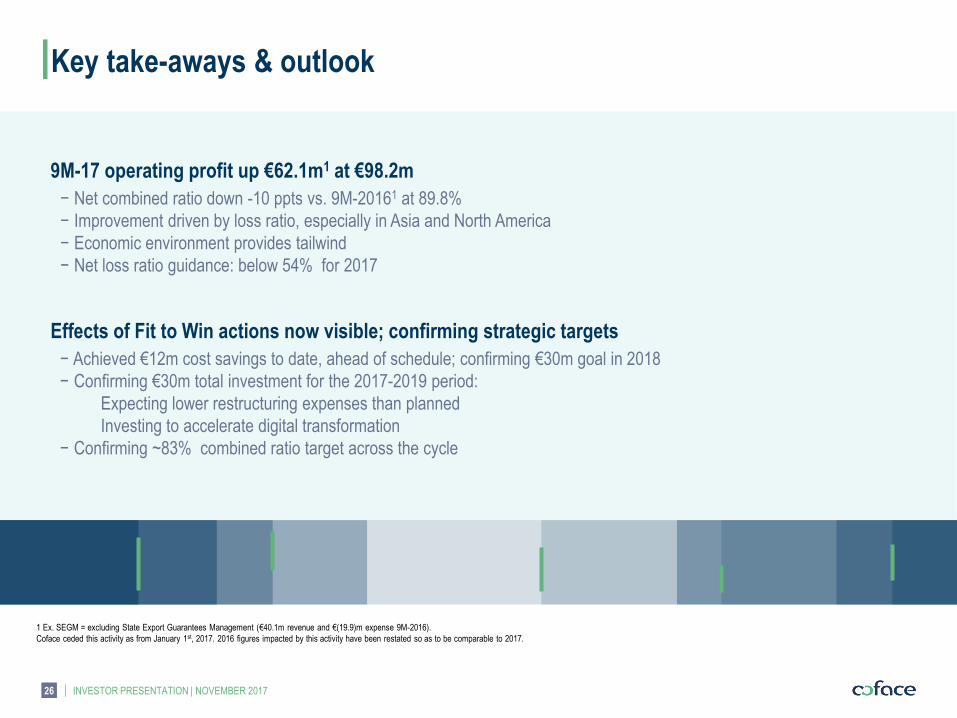
Key take-aways & outlook
9M-17 operating profit up €62.1m1 at €98.2m
− Net combined ratio down -10 ppts vs. 9M-20161 at 89.8%
− Improvement driven by loss ratio, especially in Asia and North America
− Economic environment provides tailwind
− Net loss ratio guidance: below 54% for 2017
Effects of Fit to Win actions now visible; confirming strategic targets
− Achieved €12m cost savings to date, ahead of schedule; confirming €30m goal in 2018
− Confirming €30m total investment for the 2017-2019 period:
Expecting lower restructuring expenses than planned
Investing to accelerate digital transformation
− Confirming ~83% combined ratio target across the cycle
26
1 Ex. SEGM = excluding State Export Guarantees Management (€40.1m revenue and €(19.9)m expense 9M-2016).
Coface ceded this activity as from January 1st, 2017. 2016 figures impacted by this activity have been restated so as to be comparable to 2017.
APPENDICES
28 INVESTOR PRESENTATION | NOVEMBER 2017
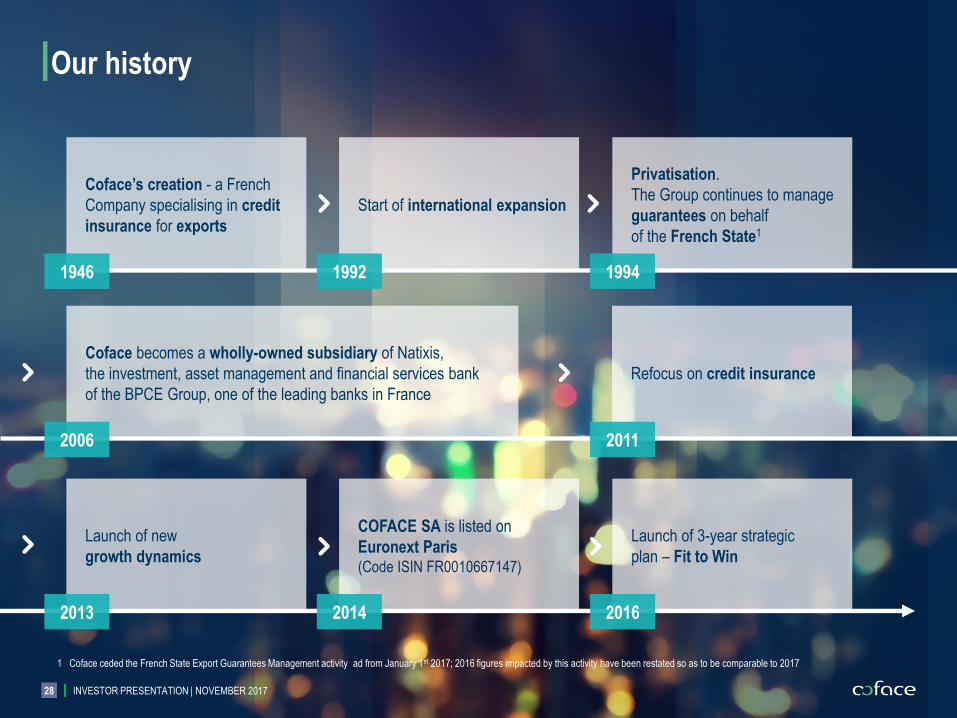
Our history
Coface becomes a wholly-owned subsidiary of Natixis,
the investment, asset management and financial services bank
of the BPCE Group, one of the leading banks in France
Coface’s creation - a French
Company specialising in credit
insurance for exports
Start of international expansion
Privatisation.
The Group continues to manage
guarantees on behalf
of the French State1
Refocus on credit insurance
Launch of new
growth dynamics
COFACE SA is listed on
Euronext Paris (Code ISIN FR0010667147)
Launch of 3-year strategic
plan – Fit to Win
1946 1992 1994
2006 2011
2013 2014 2016
1 Coface ceded the French State Export Guarantees Management activity ad from January 1st 2017; 2016 figures impacted by this activity have been restated so as to be comparable to 2017

29 INVESTOR PRESENTATION | NOVEMBER 2017
How does credit insurance work?
IN THE EVENT OF A NON-PAYMENT, THE CREDIT INSURER PAYS COMPENSATION UP TO THE GUARANTEED PORTION
OF THE OUTSTANDING RECEIVABLE (GENERALLY 90%) AND INITIATES A PROCEDURE FOR THE RECOVERY OF 100% OF THE CLAIM
CREDIT INSURANCE enables a business to protect its trade receivables against the risk of customer non-payment
CREDIT
INSURER
Pays a
premium
90% If B defaults, Credit
insurer compensates
A for up to 90%
of the loss sustained
COMPANY A
INSURED PARTY
Seller/supplier
Sells products or services
and accepts to be paid
in 30, 60 or 90 days.
It grants A TRADE RECEIVABLE COMPANY B
Buyer/customer
Buys goods or services
and pays in 30, 60 or 90 days.
It incurs A TRADE PAYABLE
Rates company B
to evaluate its soundness
30 INVESTOR PRESENTATION | NOVEMBER 2017
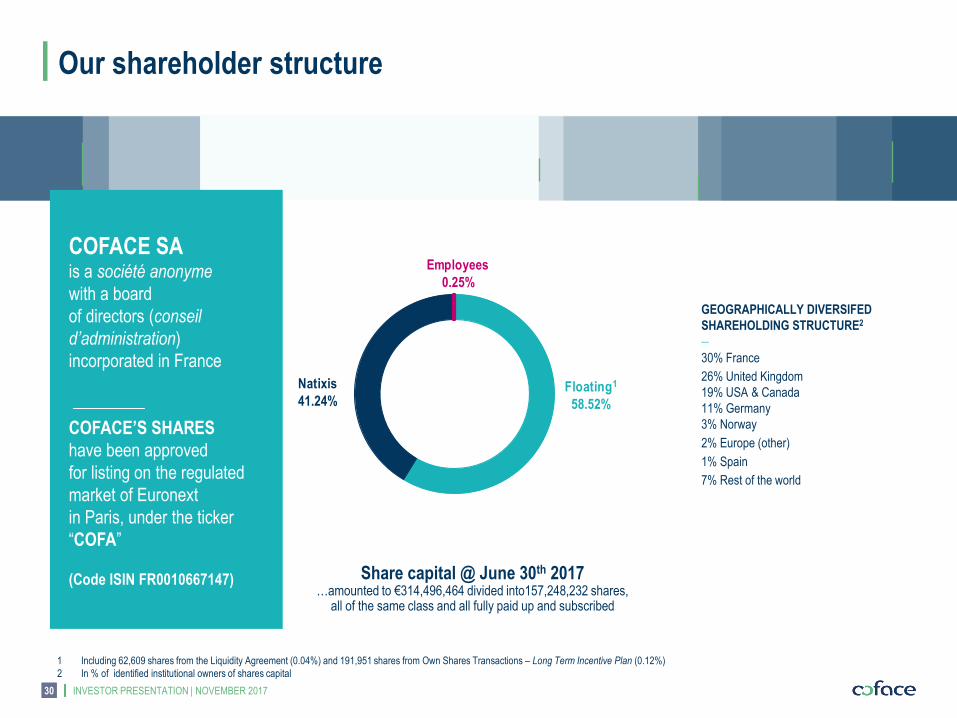
Our shareholder structure
Share capital @ June 30th 2017 …amounted to €314,496,464 divided into157,248,232 shares,
all of the same class and all fully paid up and subscribed
COFACE SA is a société anonyme
with a board
of directors (conseil
d’administration)
incorporated in France
COFACE’S SHARES
have been approved
for listing on the regulated
market of Euronext
in Paris, under the ticker
“COFA”
(Code ISIN FR0010667147)
Floating1
58.52%
Natixis
41.24%
Employees
0.25%
1 Including 62,609 shares from the Liquidity Agreement (0.04%) and 191,951 shares from Own Shares Transactions – Long Term Incentive Plan (0.12%)
2 In % of identified institutional owners of shares capital
GEOGRAPHICALLY DIVERSIFED
SHAREHOLDING STRUCTURE2
—
30% France
26% United Kingdom
19% USA & Canada
11% Germany
3% Norway
2% Europe (other)
1% Spain
7% Rest of the world
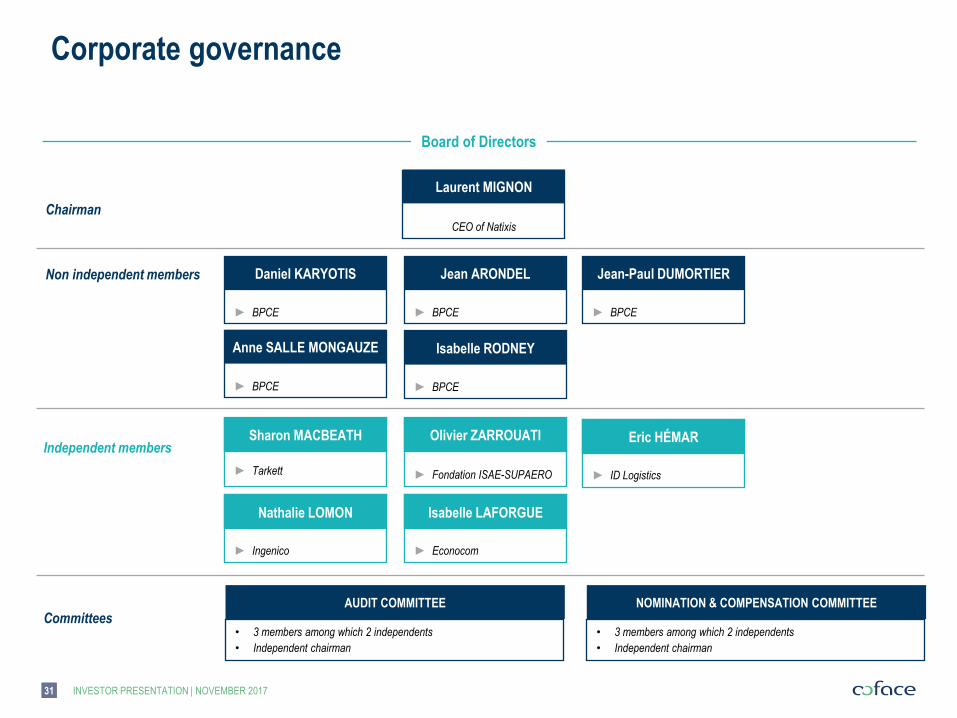
Corporate governance
31
Laurent MIGNON
Chairman
Non independent members Daniel KARYOTIS Jean ARONDEL Jean-Paul DUMORTIER
Isabelle RODNEY Anne SALLE MONGAUZE
Sharon MACBEATH Olivier ZARROUATI Independent members
► BPCE ► BPCE ► BPCE
► BPCE ► BPCE
► Tarkett
► Fondation ISAE-SUPAERO
Eric HÉMAR
► ID Logistics
CEO of Natixis
AUDIT COMMITTEE NOMINATION & COMPENSATION COMMITTEE
• 3 members among which 2 independents
• Independent chairman
• 3 members among which 2 independents
• Independent chairman
Committees
Nathalie LOMON
► Ingenico
Isabelle LAFORGUE
► Econocom
Board of Directors
INVESTOR PRESENTATION | NOVEMBER 2017

INVESTOR PRESENTATION | NOVEMBER 2017
Quarterly figures
Key figures (1/3)
32
DOWNLOAD OUR .XLS FINANCIAL SUPPLEMENT
WWW.COFACE.COM/INVESTORS/FINANCIAL-RESULTS-AND-REPORTS
Income statements items in €m - 2016 figures ex. SEGM* Q1 2016 Q2 2016 Q3 2016 Q4 2016 Q1 2017 Q2 2017 Q3 2017 % % ex. FX
Gross earned premiums 288.5 277.2 275.8 273.6 282.2 283.4 271.6 (1.5)% +0.3%
Services revenue 64.5 60.8 58.5 59.0 66.1 60.0 57.9 (1.1)% (0.6)%
REVENUE 353.0 338.0 334.3 332.7 348.3 343.4 329.4 (1.4)% +0.2%
UNDERWRITING INCOME(LOSS) AFTER REINSURANCE 20.8 (4.1) (21.5) (8.5) 14.5 7.0 34.2 N.S.
Investment income, net of management expenses 10.8 13.8 18.5 4.9 5.6 20.2 18.9 +2.0%
CURRENT OPERATING INCOME 31.6 9.7 (3.0) (3.5) 20.1 27.3 53.1 N.S.
Other operating income / expenses (1.0) (0.8) (0.5) 55.7 (1.0) 0.0 (1.3) N.S.
OPERATING INCOME 30.6 9.0 (3.4) 52.2 19.2 27.3 51.7 N.S.
NET INCOME 18.6 (1.0) (16.4) 23.3 7.3 12.9 34.8 N.S. N.S.
Income statements items in €m - 2016 published Q1 2016 Q2 2016 Q3 2016 Q4 2016 Q1 2017 Q2 2017 Q3 2017 % % ex. FX
Gross earned premiums 288.5 277.2 275.8 273.6 282.2 283.4 271.6 (1.5)% +0.3%
Services revenue 76.5 74.5 72.9 72.3 66.1 60.0 57.9 (21)% (20)%
REVENUE 365.0 351.7 348.7 345.9 348.3 343.4 329.4 (5.5)% (4.0)%
UNDERWRITING INCOME(LOSS) AFTER REINSURANCE 26.5 2.4 (13.5) (2.6) 14.5 7.0 34.2 N.S.
Investment income, net of management expenses 10.8 13.8 18.5 4.9 5.6 20.2 18.9 +2.0%
CURRENT OPERATING INCOME 37.3 16.3 5.0 2.4 20.1 27.3 53.1 N.S.
Other operating income / expenses (1.0) (0.8) (0.5) 55.7 (1.0) 0.0 (1.3) N.S.
OPERATING INCOME 36.3 15.5 4.5 58.1 19.2 27.3 51.7 N.S.
NET INCOME 22.3 3.3 (11.2) 27.1 7.3 12.9 34.8 N.S. N.S.
* excluding State export guarantees management (ex. SEGM). Coface ceded this activity as from January 1st 2017
INVESTOR PRESENTATION | NOVEMBER 2017
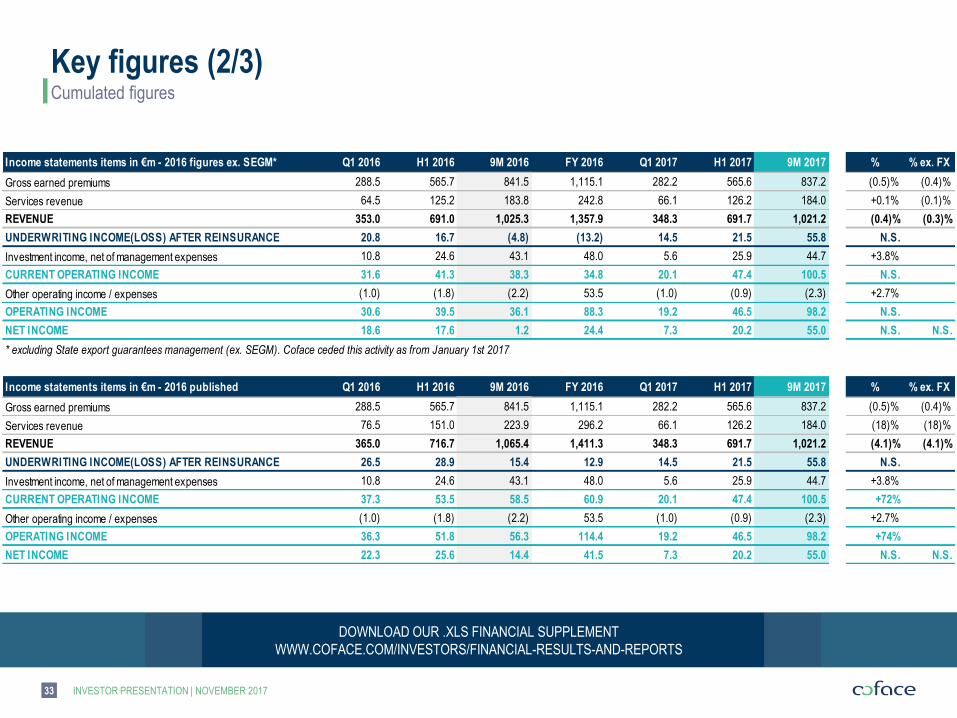
Cumulated figures
Key figures (2/3)
33
DOWNLOAD OUR .XLS FINANCIAL SUPPLEMENT
WWW.COFACE.COM/INVESTORS/FINANCIAL-RESULTS-AND-REPORTS
Income statements items in €m - 2016 figures ex. SEGM* Q1 2016 H1 2016 9M 2016 FY 2016 Q1 2017 H1 2017 9M 2017 % % ex. FX
Gross earned premiums 288.5 565.7 841.5 1,115.1 282.2 565.6 837.2 (0.5)% (0.4)%
Services revenue 64.5 125.2 183.8 242.8 66.1 126.2 184.0 +0.1% (0.1)%
REVENUE 353.0 691.0 1,025.3 1,357.9 348.3 691.7 1,021.2 (0.4)% (0.3)%
UNDERWRITING INCOME(LOSS) AFTER REINSURANCE 20.8 16.7 (4.8) (13.2) 14.5 21.5 55.8 N.S.
Investment income, net of management expenses 10.8 24.6 43.1 48.0 5.6 25.9 44.7 +3.8%
CURRENT OPERATING INCOME 31.6 41.3 38.3 34.8 20.1 47.4 100.5 N.S.
Other operating income / expenses (1.0) (1.8) (2.2) 53.5 (1.0) (0.9) (2.3) +2.7%
OPERATING INCOME 30.6 39.5 36.1 88.3 19.2 46.5 98.2 N.S.
NET INCOME 18.6 17.6 1.2 24.4 7.3 20.2 55.0 N.S. N.S.
Income statements items in €m - 2016 published Q1 2016 H1 2016 9M 2016 FY 2016 Q1 2017 H1 2017 9M 2017 % % ex. FX
Gross earned premiums 288.5 565.7 841.5 1,115.1 282.2 565.6 837.2 (0.5)% (0.4)%
Services revenue 76.5 151.0 223.9 296.2 66.1 126.2 184.0 (18)% (18)%
REVENUE 365.0 716.7 1,065.4 1,411.3 348.3 691.7 1,021.2 (4.1)% (4.1)%
UNDERWRITING INCOME(LOSS) AFTER REINSURANCE 26.5 28.9 15.4 12.9 14.5 21.5 55.8 N.S.
Investment income, net of management expenses 10.8 24.6 43.1 48.0 5.6 25.9 44.7 +3.8%
CURRENT OPERATING INCOME 37.3 53.5 58.5 60.9 20.1 47.4 100.5 +72%
Other operating income / expenses (1.0) (1.8) (2.2) 53.5 (1.0) (0.9) (2.3) +2.7%
OPERATING INCOME 36.3 51.8 56.3 114.4 19.2 46.5 98.2 +74%
NET INCOME 22.3 25.6 14.4 41.5 7.3 20.2 55.0 N.S. N.S.
* excluding State export guarantees management (ex. SEGM). Coface ceded this activity as from January 1st 2017
INVESTOR PRESENTATION | NOVEMBER 2017
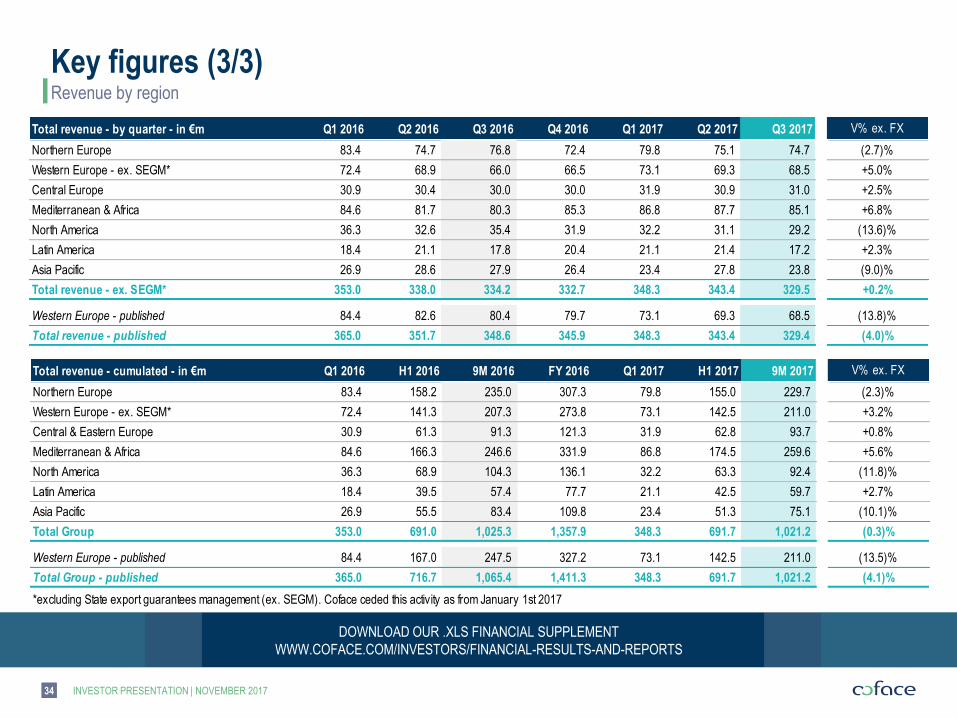
Revenue by region
Key figures (3/3)
DOWNLOAD OUR .XLS FINANCIAL SUPPLEMENT
WWW.COFACE.COM/INVESTORS/FINANCIAL-RESULTS-AND-REPORTS
34
Total revenue - cumulated - in €m Q1 2016 H1 2016 9M 2016 FY 2016 Q1 2017 H1 2017 9M 2017
Northern Europe 83.4 158.2 235.0 307.3 79.8 155.0 229.7
Western Europe - ex. SEGM* 72.4 141.3 207.3 273.8 73.1 142.5 211.0
Central & Eastern Europe 30.9 61.3 91.3 121.3 31.9 62.8 93.7
Mediterranean & Africa 84.6 166.3 246.6 331.9 86.8 174.5 259.6
North America 36.3 68.9 104.3 136.1 32.2 63.3 92.4
Latin America 18.4 39.5 57.4 77.7 21.1 42.5 59.7
Asia Pacific 26.9 55.5 83.4 109.8 23.4 51.3 75.1
Total Group 353.0 691.0 1,025.3 1,357.9 348.3 691.7 1,021.2
Western Europe - published 84.4 167.0 247.5 327.2 73.1 142.5 211.0
Total Group - published 365.0 716.7 1,065.4 1,411.3 348.3 691.7 1,021.2
*excluding State export guarantees management (ex. SEGM). Coface ceded this activity as from January 1st 2017
+0.8%
+5.6%
(11.8)%
+2.7%
V% ex. FX
(13.5)%
(4.1)%
(2.3)%
+3.2%
(10.1)%
(0.3)%
Total revenue - by quarter - in €m Q1 2016 Q2 2016 Q3 2016 Q4 2016 Q1 2017 Q2 2017 Q3 2017
Northern Europe 83.4 74.7 76.8 72.4 79.8 75.1 74.7
Western Europe - ex. SEGM* 72.4 68.9 66.0 66.5 73.1 69.3 68.5
Central Europe 30.9 30.4 30.0 30.0 31.9 30.9 31.0
Mediterranean & Africa 84.6 81.7 80.3 85.3 86.8 87.7 85.1
North America 36.3 32.6 35.4 31.9 32.2 31.1 29.2
Latin America 18.4 21.1 17.8 20.4 21.1 21.4 17.2
Asia Pacific 26.9 28.6 27.9 26.4 23.4 27.8 23.8
Total revenue - ex. SEGM* 353.0 338.0 334.2 332.7 348.3 343.4 329.5
Western Europe - published 84.4 82.6 80.4 79.7 73.1 69.3 68.5
Total revenue - published 365.0 351.7 348.6 345.9 348.3 343.4 329.4
V% ex. FX
(2.7)%
+5.0%
+2.5%
+6.8%
(13.8)%
(4.0)%
(13.6)%
+2.3%
(9.0)%
+0.2%
INVESTOR PRESENTATION | NOVEMBER 2017
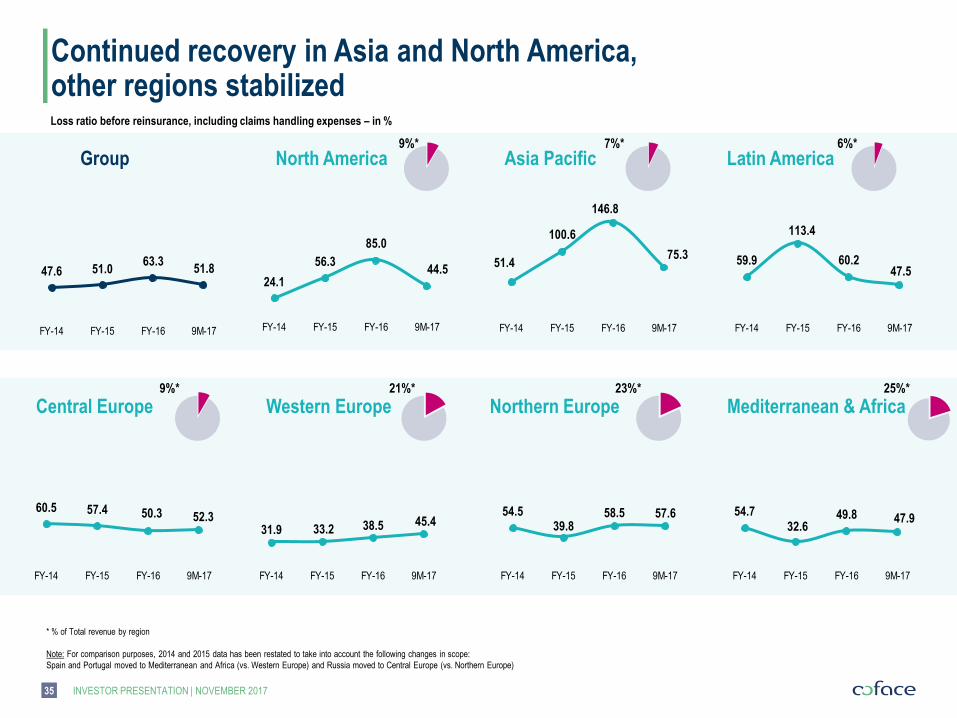
Loss ratio before reinsurance, including claims handling expenses – in %
Group
* % of Total revenue by region
Note: For comparison purposes, 2014 and 2015 data has been restated to take into account the following changes in scope:
Spain and Portugal moved to Mediterranean and Africa (vs. Western Europe) and Russia moved to Central Europe (vs. Northern Europe)
North America Asia Pacific Latin America 9%* 7%* 6%*
Central Europe Western Europe Northern Europe Mediterranean & Africa 9%* 21%* 23%* 25%*
Continued recovery in Asia and North America, other regions stabilized
35
47.6 51.063.3
51.8
FY-14 FY-15 FY-16 9M-17
24.1
56.3
85.0
44.5
FY-14 FY-15 FY-16 9M-17
51.4
100.6
146.8
75.3
FY-14 FY-15 FY-16 9M-17
59.9
113.4
60.247.5
FY-14 FY-15 FY-16 9M-17
60.5 57.4 50.3 52.3
FY-14 FY-15 FY-16 9M-17
31.9 33.2 38.5 45.4
FY-14 FY-15 FY-16 9M-17
54.539.8
58.5 57.6
FY-14 FY-15 FY-16 9M-17
54.7
32.649.8 47.9
FY-14 FY-15 FY-16 9M-17
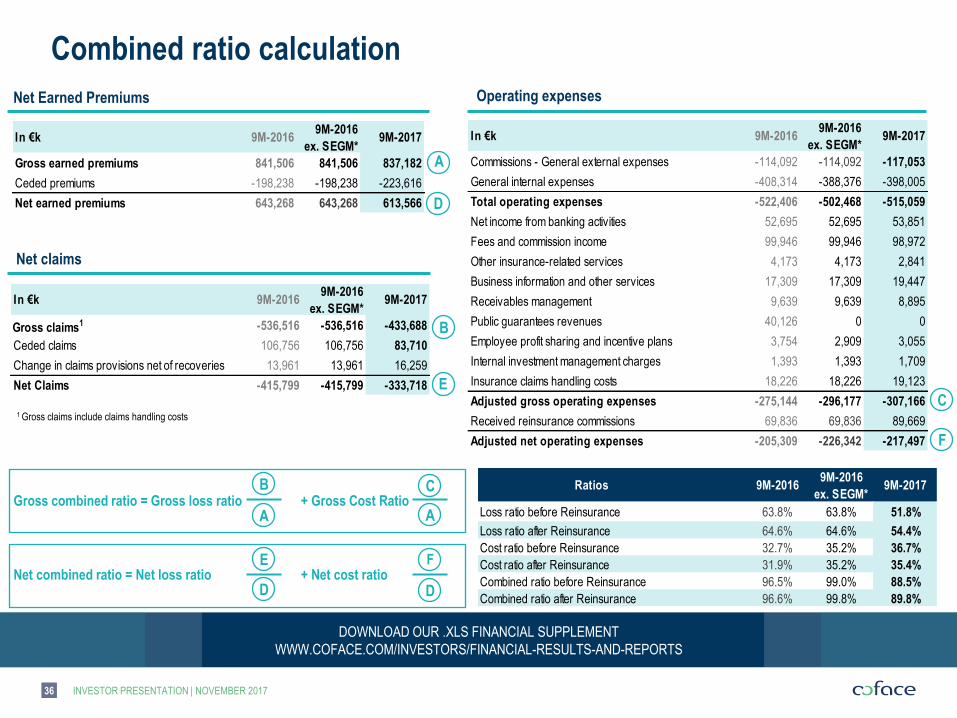
In €k 9M-20169M-2016
ex. SEGM*9M-2017
Gross claims1 -536,516 -536,516 -433,688
Ceded claims 106,756 106,756 83,710
Change in claims provisions net of recoveries 13,961 13,961 16,259
Net Claims -415,799 -415,799 -333,718
In €k 9M-20169M-2016
ex. SEGM*9M-2017
Gross earned premiums 841,506 841,506 837,182
Ceded premiums -198,238 -198,238 -223,616
Net earned premiums 643,268 643,268 613,566
Combined ratio calculation
INVESTOR PRESENTATION | NOVEMBER 2017
DOWNLOAD OUR .XLS FINANCIAL SUPPLEMENT
WWW.COFACE.COM/INVESTORS/FINANCIAL-RESULTS-AND-REPORTS
Net Earned Premiums Operating expenses
Net claims
1 Gross claims include claims handling costs
Gross combined ratio = Gross loss ratio + Gross Cost Ratio
Net combined ratio = Net loss ratio + Net cost ratio
B
A A
C
E F
D D
D
A
B
E
36
In €k 9M-20169M-2016
ex. SEGM*9M-2017
Commissions - General external expenses -114,092 -114,092 -117,053
General internal expenses -408,314 -388,376 -398,005
Total operating expenses -522,406 -502,468 -515,059
Net income from banking activities 52,695 52,695 53,851
Fees and commission income 99,946 99,946 98,972
Other insurance-related services 4,173 4,173 2,841
Business information and other services 17,309 17,309 19,447
Receivables management 9,639 9,639 8,895
Public guarantees revenues 40,126 0 0
Employee profit sharing and incentive plans 3,754 2,909 3,055
Internal investment management charges 1,393 1,393 1,709
Insurance claims handling costs 18,226 18,226 19,123
Adjusted gross operating expenses -275,144 -296,177 -307,166
Received reinsurance commissions 69,836 69,836 89,669
Adjusted net operating expenses -205,309 -226,342 -217,497
C
F
Ratios 9M-20169M-2016
ex. SEGM*9M-2017
Loss ratio before Reinsurance 63.8% 63.8% 51.8%
Loss ratio after Reinsurance 64.6% 64.6% 54.4%
Cost ratio before Reinsurance 32.7% 35.2% 36.7%
Cost ratio after Reinsurance 31.9% 35.2% 35.4%
Combined ratio before Reinsurance 96.5% 99.0% 88.5%
Combined ratio after Reinsurance 96.6% 99.8% 89.8%
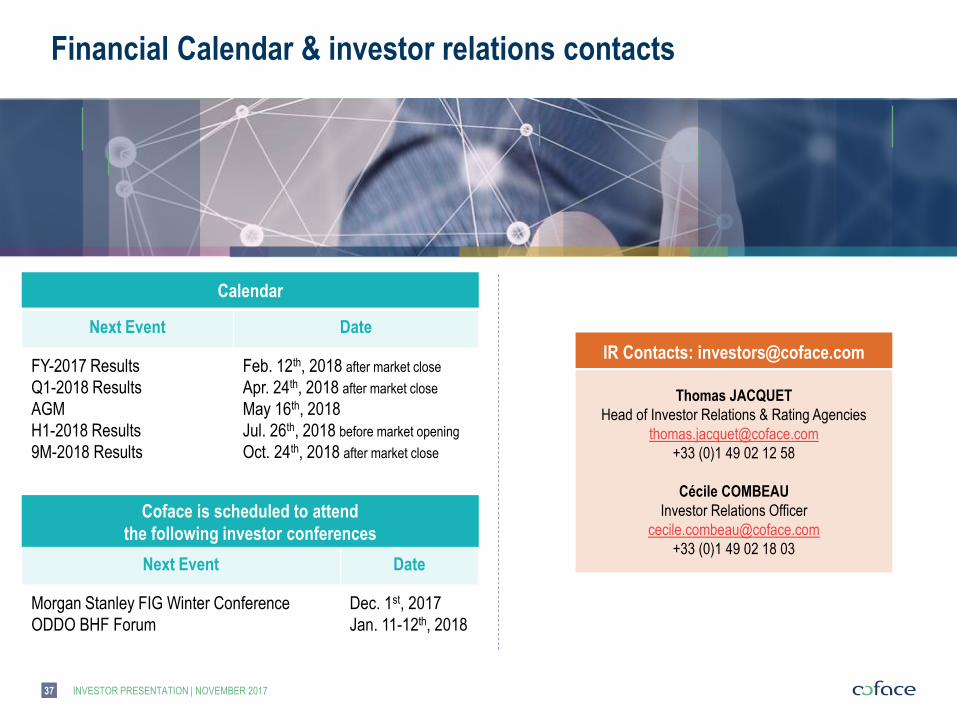
Financial Calendar & investor relations contacts
Calendar
IR Contacts: [email protected]
Thomas JACQUET
Head of Investor Relations & Rating Agencies
+33 (0)1 49 02 12 58
Cécile COMBEAU
Investor Relations Officer
+33 (0)1 49 02 18 03
Coface is scheduled to attend
the following investor conferences
Next Event Date
FY-2017 Results
Q1-2018 Results
AGM
H1-2018 Results
9M-2018 Results
Feb. 12th, 2018 after market close
Apr. 24th, 2018 after market close
May 16th, 2018
Jul. 26th, 2018 before market opening
Oct. 24th, 2018 after market close
INVESTOR PRESENTATION | NOVEMBER 2017
Next Event Date
Morgan Stanley FIG Winter Conference
ODDO BHF Forum
Dec. 1st, 2017
Jan. 11-12th, 2018
37
Important legal information
INVESTOR PRESENTATION | NOVEMBER 2017 38
IMPORTANT NOTICE:
This presentation does not constitute or form part of and should not be construed as, an offer to sell or issue or the solicitation of an offer to buy or acquire securities of Coface SA in any
jurisdiction or an inducement to enter into investment activity. No part of this presentation, nor the fact of its distribution, should form the basis of, or be relied on in connection with, any
contract or commitment or investment decision whatsoever
This presentation includes only summary information and does not purport to be comprehensive. The Coface Group takes no responsibility for the use of these materials by any person.
The information contained in this presentation has not been subject to independent verification. No representation, warranty or undertaking, express or implied, is made as to, and no
reliance should be placed on, the fairness, accuracy, completeness or correctness of the information or opinions contained herein. None of the Coface Group, its affiliates or its
advisors, nor any representatives of such persons, shall have any liability whatsoever for any loss arising from any use of this document or its contents or otherwise arising in
connection with this document or any other information or material discussed.
Participants should read the interim financial report for the first half 2017 and complete this information with the Registration Document for the year 2016. The Registration Document for
2016 was registered by the Autorité des marchés financiers (“AMF”) on April 12th, 2017 under the No. R.17-016. These documents all together present a detailed description of the
Coface Group, its business, strategy, financial condition, results of operations and risk factors.
This presentation contains certain forward-looking statements. Such forward looking statements in this presentation are for illustrative purposes only. Forward-looking statements relate
to expectations, beliefs, projections, future plans and strategies, anticipated events or trends and similar expressions concerning matters that are not historical facts. The forward-
looking statements are based on Coface Group’s current beliefs, assumptions and expectations of its future performance, taking into account all information currently available. The
Coface Group is under no obligation and does not undertake to provide updates of these forward-looking statements and information to reflect events that occur or circumstances that
arise after the date of this document.
Forward-looking information and statements are not guarantees of future performance and are subject to various risks and uncertainties, many of which are difficult to predict and
generally beyond the control of the Coface Group. Actual results could differ materially from those expressed in, or implied or projected by, forward-looking information and statements.
These risks and uncertainties include those discussed or identified under paragraph 2.4 “Report from the Chairman of the Board of Directors on corporate governance, internal control
and risk management procedures” (Paragraphe 2.4 “Rapport du président sur le gouvernement d’entreprise, les procédures de contrôle interne et de gestion des risques”) and Chapter
5 “Main risk factors and their management within the Group” (Chapitre 5 “Principaux facteurs de risque et leur gestion au seins du Groupe”) in the Registration Document.
This presentation contains certain information that has not been prepared in accordance with International Financial Reporting Standards (“IFRS”). This information has important
limitations as an analytical tool and should not be considered in isolation or as a substitute for analysis of our results as reported under IFRS.
More comprehensive information about the Coface Group may be obtained on its Internet website (http://www.coface.com/Investors).
![Agile Model Driven Development: Techniques for Scaling Agile Delivery Scott W. Ambler Senior Consulting Partner scott [at] scottwambler.com twitter.com/scottwambler](https://img.pdfslide.net/doc/110x75/56649d0d5503460f949e20f9/agile-model-driven-development-techniques-for-scaling-agile-delivery-scott.jpg)