Embed Size (px)
Citation preview
Commercial real estate (CRE) debt has historically offered investors above-market income and relative stability. CRE debt may be particularly attractive for investors looking to potentially manage interest rate risk and hedge against inflation risks of tomorrow’s markets.
The opportunity in commercial real estate debt

This information is educational in nature and does not constitute a financial promotion, investment advice or an inducement or incitement to participate in any product, offering or investment. FS Investments is not adopting, making a recommendation for or endorsing any investment strategy or particular security. All views, opinions and positions expressed herein are that of the author and do not necessarily reflect the views, opinions or positions of FS Investments. All opinions are subject to change without notice, and you should always obtain current information and perform due diligence before participating in any investment. FS Investments does not provide legal or tax advice and the information herein should not be considered legal or tax advice. Tax laws and regulations are complex and subject to change, which can materially impact any investment result. FS Investments cannot guarantee that the information herein is accurate, complete or timely. FS Investments makes no warranties with regard to such information or results obtained by its use, and disclaims any liability arising out of your use of, or any tax position taken in reliance on, such information.
Any projections, forecasts and estimates contained herein are based upon certain assumptions that the author considers reasonable. Projections are necessarily speculative in nature, and it can be expected that some or all of the assumptions underlying the projections will not materialize or will vary significantly from actual results. The inclusion of projections herein should not be regarded as a representation or guarantee regarding the reliability, accuracy or completeness of the information contained herein, and neither FS Investments nor the author are under any obligation to update or keep current such information.
All investing is subject to risk, including the possible loss of the money you invest.
WP-CREJN21
FS Investment Solutions, LLC 201 Rouse Boulevard, Philadelphia, PA 19112 www.fsinvestmentsolutions.com 877-628-8575 Member FINRA/SIPC© 2021 FS Investments www.fsinvestments.com
Christopher BoleFinancial Writer, Fund Communications
Christopher is an Associate on the Fund Communications team at FS Investments, where he focuses on the U.S. commercial real estate market and the firm’s business development companies (BDCs). Previously, Christopher led the investment communications efforts at Delaware Investments, concentrating on the firm’s fixed income products. Christopher is an active member of his community, serving on the Board of the Spruce Hill Community Association in West Philadelphia.
Robert HoffmanManaging Director, Investment Research
As Managing Director of Investment Research, Robert leads the team that analyzes the fundamentals behind market movements, macroeconomic trends and the performance of specific industries — as well as their potential impact on investors. His over two-decade tenure in the financial services industry includes experience as a loan portfolio manager and senior credit analyst focused on corporate loan issues. Robert serves as the firm’s primary subject matter expert on the corporate credit markets and select alternative investment solutions, developing targeted communications and educational resources.
Contents
Introduction »
A $4.8 trillion market »
Notable market participants »
An attractive risk-return profile »
CRE returns during the GFC »
The best ways to access CRE debt »
Summary »
Learn more Sign up to receive our latest Insights articles
3
The COVID-19 pandemic and the monetary support that followed exacerbated the long-term secular decline in interest rates.
1 Bloomberg, Macrobond, FS Investments, as of December 31, 2020. CRE debt is represented by the Giliberto-Levy Commercial Mortgage Performance Index.
2 ICE BofAML U.S. Corporate Index, as of December 31, 2020.
As yields across traditional fixed income asset classes plunged to new historical lows in 2020, many investors enjoyed strong returns from their fixed income allocations thanks to rising prices. At the same time, however, real yields on core fixed income investments turned increasingly negative.
Given low yields across most fixed income asset classes today, traditional fixed income portfolios face significant downside risks if rates move higher yet offer little upside if rates decline. With this in mind, institutional investors have increasingly turned to alternative asset classes to fill the role that core fixed income typically played within a portfolio.
In the following pages, we discuss how CRE debt strategies may provide investors with the income, stability and capital preservation that traditional fixed income portfolios historically offered. We also review how the search for alternative income solutions is changing the investor base among CRE debt investors.
CRE debt has historically provided investors with:• Above-market income: Over the past 20 years, CRE debt has delivered an average annualized income return of 5.7%,
approximately 220 basis points (bps) above that of the Bloomberg Barclays U.S. Aggregate Bond Index (Barclays Agg).1 Over the same time frame, however, CRE debt experienced higher volatility than the Barclays Agg. The standard deviation of returns on CRE debt was 4.1% compared to 3.4% for the Barclays Agg.
• Relative stability through market cycles: CRE debt has historically exhibited generally stable performance with relatively modest declines even during periods of significant property price volatility. During the Global Financial Crisis (GFC), for example, total returns on private CRE debt remained positive despite declining property prices and plummeting stock prices. The relatively strong performance has largely been driven by the “equity cushion” beneath debt investors. Just like a residential mortgage, a property owner is the first to experience loss if prices decline.
• Low duration: The duration of investment grade corporate bonds rose from 5.8 years in 2000 to 7.9 years as of December 2020.2 Higher-duration investments benefited through much of this time frame, generating positive price appreciation as interest rates plunged to new lows; however, the income portion of returns over the last three years from “fixed income” has represented only 46% of the total return.2
While traditional fixed income has exhibited lower historical standard deviation than CRE debt, going forward it could be difficult for traditional fixed income to generate this level of total return if interest rates rise from near-historical lows. Against this backdrop, short-term senior secured floating rate loans, including those backed by CRE debt, may be an attractive alternative.
• Portfolio diversification: CRE debt has historically provided diversification against equities, with a correlation of -0.05 to the S&P 500 over the 20-year period ended December 31, 2020.1 Among a range of major fixed income asset classes, only the Barclays Agg (-0.32) offered greater diversification benefits against stocks.
4
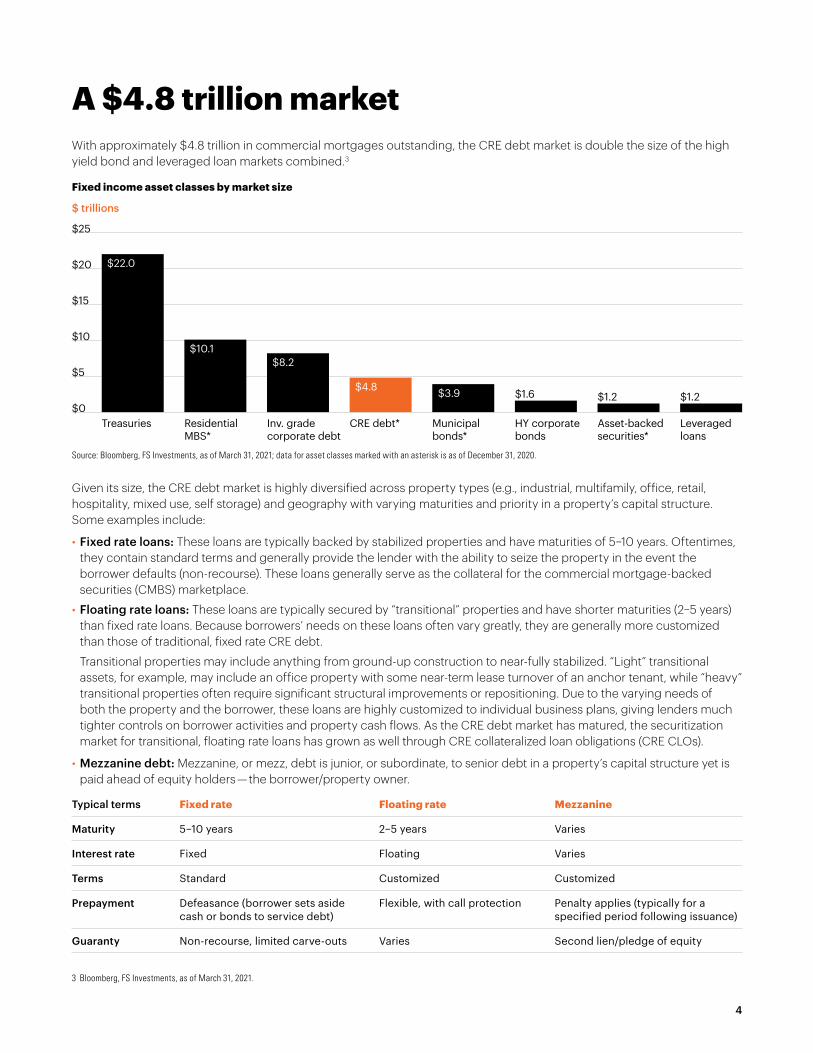
3 Bloomberg, FS Investments, as of March 31, 2021.
Treasuries ResidentialMBS*
Inv. gradecorporate debt
CRE debt* Municipalbonds*
Asset-backedsecurities*
HY corporatebonds
Leveragedloans
$ trillions
$0
$5
$10
$15
$20
$25
$22.0
$10.1 $8.2
$4.8 $3.9 $1.2$1.2$1.6
A $4.8 trillion marketWith approximately $4.8 trillion in commercial mortgages outstanding, the CRE debt market is double the size of the high yield bond and leveraged loan markets combined.3
Fixed income asset classes by market size
Source: Bloomberg, FS Investments, as of March 31, 2021; data for asset classes marked with an asterisk is as of December 31, 2020.
Given its size, the CRE debt market is highly diversified across property types (e.g., industrial, multifamily, office, retail, hospitality, mixed use, self storage) and geography with varying maturities and priority in a property’s capital structure. Some examples include:
• Fixed rate loans: These loans are typically backed by stabilized properties and have maturities of 5–10 years. Oftentimes, they contain standard terms and generally provide the lender with the ability to seize the property in the event the borrower defaults (non-recourse). These loans generally serve as the collateral for the commercial mortgage-backed securities (CMBS) marketplace.
• Floating rate loans: These loans are typically secured by “transitional” properties and have shorter maturities (2–5 years) than fixed rate loans. Because borrowers’ needs on these loans often vary greatly, they are generally more customized than those of traditional, fixed rate CRE debt.
Transitional properties may include anything from ground-up construction to near-fully stabilized. “Light” transitional assets, for example, may include an office property with some near-term lease turnover of an anchor tenant, while “heavy” transitional properties often require significant structural improvements or repositioning. Due to the varying needs of both the property and the borrower, these loans are highly customized to individual business plans, giving lenders much tighter controls on borrower activities and property cash flows. As the CRE debt market has matured, the securitization market for transitional, floating rate loans has grown as well through CRE collateralized loan obligations (CRE CLOs).
• Mezzanine debt: Mezzanine, or mezz, debt is junior, or subordinate, to senior debt in a property’s capital structure yet is paid ahead of equity holders — the borrower/property owner.
Typical terms Fixed rate Floating rate Mezzanine
Maturity 5–10 years 2–5 years Varies
Interest rate Fixed Floating Varies
Terms Standard Customized Customized
Prepayment Defeasance (borrower sets aside cash or bonds to service debt)
Flexible, with call protection Penalty applies (typically for a specified period following issuance)
Guaranty Non-recourse, limited carve-outs Varies Second lien/pledge of equity
5
4 Based on data from J.P. Morgan, as of December 31, 2020.
5 Preqin, as of December 31, 2020. Based on institutional CRE debt funds.
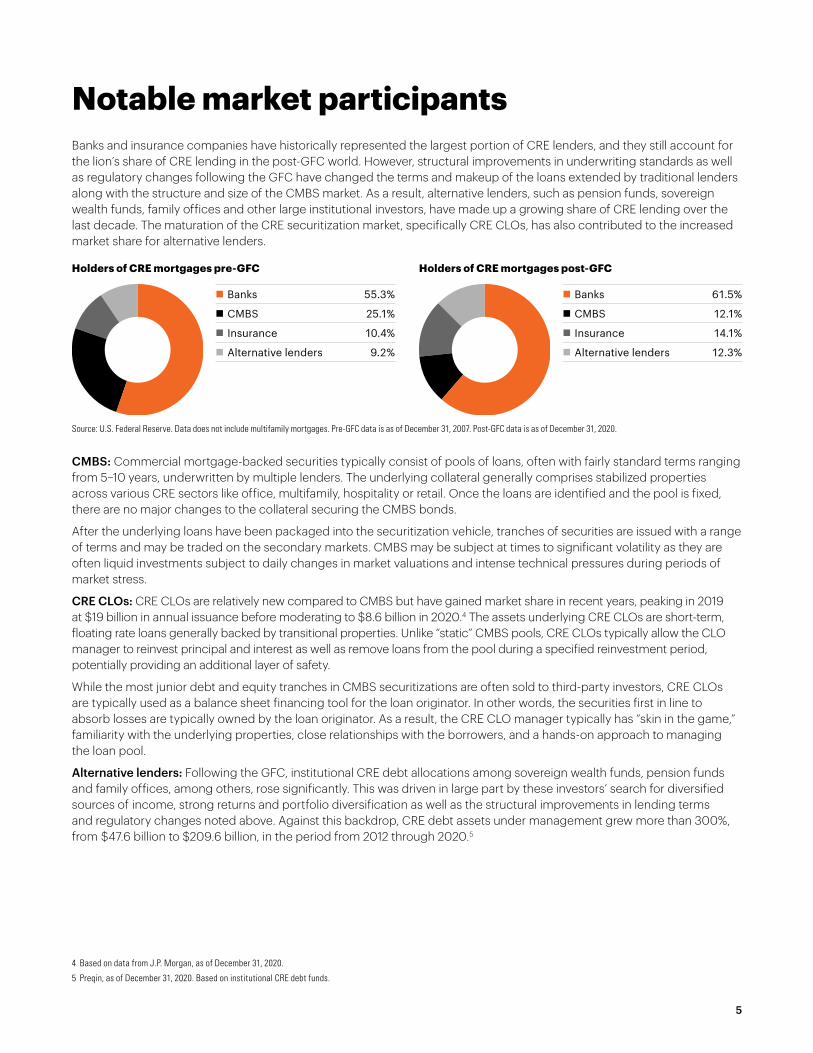
Notable market participantsBanks and insurance companies have historically represented the largest portion of CRE lenders, and they still account for the lion’s share of CRE lending in the post-GFC world. However, structural improvements in underwriting standards as well as regulatory changes following the GFC have changed the terms and makeup of the loans extended by traditional lenders along with the structure and size of the CMBS market. As a result, alternative lenders, such as pension funds, sovereign wealth funds, family offices and other large institutional investors, have made up a growing share of CRE lending over the last decade. The maturation of the CRE securitization market, specifically CRE CLOs, has also contributed to the increased market share for alternative lenders.
Holders of CRE mortgages pre-GFC
n Banks 55.3%
n CMBS 25.1%
n Insurance 10.4%
n Alternative lenders 9.2%
Holders of CRE mortgages post-GFC
n Banks 61.5%
n CMBS 12.1%
n Insurance 14.1%
n Alternative lenders 12.3%
Source: U.S. Federal Reserve. Data does not include multifamily mortgages. Pre-GFC data is as of December 31, 2007. Post-GFC data is as of December 31, 2020.
CMBS: Commercial mortgage-backed securities typically consist of pools of loans, often with fairly standard terms ranging from 5–10 years, underwritten by multiple lenders. The underlying collateral generally comprises stabilized properties across various CRE sectors like office, multifamily, hospitality or retail. Once the loans are identified and the pool is fixed, there are no major changes to the collateral securing the CMBS bonds.
After the underlying loans have been packaged into the securitization vehicle, tranches of securities are issued with a range of terms and may be traded on the secondary markets. CMBS may be subject at times to significant volatility as they are often liquid investments subject to daily changes in market valuations and intense technical pressures during periods of market stress.
CRE CLOs: CRE CLOs are relatively new compared to CMBS but have gained market share in recent years, peaking in 2019 at $19 billion in annual issuance before moderating to $8.6 billion in 2020.4 The assets underlying CRE CLOs are short-term, floating rate loans generally backed by transitional properties. Unlike “static” CMBS pools, CRE CLOs typically allow the CLO manager to reinvest principal and interest as well as remove loans from the pool during a specified reinvestment period, potentially providing an additional layer of safety.
While the most junior debt and equity tranches in CMBS securitizations are often sold to third-party investors, CRE CLOs are typically used as a balance sheet financing tool for the loan originator. In other words, the securities first in line to absorb losses are typically owned by the loan originator. As a result, the CRE CLO manager typically has “skin in the game,” familiarity with the underlying properties, close relationships with the borrowers, and a hands-on approach to managing the loan pool.
Alternative lenders: Following the GFC, institutional CRE debt allocations among sovereign wealth funds, pension funds and family offices, among others, rose significantly. This was driven in large part by these investors’ search for diversified sources of income, strong returns and portfolio diversification as well as the structural improvements in lending terms and regulatory changes noted above. Against this backdrop, CRE debt assets under management grew more than 300%, from $47.6 billion to $209.6 billion, in the period from 2012 through 2020.5
6
6 Bloomberg, FS Investments, for the 20-year period ended December 31, 2020. Risk is measured by the standard deviation of returns.
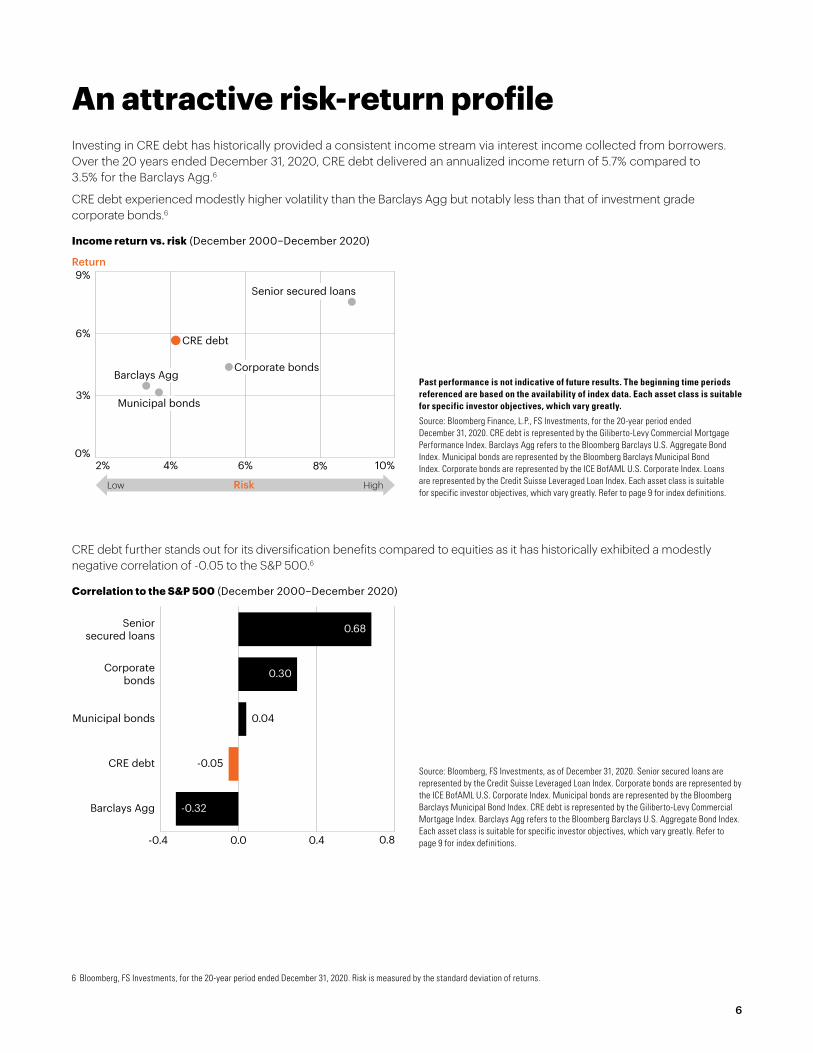
An attractive risk-return profileInvesting in CRE debt has historically provided a consistent income stream via interest income collected from borrowers. Over the 20 years ended December 31, 2020, CRE debt delivered an annualized income return of 5.7% compared to 3.5% for the Barclays Agg.6
CRE debt experienced modestly higher volatility than the Barclays Agg but notably less than that of investment grade corporate bonds.6
Income return vs. risk (December 2000–December 2020)
Past performance is not indicative of future results. The beginning time periods referenced are based on the availability of index data. Each asset class is suitable for specific investor objectives, which vary greatly.
Source: Bloomberg Finance, L.P., FS Investments, for the 20-year period ended December 31, 2020. CRE debt is represented by the Giliberto-Levy Commercial Mortgage Performance Index. Barclays Agg refers to the Bloomberg Barclays U.S. Aggregate Bond Index. Municipal bonds are represented by the Bloomberg Barclays Municipal Bond Index. Corporate bonds are represented by the ICE BofAML U.S. Corporate Index. Loans are represented by the Credit Suisse Leveraged Loan Index. Each asset class is suitable for specific investor objectives, which vary greatly. Refer to page 9 for index definitions.
Return
2% 4% 6% 8% 10%
Low Risk High
6%
0%
3%
9% Senior secured loans
Barclays Agg
Municipal bonds
Corporate bonds
CRE debt
0.8
Barclays Agg
-0.05
0.04
-0.32
0.30
0.68 Senior secured loans
-0.4 0.0 0.4
Corporate bonds
Municipal bonds
CRE debt
CRE debt further stands out for its diversification benefits compared to equities as it has historically exhibited a modestly negative correlation of -0.05 to the S&P 500.6
Correlation to the S&P 500 (December 2000–December 2020)
Source: Bloomberg, FS Investments, as of December 31, 2020. Senior secured loans are represented by the Credit Suisse Leveraged Loan Index. Corporate bonds are represented by the ICE BofAML U.S. Corporate Index. Municipal bonds are represented by the Bloomberg Barclays Municipal Bond Index. CRE debt is represented by the Giliberto-Levy Commercial Mortgage Index. Barclays Agg refers to the Bloomberg Barclays U.S. Aggregate Bond Index. Each asset class is suitable for specific investor objectives, which vary greatly. Refer to page 9 for index definitions.
7
$50,000
$75,000
$100,000
$125,000
$150,000
3/2007 3/2008 3/2009 3/2010 3/2011
— CRE debt — Barclays Agg — S&P 500 — CRE property prices
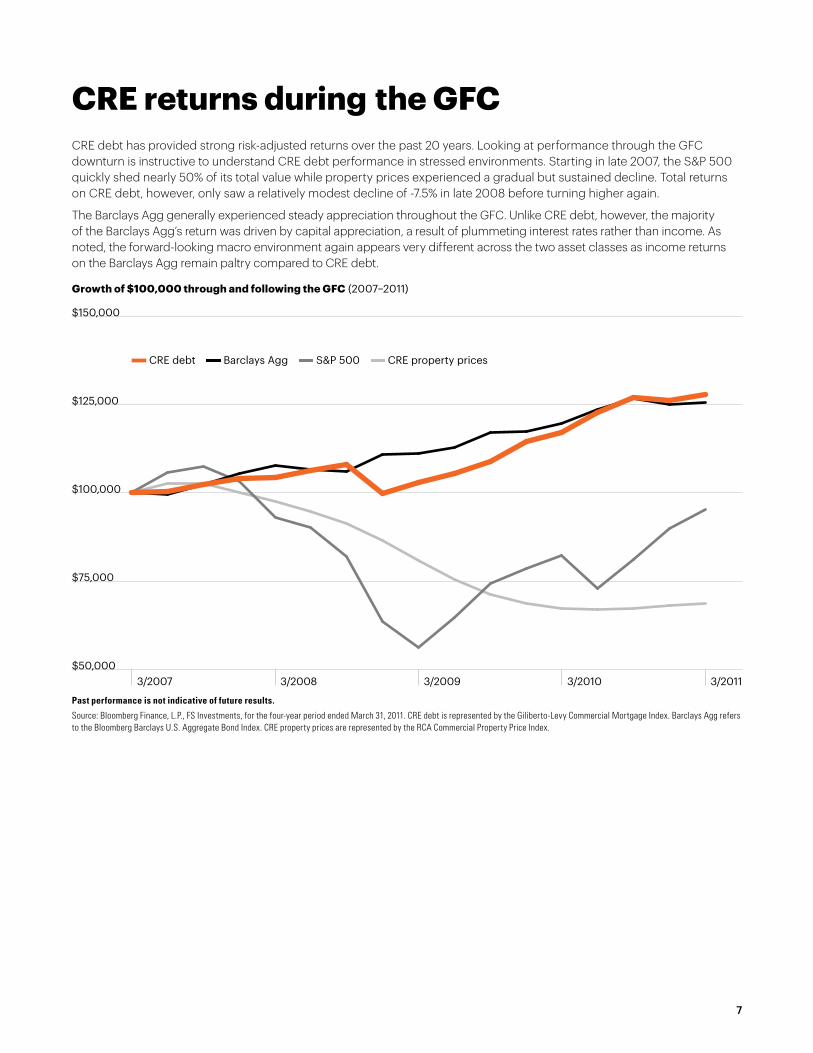
CRE returns during the GFCCRE debt has provided strong risk-adjusted returns over the past 20 years. Looking at performance through the GFC downturn is instructive to understand CRE debt performance in stressed environments. Starting in late 2007, the S&P 500 quickly shed nearly 50% of its total value while property prices experienced a gradual but sustained decline. Total returns on CRE debt, however, only saw a relatively modest decline of -7.5% in late 2008 before turning higher again.
The Barclays Agg generally experienced steady appreciation throughout the GFC. Unlike CRE debt, however, the majority of the Barclays Agg’s return was driven by capital appreciation, a result of plummeting interest rates rather than income. As noted, the forward-looking macro environment again appears very different across the two asset classes as income returns on the Barclays Agg remain paltry compared to CRE debt.
Growth of $100,000 through and following the GFC (2007–2011)
Past performance is not indicative of future results.
Source: Bloomberg Finance, L.P., FS Investments, for the four-year period ended March 31, 2011. CRE debt is represented by the Giliberto-Levy Commercial Mortgage Index. Barclays Agg refers to the Bloomberg Barclays U.S. Aggregate Bond Index. CRE property prices are represented by the RCA Commercial Property Price Index.
8
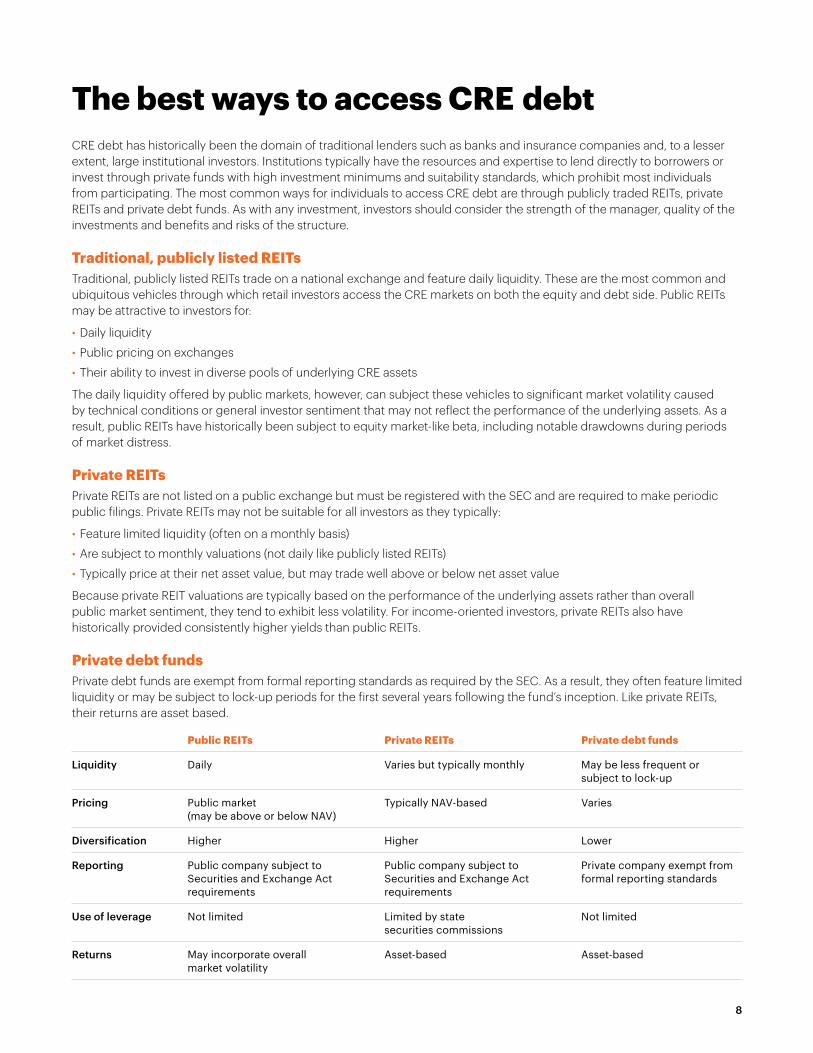
The best ways to access CRE debtCRE debt has historically been the domain of traditional lenders such as banks and insurance companies and, to a lesser extent, large institutional investors. Institutions typically have the resources and expertise to lend directly to borrowers or invest through private funds with high investment minimums and suitability standards, which prohibit most individuals from participating. The most common ways for individuals to access CRE debt are through publicly traded REITs, private REITs and private debt funds. As with any investment, investors should consider the strength of the manager, quality of the investments and benefits and risks of the structure.
Traditional, publicly listed REITsTraditional, publicly listed REITs trade on a national exchange and feature daily liquidity. These are the most common and ubiquitous vehicles through which retail investors access the CRE markets on both the equity and debt side. Public REITs may be attractive to investors for:
• Daily liquidity
• Public pricing on exchanges
• Their ability to invest in diverse pools of underlying CRE assets
The daily liquidity offered by public markets, however, can subject these vehicles to significant market volatility caused by technical conditions or general investor sentiment that may not reflect the performance of the underlying assets. As a result, public REITs have historically been subject to equity market-like beta, including notable drawdowns during periods of market distress.
Private REITsPrivate REITs are not listed on a public exchange but must be registered with the SEC and are required to make periodic public filings. Private REITs may not be suitable for all investors as they typically:
• Feature limited liquidity (often on a monthly basis)
• Are subject to monthly valuations (not daily like publicly listed REITs)
• Typically price at their net asset value, but may trade well above or below net asset value
Because private REIT valuations are typically based on the performance of the underlying assets rather than overall public market sentiment, they tend to exhibit less volatility. For income-oriented investors, private REITs also have historically provided consistently higher yields than public REITs.
Private debt fundsPrivate debt funds are exempt from formal reporting standards as required by the SEC. As a result, they often feature limited liquidity or may be subject to lock-up periods for the first several years following the fund’s inception. Like private REITs, their returns are asset based.
Public REITs Private REITs Private debt funds
Liquidity Daily Varies but typically monthly May be less frequent or subject to lock-up
Pricing Public market (may be above or below NAV)
Typically NAV-based Varies
Diversification Higher Higher Lower
Reporting Public company subject to Securities and Exchange Act requirements
Public company subject to Securities and Exchange Act requirements
Private company exempt from formal reporting standards
Use of leverage Not limited Limited by state securities commissions
Not limited
Returns May incorporate overall market volatility
Asset-based Asset-based
SummaryPrivate CRE debt within a portfolio — lower risk, more return
Despite the significant disruption that the COVID crisis wreaked on the financial markets, the case for an allocation to CRE debt remains strong—and perhaps has even improved —in a post-pandemic world.
CRE debt has historically generated steady, above-market levels of income and solid risk-adjusted returns through multiple market cycles. In a forward-looking environment, its diversification to equities as well as its low-duration profile may become particularly attractive should interest rates revert to historical norms.
To learn more about investing in alternatives, visit
fsinvestments.com
INDEX DEFINITIONSBloomberg Barclays Municipal Bond Index tracks the performance of investment-grade municipal bonds. Bloomberg Barclays U.S. Aggregate Bond Index is a broad-based benchmark that measures the investment grade, U.S. dollar-denominated, fixed-rate taxable bond market. The index includes Treasuries, government-related and corporate securities, MBS (agency fixed-rate and hybrid ARM pass-throughs), ABS and CMBS (agency and non-agency). Credit Suisse Leveraged Loan Index tracks the investable market of the U.S. dollar-denominated leveraged loan market. Giliberto-Levy Commercial Mortgage Index tracks the performance of fixed-rate commercial mortgage loans held on balance sheets of institutions such as life insurance companies and pension funds. ICE BofAML U.S. Corporate Index tracks the performance of U.S. dollar-denominated investment grade corporate debt publicly issued in the U.S. domestic market.
The indexes referenced herein are the exclusive property of each respective index provider and have been licensed for use by FS Investments. The index providers do not guarantee the accuracy and/or completeness of the indexes and accept no liability in connection with the use, accuracy or completeness of the data included therein. Inclusion of the indexes in these materials does not imply that the index providers endorse or express any opinion in respect of FS Investments. Visit www.fsinvestments.com/support/articles/index-disclaimers for more information.
Investor considerationsInvestors should consider key risks of investing in commercial real estate debt. Commercial mortgage loans are typically illiquid and do not have an active secondary market. In addition, while commercial loans are typically secured by a first-priority mortgage on commercial real estate properties, they are still subject to the risk of default by the borrower. There is no assurance that commercial real estate investments will provide regular, stable distributions or performance.