Embed Size (px)
Citation preview
Filename
James LamPresidentph: [email protected] www.jameslam.com
The OSU Risk Institute Launch
ERM and Business Strategy
October 23, 2014
1
1. Risks we face are highly complex and interdependent
2. Integrated enterprise risk management (ERM) can add significant value
3. We must address four fundamental questions for managing risk
4. Continuous ERM, including strategic risk management, represents the next frontier
Key take-aways for today
2
Strategic/Business Risk– Do we have the right business model and strategy? Are we executing against that
strategy effectively? Are we pricing for the cost of risk in our products and services?
Financial Risk– What is our exposure to market prices (i.e., interest rates, FX, equity prices, energy
prices)? What is our exposure to borrowers and counterparties who may fail to perform on their contractual obligations? Can we raise cash to meet our obligations in cost effective and timely manner?
Operational Risk– What is our exposure to failures in people, processes, systems, and external events?
For example, are we protected against cyber-security risks?
Legal/Compliance Risk– Are we in compliance with laws and regulations? Are we prepared for proposed laws
and regulations?
Reputational Risk– What is the potential economic impact due to perceptions of our key stakeholders,
including customers, employees, shareholders, regulators, and the general public?
Key risks we face as a business
3
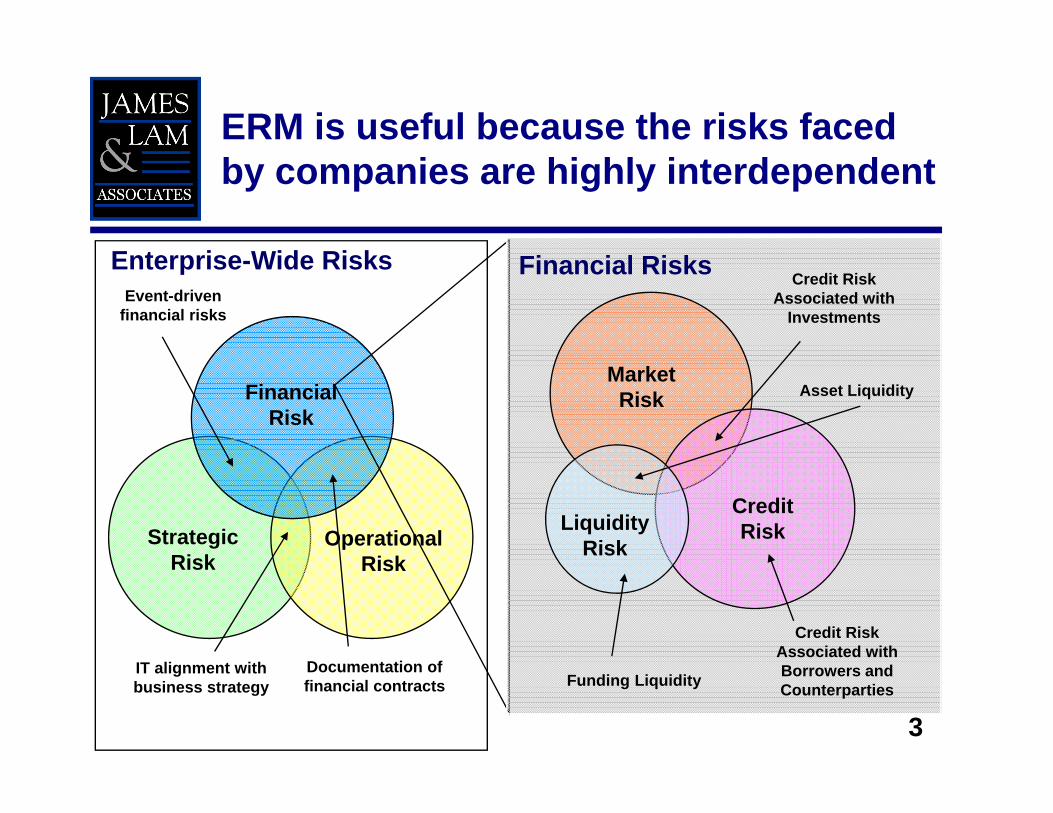
ERM is useful because the risks faced by companies are highly interdependent
Strategic Risk
OperationalRisk
FinancialRisk
IT alignment with business strategy
Documentation of financial contracts
Event-driven financial risks
Enterprise-Wide Risks Financial Risks
MarketRisk
LiquidityRisk
CreditRisk
Credit Risk Associated with
Investments
Credit Risk Associated with Borrowers and CounterpartiesFunding Liquidity
Asset Liquidity
4
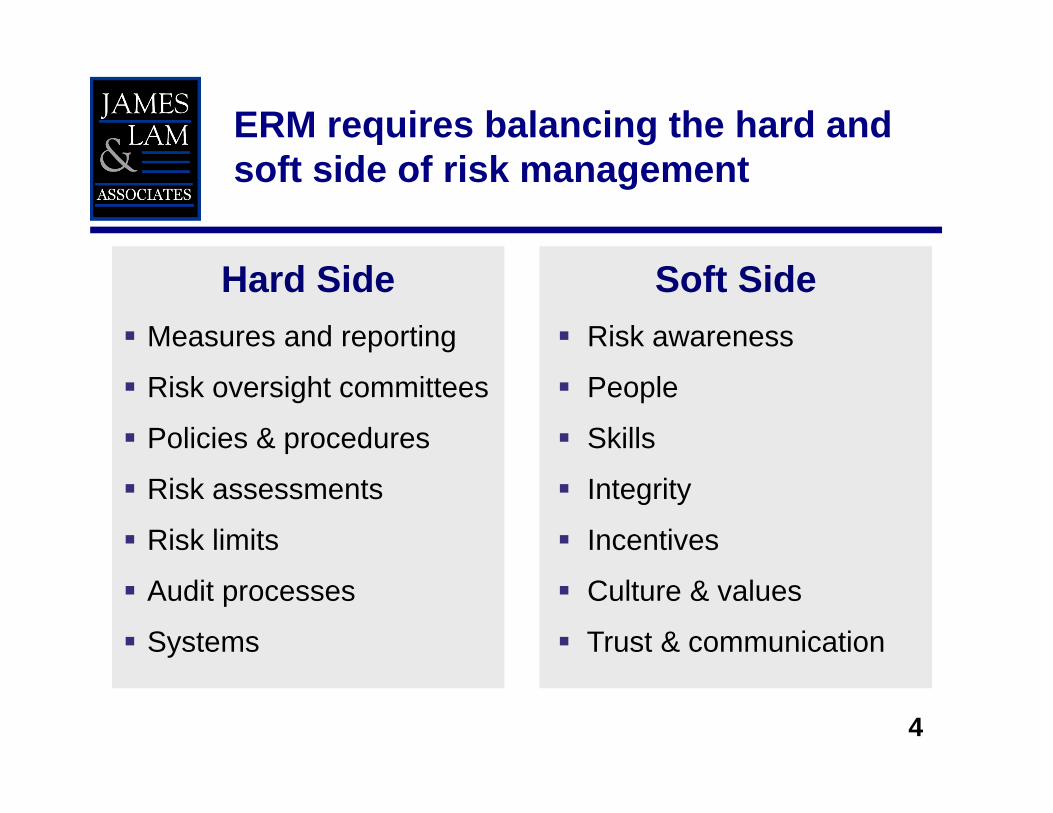
ERM requires balancing the hard and soft side of risk management
Hard Side Measures and reporting
Risk oversight committees
Policies & procedures
Risk assessments
Risk limits
Audit processes
Systems
Soft Side Risk awareness
People
Skills
Integrity
Incentives
Culture & values
Trust & communication
5
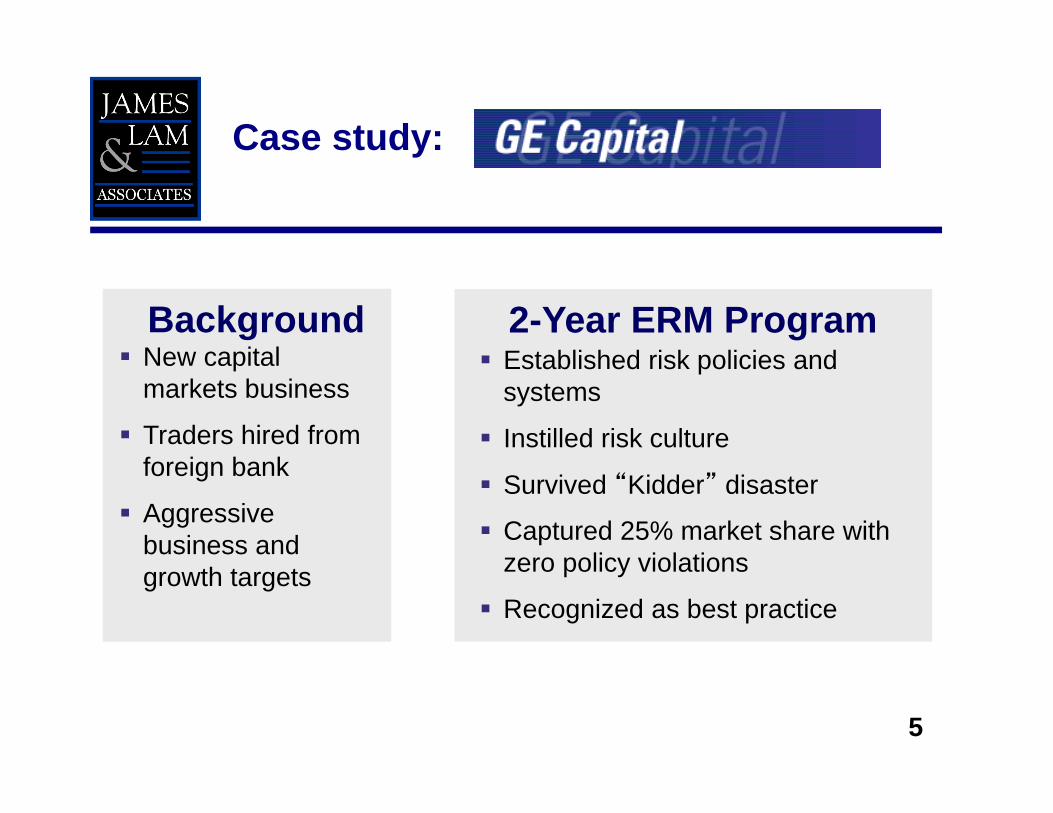
Case study:
New capital markets business
Traders hired from foreign bank
Aggressive business and growth targets
Background 2-Year ERM Program Established risk policies and
systems
Instilled risk culture
Survived “Kidder” disaster
Captured 25% market share with zero policy violations
Recognized as best practice
6
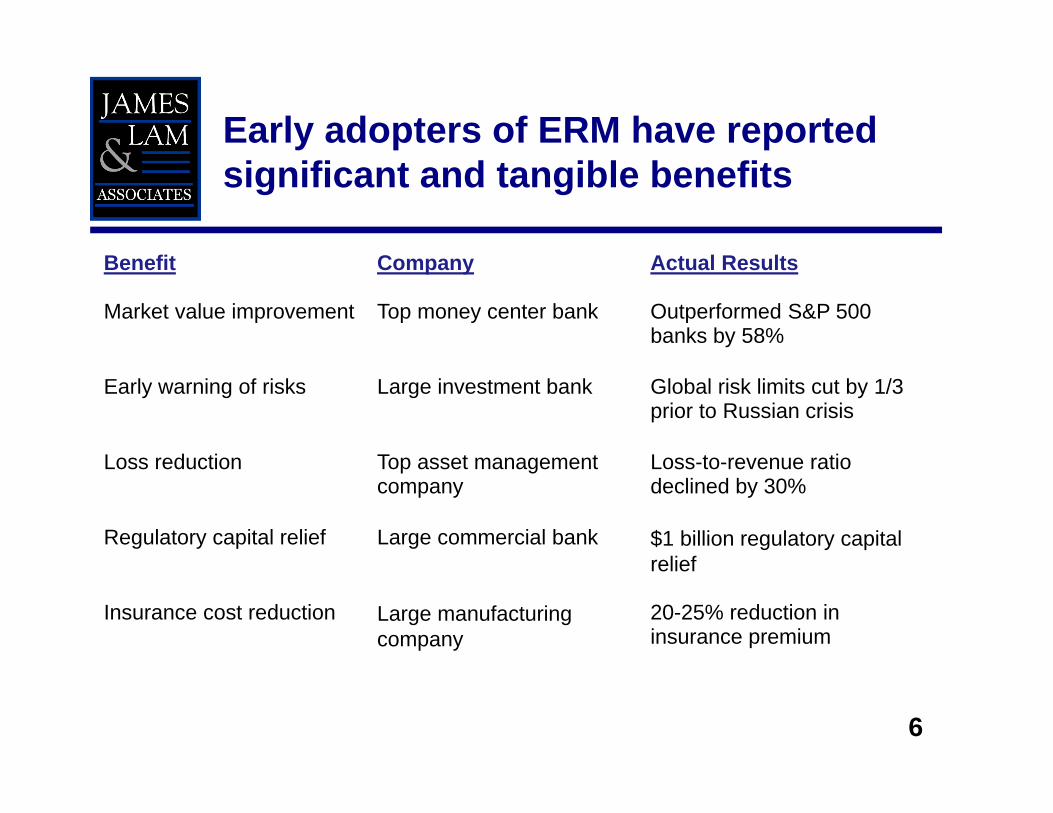
Early adopters of ERM have reported significant and tangible benefits
Benefit Company Actual Results
Market value improvement Top money center bank Outperformed S&P 500 banks by 58%
Early warning of risks Large investment bank Global risk limits cut by 1/3 prior to Russian crisis
Loss reduction Top asset management company
Loss-to-revenue ratio declined by 30%
Regulatory capital relief Large commercial bank $1 billion regulatory capital relief
Insurance cost reduction Large manufacturing company
20-25% reduction in insurance premium
7
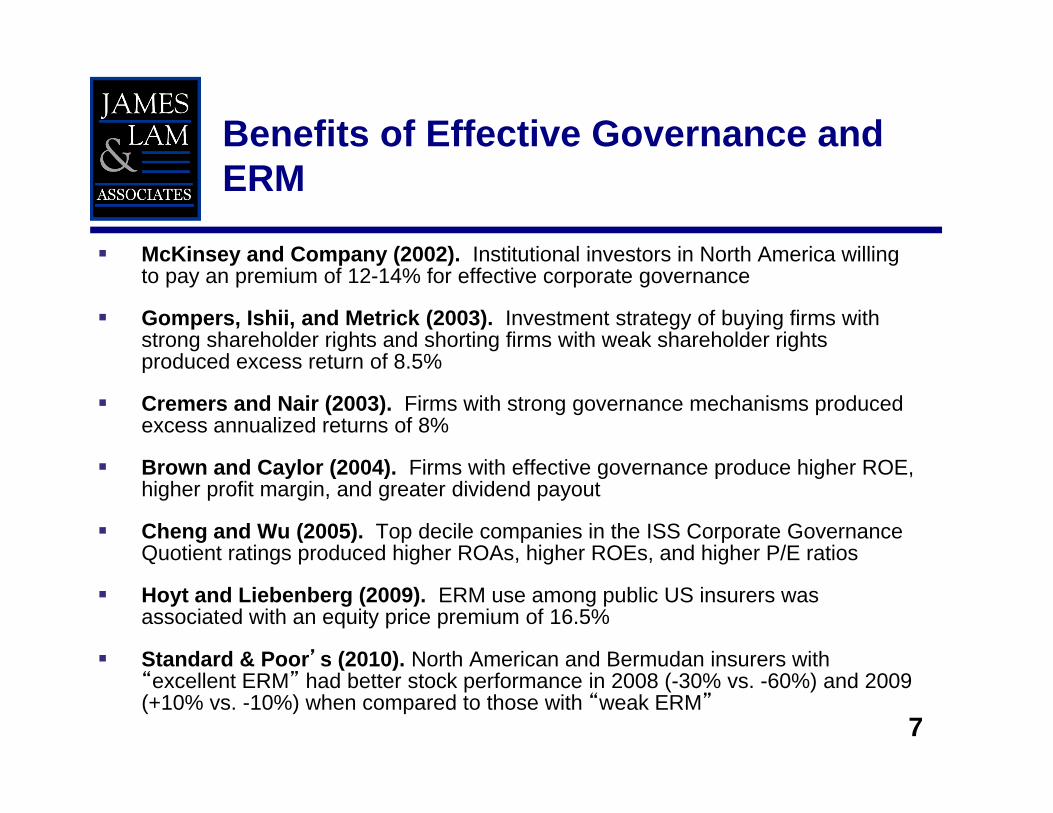
McKinsey and Company (2002). Institutional investors in North America willing to pay an premium of 12-14% for effective corporate governance
Gompers, Ishii, and Metrick (2003). Investment strategy of buying firms with strong shareholder rights and shorting firms with weak shareholder rights produced excess return of 8.5%
Cremers and Nair (2003). Firms with strong governance mechanisms produced excess annualized returns of 8%
Brown and Caylor (2004). Firms with effective governance produce higher ROE, higher profit margin, and greater dividend payout
Cheng and Wu (2005). Top decile companies in the ISS Corporate Governance Quotient ratings produced higher ROAs, higher ROEs, and higher P/E ratios
Hoyt and Liebenberg (2009). ERM use among public US insurers was associated with an equity price premium of 16.5%
Standard & Poor’s (2010). North American and Bermudan insurers with “excellent ERM” had better stock performance in 2008 (-30% vs. -60%) and 2009 (+10% vs. -10%) when compared to those with “weak ERM”
Benefits of Effective Governance and ERM
8
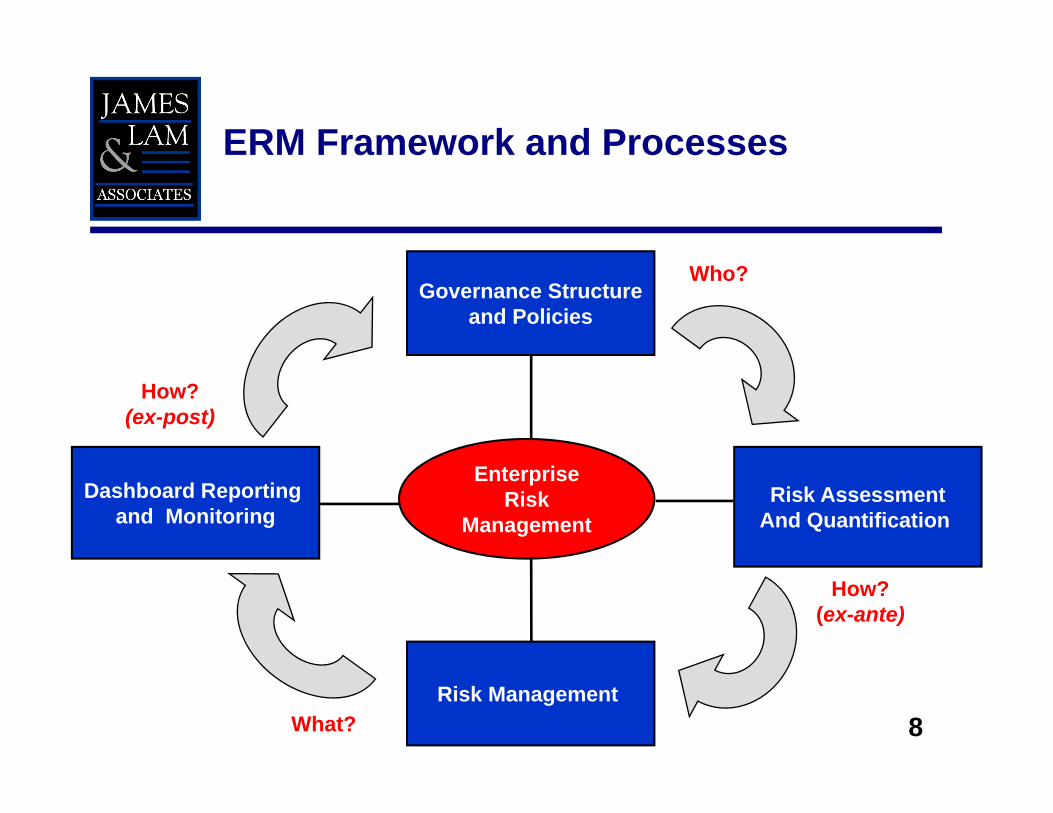
ERM Framework and Processes
Risk AssessmentAnd Quantification
EnterpriseRisk
ManagementDashboard Reporting
and Monitoring
Governance Structureand Policies
Risk Management
Who?
How?(ex-ante)
What?
How?(ex-post)
9
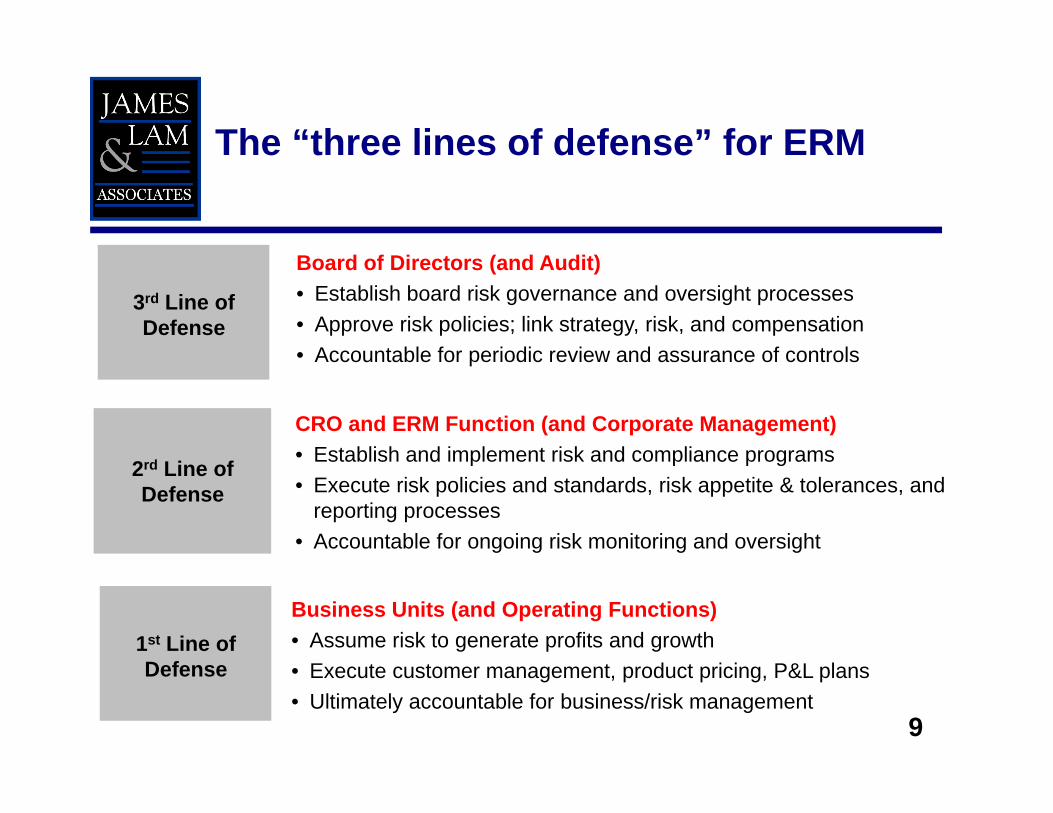
3rd Line of Defense
2rd Line of Defense
The “three lines of defense” for ERM
1st Line of Defense
Business Units (and Operating Functions)• Assume risk to generate profits and growth• Execute customer management, product pricing, P&L plans• Ultimately accountable for business/risk management
CRO and ERM Function (and Corporate Management)• Establish and implement risk and compliance programs• Execute risk policies and standards, risk appetite & tolerances, and
reporting processes• Accountable for ongoing risk monitoring and oversight
Board of Directors (and Audit)• Establish board risk governance and oversight processes• Approve risk policies; link strategy, risk, and compensation• Accountable for periodic review and assurance of controls
10
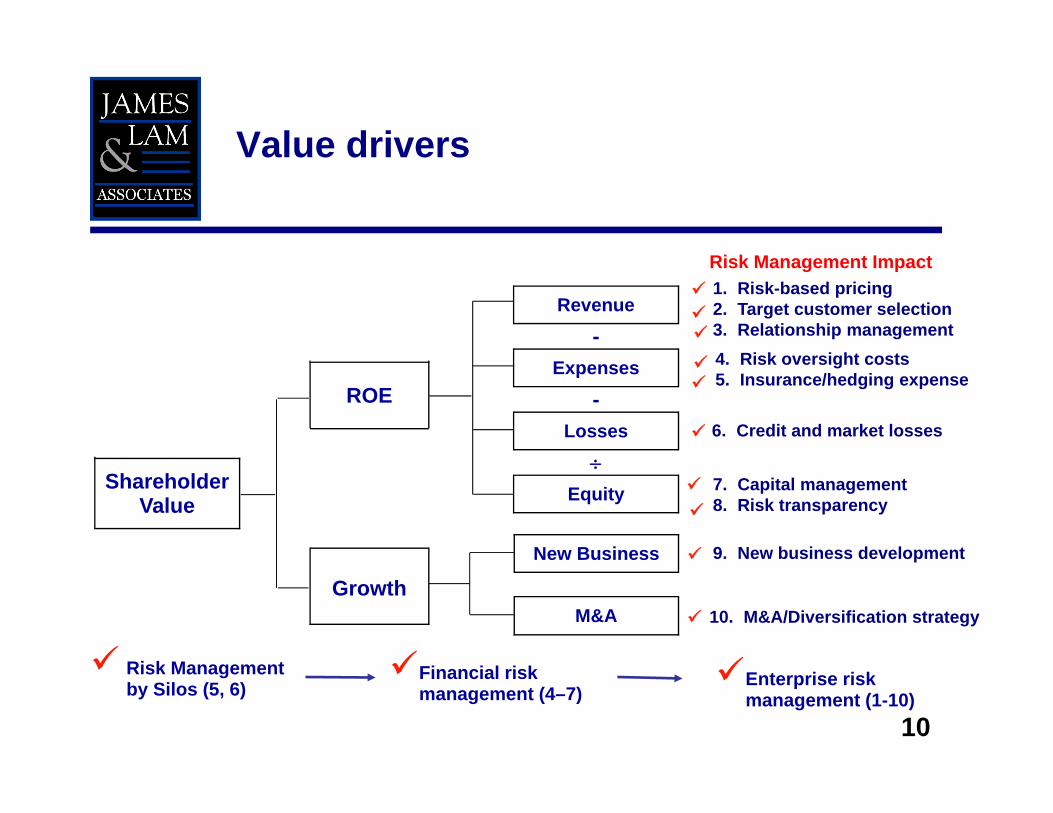
Expenses-
Revenue
Equity
-Losses
M&A
New Business
Value drivers
Shareholder Value
Growth
ROE
Risk Management by Silos (5, 6)
4. Risk oversight costs5. Insurance/hedging expense
6. Credit and market losses
7. Capital management8. Risk transparency
9. New business development
10. M&A/Diversification strategy
1. Risk-based pricing2. Target customer selection3. Relationship management
Risk Management Impact
Enterprise risk management (1-10)
Financial risk management (4–7)
11
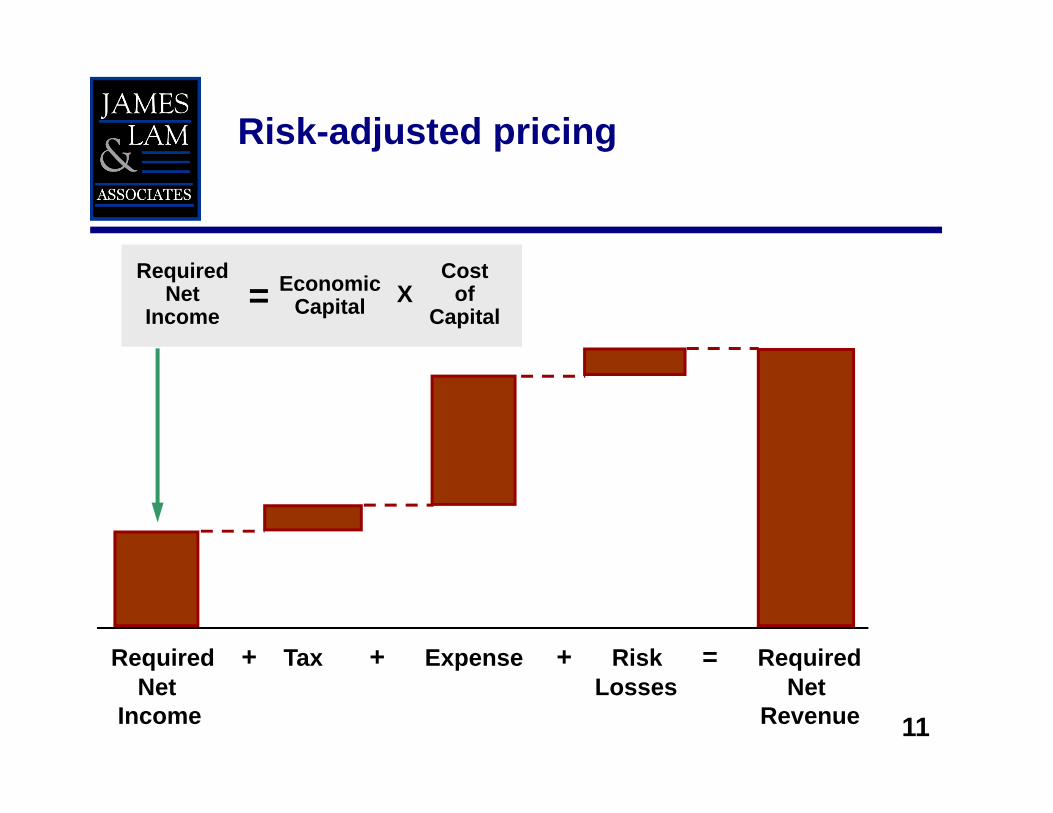
Risk-adjusted pricing
RequiredNet
IncomeEconomic
CapitalCost
of Capital
= X
Required + Tax + Expense + Risk = RequiredNet Losses Net
Income Revenue
12
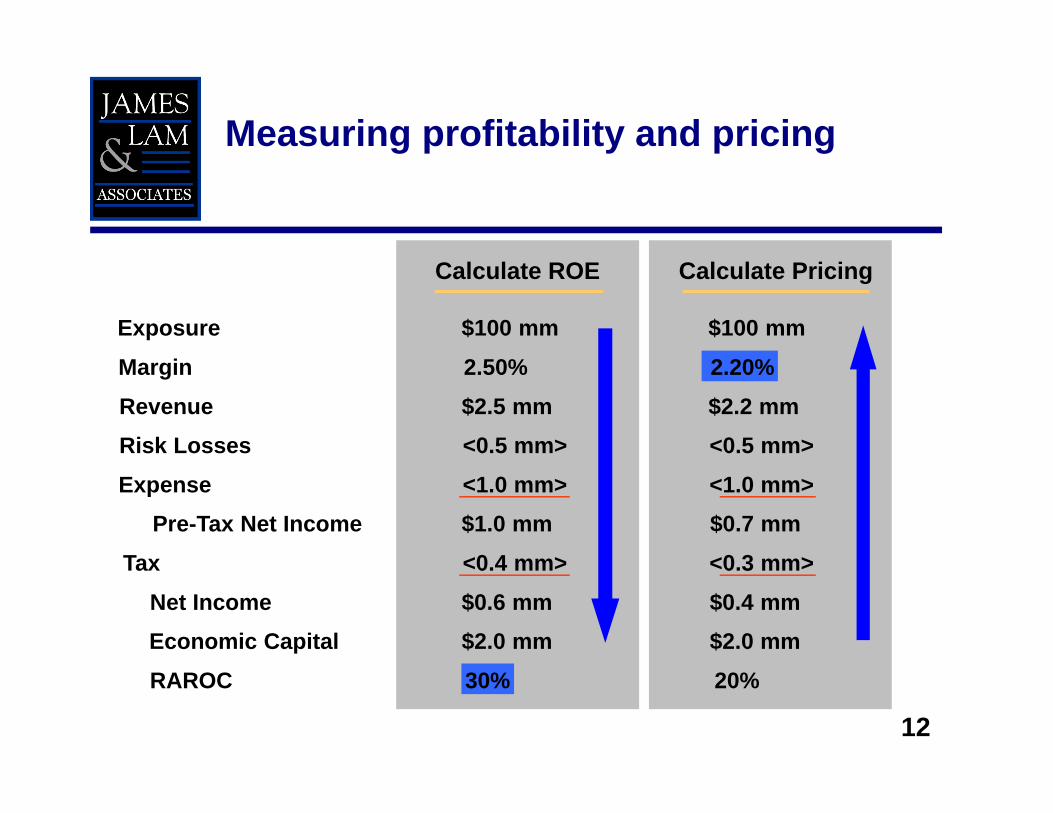
Calculate ROE Calculate Pricing
Exposure $100 mm $100 mmMargin 2.50%Revenue $2.5 mm $2.2 mmRisk Losses <0.5 mm> <0.5 mm>Expense <1.0 mm> <1.0 mm>
Pre-Tax Net Income $1.0 mm $0.7 mmTax <0.4 mm> <0.3 mm>
Net Income $0.6 mm $0.4 mmEconomic Capital $2.0 mm $2.0 mmRAROC 20%
Measuring profitability and pricing
2.20%
30%
13
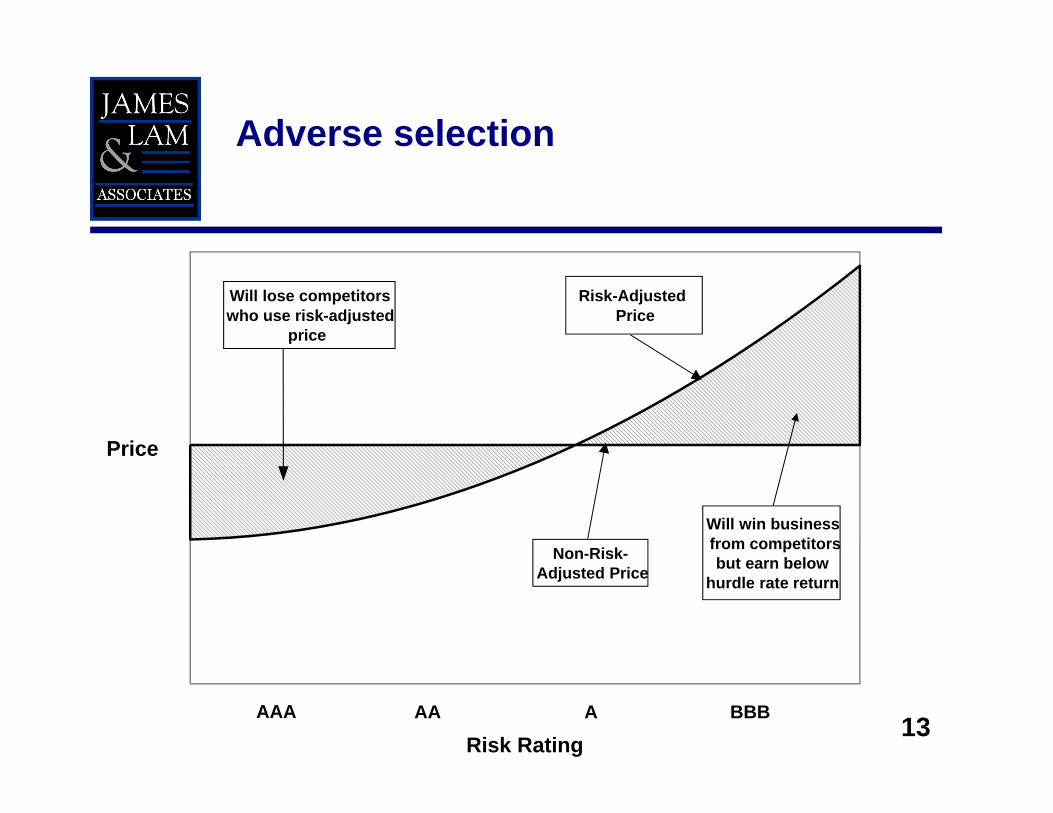
Adverse selection
Risk Rating
Price
Will lose competitorswho use risk-adjusted
price
Risk-AdjustedPrice
Non-Risk-Adjusted Price
AAA AAA BBB
Will win businessfrom competitorsbut earn below
hurdle rate return
14
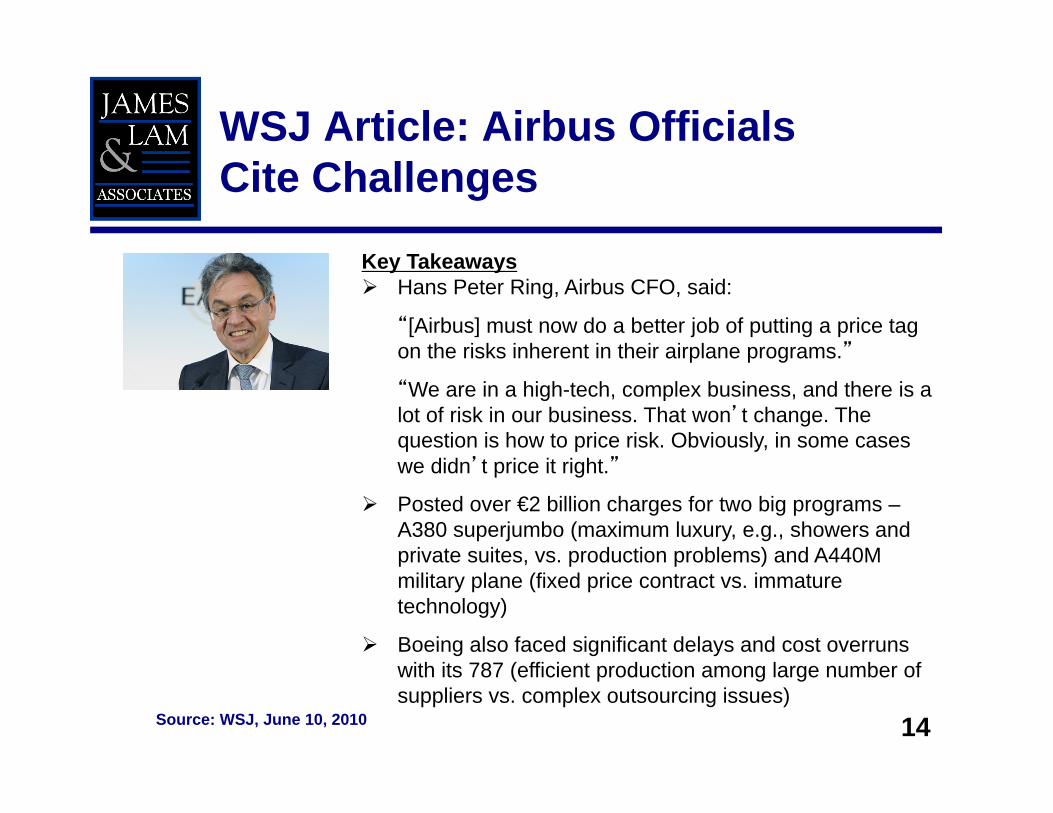
WSJ Article: Airbus Officials Cite Challenges
Source: WSJ, June 10, 2010
Key Takeaways Hans Peter Ring, Airbus CFO, said:
“[Airbus] must now do a better job of putting a price tag on the risks inherent in their airplane programs.”
“We are in a high-tech, complex business, and there is a lot of risk in our business. That won’t change. The question is how to price risk. Obviously, in some cases we didn’t price it right.”
Posted over €2 billion charges for two big programs –A380 superjumbo (maximum luxury, e.g., showers and private suites, vs. production problems) and A440M military plane (fixed price contract vs. immature technology)
Boeing also faced significant delays and cost overruns with its 787 (efficient production among large number of suppliers vs. complex outsourcing issues)
15
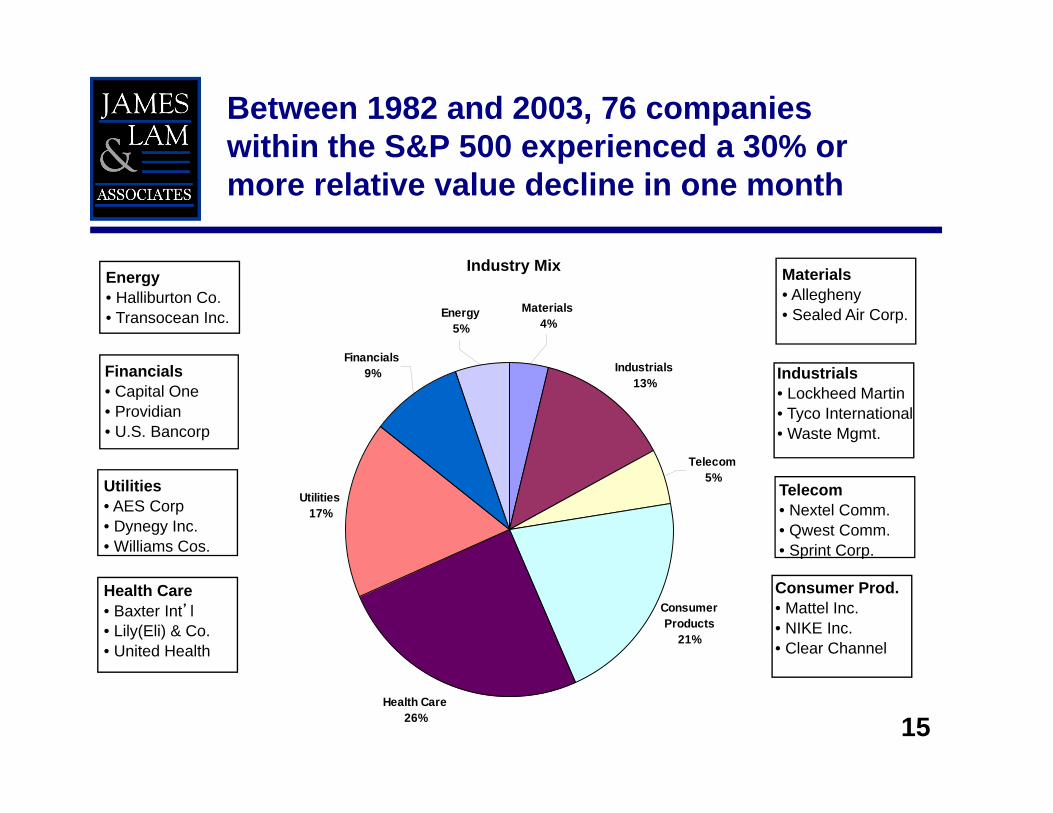
Between 1982 and 2003, 76 companies within the S&P 500 experienced a 30% or more relative value decline in one month
Industrials13%
Consumer Products
21%
Health Care26%
Utilities17%
Telecom5%
Financials9%
Materials4%
Energy5%
Energy• Halliburton Co. • Transocean Inc.
Financials• Capital One• Providian• U.S. Bancorp
Utilities• AES Corp• Dynegy Inc.• Williams Cos.
Health Care• Baxter Int’l• Lily(Eli) & Co.• United Health
Materials• Allegheny • Sealed Air Corp.
Industrials• Lockheed Martin• Tyco International• Waste Mgmt.
Telecom• Nextel Comm.• Qwest Comm.• Sprint Corp.
Consumer Prod.• Mattel Inc.• NIKE Inc. • Clear Channel
Industry Mix
16
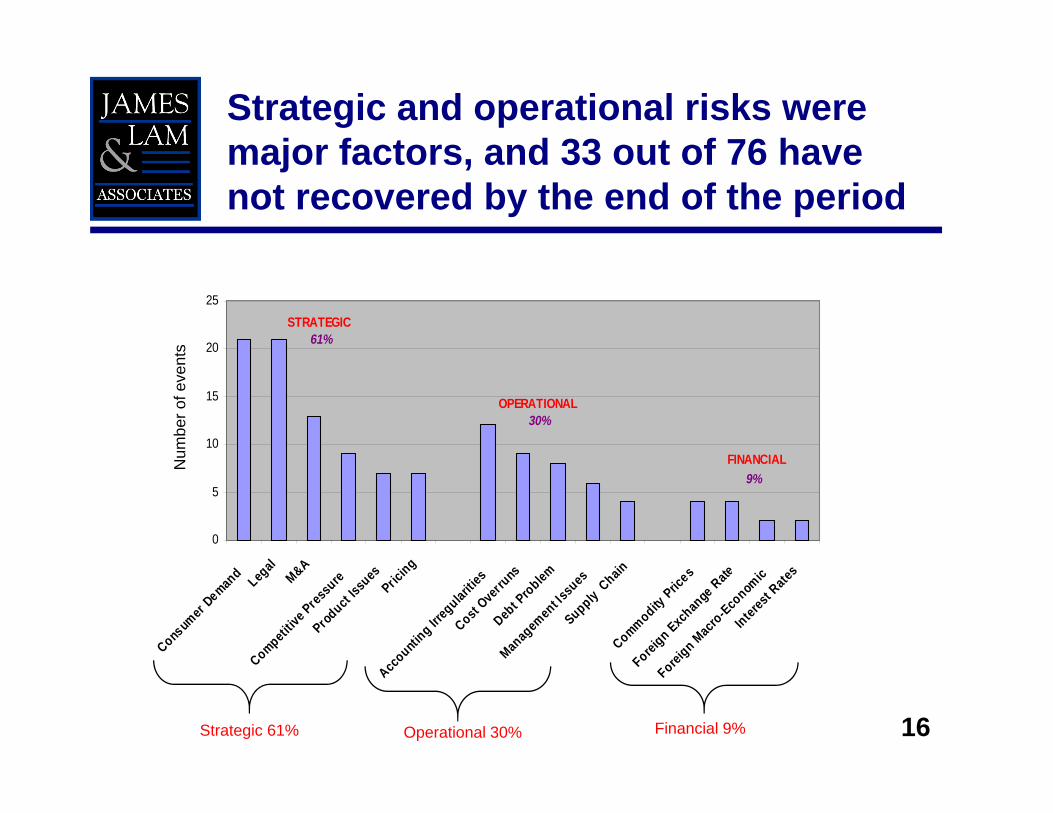
Strategic and operational risks were major factors, and 33 out of 76 have not recovered by the end of the period
FINANCIAL
OPERATIONAL30%
9%
STRATEGIC61%
0
5
10
15
20
25
Consum
er Deman
d Legal
M&A
Competitiv
e Pres
sure
Product
Issues
Pricing
Accounti
ng Irreg
ularitie
sCost
Overru
nsDeb
t Problem
Manag
emen
t Issu
esSupply
ChainCommodity
Prices
Foreign E
xchan
ge Rate
Foreign M
acro-Eco
nomic
Interes
t Rate
s
Num
ber o
f eve
nts
Strategic 61% Operational 30% Financial 9%
17
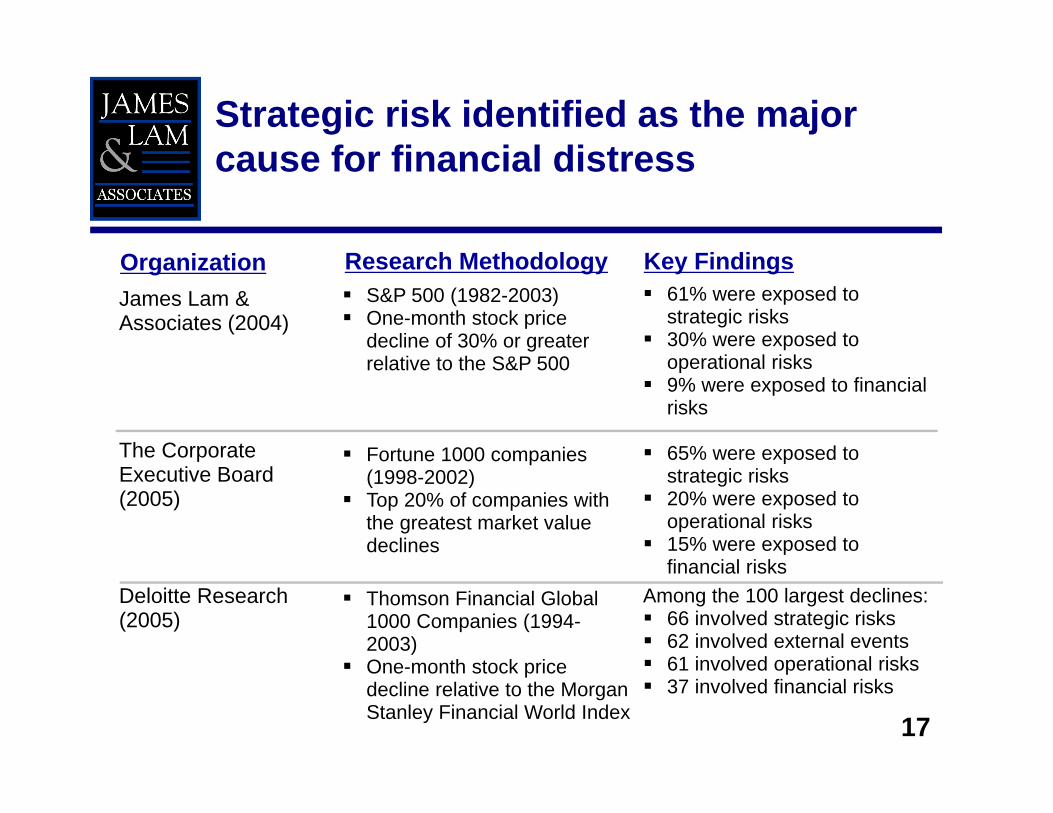
Strategic risk identified as the major cause for financial distress
Research Methodology Key FindingsOrganizationJames Lam & Associates (2004)
The Corporate Executive Board (2005)
Deloitte Research (2005)
S&P 500 (1982-2003) One-month stock price
decline of 30% or greater relative to the S&P 500
Fortune 1000 companies (1998-2002)
Top 20% of companies with the greatest market value declines
Thomson Financial Global 1000 Companies (1994-2003)
One-month stock price decline relative to the Morgan Stanley Financial World Index
61% were exposed to strategic risks
30% were exposed to operational risks
9% were exposed to financial risks
65% were exposed to strategic risks
20% were exposed to operational risks
15% were exposed to financial risks
Among the 100 largest declines: 66 involved strategic risks 62 involved external events 61 involved operational risks 37 involved financial risks
18
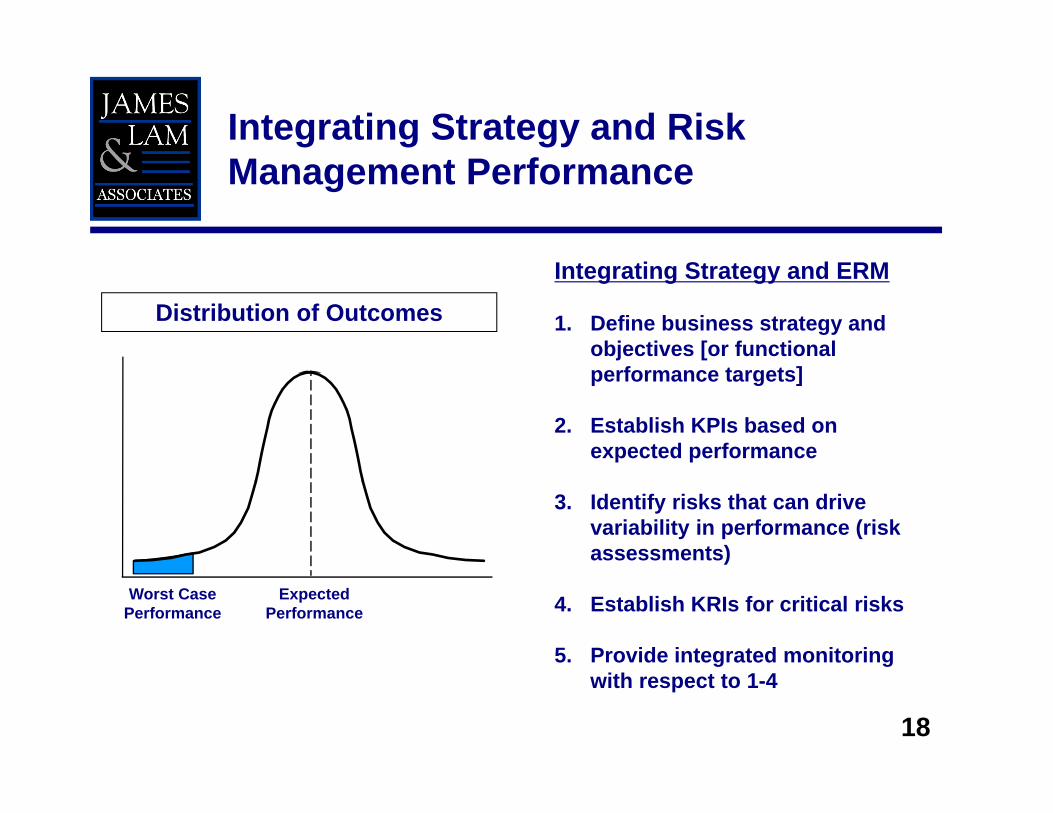
Integrating Strategy and Risk Management Performance
Worst CasePerformance
ExpectedPerformance
Distribution of Outcomes
Integrating Strategy and ERM
1. Define business strategy and objectives [or functional performance targets]
2. Establish KPIs based on expected performance
3. Identify risks that can drive variability in performance (risk assessments)
4. Establish KRIs for critical risks
5. Provide integrated monitoring with respect to 1-4
19
1. ERM is a robust and continuous management process, with its overall performance tracked in a feedback loop
2. In partnership with Finance, ERM supports the organization’s strategy and strategy execution processes
3. Data and analytics are interconnected from ERM, audit, compliance, and other key functions
4. A collaborative reporting system enables integrated analysis and reporting, including role-based dashboard reporting
5. ERM is fully integrated into board, corporate management, and business line decision-making
ERM 2.0 Vision: Shaping continuous risk management practices
20
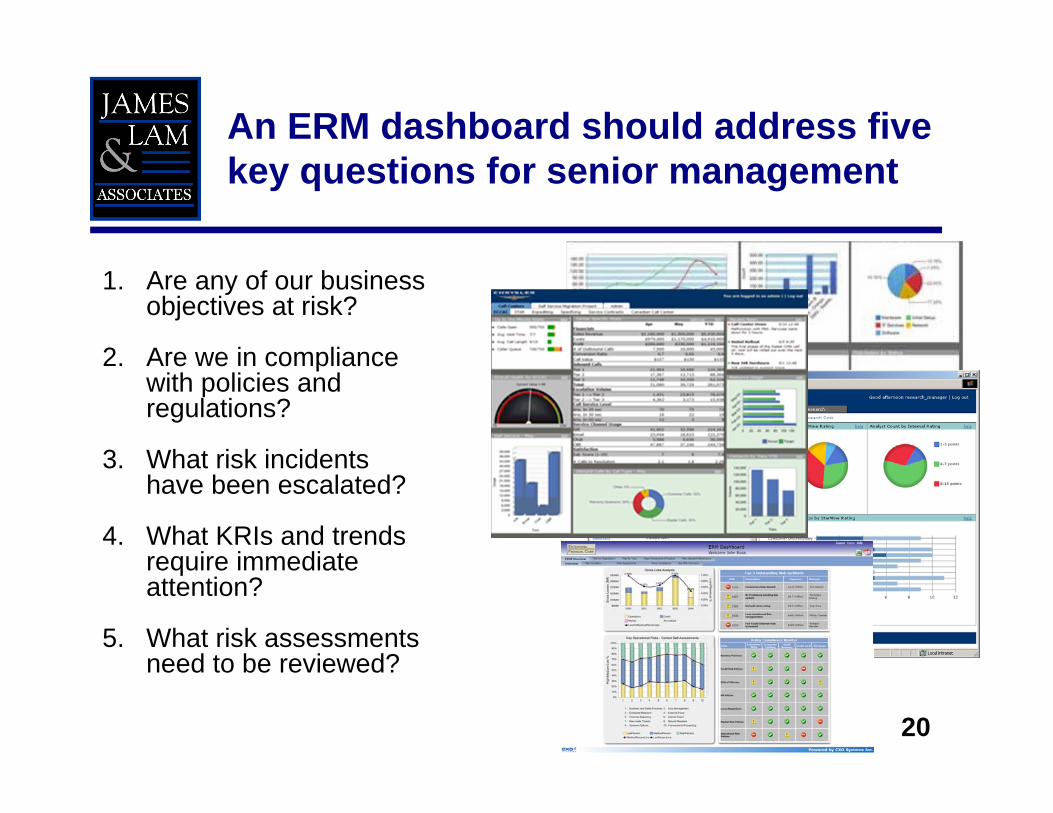
An ERM dashboard should address five key questions for senior management
1. Are any of our business objectives at risk?
2. Are we in compliance with policies and regulations?
3. What risk incidents have been escalated?
4. What KRIs and trends require immediate attention?
5. What risk assessments need to be reviewed?
21
One of the most critical questions facing risk professionals today
“How do you know if your risk management program is working effectively?”
22
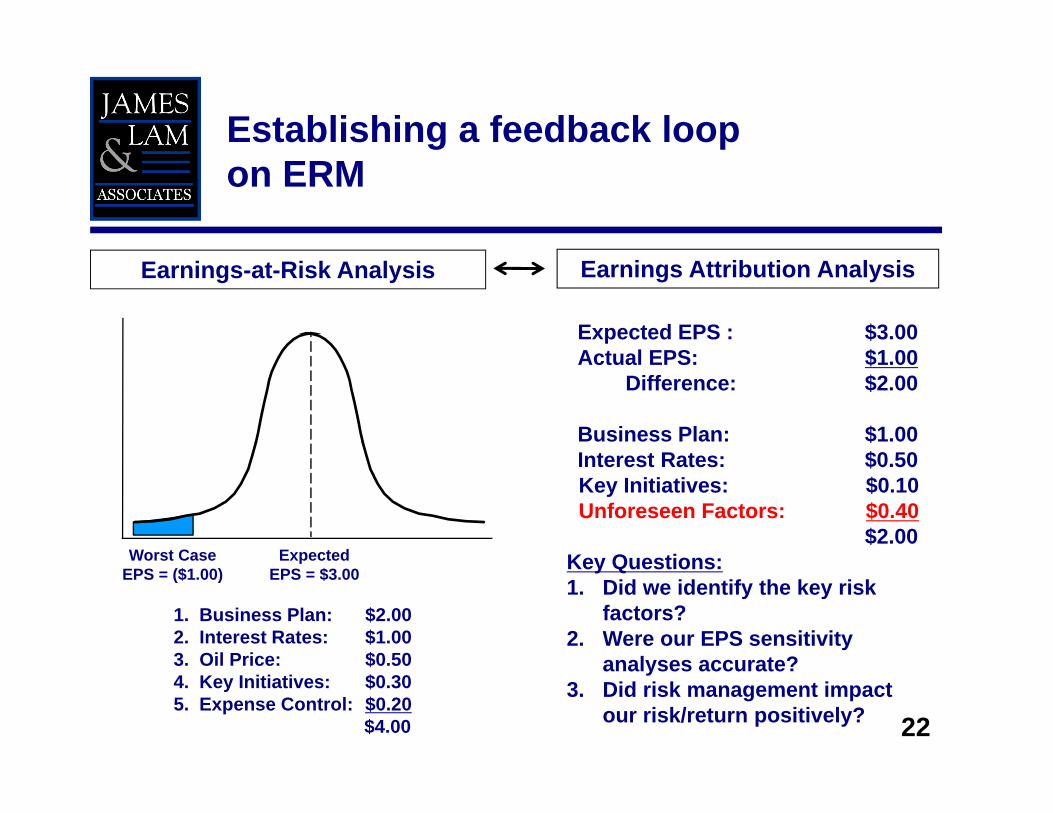
Establishing a feedback loop on ERM
Worst CaseEPS = ($1.00)
ExpectedEPS = $3.00
Earnings-at-Risk Analysis Earnings Attribution Analysis
1. Business Plan: $2.002. Interest Rates: $1.003. Oil Price: $0.504. Key Initiatives: $0.305. Expense Control: $0.20
$4.00
Expected EPS : $3.00Actual EPS: $1.00
Difference: $2.00
Business Plan: $1.00Interest Rates: $0.50Key Initiatives: $0.10Unforeseen Factors: $0.40
$2.00Key Questions:1. Did we identify the key risk
factors?2. Were our EPS sensitivity
analyses accurate?3. Did risk management impact
our risk/return positively?