Embed Size (px)
Citation preview
Research ArticleThe Pathology of Type II Modic Changes: Fat Deposition orOsteosclerosis? A Study Using CT Scan
Chi Sun,1 Hongli Wang,1 Jianyuan Jiang ,1 Feizhou Lu,1,2 XiaoshengMa,1 and Xinlei Xia1
1Department of Orthopedics, Huashan Hospital, Fudan University, Shanghai, China2The Fifth People’s Hospital of Shanghai, Fudan University, Shanghai, China
Correspondence should be addressed to Jianyuan Jiang; [email protected]
Received 5 January 2018; Revised 18 April 2018; Accepted 7 May 2018; Published 4 June 2018
Academic Editor: Enzo Terreno
Copyright © 2018 Chi Sun et al. This is an open access article distributed under the Creative Commons Attribution License, whichpermits unrestricted use, distribution, and reproduction in any medium, provided the original work is properly cited.
Study Design. A retrospective cross-sectional study of type II Modic changes (MCs). Objective. To evaluate the CT values of typeII MCs and determine their relationship with disc degeneration. Methods. 124 type II MCs from 66 patients’ MRI and CT wereincluded and analyzed. Disc degeneration adjacent to MCs was evaluated based on Pfirrmann classification. CT values of bonemarrow area and endplate from MC regions, adjacent non-MC regions, and L1 vertebra were measured. CT value changes (ΔCTvalue) were defined asMCs’ CT value minus non-MCs’. According to the types of variables, paired t-test, signed-rank test, two-wayANOVA, and Friedman test were used. Results. The CT value of MCs was significantly higher than that of non-MCs at both bonemarrow area and endplate (P<0.0001, resp.). Good consistency was found between non-MCs and L1 vertebra in the CT value ofbone marrow area and endplate (P=0.2129, P=0.2272, resp.), suggesting the control group was valid. Adjacent to type II MCs, therewere 8 (6.4%) discs with grade III degeneration, 58 (46.8%) with grade IV, and 58 (46.8%) with grade V.The ΔCT value of grade Vdisc degeneration was larger than that of grade IV at the endplate (P=0.0150). Conclusions. Osteosclerosismay exist in type II MCs.The more severe the degeneration of the adjacent disc, the greater the degree of osteosclerosis.
1. Introduction
Modic changes (MCs) are common on lumbar spineMRI andeven sometimes on the cervical or thoracic spine. MCs arelesions of the bonemarrow area and endplate and are thoughtto be associated with intervertebral disc degeneration (IDD).The prevalence rates of MCs range from 0.5% to 62% [1–3].First found by deRoos et al. [4],MCswere classified byModicet al. into three types [5, 6]. Traditionally, type II MCs (highT1W and T2W signals) are regarded as a stable and chronicfat deposition. While type I MCs (low T1W and high T2Wsignals) are thought to indicate inflammatory reactions, typeIII (low T1W and T2W signals) indicates osteosclerosis.
MCs have been studied for years. While type II MCs arethought to be relatively stable lesions, their relationship withclinical symptoms is unclear. Some reports believe that typeIIMCs could cause low back pain while other reports showedno correlation [7–10]. As for the kinematical characteristics ofMCs, Fan et al. thought type II MCs might increase angular
or translational motion in segments, which was previouslybelieved to be stable [11]. Although the real pathologicalprocess of these MCs remains unclear, Feng et al. foundnot only fat deposition but also inflammation in type IIMCs by using an MR fat suppression sequence [10]. Kuismaet al. reported that some sclerosis could be visualized onCT scans in the area of type II MCs [7]. However, theirstudy focused on the lower lumbar spine and evaluated theCT features of the bone marrow area of MCs, ignoring theendplate. Additionally, the relationship between sclerosis anddisc degeneration was not analyzed.
To date, most studies onMCs have been based onMRI byT1-weighted image (T1WI), T2-weighted image (T2WI), andfat suppression sequence, and few were conducted with CTscans. While MRI can show kinds of different tissues via var-ious T1W and T2W signals, CT provides vivid bony structureimage and precise CT value of tissues. We hypothesized that aspecific kind of pathological process, not only fat deposition,in type II MCs would show a particular CT value. Thus, our
HindawiBioMed Research InternationalVolume 2018, Article ID 6853720, 6 pageshttps://doi.org/10.1155/2018/6853720
2 BioMed Research International
study aimed to evaluate the CT values of type II MC regions,find their association with disc degeneration, and speculateabout the real pathological process.
2. Materials and Methods
2.1. Study Population. The population of this study consistedof patients coming to our hospital to receive lumbar spinesurgery from December 2013 to June 2015. All routine pre-operative imaging data (MRI and CT) were retrospectivelyreviewed by one author (H.W.) for the presence of any type ofMC. Patients were included if there were MCs in the lumbarspine on MRI. Patients with type I, type III, or mixed MCs(I and II or II and III) were excluded. Meanwhile, suspectedmetastatic lesions, scoliosis, lumbar spine infections, freshvertebral fractures, ankylosing spondylitis, lumbar instru-mentation, any lesions in L1 vertebra, and small signalchanges within a corner of vertebrae were also excluded.Thatis, only lumbar spine MRI with visible and classic type IIMCs and a healthy L1 vertebra were included for furtherassessment. The criteria for classic type II MCs were highT1W and T2W signals in the bone marrow area and endplate,based on the description from Modic et al. [5, 6]. Finally,a total of 66 patients were eligible. As we retrospectivelyassessed patients’ imaging data, the study was conductedwith the human subjects’ understanding and consent. TheEthical Committee of Huashan Hospital affiliated to FudanUniversity has approved the experiments.
2.2. MR Imaging. MRI was performed at our hospital using a3 T unit (MagnetomVerio, Siemens, Germany) and a phased-array torso coil. The fast-recovery fast spin-echo (frFSE)sequencewas used for scanning to acquire T2W. Sagittal T2Wparameters were TR/TE=1960 ms/106.3 ms, ST=4.0 mm, andmatrix=512∗512. Sagittal T1W was obtained by a fast spin-echo (FSE) sequence, with parameters TR/TE=340 ms/12.9ms, ST=4.0 mm, and matrix=512∗512.
2.3. CT Imaging. TheCT imaging was performed using a 64-slice CT scanner (Light Speed VCT, Siemens, Germany) witha detector configuration of 64 × 1.25 mm. A standard lumbarspinal protocol with a tube voltage of 130 kV, tube currentof 80-520 mA, and rotation time of 0.8 s was used. The slicethickness and reconstruction interval were 1.25mmand 0.625mm, respectively.
2.4. Qualitative andQuantitative ImageAnalysis. Disc degen-erations adjacent to MCs from L1 to S1 were evaluatedby one author (C.S.) from MR imaging data. The degreeof degeneration was graded on consecutive T2W imagesbased on the grading system of Pfirrmann et al. [12], withgrades I-V referring to different degrees. CT values of thebone marrow area and endplate from MC regions, adjacentnon-MC regions, and the L1 vertebra from the sagittalreconstructed CT planes were calculated. Non-MCs weredefined as the healthy regions at the same vertebra whereMCs presented. If both the upper and lower endplate ofa vertebra had MCs, then the adjacent non-MCs wouldcorrespondingly be defined as the area with larger CT values,
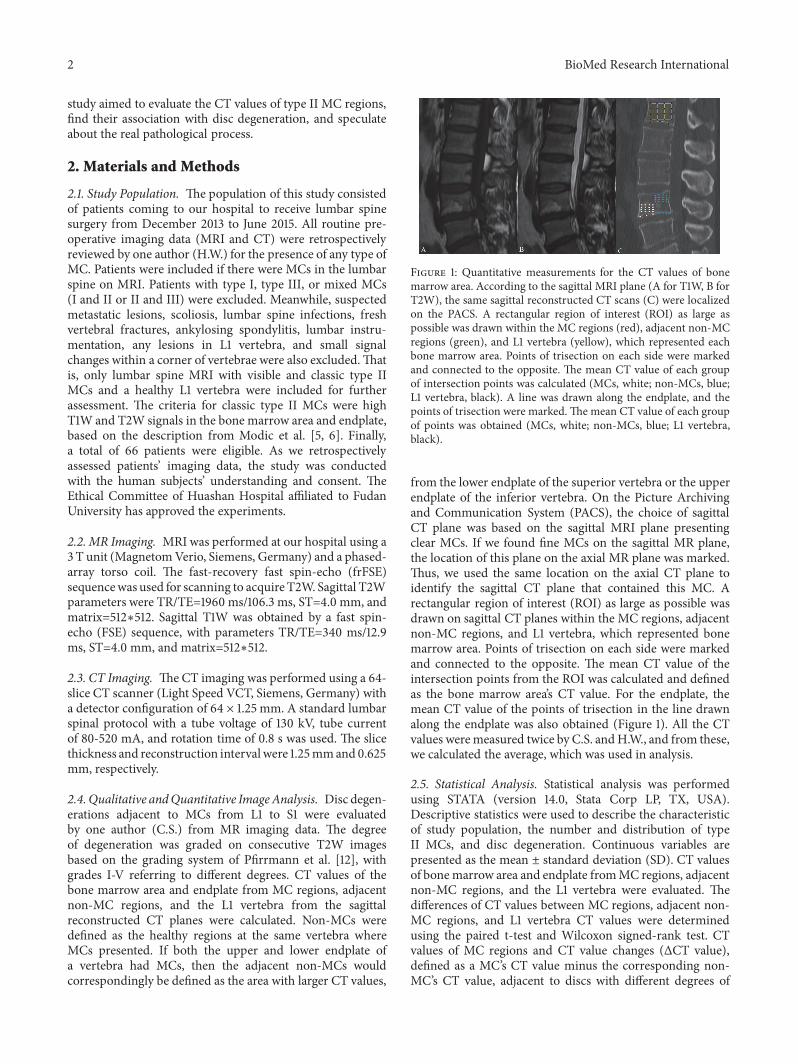
Figure 1: Quantitative measurements for the CT values of bonemarrow area. According to the sagittal MRI plane (A for T1W, B forT2W), the same sagittal reconstructed CT scans (C) were localizedon the PACS. A rectangular region of interest (ROI) as large aspossible was drawn within the MC regions (red), adjacent non-MCregions (green), and L1 vertebra (yellow), which represented eachbone marrow area. Points of trisection on each side were markedand connected to the opposite. The mean CT value of each groupof intersection points was calculated (MCs, white; non-MCs, blue;L1 vertebra, black). A line was drawn along the endplate, and thepoints of trisection were marked. The mean CT value of each groupof points was obtained (MCs, white; non-MCs, blue; L1 vertebra,black).
from the lower endplate of the superior vertebra or the upperendplate of the inferior vertebra. On the Picture Archivingand Communication System (PACS), the choice of sagittalCT plane was based on the sagittal MRI plane presentingclear MCs. If we found fine MCs on the sagittal MR plane,the location of this plane on the axial MR plane was marked.Thus, we used the same location on the axial CT plane toidentify the sagittal CT plane that contained this MC. Arectangular region of interest (ROI) as large as possible wasdrawn on sagittal CT planes within the MC regions, adjacentnon-MC regions, and L1 vertebra, which represented bonemarrow area. Points of trisection on each side were markedand connected to the opposite. The mean CT value of theintersection points from the ROI was calculated and definedas the bone marrow area’s CT value. For the endplate, themean CT value of the points of trisection in the line drawnalong the endplate was also obtained (Figure 1). All the CTvalues weremeasured twice by C.S. andH.W., and from these,we calculated the average, which was used in analysis.
2.5. Statistical Analysis. Statistical analysis was performedusing STATA (version 14.0, Stata Corp LP, TX, USA).Descriptive statistics were used to describe the characteristicof study population, the number and distribution of typeII MCs, and disc degeneration. Continuous variables arepresented as the mean ± standard deviation (SD). CT valuesof bonemarrow area and endplate fromMC regions, adjacentnon-MC regions, and the L1 vertebra were evaluated. Thedifferences of CT values between MC regions, adjacent non-MC regions, and L1 vertebra CT values were determinedusing the paired t-test and Wilcoxon signed-rank test. CTvalues of MC regions and CT value changes (ΔCT value),defined as a MC’s CT value minus the corresponding non-MC’s CT value, adjacent to discs with different degrees of

BioMed Research International 3
L2/3 L3/4 L4/5 L5/S1Lumbar disc level
0
10
20
30
40
50
60
70
The n
umbe
r of M
Cs
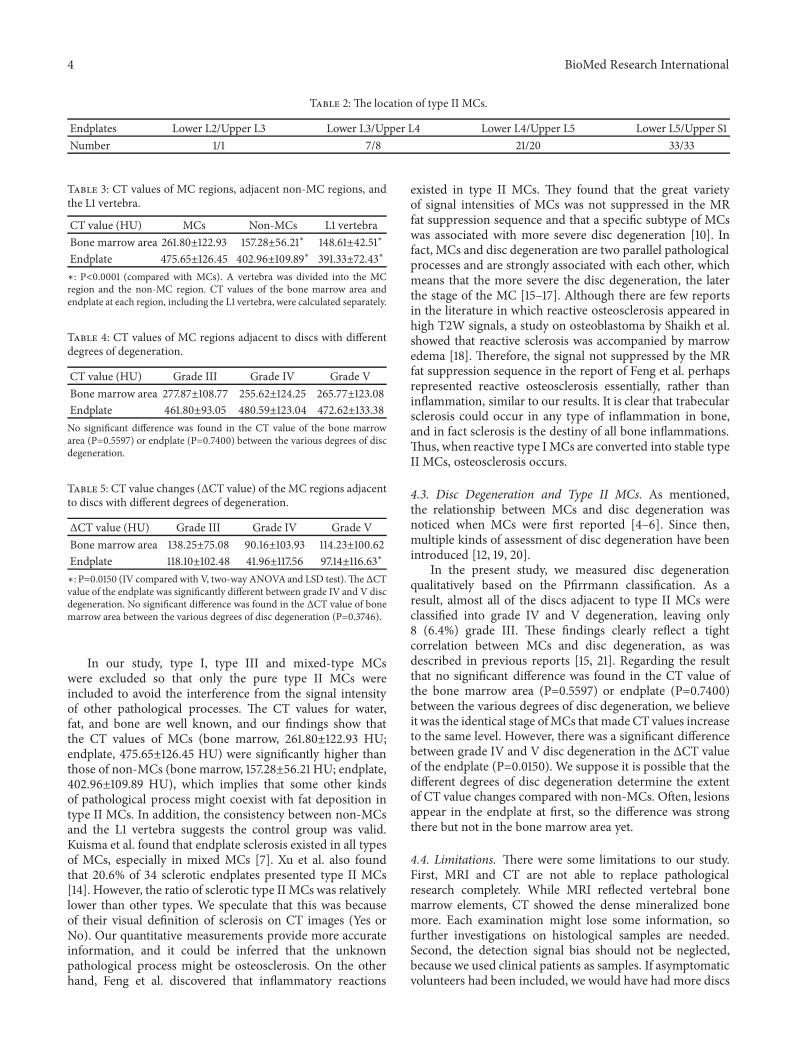
Figure 2: The distribution of type II MCs. As few occurred in L2/3andL3/4,MCsweremore likely to present in the lower lumbar spine,especially in L5/S1.
Table 1: Demography of patients.
Demography of PatientsSample Size of Patients 66Number of Type II MCs 124Gender (Male/Female) 36/30Age 59.94 (41-81) yearsBMI 25.05 (19.05-33.06) kg/m2
degeneration were compared using two-way ANOVA andthe Friedman test. A p value<0.05 was considered statisticaldifference.
3. Results
3.1. The Number and Distribution of Type II MCs. Our 66patients (36 males and 30 females) had a total of 124 type IIMCs.Themean age was 59.94 (41-81) years and themean BMIwas 25.05 (19.05-33.06) kg/m2 (Table 1). Of all the changes, 2(1.6%) were adjacent to the L2/3 intervertebral disc, 15 (12.1%)to L3/4, 41 (33.1%) to L4/5, and 66 (53.2%) to L5/S1 (Figure 2).MCs usually presented in pairs at the same lumbar level, asshown in Table 2.
3.2. CT Values of MC Regions, Adjacent Non-MC Regions,and L1 Vertebra. CT values of MC regions, adjacent non-MC regions, and the L1 vertebra are displayed in Table 3. Atbone marrow areas, the CT value of MCs was significantlyhigher than that of non-MCs (261.80±122.93 HU versus157.28±56.21 HU, P<0.0001) and that of the L1 vertebra(261.80±122.93 HU versus 148.61±42.51 HU, P<0.0001). Forthe endplates, MCs also had a higher CT value than non-MCs(475.65±126.45HU versus 402.96±109.89HU, P<0.0001) andthe L1 vertebra (475.65±126.45 HU versus 391.33±72.43 HU,P<0.0001).There was no significant difference between non-MCs and the L1 vertebra in the CT value of the bone marrowarea (157.28±56.21 HU versus 148.61±42.51 HU, P=0.2129) orthe endplate (402.96±109.89 HU versus 391.33±72.43 HU,P=0.2272).
3.3. Disc Degeneration and MCs. Adjacent to type II MCs,there were 8 (6.4%) discs with grade III degeneration, 58
Grade II Grade III Grade IV Grade VDisc degeneration
MCsnon-MCs
0
10
20
30
40
50
60
70
The n
umbe
r of d
iscs
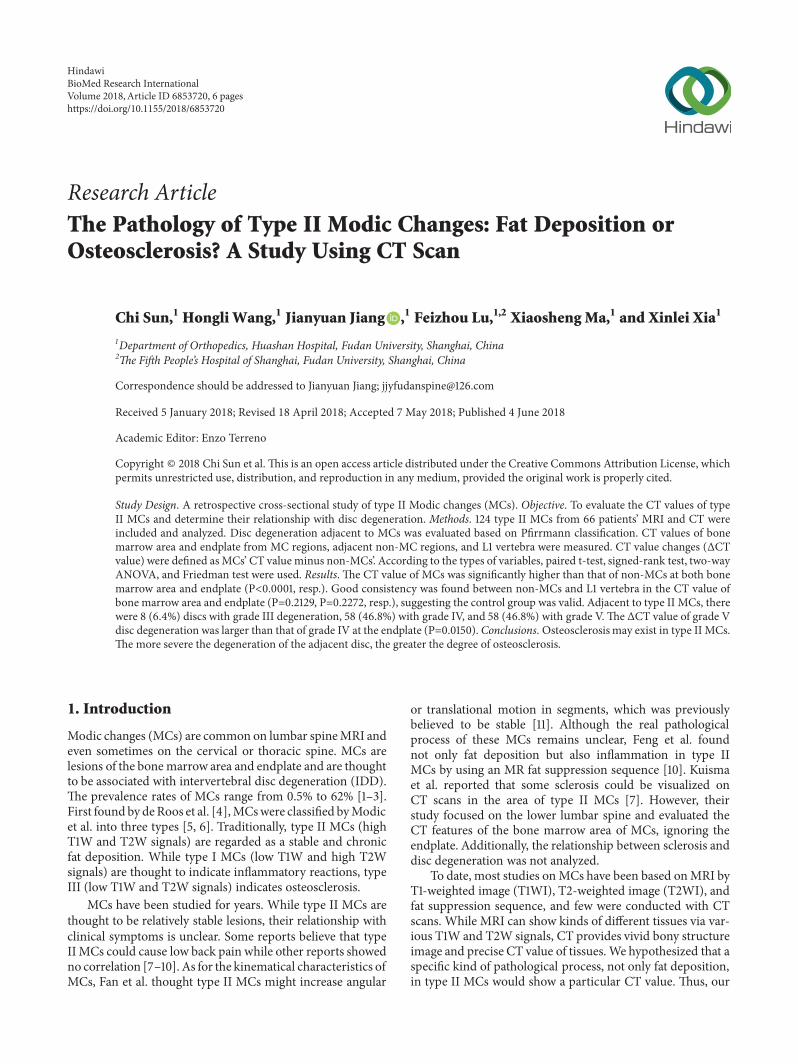
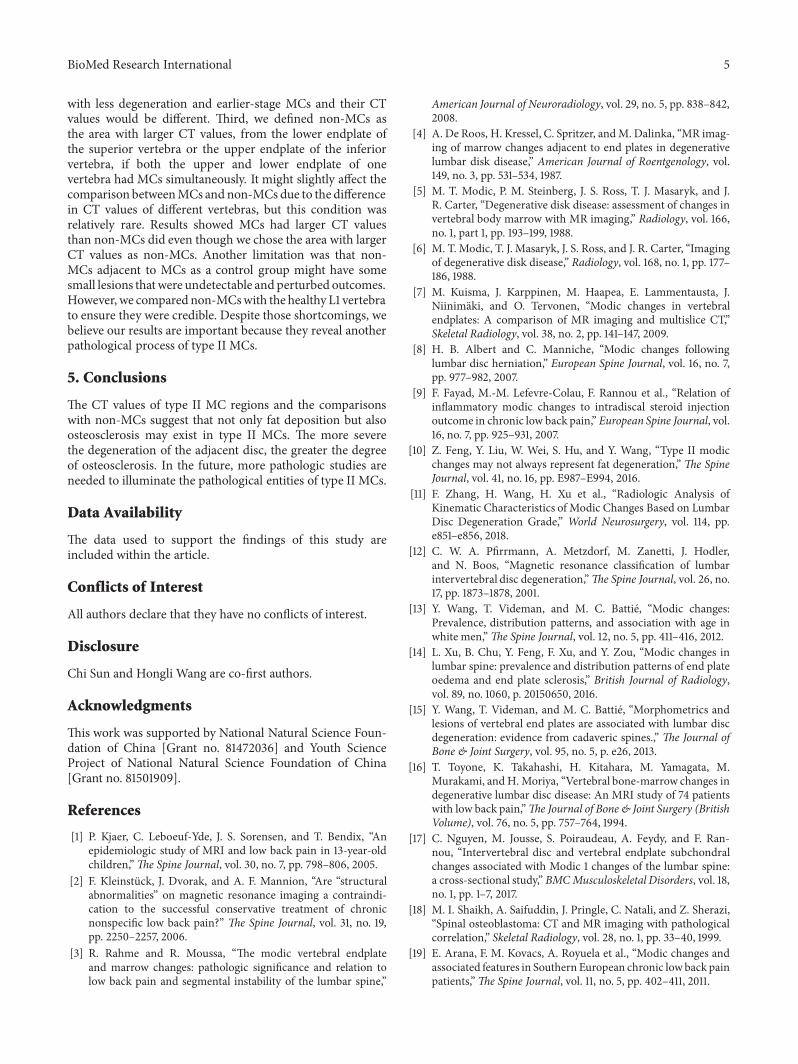
Figure 3: The number of discs with different degrees of degen-eration. Of all the discs adjacent to type II MCs, more than 90%had grade IV and V degeneration. No healthy discs were foundaccompanied by type IIMCs.Therewere less degenerative discs nearnon-MCs areas.
(46.8%)with grade IV, and 58 (46.8%)with gradeV.However,there were less degenerative discs near non-MCs areas (Fig-ure 3). CT values of MC regions and the ΔCT value adjacentto discs with different degrees of degeneration are presentedin Tables 4 and 5. There was no significant difference in theCT value of the bone marrow area (277.87±108.77 HU versus255.62±124.25 HU versus 265.77±123.08 HU, P=0.5597) orendplate (461.80±93.05 HU versus 480.59±123.04 HU versus472.62±133.38HU, P=0.7400) between the various degrees ofdisc degeneration. Nevertheless, the ΔCT value of grade Vdisc degeneration was larger than that of grade IV at the end-plate (97.14±116.63 HU versus 41.96±117.56 HU, P=0.0150),while no difference was found between them at the bonemarrow area (114.23±100.62 HU versus 90.16±103.93 HU,P=0.3746).
4. Discussion
4.1. The Characteristics of Distribution. As it is known toall, type II MCs are the most common among these threetypes and present in pairs. The distribution of type II MCsin our study was in accordance with past reports. A studyof 561 subjects revealed that about three-quarters (74.5%) ofendplates with MCs were in the lower lumbar spine (adjacentto L4/5 and L5/S1 discs) and were most frequently adjacent tothe L5/S1 disc [13]. In our results, the trend was in the samedirection but was even more pronounced: 107 (86.3%) type IIMCswere in the lower lumbar spine, and half of the total wereadjacent to L5/S1. These data suggest that the lower lumbarspine is more prone to type II MCs than other areas. Also,our results indicated that MCs were almost always mirrored.
4.2. Sclerosis in Type IIMCs. Type IIMCswere long regardedas fat deposition since their initial description byModic et al.,based on six histological samples [5, 6]. That idea was widelyaccepted, and little research has been conducted to investigatethe pathological entity ofMCs. Interestingly, the results of ourstudy are somewhat different from others.
4 BioMed Research International
Table 2: The location of type II MCs.
Endplates Lower L2/Upper L3 Lower L3/Upper L4 Lower L4/Upper L5 Lower L5/Upper S1Number 1/1 7/8 21/20 33/33
Table 3: CT values of MC regions, adjacent non-MC regions, andthe L1 vertebra.
CT value (HU) MCs Non-MCs L1 vertebraBone marrow area 261.80±122.93 157.28±56.21∗ 148.61±42.51∗
Endplate 475.65±126.45 402.96±109.89∗ 391.33±72.43∗
∗: P<0.0001 (compared with MCs). A vertebra was divided into the MCregion and the non-MC region. CT values of the bone marrow area andendplate at each region, including the L1 vertebra, were calculated separately.
Table 4: CT values of MC regions adjacent to discs with differentdegrees of degeneration.
CT value (HU) Grade III Grade IV Grade VBone marrow area 277.87±108.77 255.62±124.25 265.77±123.08Endplate 461.80±93.05 480.59±123.04 472.62±133.38No significant difference was found in the CT value of the bone marrowarea (P=0.5597) or endplate (P=0.7400) between the various degrees of discdegeneration.
Table 5: CT value changes (ΔCT value) of the MC regions adjacentto discs with different degrees of degeneration.
ΔCT value (HU) Grade III Grade IV Grade VBone marrow area 138.25±75.08 90.16±103.93 114.23±100.62Endplate 118.10±102.48 41.96±117.56 97.14±116.63∗
∗: P=0.0150 (IV compared with V, two-way ANOVAand LSD test).TheΔCTvalue of the endplate was significantly different between grade IV and V discdegeneration. No significant difference was found in the ΔCT value of bonemarrow area between the various degrees of disc degeneration (P=0.3746).
In our study, type I, type III and mixed-type MCswere excluded so that only the pure type II MCs wereincluded to avoid the interference from the signal intensityof other pathological processes. The CT values for water,fat, and bone are well known, and our findings show thatthe CT values of MCs (bone marrow, 261.80±122.93 HU;endplate, 475.65±126.45 HU) were significantly higher thanthose of non-MCs (bone marrow, 157.28±56.21 HU; endplate,402.96±109.89 HU), which implies that some other kindsof pathological process might coexist with fat deposition intype II MCs. In addition, the consistency between non-MCsand the L1 vertebra suggests the control group was valid.Kuisma et al. found that endplate sclerosis existed in all typesof MCs, especially in mixed MCs [7]. Xu et al. also foundthat 20.6% of 34 sclerotic endplates presented type II MCs[14]. However, the ratio of sclerotic type II MCs was relativelylower than other types. We speculate that this was becauseof their visual definition of sclerosis on CT images (Yes orNo). Our quantitative measurements provide more accurateinformation, and it could be inferred that the unknownpathological process might be osteosclerosis. On the otherhand, Feng et al. discovered that inflammatory reactions
existed in type II MCs. They found that the great varietyof signal intensities of MCs was not suppressed in the MRfat suppression sequence and that a specific subtype of MCswas associated with more severe disc degeneration [10]. Infact, MCs and disc degeneration are two parallel pathologicalprocesses and are strongly associated with each other, whichmeans that the more severe the disc degeneration, the laterthe stage of the MC [15–17]. Although there are few reportsin the literature in which reactive osteosclerosis appeared inhigh T2W signals, a study on osteoblastoma by Shaikh et al.showed that reactive sclerosis was accompanied by marrowedema [18]. Therefore, the signal not suppressed by the MRfat suppression sequence in the report of Feng et al. perhapsrepresented reactive osteosclerosis essentially, rather thaninflammation, similar to our results. It is clear that trabecularsclerosis could occur in any type of inflammation in bone,and in fact sclerosis is the destiny of all bone inflammations.Thus, when reactive type IMCs are converted into stable typeII MCs, osteosclerosis occurs.
4.3. Disc Degeneration and Type II MCs. As mentioned,the relationship between MCs and disc degeneration wasnoticed when MCs were first reported [4–6]. Since then,multiple kinds of assessment of disc degeneration have beenintroduced [12, 19, 20].
In the present study, we measured disc degenerationqualitatively based on the Pfirrmann classification. As aresult, almost all of the discs adjacent to type II MCs wereclassified into grade IV and V degeneration, leaving only8 (6.4%) grade III. These findings clearly reflect a tightcorrelation between MCs and disc degeneration, as wasdescribed in previous reports [15, 21]. Regarding the resultthat no significant difference was found in the CT value ofthe bone marrow area (P=0.5597) or endplate (P=0.7400)between the various degrees of disc degeneration, we believeit was the identical stage ofMCs that made CT values increaseto the same level. However, there was a significant differencebetween grade IV and V disc degeneration in the ΔCT valueof the endplate (P=0.0150). We suppose it is possible that thedifferent degrees of disc degeneration determine the extentof CT value changes compared with non-MCs. Often, lesionsappear in the endplate at first, so the difference was strongthere but not in the bone marrow area yet.
4.4. Limitations. There were some limitations to our study.First, MRI and CT are not able to replace pathologicalresearch completely. While MRI reflected vertebral bonemarrow elements, CT showed the dense mineralized bonemore. Each examination might lose some information, sofurther investigations on histological samples are needed.Second, the detection signal bias should not be neglected,because we used clinical patients as samples. If asymptomaticvolunteers had been included, we would have had more discs
BioMed Research International 5
with less degeneration and earlier-stage MCs and their CTvalues would be different. Third, we defined non-MCs asthe area with larger CT values, from the lower endplate ofthe superior vertebra or the upper endplate of the inferiorvertebra, if both the upper and lower endplate of onevertebra had MCs simultaneously. It might slightly affect thecomparison betweenMCs andnon-MCs due to the differencein CT values of different vertebras, but this condition wasrelatively rare. Results showed MCs had larger CT valuesthan non-MCs did even though we chose the area with largerCT values as non-MCs. Another limitation was that non-MCs adjacent to MCs as a control group might have somesmall lesions thatwere undetectable and perturbed outcomes.However, we compared non-MCswith the healthy L1 vertebrato ensure they were credible. Despite those shortcomings, webelieve our results are important because they reveal anotherpathological process of type II MCs.
5. Conclusions
The CT values of type II MC regions and the comparisonswith non-MCs suggest that not only fat deposition but alsoosteosclerosis may exist in type II MCs. The more severethe degeneration of the adjacent disc, the greater the degreeof osteosclerosis. In the future, more pathologic studies areneeded to illuminate the pathological entities of type II MCs.
Data Availability
The data used to support the findings of this study areincluded within the article.
Conflicts of Interest
All authors declare that they have no conflicts of interest.
Disclosure
Chi Sun and Hongli Wang are co-first authors.
Acknowledgments
This work was supported by National Natural Science Foun-dation of China [Grant no. 81472036] and Youth ScienceProject of National Natural Science Foundation of China[Grant no. 81501909].
References
[1] P. Kjaer, C. Leboeuf-Yde, J. S. Sorensen, and T. Bendix, “Anepidemiologic study of MRI and low back pain in 13-year-oldchildren,”The Spine Journal, vol. 30, no. 7, pp. 798–806, 2005.
[2] F. Kleinstuck, J. Dvorak, and A. F. Mannion, “Are “structuralabnormalities” on magnetic resonance imaging a contraindi-cation to the successful conservative treatment of chronicnonspecific low back pain?” The Spine Journal, vol. 31, no. 19,pp. 2250–2257, 2006.
[3] R. Rahme and R. Moussa, “The modic vertebral endplateand marrow changes: pathologic significance and relation tolow back pain and segmental instability of the lumbar spine,”
American Journal of Neuroradiology, vol. 29, no. 5, pp. 838–842,2008.
[4] A. De Roos, H. Kressel, C. Spritzer, andM. Dalinka, “MR imag-ing of marrow changes adjacent to end plates in degenerativelumbar disk disease,” American Journal of Roentgenology, vol.149, no. 3, pp. 531–534, 1987.
[5] M. T. Modic, P. M. Steinberg, J. S. Ross, T. J. Masaryk, and J.R. Carter, “Degenerative disk disease: assessment of changes invertebral body marrow with MR imaging,” Radiology, vol. 166,no. 1, part 1, pp. 193–199, 1988.
[6] M. T. Modic, T. J. Masaryk, J. S. Ross, and J. R. Carter, “Imagingof degenerative disk disease,” Radiology, vol. 168, no. 1, pp. 177–186, 1988.
[7] M. Kuisma, J. Karppinen, M. Haapea, E. Lammentausta, J.Niinimaki, and O. Tervonen, “Modic changes in vertebralendplates: A comparison of MR imaging and multislice CT,”Skeletal Radiology, vol. 38, no. 2, pp. 141–147, 2009.
[8] H. B. Albert and C. Manniche, “Modic changes followinglumbar disc herniation,” European Spine Journal, vol. 16, no. 7,pp. 977–982, 2007.
[9] F. Fayad, M.-M. Lefevre-Colau, F. Rannou et al., “Relation ofinflammatory modic changes to intradiscal steroid injectionoutcome in chronic low back pain,” European Spine Journal, vol.16, no. 7, pp. 925–931, 2007.
[10] Z. Feng, Y. Liu, W. Wei, S. Hu, and Y. Wang, “Type II modicchanges may not always represent fat degeneration,” The SpineJournal, vol. 41, no. 16, pp. E987–E994, 2016.
[11] F. Zhang, H. Wang, H. Xu et al., “Radiologic Analysis ofKinematic Characteristics of Modic Changes Based on LumbarDisc Degeneration Grade,” World Neurosurgery, vol. 114, pp.e851–e856, 2018.
[12] C. W. A. Pfirrmann, A. Metzdorf, M. Zanetti, J. Hodler,and N. Boos, “Magnetic resonance classification of lumbarintervertebral disc degeneration,”The Spine Journal, vol. 26, no.17, pp. 1873–1878, 2001.
[13] Y. Wang, T. Videman, and M. C. Battie, “Modic changes:Prevalence, distribution patterns, and association with age inwhite men,”The Spine Journal, vol. 12, no. 5, pp. 411–416, 2012.
[14] L. Xu, B. Chu, Y. Feng, F. Xu, and Y. Zou, “Modic changes inlumbar spine: prevalence and distribution patterns of end plateoedema and end plate sclerosis,” British Journal of Radiology,vol. 89, no. 1060, p. 20150650, 2016.
[15] Y. Wang, T. Videman, and M. C. Battie, “Morphometrics andlesions of vertebral end plates are associated with lumbar discdegeneration: evidence from cadaveric spines.,” The Journal ofBone & Joint Surgery, vol. 95, no. 5, p. e26, 2013.
[16] T. Toyone, K. Takahashi, H. Kitahara, M. Yamagata, M.Murakami, and H. Moriya, “Vertebral bone-marrow changes indegenerative lumbar disc disease: An MRI study of 74 patientswith low back pain,”The Journal of Bone & Joint Surgery (BritishVolume), vol. 76, no. 5, pp. 757–764, 1994.
[17] C. Nguyen, M. Jousse, S. Poiraudeau, A. Feydy, and F. Ran-nou, “Intervertebral disc and vertebral endplate subchondralchanges associated with Modic 1 changes of the lumbar spine:a cross-sectional study,” BMCMusculoskeletal Disorders, vol. 18,no. 1, pp. 1–7, 2017.
[18] M. I. Shaikh, A. Saifuddin, J. Pringle, C. Natali, and Z. Sherazi,“Spinal osteoblastoma: CT and MR imaging with pathologicalcorrelation,” Skeletal Radiology, vol. 28, no. 1, pp. 33–40, 1999.
[19] E. Arana, F. M. Kovacs, A. Royuela et al., “Modic changes andassociated features in Southern European chronic lowback painpatients,”The Spine Journal, vol. 11, no. 5, pp. 402–411, 2011.

6 BioMed Research International
[20] J. H. Maatta, J. I. Karppinen, K. D. K. Luk, K. M. C. Cheung,and D. Samartzis, “Phenotype profiling of Modic changes of thelumbar spine and its association with other MRI phenotypes: Alarge-scale population-based study,” The Spine Journal, vol. 15,no. 9, pp. 1933–1942, 2015.
[21] N. A. Farshad-Amacker, A. Hughes, R. J. Herzog, B. Seifert,and M. Farshad, “The intervertebral disc, the endplates and thevertebral bonemarrow as a unit in the process of degeneration,”European Radiology, vol. 27, no. 6, pp. 2507–2520, 2017.

Stem Cells International
Hindawiwww.hindawi.com Volume 2018
Hindawiwww.hindawi.com Volume 2018
MEDIATORSINFLAMMATION
of
EndocrinologyInternational Journal of
Hindawiwww.hindawi.com Volume 2018
Hindawiwww.hindawi.com Volume 2018
Disease Markers
Hindawiwww.hindawi.com Volume 2018
BioMed Research International
OncologyJournal of
Hindawiwww.hindawi.com Volume 2013
Hindawiwww.hindawi.com Volume 2018
Oxidative Medicine and Cellular Longevity
Hindawiwww.hindawi.com Volume 2018
PPAR Research
Hindawi Publishing Corporation http://www.hindawi.com Volume 2013Hindawiwww.hindawi.com
The Scientific World Journal
Volume 2018
Immunology ResearchHindawiwww.hindawi.com Volume 2018
Journal of
ObesityJournal of
Hindawiwww.hindawi.com Volume 2018
Hindawiwww.hindawi.com Volume 2018
Computational and Mathematical Methods in Medicine
Hindawiwww.hindawi.com Volume 2018
Behavioural Neurology
OphthalmologyJournal of
Hindawiwww.hindawi.com Volume 2018
Diabetes ResearchJournal of
Hindawiwww.hindawi.com Volume 2018
Hindawiwww.hindawi.com Volume 2018
Research and TreatmentAIDS
Hindawiwww.hindawi.com Volume 2018
Gastroenterology Research and Practice
Hindawiwww.hindawi.com Volume 2018
Parkinson’s Disease
Evidence-Based Complementary andAlternative Medicine
Volume 2018Hindawiwww.hindawi.com
Submit your manuscripts atwww.hindawi.com