Embed Size (px)
Citation preview

5/13/2015
1
The Paul L. Busch AwardRecognizing Significant Advances
in Water Quality Research
Wednesday, May 13, 20152:00 ‐ 3:30 pm ET
How to Participate Today
• Audio Modes
• Listen using Mic & Speakers
• Or, select “Use Telephone” and dial the conference (please remember long distance phone charges apply).
• Submit your questions using the Questions pane.
• A recording will be availablefor replay shortly after thiswebcast.

5/13/2015
2
Today’s Moderator
Amit Pramanik, Ph.D., BCEEMDirector of [email protected]
571‐384‐2101
Today’s Agenda2:00 pm Welcome and Introductions Doug Owen / Amit Pramanik
2:10 pm Nexus of Water Sustainability and Public Health:Antibiotic Resistance in Recycled Water Amy Pruden
2:40 pm The Interplay Between Chemicals and Microorganisms inUrban Water Systems Nancy Love
2:55 pm Engineered Platforms and Pathways for Resource Recovery from “Waste”Kartik Chandran
3:10 pm Engineering Better Biofilms: Rational Design of Attachment Surfaces to Improve Their Performance Andrew Schuler
3:25 pm Panel discussion / Q&A All
3:40 pm Adjourn

5/13/2015
3
Douglas Owen, P.E., BCEE, ENV SPARCADISWERF Board of Directors
Paul L. BuschAward
“WERF’s goal of developing the scientific understanding and the technology which will
improve the environment in a sustainable manner is a goal which everyone in our profession can
share.” – Paul Busch

5/13/2015
4
The Paul L. Busch Award
• 2001 ‐ NANCY LOVE
• 2002 ‐ LUTGARDE RASKIN
• 2003 ‐ DAVID SEDLAK
• 2004 ‐ BRUCE LOGAN
• 2005 ‐ DANIEL R. NOGUERA
• 2006 ‐ PAUL WESTERHOFF
• 2007 ‐ PAIGE NOVAK
• 2008 ‐ ANDREW SCHULER
• 2009 ‐ JAEHONG KIM
• 2010 ‐ KARTIK CHANDRAN
• 2011 ‐ VOLODYMYR TARABARA
• 2012 ‐ ROBERT NERENBERG
• 2013 ‐ CHUL PARK
• 2014 ‐ AMY PRUDEN
To learn more, go to:
http://www.werf.org/i/Awards/a/Awards/Awards.aspx
Click on “The Paul L. Busch Award” link
Amy J. Pruden, Ph.D.Virginia Tech
Nancy G. Love, Ph.D., P.E., BCEEUniversity of Michigan
Kartik Chandran, Ph.D.Columbia University
Andrew Schuler, Ph.D.University of New Mexico

5/13/2015
5
Amy J. Pruden, Ph.D.Virginia Tech
2014 Paul L. Busch Award Recipient
Nexus of Water Sustainability and Public Health:Antibiotic Resistance in Recycled Water
Paul L. Busch Award 2014
Via Department of Civil & Environmental Engineering
Image: Rodney M. Donlan, CDC
Amy Pruden
Professor

5/13/2015
6
Human Progress: Our Water Infrastructure
Our Water Infrastructure
Images: Tracey Saxby, IAN Image Library; Ixnayonthetimmay; Leo 'Jace' Anderson‐ FEMA
Picture Credit: Marc Edwards

5/13/2015
7
Recycled Water
• Need for Water Sustainability
• Direct and Indirect Potable Reuse
• Nonpotable Reuse
• Role of bacterial regrowth for
microbial constituents of emerging concern– Opportunistic Pathogens (OPs, e.g., Legionella)
– Antibiotic Resistance Genes (ARGs)
INDIRECT
DIRECT
NON‐POTABLE
In addition to access to clean water, antibiotics are
largely responsible for the high quality of life we enjoy
today
CDC, MMWR, July 30, 1999 / 48(29);621‐629
1900
1997
Bacterial infections

5/13/2015
8
15
INCREASED
RESISTANCE
DECREASED ANTIBIOTIC
DEVELOPMENT
Spellberg, B. 2010.
Spellberg, B. 2010.
Sustainability of Antibiotic Use
Antibiotic Resistance in the U.S.
• September 2013 CDC Report:• 2 million Americans fall ill from antibiotic‐resistant bacteria
• At least 23,000 die as a result (many more if count complications)
• Community‐acquired MRSA now surpasses hospital‐acquired MRSA
“Antibiotic-resistant infections can happen anywhere. Data show that most happen in the general community”

5/13/2015
9
Antibiotic Resistance Genes (ARGs) as Environmental Contaminants
Plasmid DNA
Chromosomal DNA
Transposon
Integron
ARG
Antibiotic Resistance
Mutations inchromosome
Mobilegenetic elements
(Antibiotic ResistanceGenes or ARG)
Horizontal Gene Transfer (HGT): Traditional approach of killing bacteria may not be sufficient- ideally should think about destroying ARGs.
Artistic Credit: Heather Storteboom

5/13/2015
10
Antibiotic Resistance Genes (ARGs)
Selective
Pressure
Selective
Pressure
Water Reuse
Run off
ARGs Correlate with Animal Feeding Operations and WWTPs in the Poudre River Watershed
sul1(R2=0.92, p<0.001)!
Pruden et al. ES&T 2012

5/13/2015
11
Microbial Ecology in Pipe Biofilms
Natural Transformation
Transduction
Conjugation
Selective Predation
Uptake by Amoeba
Amoeba encystment
HorizontalGene
Transfer
Extracellular Polymeric
Substances
Selective Pressure
Necrotrophic Growth
Additional Parameters Contributing to Regrowth:
Decay of Disinfectant Residual
Stagnation
Elevated nutrient (C,N,P) concentration
Temperature
Artistic Credit: Emily Garner
tet(
A)
gene
cop
ies/
mL
101
102
103
104
105
106
tet(
O)
gene
cop
ies/
mL
101
102
103
104
105
106
Aa-
PO
EA
b-1P
OE
Ab-
2PO
EA
-2P
OU
A-5
PO
UA
-8P
OU
A-1
PO
UA
-3P
OU
A-4
PO
UA
-7P
OU
A-6
PO
U
vanA
gen
e co
pies
/mL
101
102
103
104
105
106
erm
F g
ene
copi
es/m
L
101
102
103
104
105
106
sul1
gen
e co
pies
/mL
101
102
103
104
105
106
Aa-
PO
EA
b-1P
OE
Ab-
2PO
EA
-2P
OU
A-5
PO
UA
-8P
OU
A-1
PO
UA
-3P
OU
A-4
PO
UA
-7P
OU
A-6
PO
U
sul2
gen
e co
pies
/mL
101
102
103
104
105
106
ermF
sul1
sul2
tet(A)
tet(O)
vanA
Fahrenfeld et al. Frontiers in Microbiology 2013
∙Most ARGs detectable at the point‐of‐use, but not exiting treatment plant
∙ vanA detectable throughout
∙ Highlights importanceof considering the microbiology that happens as water flows through pipes
Reclaimed Water Pipes

5/13/2015
12
Irrigating Soil Slurries with Reclaimed Watersul1 sul2
tet(W)tet(O)
Fahrenfeld et al. Frontiers in Microbiology 2013
Potential Mitigation Endpoints
• Comparable to a defined control background
– ARG diversity
– ARG abundance
– Absence of key clinical ARGs (e.g., NDM‐1)
– All of the above: HGT/multi‐drug markers

5/13/2015
13
Objective: Paul L. Busch Award
• Compare ARGs in reclaimed and potable water distribution systems
– Potable water is an important “control”
– Potable water distribution system management can inform distribution of recycled water
– Examine role of microbial re‐growth
– Use next generation DNA sequencing for deep insight into microbial community and ARGs
– Compare with culture‐based methods
Distribution System Survey
– Before treatment
– Point of Entry
– 5 Dist. System (Point of Use)
Water Chemistry
– pH, temperature, disinfectant residual, DO, turbidity, metals, anions
Bulk Water
Biofilm
Sample Collection
5/13/2015
14
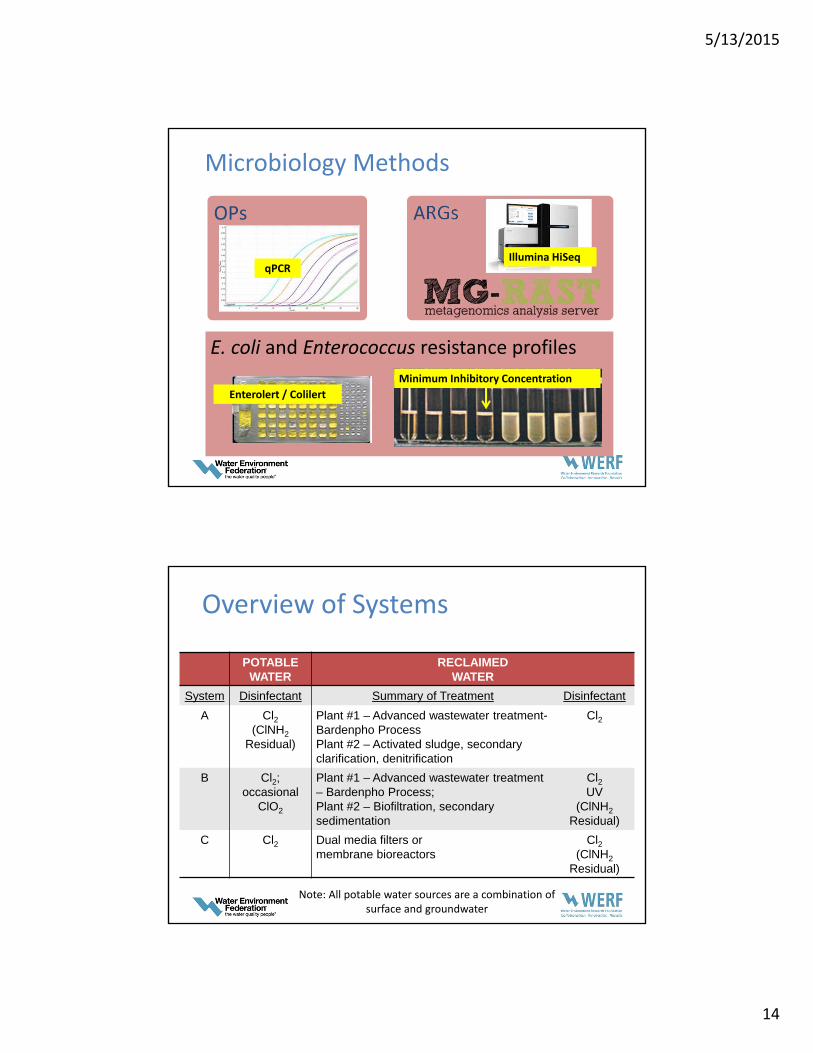
Microbiology Methods
E. coli and Enterococcus resistance profiles
ARGs
Minimum Inhibitory Concentration
Illumina HiSeq
OPs
qPCR
Enterolert / Colilert
Overview of Systems
POTABLEWATER
RECLAIMED WATER
System Disinfectant Summary of Treatment Disinfectant
A Cl2(ClNH2
Residual)
Plant #1 – Advanced wastewater treatment-Bardenpho ProcessPlant #2 – Activated sludge, secondary clarification, denitrification
Cl2
B Cl2; occasional
ClO2
Plant #1 – Advanced wastewater treatment – Bardenpho Process; Plant #2 – Biofiltration, secondary sedimentation
Cl2
UV(ClNH2
Residual)
C Cl2 Dual media filters ormembrane bioreactors
Cl2(ClNH2
Residual)
Note: All potable water sources are a combination of surface and groundwater
5/13/2015
15
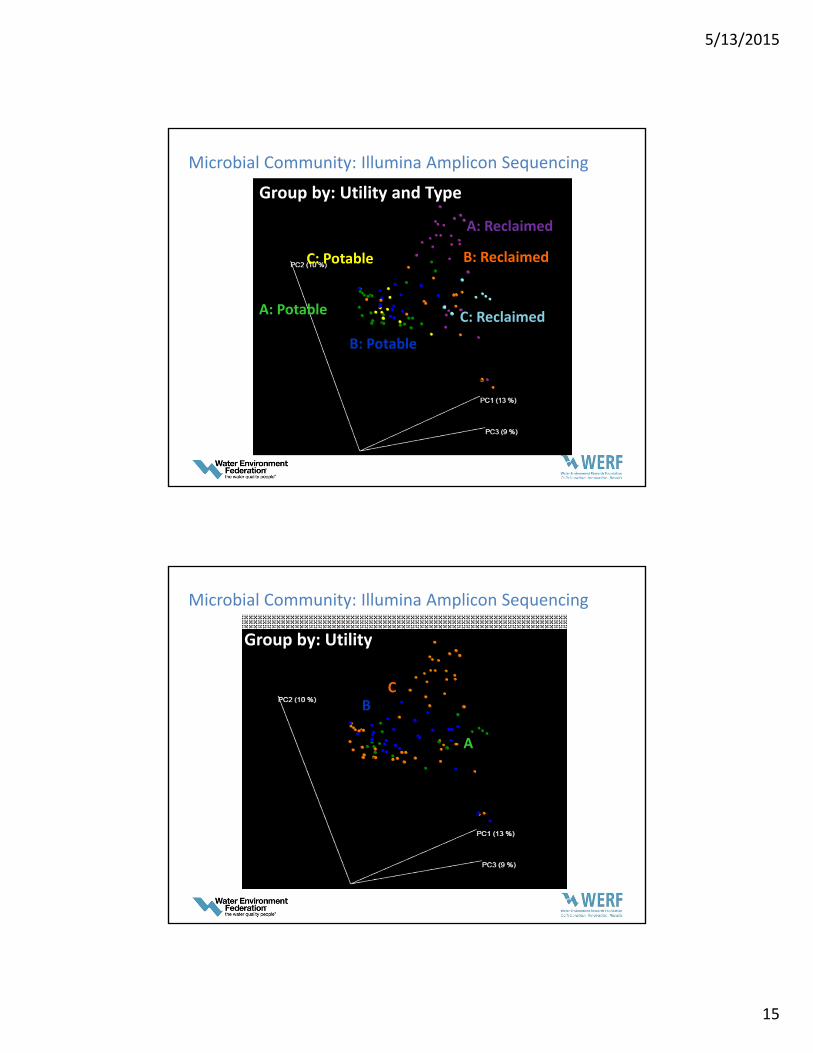
Microbial Community: Illumina Amplicon Sequencing
SoGroup by: Water Type
A: Reclaimed
A: Potable
C: Potable
B: Potable
B: Reclaimed
C: Reclaimed
Group by: Utility and Type
UNIFRAC Weighted
SoGroup by: Water Type
A
BC
Group by: Utility
UNIFRAC Weighted
Microbial Community: Illumina Amplicon Sequencing

5/13/2015
16
Group by: Water Type
Bulk Water
Biofilm
Group by: Matrix
UNIFRAC Weighted
Microbial Community: Illumina Amplicon Sequencing
Potable
Reclaimed
R statistic: 0.492p: 0.1%
Group by: Water Type
UNIFRAC Weighted
Microbial Community: Illumina Amplicon Sequencing

5/13/2015
17
Water Chemistry as a function of Water Age
*Disinfectant Residual: Cl2
Impact of Water Chemistry on OPs

5/13/2015
18
Regrowth of OPs
POE 1 2 3 4 5
16S rRNA 4.0 3.3 3.6 4.1 4.8 6.2
Legionella spp. 2.1 3.2
L. pneumpohila 3.0
Mycobacterium spp. 2.6 3.4
M. avium 2.0 1.8 1.8
N. fowleri
Acanthamoeba spp. 3.0
V. vermiformis 1.0 1.8
POE 1 2 3 4 5
16S rRNA 5.4 6.6 6.4 6.8 6.6 7.3
Legionella spp. 4.0 3.8 3.2 4.0 4.4
L. pneumpohila 2.6 2.6 2.7 2.6 3.0
Mycobacterium spp. 2.5 2.6 2.7 2.8 2.5
M. avium
N. fowleri 2.5
Acanthamoeba spp. 2.5
V. vermiformis
Utility A: Reclaimed (Residual: Cl2)Utility A: Potable (Residual: ClNH2)Bulk Water
Biofilm
Bulk Water
Biofilm
[log (copies / mL)]
16S rRNA 5.0 4.9 5.0 4.4 5.0
Legionella spp. 3.4 3.4 3.4 3.3 3.1
L. pneumpohila 2.7 3.4 3.7 2.5 2.8
Mycobacterium spp. 3.1
M. avium
N. fowleri
Acanthamoeba spp.
V. vermiformis
16S rRNA 4.1 3.9 4.0 3.9 4.4
Legionella spp. 3.3 2.7
L. pneumpohila 2.8 2.8
Mycobacterium spp. 3.1 2.7 2.7 3.0
M. avium
N. fowleri 3.0
Acanthamoeba spp.
V. vermiformis 2.4
[log (copies / mL)]
[log (copies / cm2)] [log (copies / cm2)]
L. pneumophila
L. pneumophila
L. pneumophila
L. pneumophila
Metagenomics: Average ARG Composition

5/13/2015
19
Metagenomics: ARGs in Reclaimed Water
Metagenomics: ARGs in Reclaimed Water vs. Potable Water
: Reclaimed

5/13/2015
20
Antibiotic Resistant Indicator Bacteria
Presented as [# resistant / # isolates tested]ND indicates no isolates present
E. coli Utility Cephalexin Erythromycin Sulfamethoxazole
POTABLEA ND ND NDB ND ND NDC 0/2 2/2 0/2
RECLAIMEDA 0/5 5/5 3/5B ND ND NDC ND ND ND
Enterococcus Utility Cephalexin Erythromycin Vancomycin
POTABLEA ND ND NDB ND ND NDC 10/13 8/13 8/13
RECLAIMEDA 5/5 4/5 3/5B ND ND NDC 6/8 2/8 3/8
Multiple Antibiotic Resistance

5/13/2015
21
Conclusions• OPs
– Legionella spp. and L. pneumophila gene markers were detected throughout but did not increase at higher water ages
• ARGs
– Increase of ARGs from POE to POU (2/3 cases)
– Relative Abundance of ARGs in reclaimed water comparable to potable water (1/1 case)
– Multiple antibiotic resistance observed in potable and reclaimed water isolates
Pruden, ES&T 2014 Editor’s Choice: Best Feature Article
5/13/2015
22
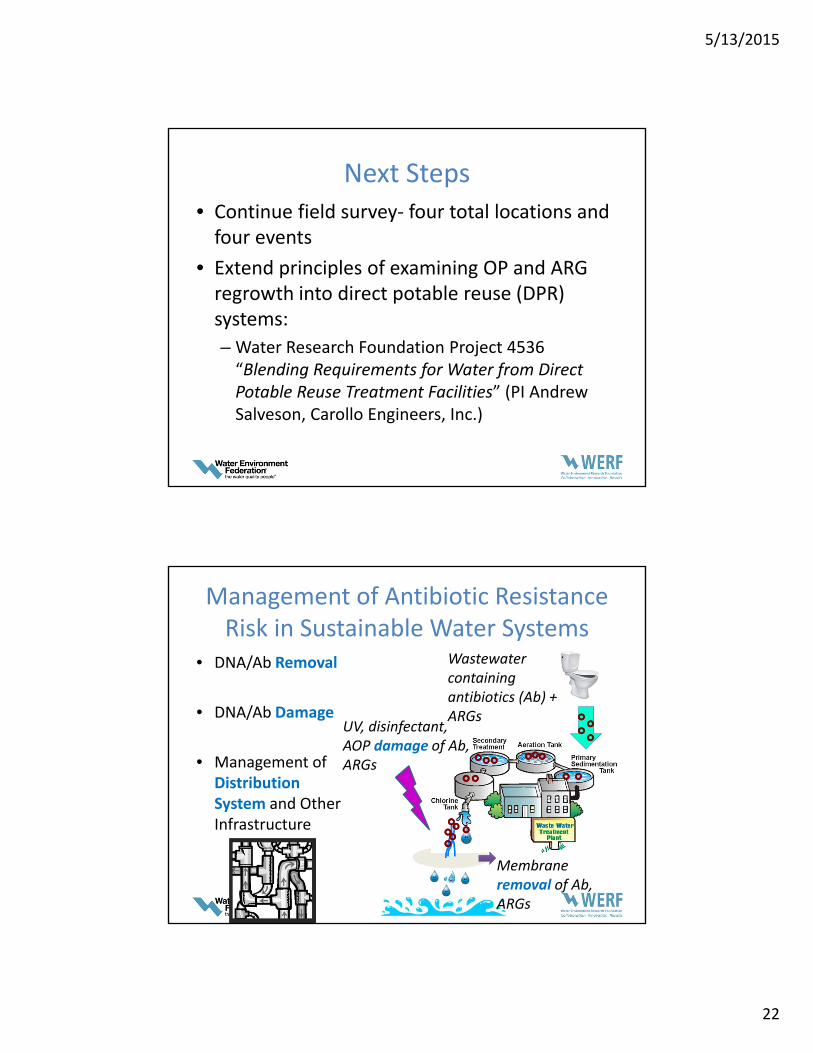
Next Steps• Continue field survey‐ four total locations and four events
• Extend principles of examining OP and ARG regrowth into direct potable reuse (DPR) systems:
– Water Research Foundation Project 4536 “Blending Requirements for Water from Direct Potable Reuse Treatment Facilities” (PI Andrew Salveson, Carollo Engineers, Inc.)
Management of Antibiotic Resistance Risk in Sustainable Water Systems
• DNA/Ab Removal
• DNA/Ab Damage
• Management of Distribution System and Other Infrastructure
Wastewater containing antibiotics (Ab) + ARGs
Membrane removal of Ab, ARGs
UV, disinfectant, AOP damage of Ab, ARGs

5/13/2015
23
Acknowledgements‐ People
• Emily Garner, NSF Graduate Research Fellow
• Jeannie McLain, University of Arizona
• Marc Edwards, Virginia Tech
• Andrew Salveson, Carollo Engineers
• Our many supportive and helpful utility partners
Acknowledgements‐ Funding
• Water Environment Research Foundation Paul L. Busch Award 2014
• NSF Graduate Research Fellowship
• Alfred P. Sloan Foundation Microbiology of the Built Environment
• Water Research Foundation Project 4536

5/13/2015
24
Nancy G. Love, Ph.D., P.E., BCEEUniversity of Michigan
Nancy LoveUniversity of Michigan
2001 Paul L. Busch Award Recipient
Nancy Love used the award in her effort to create a protein‐based warning system that will help plant operators quickly detect changes in the influent, prevent upsets, and optimize the treatment process.

5/13/2015
25
ContaminantsChemical Biological
TreatmentFate
EnvironmentalImpact
Human Health Impact
SCALE
Cellular Phenomena
Treatment Processes
Systems Analysis
The Interplay Between Chemicals and Microorganisms in Urban Water Systems
Nancy G. Love, Ph.D., P.E., BCEEUniversity of Michigan
May 13, 2015
Busch Award (2001): Working Hypothesis
Stress responses, which are controlled at the molecular/cellular level, play a significant role in defining how biological treatment processes perform at the macroscopic level.
chemical microorganismStress response process
performance impact

5/13/2015
26
Busch Award (2001): Working Hypothesis
Stress responses, which are controlled at the molecular/cellular level, play a significant role in defining how biological treatment processes perform at the macroscopic level.
chemical microorganismStress response process
performance impact
Biological basis for sensor that indicates chemical stress
Glutathione + Toxin Conjugate OR oxidized glutathione
Stimulates K+ efflux
K+ channels
Electrophilic (oxidative) Toxin
Wellflocculated
Poorlyflocculated
Time (minutes)
0 10 20 30 40 50 60 70 80 90 100 110 120 130ISE
So
lub
le K
+ C
on
cen
tra
tio
n (
mg
/L)
42
44
46
48
50
52
54
56
58
60
62
64
NEM 50 mg/L
(0.40 mM)
DTT (both)185 mg/L(1.2 mM)
NEM (both)450 mg/L(3.6 mM)
Control/DTT/NEMNEM/DTT/NEM
Bott and Love, Water Environ Res, 2002; Bott and Love, Appl Environ Micro, 2004

5/13/2015
27
Busch Award (2001): Working Hypothesis
Stress responses, which are controlled at the molecular/cellular level, play a significant role in defining how biological treatment processes perform at the macroscopic level.
chemical microorganismStress response process
performance impact
Biological basis for sensor that indicates chemical stress
Holistic framework for understanding process upset that informs corrective actions
A decision support system framework was developed to guide responses to influent anomalies.
Love, N. G., A. J. Pinto, J. S. Guest, S. Hardin and A. Shaw. 2009. Determining and Assessing Corrective Action Strategies for Treatment Plants Exposed to Chemical Toxins. Water Environment Research Foundation, Report No. 04‐CTS‐11S, Alexandria, VA, 191 pages.

5/13/2015
28
Busch Award (2001): Working Hypothesis
Stress responses, which are controlled at the molecular/cellular level, play a significant role in defining how biological treatment processes perform at the macroscopic level.
chemical microorganismStress response process
performance impact
Biological basis for sensor that indicates chemical stress
Holistic framework for understanding process upset that informs corrective actions
Evaluating how chemicals influence microbial communities
Community composition (structure)
Community perform
ance
(expressed
function)
Pinto and Love, ES&T, 2012
Gilmore et al., EES, 2013
Gene expression
Muller et al., AEM, 2007Ghosh et al., Mol. Microbiol., 2011
Inte
nsi
ty
0 1 2 3 4 5 6 7 8 9 10 11 12 13 14 15 0
2000000400000060000008000000
1000000012000000140000001600000018000000200000002200000024000000260000002800000030000000
1.4
2
Inte
nsi
ty
0 1 2 3 4 5 6 7 8 9 10 11 12 13 14 15 0
1.4
2
10.
78
8.6
6
7.6
8
5.8
0
9.2
9
8.4
9
11.9
5
6.8
5
8.1
9
200000040000006000000
320000003000000028000000260000002400000022000000200000001800000016000000140000001200000010000000
8000000
0
5000000
10000000
15000000
20000000
25000000
30000000
35000000
40000000
45000000
50000000
Inte
nsi
ty
0 1 2 3 4 5 6 7 8 9 10 11 12 13 14 15 Time (min)
14.
77
9.9
8
5.9
7
8.5
8
3.1
8
1.4
5
10.
42
6.9
8
3.8
3
A
B
C
Metabolic Fingerprint
Henriques et al., ES&T, 2007
Activated Sludge Consortium
Bott and Love, Water Res, 2001
Duncan et al., Let Appl Microbiol, 2000
Protein upregulation
Community
perform
ance
(constitutive function)
Bott and Love, WER, 2002Bott and Love, AEM, 2004Wimmer and Love, WER, 2004Gillam et al., EES, 2005

5/13/2015
29
The interplay between chemicals and microorganisms in urban water systems.
Wilson and Schwarzman (2009) Toward a New U.S. Chemicals Policy: Rebuilding the Foundation to Advance New Science, Green Chemistry, and Environmental Health, Environ. Health Perspect. 117:1202‐1209.
Growth in the industrial‐ and technology‐based economy brings increased chemical production.

5/13/2015
30
EFFLUENT
FABRIC
INFLUENT
Point‐of‐use filters and low levels of disinfection byproducts change the drinking water microbiome.
Low levels of chemicals influence microbial structure and function which, in turn, changes microbial communities and our exposure risk.

5/13/2015
31
ContaminantsChemical Biological
TreatmentFate
EnvironmentalImpact
Human Health Impact
SCALE
Cellular Phenomena
Treatment Processes
Systems Analysis
The Interplay Between Chemicals and Microorganisms in Urban Water Systems
Nancy G. Love, Ph.D., P.E., BCEEUniversity of Michigan
May 13, 2015
Kartik Chandran, Ph.D.Columbia University

5/13/2015
32
Kartik ChandranColumbia University
Kartik Chandran is pursuing a promising new biological treatment process that transforms methane, a potent greenhouse gas, into a green fuel – methanol. This offers wastewater treatment plants a more affordable, environmentally friendly process for producing this alternative fuel and help reduce nitrogen in effluents.
2010 Paul L. Busch Award Recipient
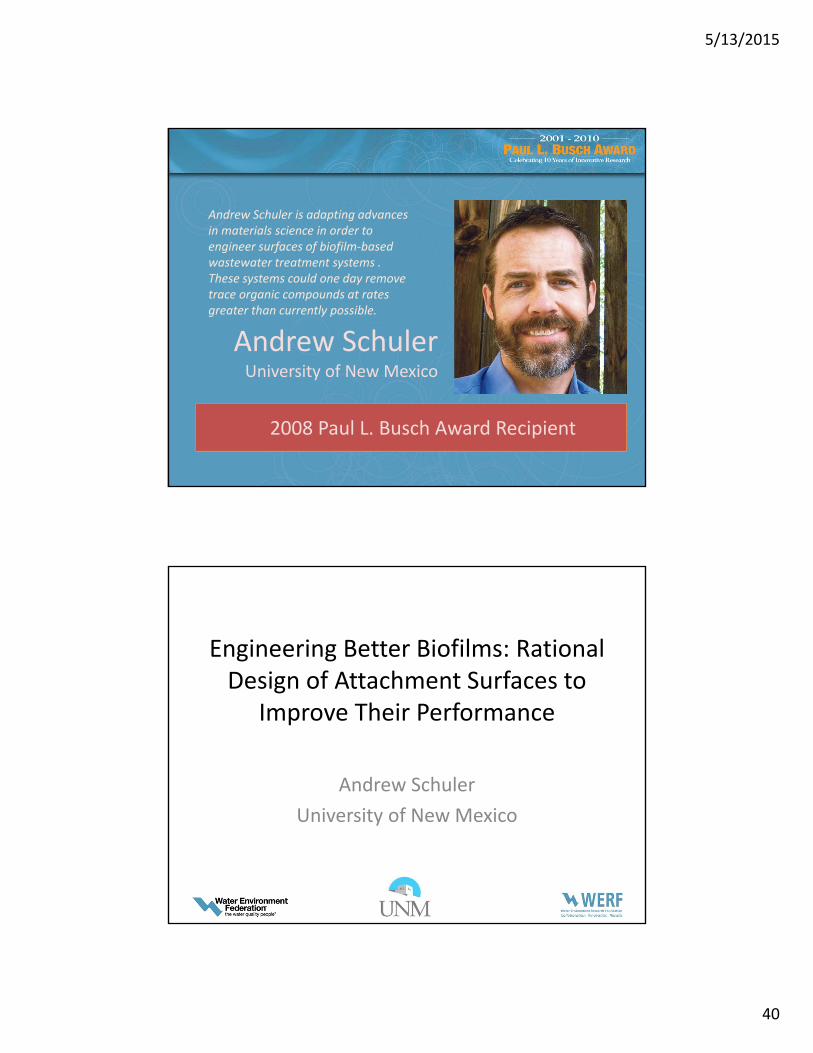
Andrew Schuler, Ph.D.University of New Mexico

5/13/2015
33
Engineered Platforms and Pathways for Resource Recovery from “Waste”
Kartik Chandran
Columbia University
WEF WERF Webcast Paul Busch Award
May 13th, 2015
AMMONIA OXIDIZING BACTERIA
Ammonia
Nitrite
Methane
Methanol
O2
Water
-
Overview of biological sewage treatment
Solids, inertsseparation
Aerobic C &N removal (oxidation)
Recycle of bacteria
Disinfection and discharge
• A high fraction of WWT energy goes to aeration
• $MM in organic chemical purchase
• Bacteria could produce unwanted products (N2O)

5/13/2015
34
All bacteria in reactor
MeOH degradersin reactor
All bacteria in reactor
MeOH degradersin reactor
MeOH
EtOHGlycerol
Baytshtok et al., 2008, 2009, Lu et al., 2010, 2011, 2012, 2014
Additional drivers
5/13/2015
35
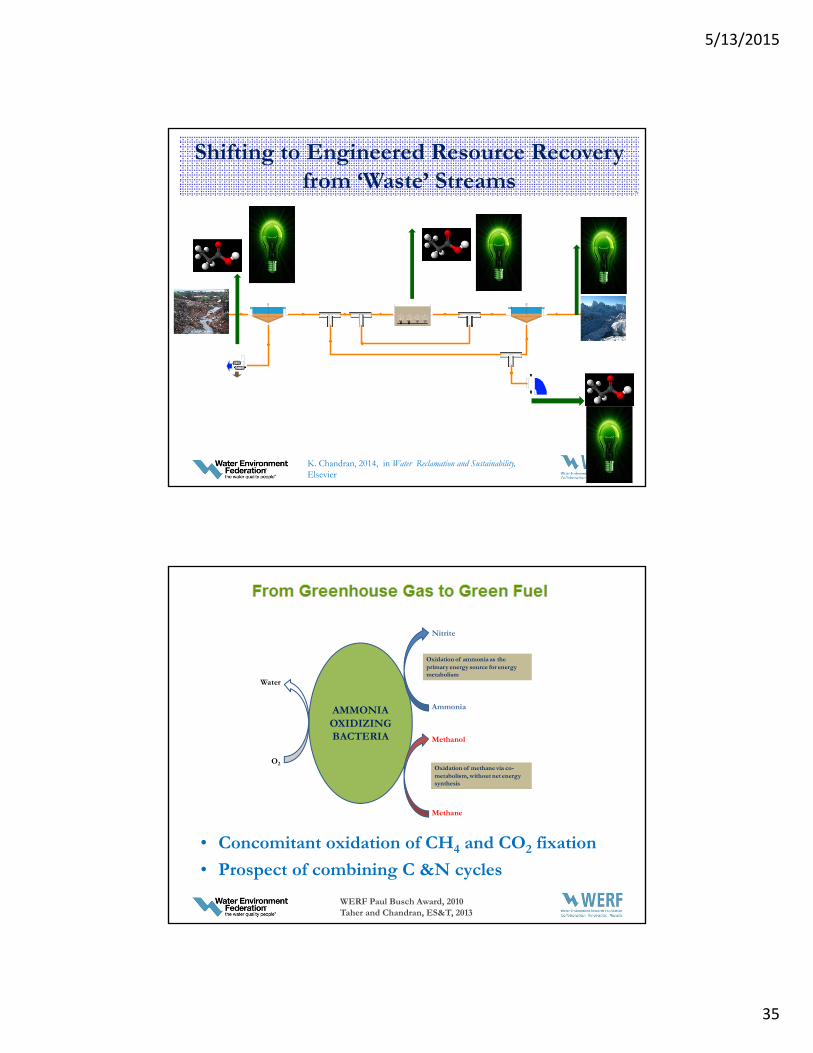
Shifting to Engineered Resource Recovery from ‘Waste’ Streams
K. Chandran, 2014, in Water Reclamation and Sustainability, Elsevier
• Concomitant oxidation of CH4 and CO2 fixation
• Prospect of combining C &N cycles
AMMONIA OXIDIZING BACTERIA
Ammonia
Nitrite
Methane
Methanol
O2
Water
Oxidation of ammonia as the primary energy source for energy metabolism
Oxidation of methane via co-metabolism, without net energy synthesis
Sewage sludge to methanol
WERF Paul Busch Award, 2010Taher and Chandran, ES&T, 2013

5/13/2015
36
Biological production of methanol
71
CH4 CH3OH HCHO HCOOH
MMO MDH FLD
CO2
FDH
A
Type I methanotroph Type II methanotroph
Phylogeny Gamma proteobacteria Alpha-proteobacteria
CH4 oxidation and carbon assimilation
Ribulose mono-phosphate Serine
Monooxygenase pMMO sMMO
Biological production of methanol
72
Type I methanotroph Type II methanotroph
Phylogeny Gamma proteobacteria Alpha-proteobacteria
CH4 oxidation and carbon assimilation
Ribulose mono-phosphate Serine
Monooxygenase pMMO sMMO
CH4 CH3OH
MMO
A

5/13/2015
37
Water Quality-Energy
Org-N and NH3
Org-N and NH3
Org-N and NH3
Maximum CH3OH production rate
mg CH3OH CODmg biomass COD-d
Peak CH3OH concentration (mg COD/L)
Microbial system used Reference
0.21 23.47 ± 0.50Mixed nitrifying cultures
NH3 only feed (FS1)
Taher and Chandran (2013)
Paul Busch Award study
0.30 27.50 ± 0.78Mixed nitrifying cultures NH2OH
only feed (FS2)
0.22 31.52 ± 1.19Mixed nitrifying cultures NH3 and
NH2OH co-feed (FS3)
0.20 40.71 ± 0.16Mixed nitrifying cultures NH3 and
NH2OH alternating feed (FS4)
0.82 59.89 ± 1.12
Mixed nitrifying cultures NH2OH only feed with biomass
replenishment (high rate)
0.37 28.8Pure suspended cultures of
Nitrosomonas europaea Hyman and Wood, 1983
0.31-0.54 NAPure suspended cultures of N.
europaea Hyman et al.,, 1988
0.02-0.1 6.2 ± 4.9Pure immobilized cultures of N.
europaeaThorn, 2007

5/13/2015
38
Phase II. Production in continuous reactors
Electron Source
Max SMeOH
mgCODL-1
Biomass Normalized Methanol Production Ratemg-CH3OH-COD-1(mg-XTOT-CODd-1) HRT (h)
Maximum Steady state
NH2OH 41 ± 3.4 1.488 ± 0.120 0.084 ± 0.024 7.5
NH2OH 21 ± 4.6 1.272 ± 0.240 0.144 ± 0.096 2
NH3 7 ± 2.8 0.192 ± 0.048 0.048 ± 0.024 2
Sathyamoorthy et al., unpublished
What are the metabolic pathways in AOB?N-oxidation, CO2 fixation, MeOH production… and more
Su et al., unpublished; Jiang et al., 2015

5/13/2015
39
Think beyond CH4All based on anaerobic (+) technologies
Biofuels
Biodiesel from food waste at $0.71/L
Commercial chemicals
Acknowledgements
Kartik Chandran
Associate ProfessorDirector, Wastewater Treatment and Climate Change Program
Director, CUBES Program
Email: [email protected]
Phone: (212) 854 9027
URL: www.columbia.edu/~kc2288
AMMONIA OXIDIZING BACTERIA
Ammonia
Nitrite
Methane
Methanol
O2
Water
Oxidation of ammonia as the primary energy source for energy metabolism
Oxidation of methane via co-metabolism, without net energy synthesis
5/13/2015
40
2008 Paul L. Busch Award Recipient
Andrew SchulerUniversity of New Mexico
Andrew Schuler is adapting advances in materials science in order to engineer surfaces of biofilm‐based wastewater treatment systems . These systems could one day remove trace organic compounds at rates greater than currently possible.
Engineering Better Biofilms: Rational Design of Attachment Surfaces to
Improve Their Performance
Andrew Schuler
University of New Mexico
5/13/2015
41
Outline
• Biofilms!
• Can we build a better mousetrap?
– Surface Chemistry
– Geometry
• Conclusions, future work
82
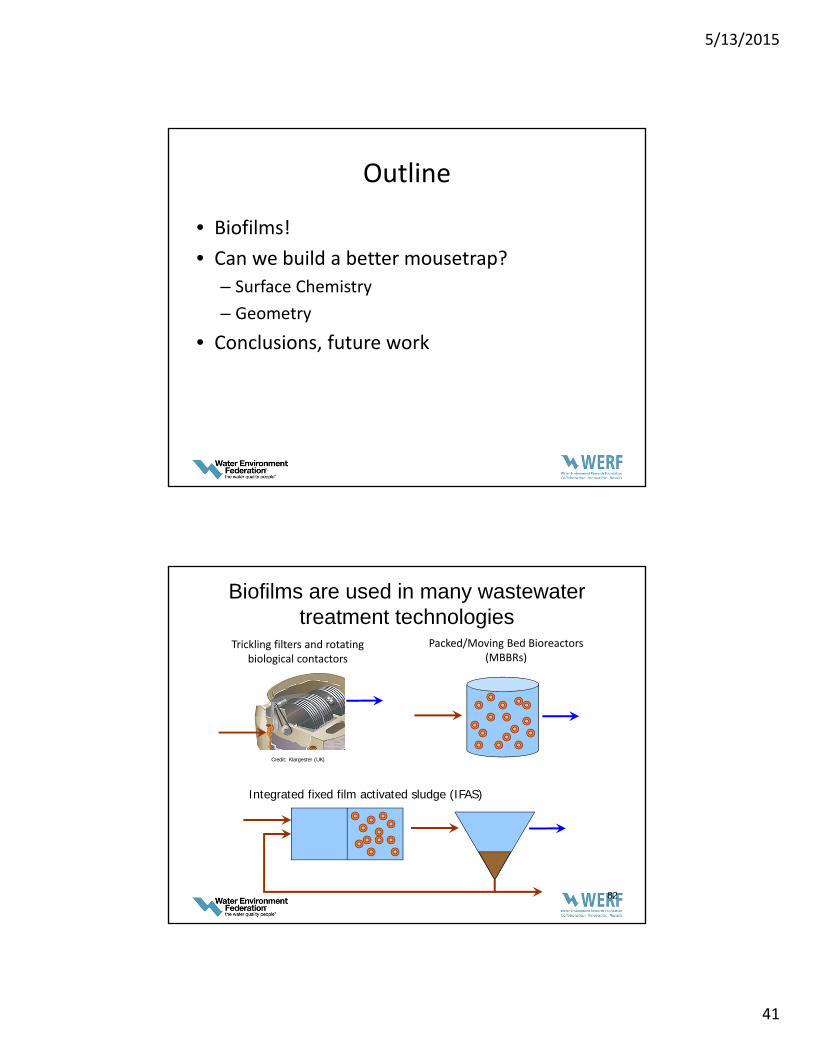
Biofilms are used in many wastewater treatment technologies
Credit: Klargester (UK)
Trickling filters and rotating biological contactors
Packed/Moving Bed Bioreactors (MBBRs)
Integrated fixed film activated sludge (IFAS)

5/13/2015
42
Biofilms are complex!
http://microwavesscience.blogspot.com/2011/05/biofilms‐at‐11.html
Complex structures Complex composition
Complex interactions with environment
84
Biofilm attachment surface media
• Many shapes and sizes
• Commonly hydrophobic plastic, e.g. high density polyethylene (HDPE)
– Durable, extrudable, inexpensive
• Polyester (BioWeb, Entex Technol.)

5/13/2015
43
85
Can we do better?
Objective: strategically design surfacesto improve performance, and
for specific functions
86
Much research previously devoted to reducing bacterial attachment
• Focus on control of biofouling – modified surface chemistries
Ship’s hulls Pipelines
We have the reverse goal: designing surfaces to enrich for beneficial biofilms

5/13/2015
44
87
A tool to create chemically well-defined surfaces:
Self-assembled monolayers (SAMs)
Terminal functional group (designable)
Alkane chain
Sulfur attachment group
Gold substrate
Examples:NH2
+, CH3 , OH‐ , COO‐
88
Changing functional groups changes surface properties
CH3 SAM 108o 16.1
OH‐ SAM 23o 50.2
Nitrosomonas multiformis 56o 45.2
Contact SurfaceAngle Energyw (mJ/m2)
Decreasinghydrophobicity
Increasingsurfaceenergy
Water contact angles

5/13/2015
45
89
Microscope‐mounted flow cell for monitoring of bacterial attachment to SAMs
Focus on nitrifiers - Ammonia oxidizing bacteria (AOB)
SAM surface
Flow out
Bacterial culture
Viewing window
Teflon spacer
Objective
Aluminum base
Aluminum cover
What we’re really interested in:Can we relate surface energy to attachment?
90
0
1000
2000
E. coli N. multiformis N. europaea
Cel
ls/(
mm
2*h)
CH3OHCOOHNMe3NH2
All strains attached preferentially to higher surface energy (SE) surfaces
Low SE High SE
Nitrosospiramultiformis
Nitrosomonaseuropea

5/13/2015
46
91
Surface energy was a good predictorof attachment
CH
3
OH
CO
OH
NM
e3N
H2
0
500
1000
1500
2000
2500
10 20 30 40 50 60 .
Cel
ls/m
m2
E. coliN. multiformisN. europaea
Nitrifiers attached particularly well to high SE surfaces
Surface energy (mJ/m2)
92
Apply results to growth on real plastics:More biofilm on
higher surface energy surfaces
Ace
tal
HD
PE
Mel
amin
e
Nyl
on
R2 = 0.88
0.0
0.1
0.2
0.3
0.4
0.5
0.6
0.7
10 20 30 40 50 60
Surface energy (mJ/m2)
Atta
ched
bio
mas
s, m
g/cm
2
Plastic sheets incubated in activated sludge for 2 weeks

5/13/2015
47
93
More nitrification on higher surface energy surfaces
Biomass was enriched with nitrifiers.
High SE gave more biomass, and greater activity/ biomass
94
More hormone removal on higher surface energy surfaces
Ace
tal
HD
PE
Mel
amin
eN
ylon
R2 = 0.82
R2 = 0.84R2 = 0.72
0.00
0.04
0.08
0.12
0.16
10 20 30 40 50 60
Surface energy
Ho
rmo
ne fl
ux, n
g/(
cm2*
h) E1
E2EE2
Again, not surprising, given biomass result

5/13/2015
48
Media Geometry
Melcer and Schuler (2014), WERF Report U4R11
Attachment media are available in many shapes and sizes. How does this affect populations and their activity?
Bjornberg et al. 2009. Effect of temperature on biofilm growth dynamics and nitrification kinetics in a full‐scale MBBR system, WEFTEC proceedings
Insight: most biofilm located near ends of media.So should design maximize edges, minimize interior?
WERF study on mixing effects
Melcer and Schuler (2014), WERF Report U4R11
Mixing rate
NH3 flux
Media with more edges
Media with more interior
Worse performance by “high edge” media seems to contradict goal of minimizing media “interior”

5/13/2015
49
Test end effects in systematic manner using custom media
22.5 mm(3x)
7.5 mm(x)
8 mm
0.0
0.1
0.2
0.3
0.4
0.5
2/2 2/16 3/2 3/16 3/30 4/13 4/27 5/11
Aached
biomass
(VS), m
g/cm
^2
Date
Long media produces more biofilm/area (surprise?)
Long: more biomass
Short:less biomass

5/13/2015
50
Longer media gave more “complete” nitrification (to NO3
‐)
0
50
100
150
200
2/2 2/16 3/2 3/16 3/30 4/13 4/27 5/11
Concentra
on (m
g/L)
Date
Short Effl NO2‐N, mg/L Short Effl NO3‐N, mg/L Short NH4‐N Uptake, mg/L
Long Effl NO2‐N, mg/L Long Effl NO3‐N, mg/L Long NH4‐N Uptake, mg/L
Simiilar NH3 uptake
Short had more NO2‐ produc on
Long had more NO3‐ produc on
3D printing of media
channel depth1mm 2mm 3mm 5mm

5/13/2015
51
Growth on 5mm Depth channels over time
10 days
Growth on domestic primary effluent
50 days15 days
Next steps
• Apply 3D printing to study of biofilm depth, geometry effects
• Combine chemical modifications with geometric modifications
• Analyze effects on community spatial heterogeneity

5/13/2015
52
Thanks to
• Water Environment Research Foundation Paul L. Busch Award
• National Science Foundation Unsolicited Grant 1337077
• National Science Foundation CREST Center Grant 1345169
• Water Environment Research Foundation Project U4R11
• My research partners that have done all of this work: Patrick McLee, Kody Garcia, Erika Hernandez Hernandez, Phil Roveto, Yunjie Tu, Kwasi Addae‐Mensah, Hyun‐su Kim, Shane Snyder, Kevin Daniels, Linnea Ista, and many others.
How to Ask Your Questions
• Audio Modes
• Listen using Mic & Speakers
• Or, select “Use Telephone” and dial the conference (please remember long distance phone charges apply).
• Submit your questions using the Questions pane.
• A recording will be availablefor replay shortly after thiswebcast.

5/13/2015
53
Thank You