Embed Size (px)
Citation preview
The performance evaluation system of a network of Italian Regions: challenges and results
Prof. Sabina Nuti, Laboratory of Management and Healthcare, Institute of Management, Scuola Superiore Sant’Anna, Pisa (Italy)
Scuola Superiore Sant’Anna is a public University of excellence,specialized in applied sciences: Economics, Law and Political Science inthe Social Sciences Department; Agrarian Sciences, Medicine, andIndustrial and Computer Engineering in the Experimental SciencesDepartment
Scuola Superiore Sant’Anna
http://www.santannapisa.it/en
Undergraduate students are admitted to theSant'Anna School of Advanced Studies by anational public competition.
Winners are enrolled in the appropriate degreecourse of the University of Pisa and they haveto attend the integrative courses of the School:all these services are free of charge.
Scuola Superiore Sant’Anna offers and oversees quality undergraduate, graduate and continuing education
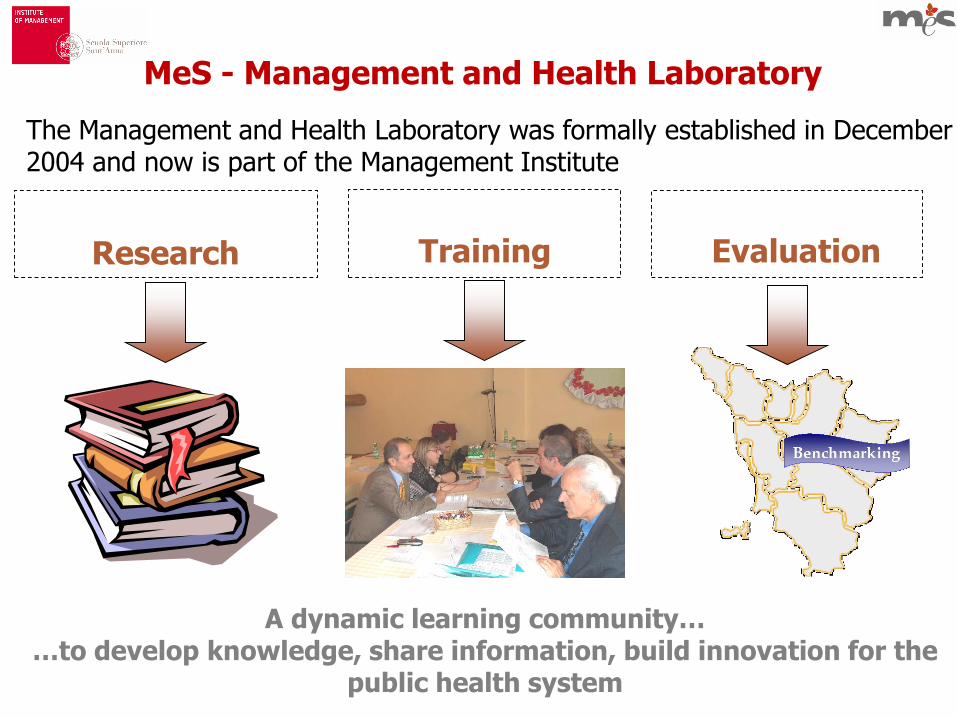
The Management and Health Laboratory was formally established in December 2004 and now is part of the Management Institute
MeS - Management and Health Laboratory
Research EvaluationTraining
A dynamic learning community……to develop knowledge, share information, build innovation for the
public health system
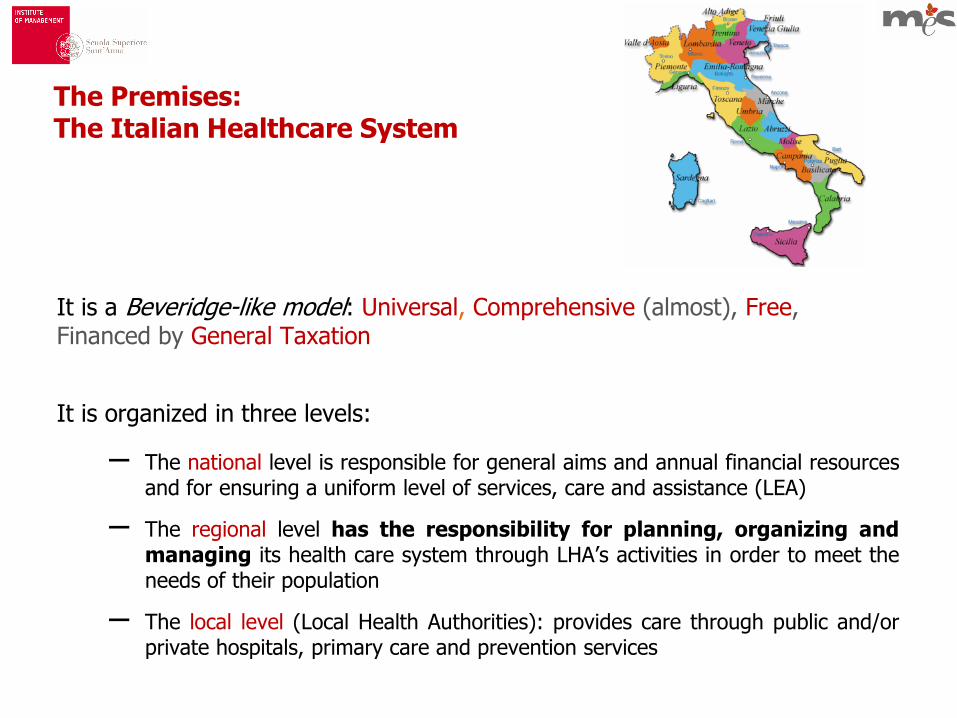
The Premises:The Italian Healthcare System
It is a Beveridge-like model: Universal, Comprehensive (almost), Free, Financed by General Taxation
It is organized in three levels:
– The national level is responsible for general aims and annual financial resourcesand for ensuring a uniform level of services, care and assistance (LEA)
– The regional level has the responsibility for planning, organizing andmanaging its health care system through LHA’s activities in order to meet theneeds of their population
– The local level (Local Health Authorities): provides care through public and/orprivate hospitals, primary care and prevention services
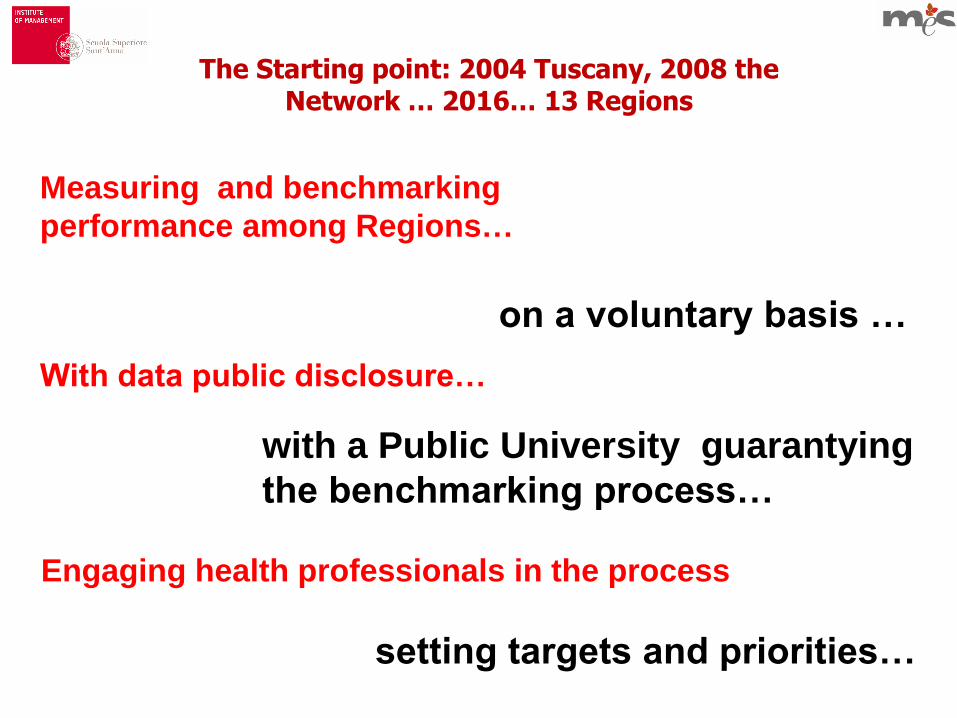
with a Public University guarantying
the benchmarking process…
Measuring and benchmarking
performance among Regions…
on a voluntary basis …
With data public disclosure…
Engaging health professionals in the process
setting targets and priorities…
The Starting point: 2004 Tuscany, 2008 the Network … 2016… 13 Regions
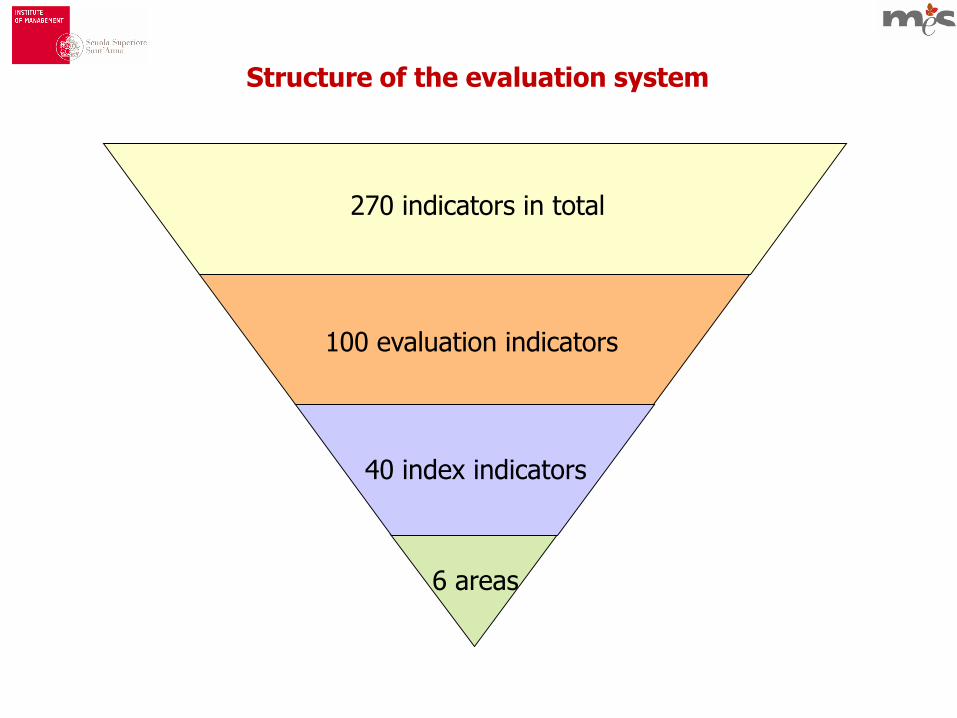
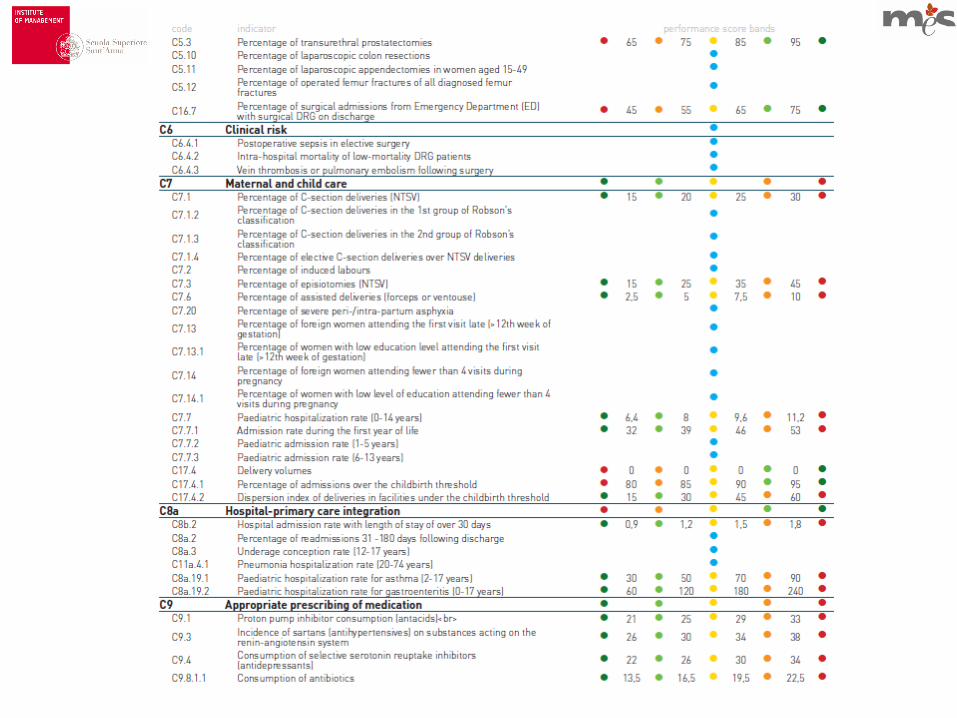
270 indicators in total
6 areas
40 index indicators
100 evaluation indicators
Structure of the evaluation system
7
Efficiency and financial
performance
Employees Satisfaction
Patients Satisfaction
Clinical performance
Capacity to pursue regional strategies
Population health status
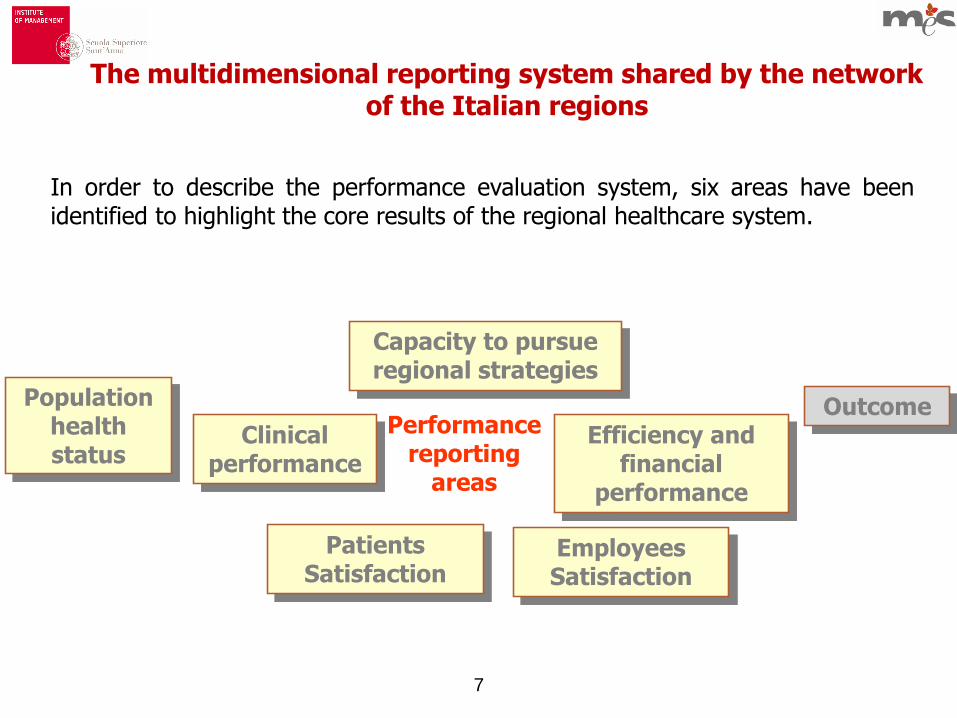
The multidimensional reporting system shared by the network of the Italian regions
In order to describe the performance evaluation system, six areas have beenidentified to highlight the core results of the regional healthcare system.
Performance reporting
areas
Outcome
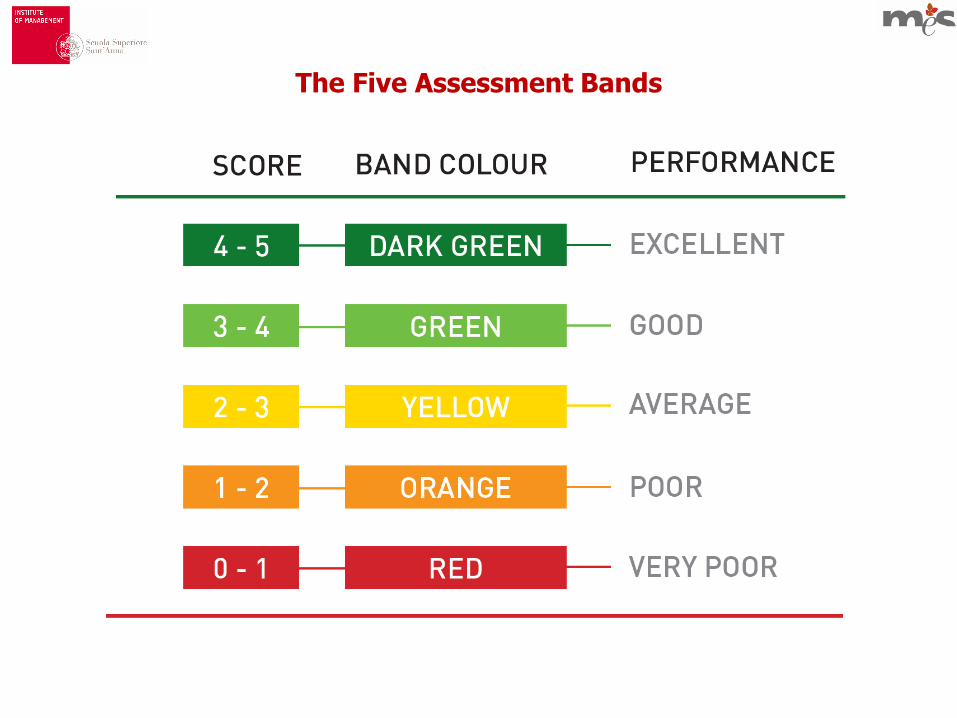
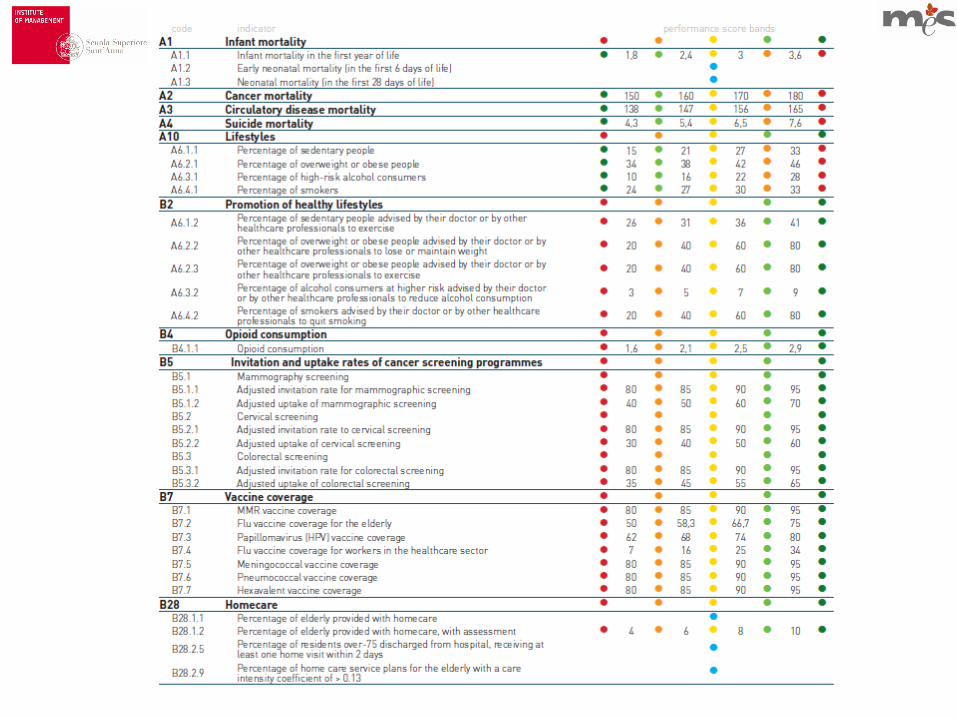
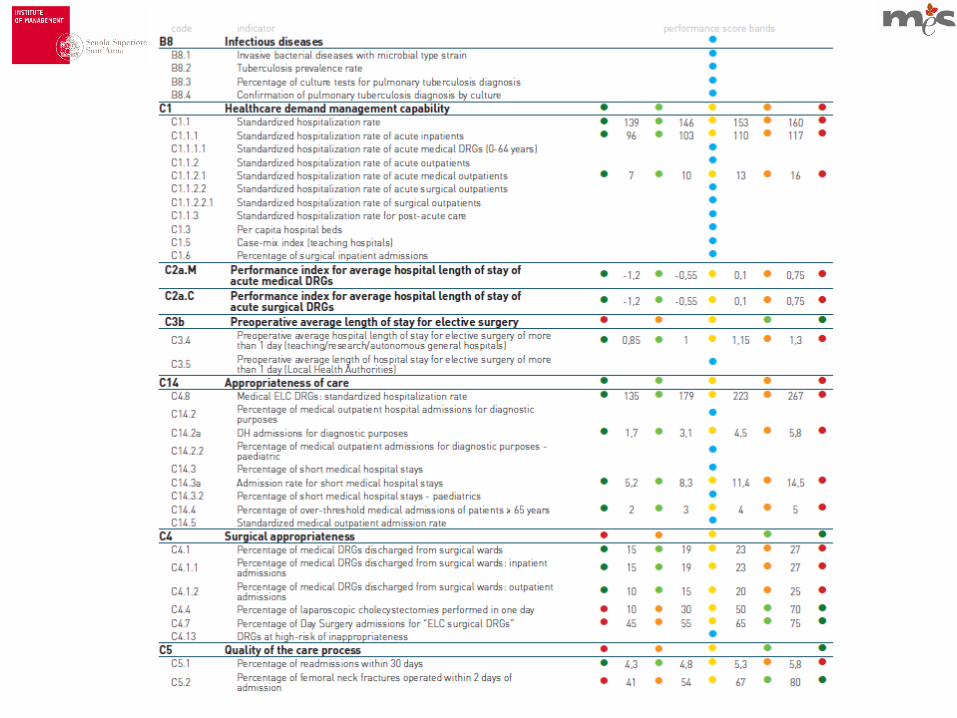
The Five Assessment Bands
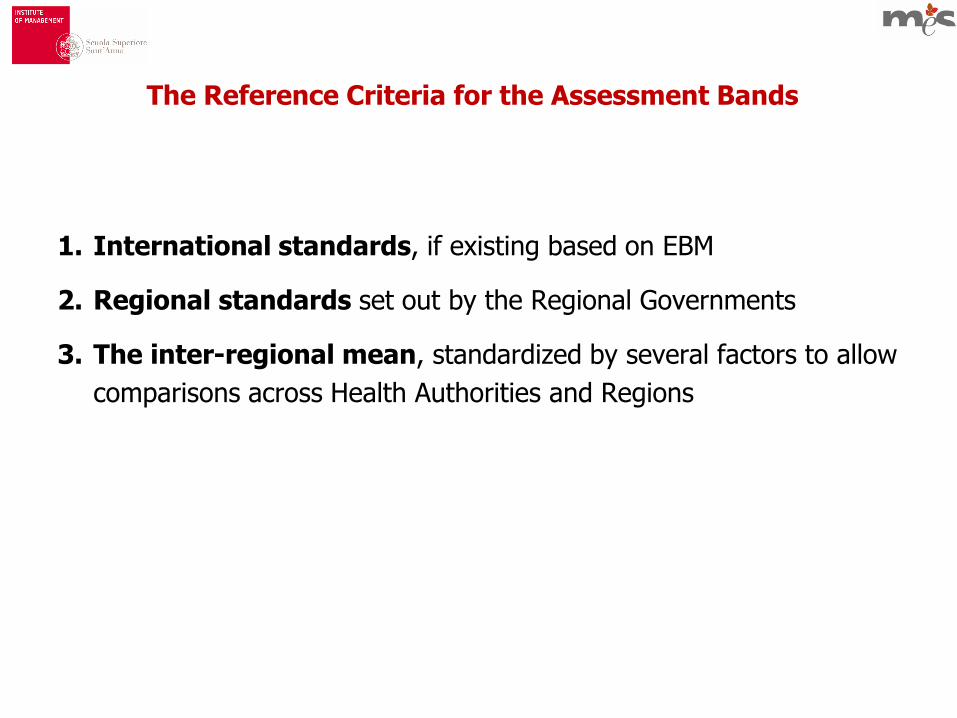
The Reference Criteria for the Assessment Bands
1. International standards, if existing based on EBM
2. Regional standards set out by the Regional Governments
3. The inter-regional mean, standardized by several factors to allow
comparisons across Health Authorities and Regions
10
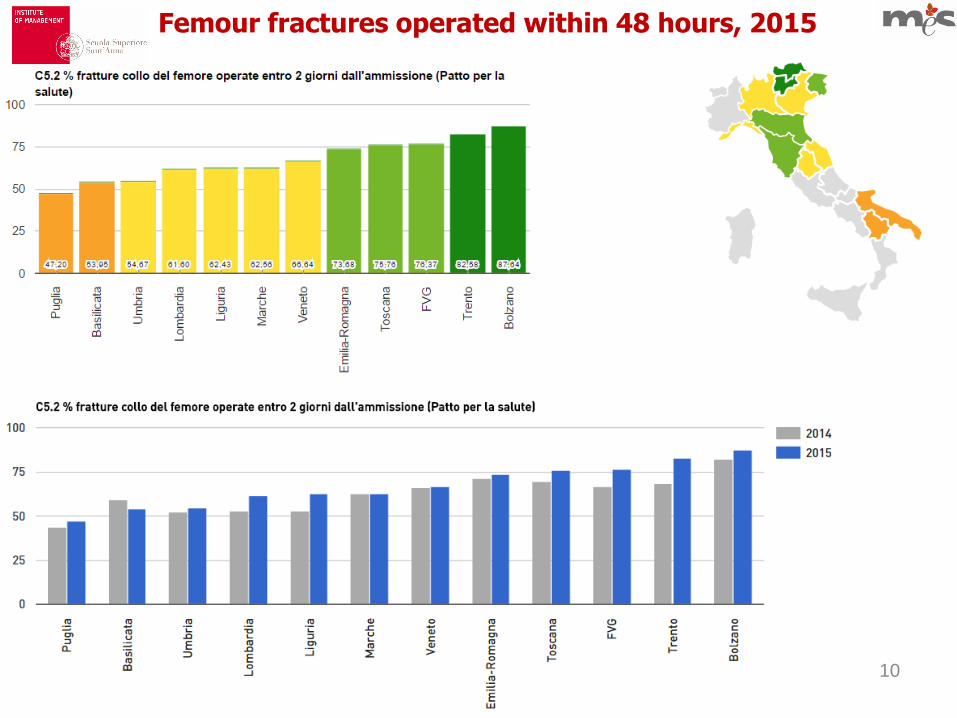
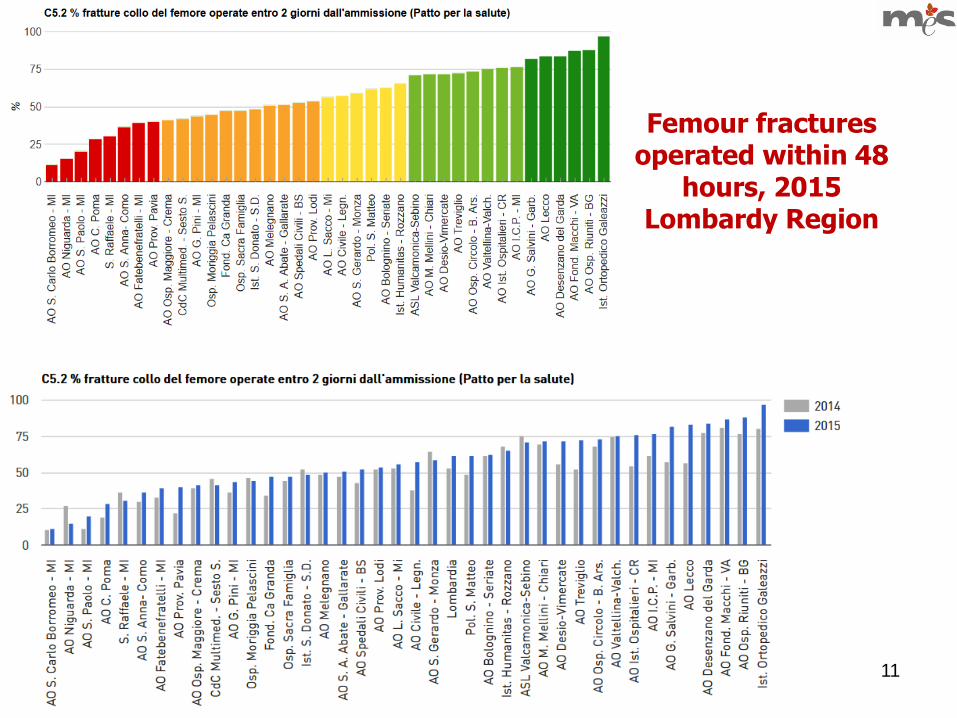
Femour fractures operated within 48 hours, 2015
11
Femour fractures operated within 48
hours, 2015Lombardy Region
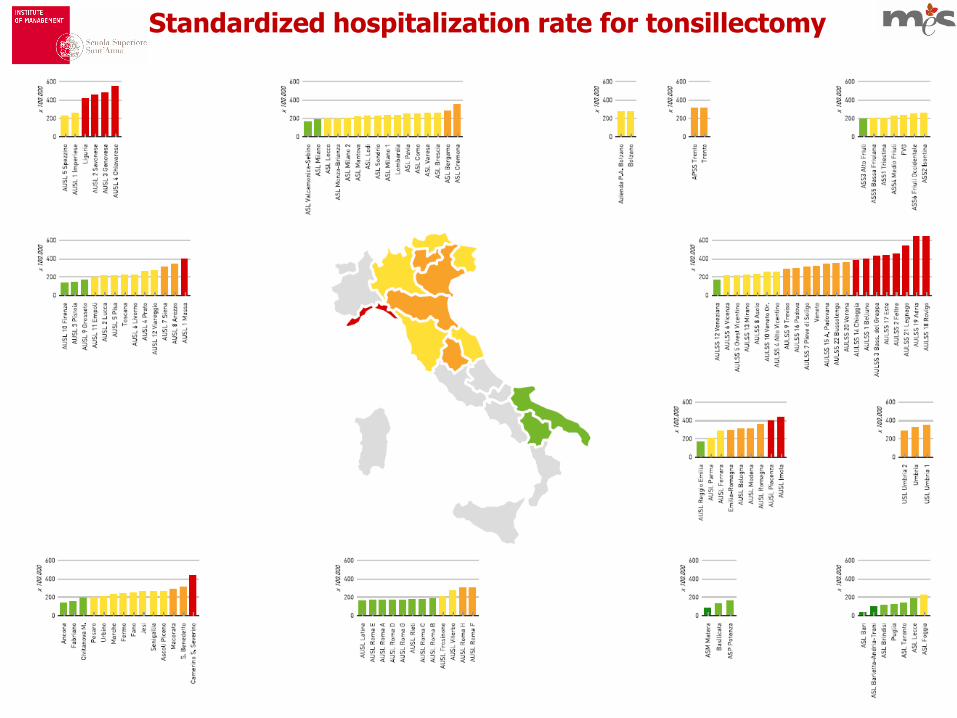
Standardized hospitalization rate for tonsillectomy
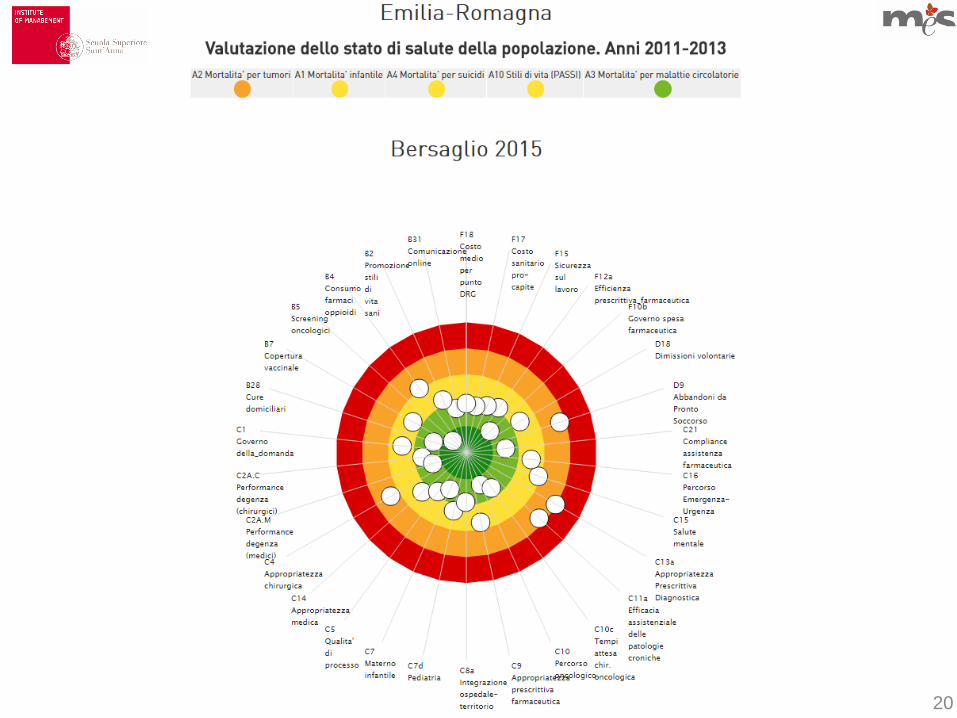
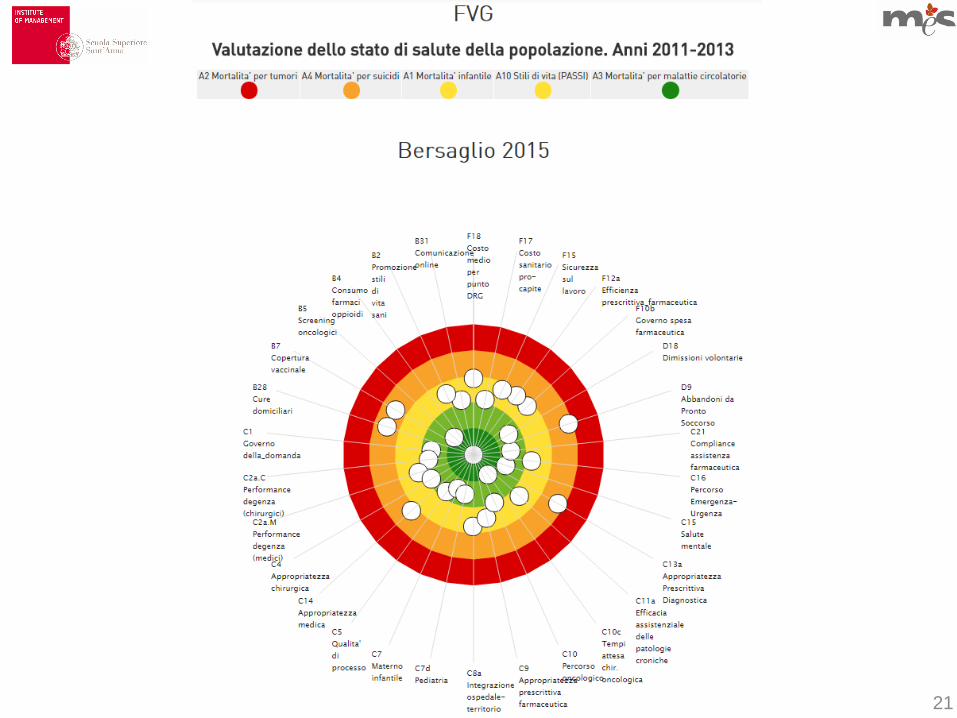
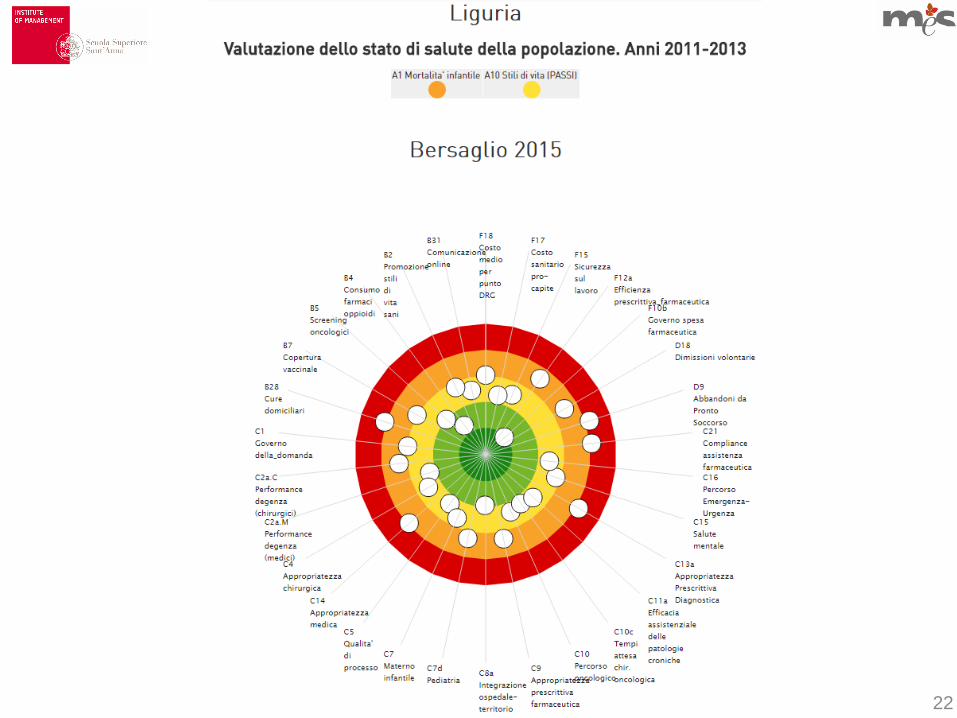
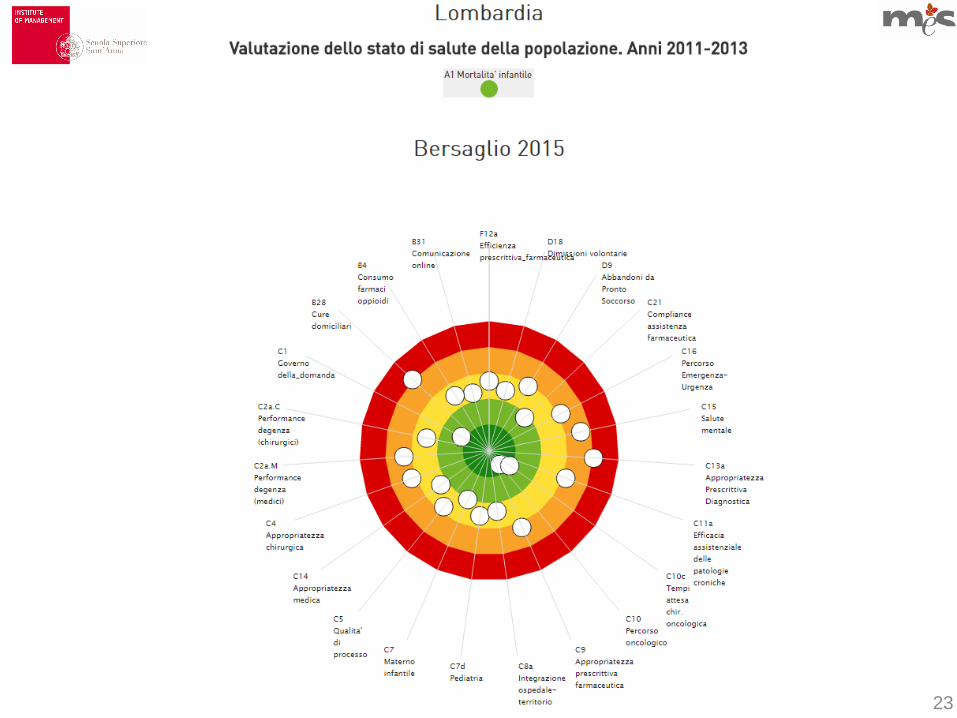
To visually represent the results of the six areas, each Region & Health Authority has a personal “target” diagram, divided in five assessment bands.
The more the Region/Health Authority is able to reach objectives and obtain good results in each of the six areas, the nearer the performance indicator is to the centre.
The DARTBOARD!
20
21
22
23
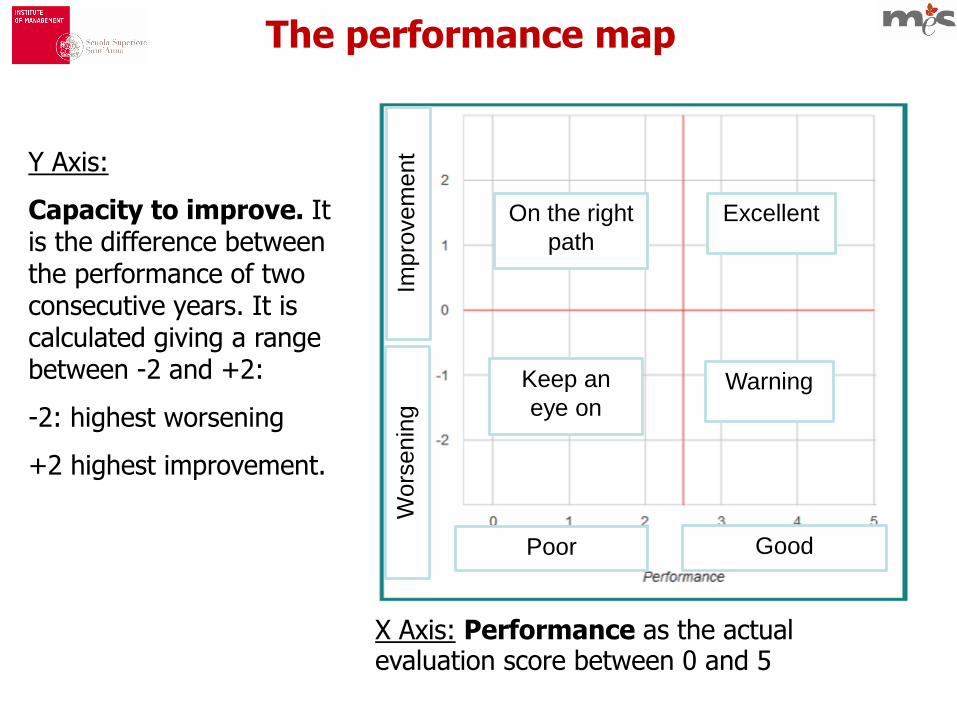
Y Axis:
Capacity to improve. Itis the difference betweenthe performance of twoconsecutive years. It iscalculated giving a rangebetween -2 and +2:
-2: highest worsening
+2 highest improvement.
The performance map
X Axis: Performance as the actualevaluation score between 0 and 5
Excellent
Warning
On the right
path
Keep an
eye onIm
pro
vem
ent
Wors
enin
g
Poor Good

25
Emilia Romagna - Territorio
The
performance
map
26
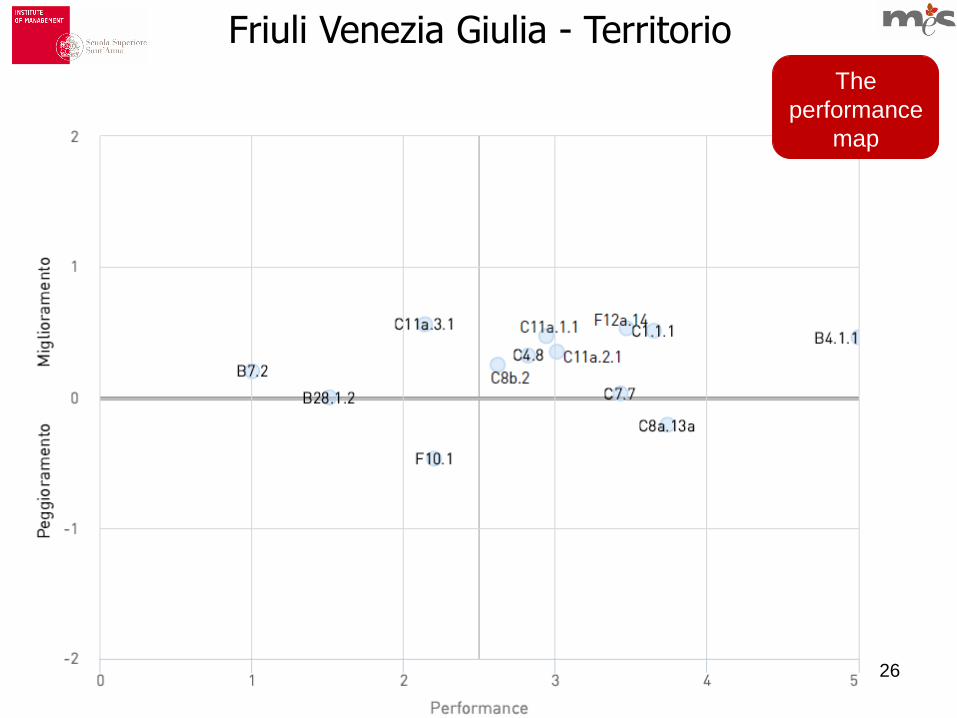
Friuli Venezia Giulia - Territorio
The
performance
map
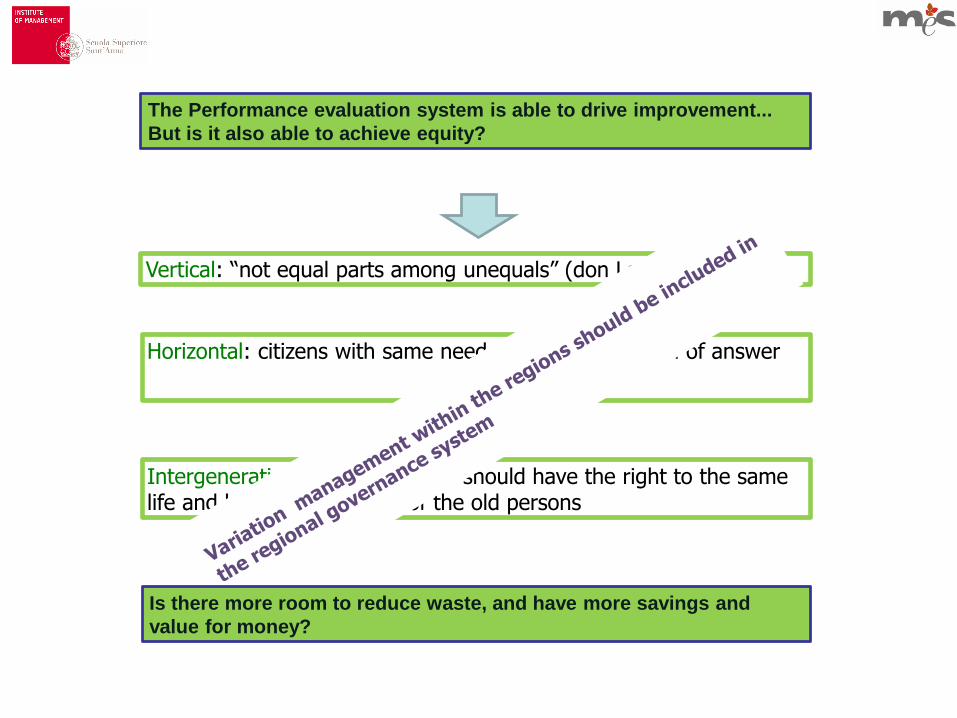
The Performance evaluation system is able to drive improvement...
But is it also able to achieve equity?
Vertical: “not equal parts among unequals” (don Lorenzo Milani)
Horizontal: citizens with same needs require same level of answer
Intergenerational: young people should have the right to the samelife and health opportunity of the old persons
Is there more room to reduce waste, and have more savings and
value for money?
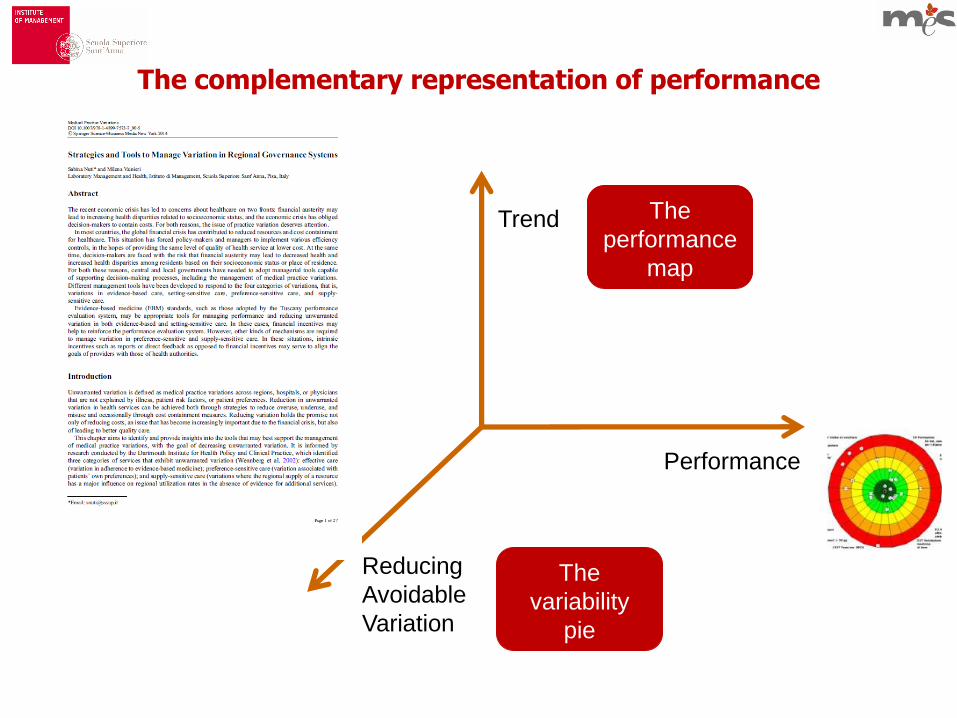
The complementary representation of performance
Performance
Trend
Reducing
Avoidable
Variation
The
performance
map
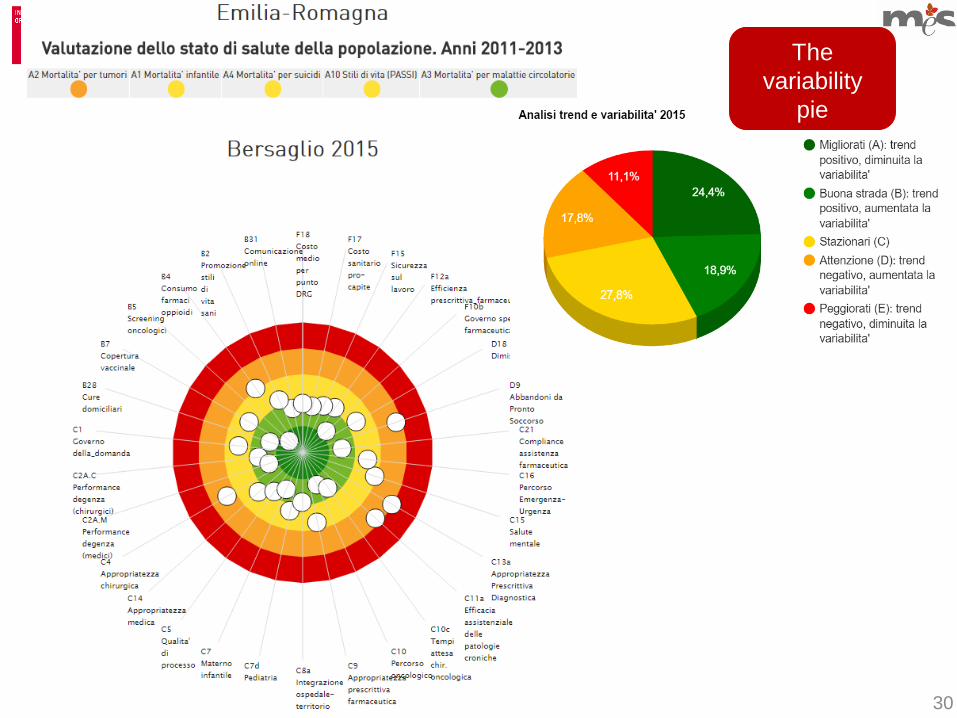
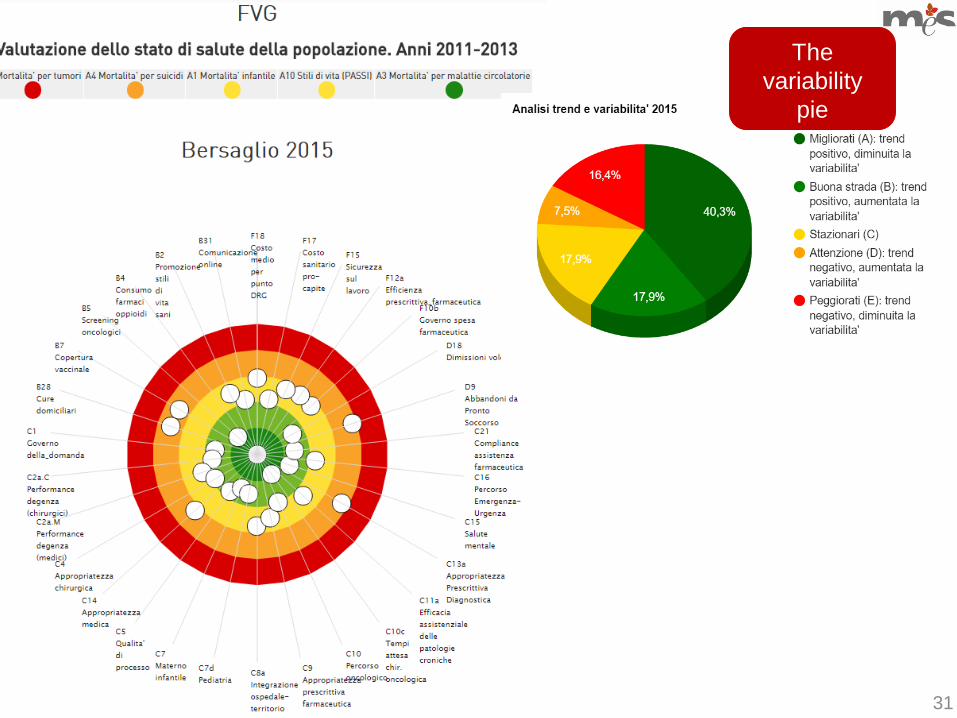
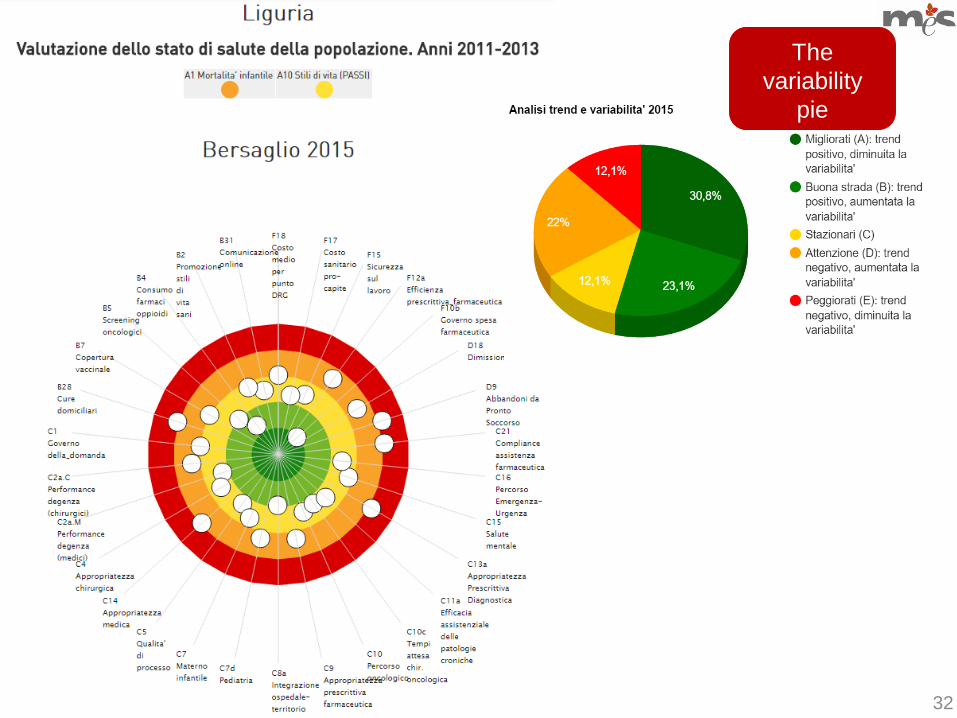
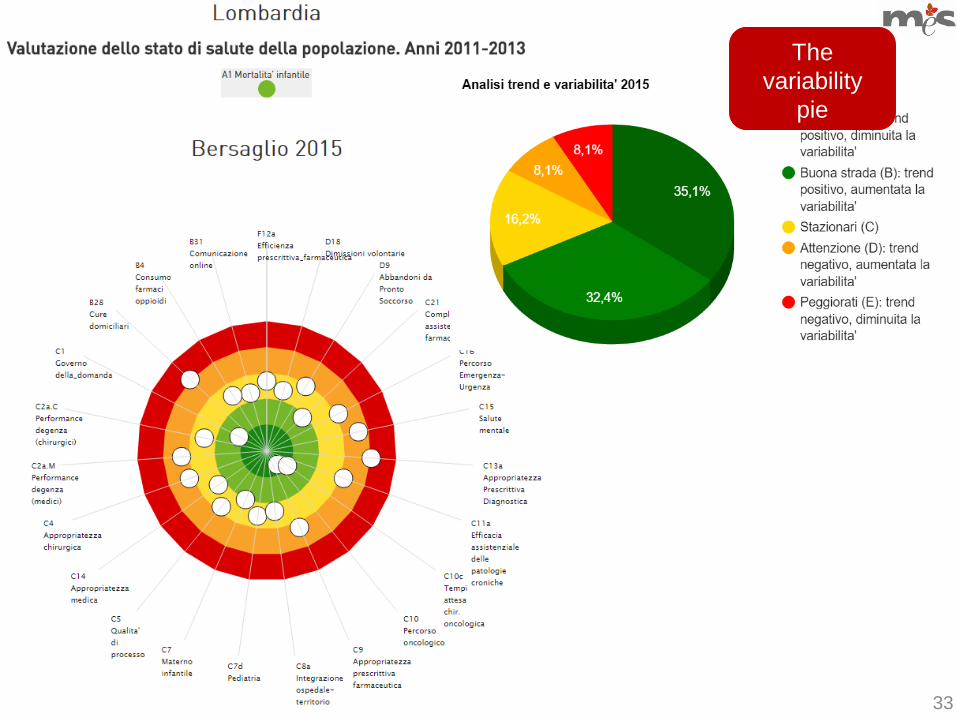
The
variability
pie
29
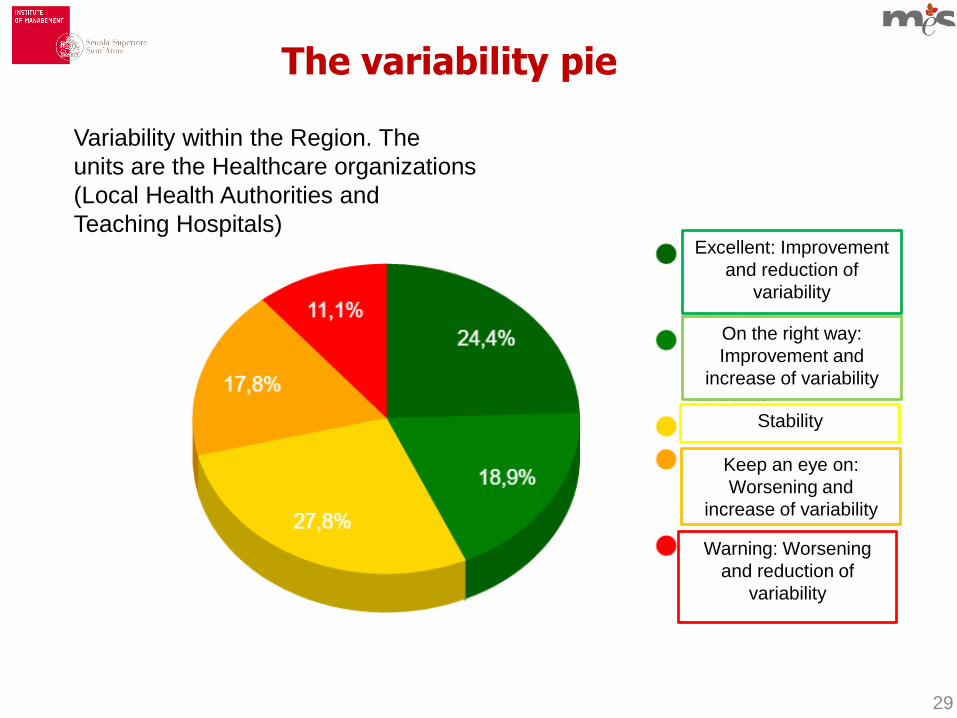
The variability pie
Excellent: Improvement
and reduction of
variability
On the right way:
Improvement and
increase of variability
Stability
Keep an eye on:
Worsening and
increase of variability
Warning: Worsening
and reduction of
variability
Variability within the Region. The
units are the Healthcare organizations
(Local Health Authorities and
Teaching Hospitals)
30
The
variability
pie
31
The
variability
pie
32
The
variability
pie
33
The
variability
pie
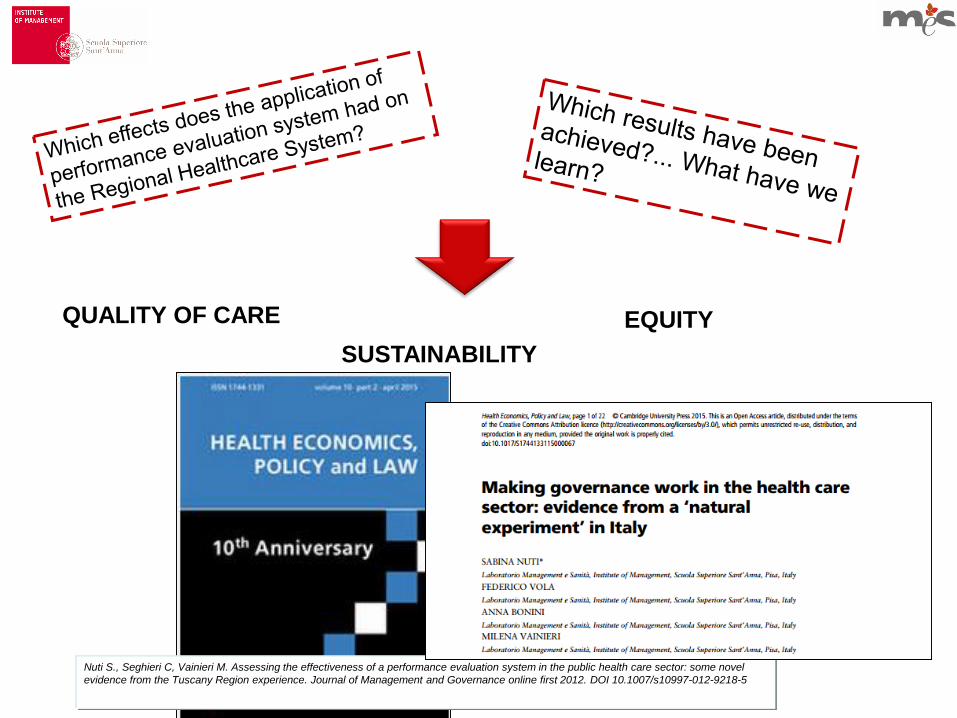
Nuti S., Seghieri C, Vainieri M. Assessing the effectiveness of a performance evaluation system in the public health care sector: some novel
evidence from the Tuscany Region experience. Journal of Management and Governance online first 2012. DOI 10.1007/s10997-012-9218-5
QUALITY OF CARE
SUSTAINABILITY
EQUITY
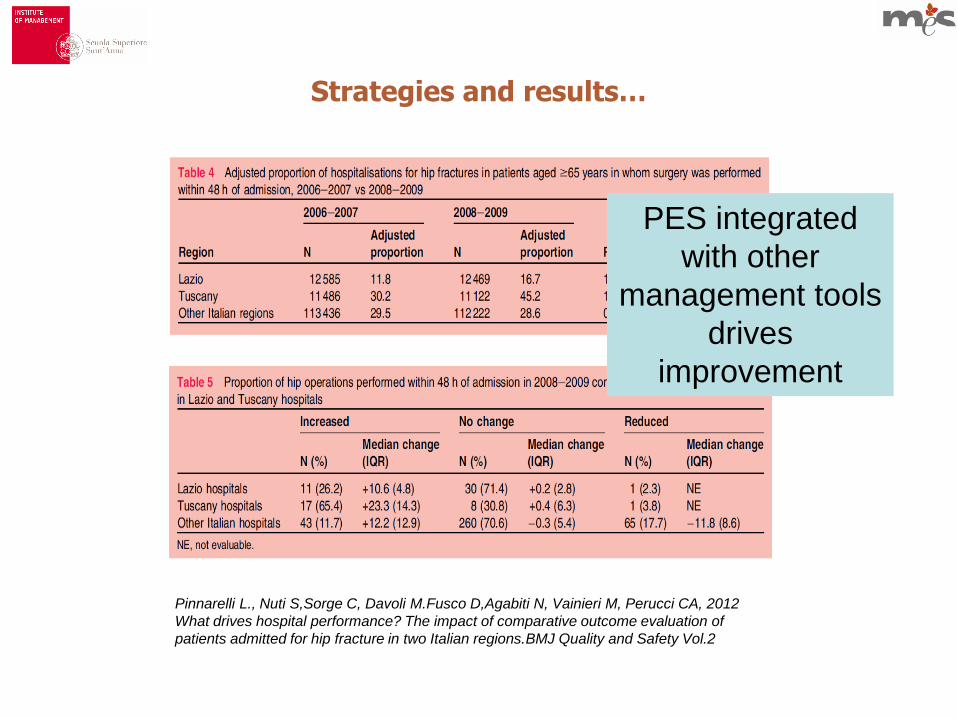
Pinnarelli L., Nuti S,Sorge C, Davoli M.Fusco D,Agabiti N, Vainieri M, Perucci CA, 2012
What drives hospital performance? The impact of comparative outcome evaluation of
patients admitted for hip fracture in two Italian regions.BMJ Quality and Safety Vol.2
Strategies and results…
PES integrated
with other
management tools
drives
improvement
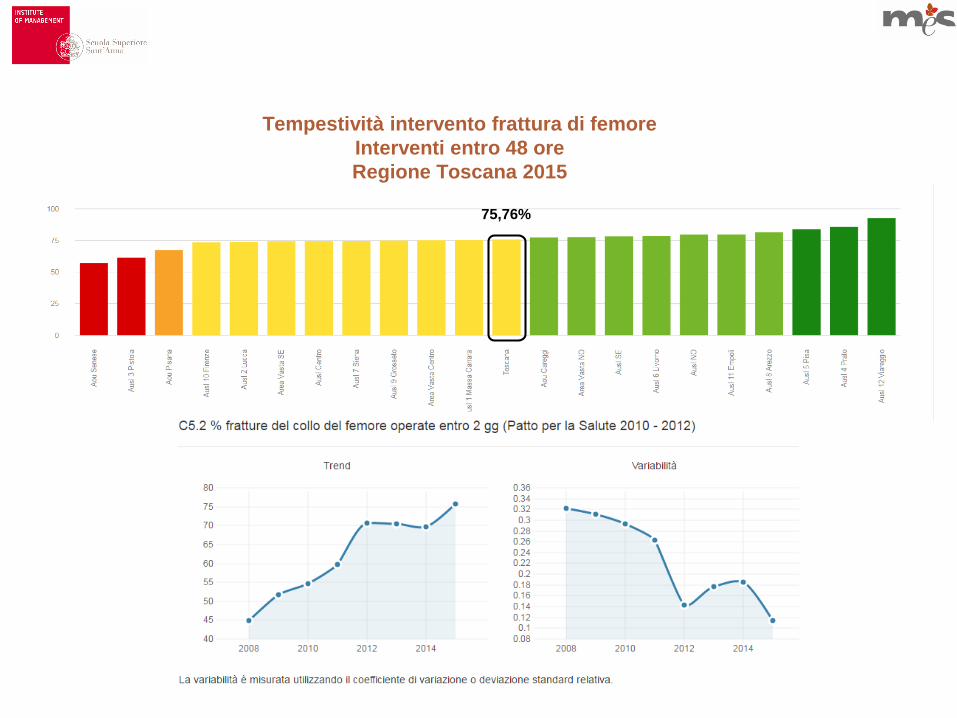
Tempestività intervento frattura di femore
Interventi entro 48 ore
Regione Toscana 2015
75,76%
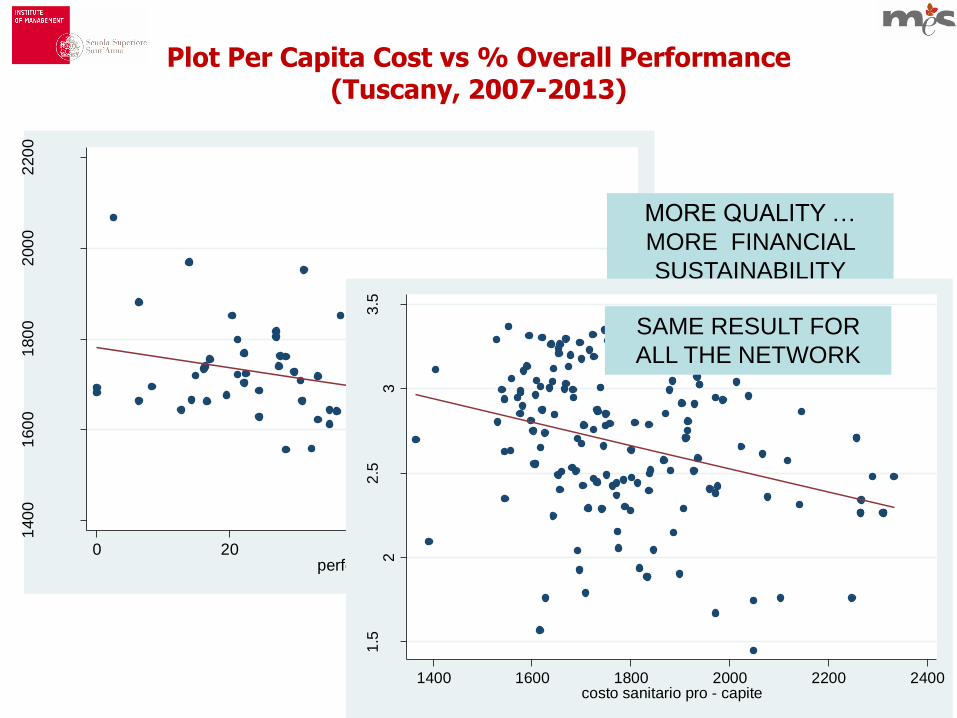
Plot Per Capita Cost vs % Overall Performance (Tuscany, 2007-2013)
Correlation coeff. = - 0.38
P < 0.001
140
01
60
01
80
02
00
02
20
0
co
sto
pro
-ca
pite
0 20 40 60 80performance
MORE QUALITY …
MORE FINANCIAL
SUSTAINABILITY
1.5
22
.53
3.5
perf
orm
ance
med
ia
1400 1600 1800 2000 2200 2400costo sanitario pro - capite
SAME RESULT FOR
ALL THE NETWORK
When Benchmarking, Public disclosure and Evalution process are in place
38
You can implement the following strategies
Evaluation Governance
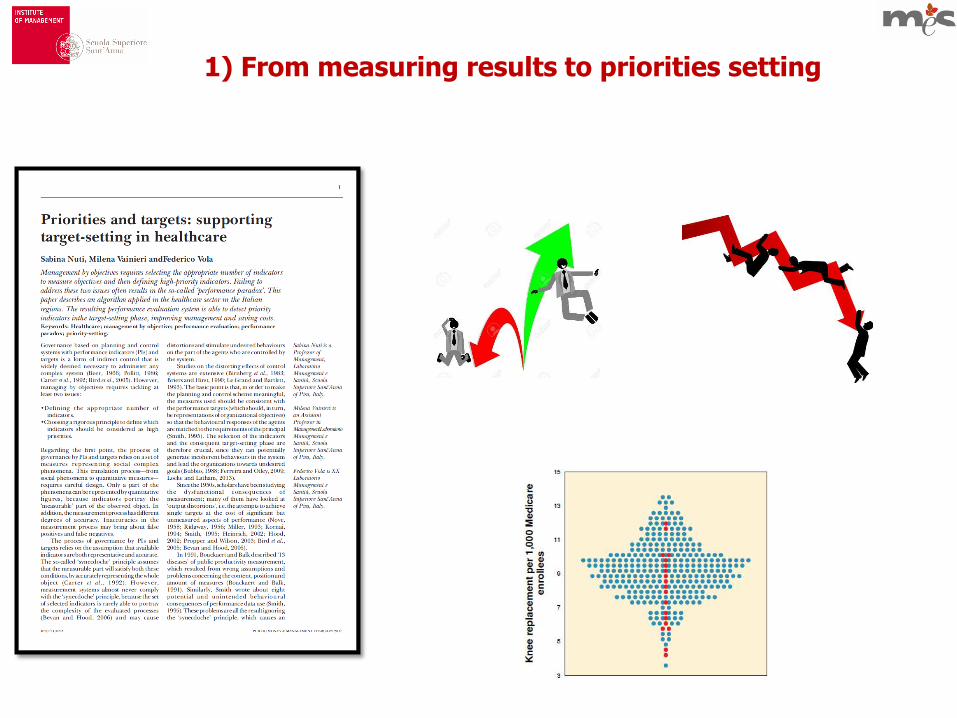
1) From measuring results to priorities setting
2) Coping with variation: including equity in the action plan
3) Coping with avoidable variation: reallocation strategies
Reducing variability amongproviders…
Tuscany health system couldre-allocate about 7% of its
financial budget
4) Setting challening targets and conductingfair evaluation
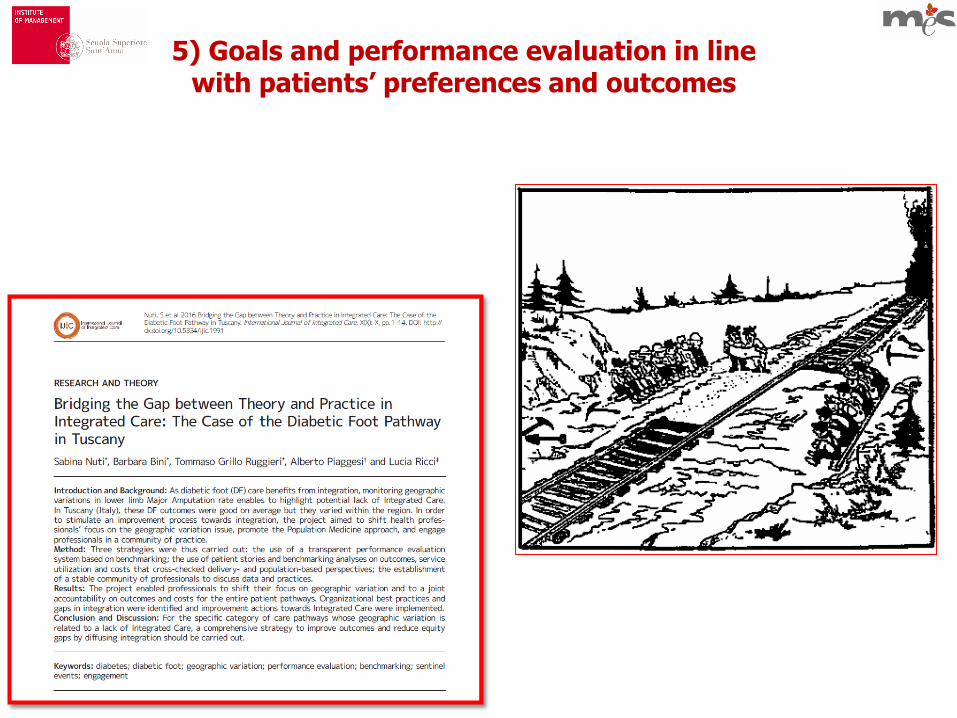
5) Goals and performance evaluation in line with patients’ preferences and outcomes
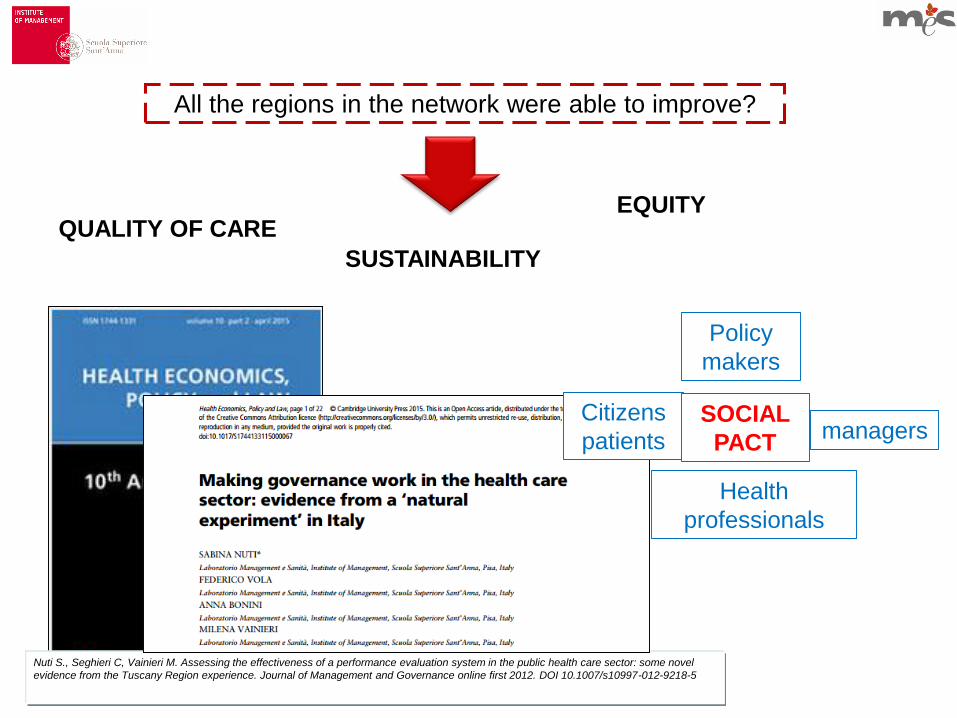
All the regions in the network were able to improve?
Nuti S., Seghieri C, Vainieri M. Assessing the effectiveness of a performance evaluation system in the public health care sector: some novel
evidence from the Tuscany Region experience. Journal of Management and Governance online first 2012. DOI 10.1007/s10997-012-9218-5
QUALITY OF CARE
SUSTAINABILITY
EQUITY
Policy
makers
Citizens
patients managers
Health
professionals
SOCIAL
PACT
There are only three common elements to healthcare systems that have improved on cost and quality over time
1. A public, specific statement of goals for improvement with a plan for reaching these goals
2. Public reporting of results with a clear link to improvement plans that become part of the strategy
3. Strong physician & clinical leadership of improvement efforts aligned to improvement goals, again supported by useful data
Strategies that fail to include these elements will fail an appeal to intrinsic incentives
Brown AD, Baker GR, Closson T, Sullivan TS. The journey towards high performance and excellent quality. Healthcare Quartely, 2012;15.
Regions taking care for population health should use this approach to reduce unwarranted variation, improve
and achieve equity, achieve sustainability
Nuti, S., Seghieri, C., & Vainieri, M. (2013). Assessing the effectiveness of a performance
evaluation system in the public health care sector: some novel evidence from the Tuscany
region experience. Journal of Management & Governance, 17(1), 59-69
Nuti, S., Vola, F., Bonini, A., & Vainieri, M. (2015). Making governance work in the health care
sector: evidence from a ‘natural experiment’in Italy. Health Economics, Policy and Law, 11(01),
17-38.
Vainieri M., Vola F., Gomez Soriano G., Nuti S. (2016), “How to set challenging goals and
conduct fair evaluation in regional public health systems. Insights from Valencia and Tuscany
Regions”, Health Policy in press
Nuti S; Seghieri C (2014) Is variation management included in regional healthcare governance
systems? Some proposal from Italy. Health Policy vo.114
Nuti S. Vainieri M, Bonini A (2010) Disinvestment for reallocation: a process to identify priorities
in healthcare. Health Policy. Vol95
Nuti S. Vainieri M (2014) Strategies and tools to manage variations in regional governance
systems. Handbook on health services research Vol 1 Springer
Nuti S. Vola F. Vainieri M. (2017) Priorities and targets: a methodology to support the policy-
making process in healthcare. Public money and management, forthcoming
Nuti S., Grillo-Ruggieri T., Podetti S. (2016), Do university hospitals perform better than general
hospitals? A comparative analysis among Italian regions, BMJ Open 2016;6:e011426.
doi:10.1136/bmjopen-2016- 011426
2014 Report Evaluating the network healthcare system performance, accessible online
www.meslab.sssup.it/en/
46
Selected bibliography