Embed Size (px)
Citation preview

The Performance Prediction of A TBM in Difficult Ground Condition
Nuh BİLGİN, Cemal BALCI, Hakan TUNÇDEMİR, Şinasi ESKİKAYA Department of Mining Engineering, Technical University of İstanbul, Turkey. Mustafa AKGÜL, Melih ALGAN STFA Construction Company, Turkey. ABSTRACT: Tuzla-Dragos Sewerage Tunnel is situated in the Asian Side of Istanbul. A detailed laboratory full-scale cutting tests were used on rock samples collected from tunnel side. The equipment used for the tests is developed under NATO TU-Excavation Project in Istanbul Technical University, Mining Engineering Department. Test results were used to predict the cutting performance of a TBM. Actual and predicted values are later compared using a rating system for machine utilization. RÉSUMÉ :Le tunnel Tuzla-Dragos construit pour le reject d’eau pollué est situé au coté l’Anatolie de la Turquie. Pour réaliser les essais on a développé un équipements dans l’Université Technique d’Istanbul à la Faculté des Mines à l’aide du financement obtenu par le project d’excavation NATO-TU. On a profité des résultats des essais pour la suggestion de la performance d’excavation TBM. En comparant les mesures en place avec certaines suppositions, on a fait des critiques sur la validité du module 1 INTRODUCTION Prediction of a TBM (Full Face Tunnel Boring Machine) performance plays an important factor in decision making for a tunnel contractor. There are several factors which govern the performance of a TBM. These are mainly rock mass properties, geological conditions, machine parameters, machine maintenance facilities, experience of contractors and TBM operator. Several prediction models were used in the past to estimate the machine performance. The model developed in the EMI of CSM (Earth Mechanics Institute of Colorado School of Mines) is mainly based on full-scale laboratory cutting tests. However the model developed jointly by University of Torenthiem and Norwegian Institute of Technology is semi emprical based on data base accumulated during past experiences (Lislerud 1988, Nilsen and Özdemir 1993, Rostami and Özdemir 1994, Johansen 1995). The model described in this paper is similar to one used by the staff of CSM. Some rock samples were collected from tunnel side and a full scale laboratory cutting test programme was carried out on these samples. The predicted and field measured machine performance values are later compared in order to see the validity of the model for a competent rock. These results discussed is detailed in World Tunnel Congress which was hold in Oslo (Bilgin et all 1999). However this paper differs from the previous one in the way that, the geological discontinuities,

groundwater, weathering and the maintenance facilities and contractor experience effecting the machine performance are emphasized in details with several examples taken from the field data. 2 DESCRIPTION OF THE TUNNEL PROJECT 2.1. General outline Tuzla-Dragos Sewerage Tunnel is situated in a highly populated area of the Asian Side of Istanbul. Tunnels having a total length of 6490m and final diameter of 4.5m is completed by STFA Construction Company. The tunnels between X1-X3 and K1 shafts having a length of 1670m and a depth changing between 6m and 17m are opened with Robbins TBM, Model 165-162 having a diameter of 5m. General view of the machine is illustrated in Figure 1 and final cross section of the tunnel is given in Figure 2.
Figure 1 - General View of Robbins TBM, Model 165-162
Figure 2 - Final Cross Section of the Tunnel

The specification of the Robbins 165-162/E1080 TBM is given Table 1
Table 1 - The specifications of the Robbins 165-162/E1080 TBM Property Values Machine diameter 5.0 m Number of cutters 36 Rotational speed 6 rpm Normal thrust force 471 tons Maximum thrust force 785 tons Cutting head power 600 HP Power of the miscellaneous pumps etc. 285 HP
Conveyor belt capacity 476 m3/h Electrical transformer 1000/380V-50Hz
2.2 Geology The main rock formation in the area is Lower Devonian aged Kartal formation composed of shale and limestone. In the upper levels there is Pliocene aged Belgrad Formation of sand, gravel and silt, and Quaternary aged sediments. Diabase dykes of Cretaceous ages cut Kartal Formation in several places. The tunnels between X1-X3 and K shaft are mainly driven within limestone and shale. Limestone of gray-blue in color is in medium thickness, sandy and fractured in several places, shale of dark gray-black in color is carbonated, mainly jointed and laminated. 3 LABORATORY FULL-SCALE CUTTING TEST RESULTS 3.1. The philosophy behind the laboratory rock cutting tests As a basic rule of rock cutting mechanics, optimum specific energy for a given cutting tool and rock formation, is obtained for a defined s/d ratio. Specific energy is the energy to excavate a unit volume of rock (kwh/m3) and s/d is cutter spacing/cutting depth ratio. This phenomenon is illustrated in Figure 3.
s/d
SEKwh/m3
d
s
Figure 3 - The hypothetical relationship between specific energy and spacing/depth ratio.
Disc Cutter
The point where the rock between grooves, breakes off.

Bearing in mind the distance between disc cutters in a TBM cutting head is constant, the optimum s/d ratio will directly dictate optimum cutting depth. The relationship between depth of cut, disc thrust force, disc rolling force, may be obtained directly from full-scale rock cutting tests realized on big size rock blocks representing the rock formation which are likely to be found in tunnel line. Thrust force for a predetermined depth of cut will directly dictate total machine thrust which the machine operator must apply for an efficient cutting operation. Rolling force for a given disc cutting depth, may be directly used to calculate the power consumed during the cutting process. The torque and the power consumed in optimum cutting conditions may be calculated with the following formulas.
T= ∑=
=
×ni
iRi Fr
1
(1)
NTP π2= (2)
In these formulas FR is rolling force, n the total number of disc cutters in cutting head of the TBM, ri is the distance from the cutter to the center of the machine, T is torque and N is revolution per minute of the cutting head and P is the power consumed during the cutting operation. Instantaneous cutting rate or net cutting rate may be calculated using the relation given in formula 3.
)/()(
3mkwhSEkwPkICR ×= (3)
In the formula 3 (ICR) is instantaneous cutting rate in m3/h, k is the energy transfer ratio changing between 7 and 8, (P) is power consumed during the cutting process and (SE) is optimum specific energy obtained in full-scale laboratory cutting tests as explained in Figure 3. 3.2. Laboratory full-scale cutting tests The general view of the full-scale cutting rig is given in Figure 4. This rig is designed and manufactured within NATO-TU excavation project with the generous help of Prof.Dr. Levent ÖZDEMİR, from EMI of CSM.
Figure 4 - General view of full-scale cutting rig

The experimental rig can accommodate rock samples up to 1 x 0.7 x 0.7 m. in size. An high quality aircraft aluminum block equipped with strain gages is used as a dynamometer to record thrust forces up to 50 tons and rolling forces up to 20 tons and a data acquisition system, which is used to record the cutter forces in three directions. The hydraulic cylinders can move the rock samples in horizontal and lateral direction for adjusting cutter spacing and realizing the cutting action. The rock samples are casted within rock boxes in order to eliminate pre-failure of the rock specimen. The cutter is fixed with a tool holder directly to the dynamometer. A rock specimen, which is likely to represent the majority of the geological formation in tunnel line is taken from the tunnel side and subjected to cutting tests using experimental equipment described above. The rock sample tested has a compressive strength value of 579 ± 56 kg/cm2 and a tensile strength value 36 ± 3 kg/cm2 . A CCS (Constant Cross Section) disc having a diameter of 33 cm and profile as shown in Figure 5, is used for cutting experiments. This disc is a real life cutter and taken from the cutting head of the TBM.
Figure 5- The profile of constant cross section disc used in cutting experiments
The relationship between rolling force, thrust force and depth of cut for unrelieved cutting are shown Figure 6 and 7. The relationship between specific energy values and s/d ratios are given in Figure 8.
010
2030
40
50
60
0 2 4 6 8 10 12
d (mm)
Thru
st F
orce
FT
(kN
)
CCS
Figure 6 - The relationship between mean thrust force and depth of cut.
0
2
4
6
8
0 2 4 6 8 10 12
d (mm)
Rol
ling
Forc
e FR
(kN
)
CCS
Figure 7 - The relationship between mean rolling force and depth of cut.

01
23
4
5
6
0 4 8 12 16 20 24
s/d
SE
(k
Wh/
m3)
CCS
Figure 8 - The relationship between specific energy and s/d ratios.
The cutting test results may be summarized as; the slope of forces are FT (kN/mm) = 5.21, F’T(kN/mm)= 8.34, FR(kN/mm) = 0.64, F’R(kN/mm) = 1.09. FT and F’T are mean and peak thrust forces; FR and F’R are mean and peak rolling forces respectively. Optimum specific energy value obtained for 8-10 s/d ratios is 2.1 kwh/m3. 4 TBM PERFORMANCE PREDICTION 4.1. TBM performance prediction in competent rock and comparison of predicted and field measured values Steps followed for machine performance production is as follows;
Optimum specific energy value for s/d ratios=8-10 is obtained to be SE=2.1 kwh/m3, see Figure 8. From machine specification cutter spacing is s=7.5cm which dictates that for an efficient cutting process depth of cut, for one machine revolution, should change between 0.8cm and 1cm. Test results indicate that peak thrust force must change between 66.7 kN and 83.4 kN and mean rolling force must change between 5.1kN and 6.4kN per disc. Bearing in mind that there are 36 discs in the cutting head, optimum total thrust of the machine must kept between 36×8×8.34≅2400kN and 36×10×8.4≅3000kN.
Formulas (1), (2) and (3) which are given in section 3 indicate that expected torque of the machine is to be between 253 kN×m and 317 kN×m, the power consumed during the excavation is predicted to be between 160kw and 200kw, and net excavation rate to be between 60 and 70 m3/h. In competent rock an average machine utilization factor of 30% and 16 hours of working time per day will result a daily advance rate of
daymmh
mh /. 15
425
3060162
3=
××
××
π
The details of these calculations are given in the paper submitted in Oslo World Tunnel
Congress (Bilgin et all, 1999). In order to compare predicted and actual machine cutting rates in competent rock, eleven different zones were chosen for in situ observations of the TBM performance. It is paid a special attention to the fact that the rock formation in selected zones should have similar mechanical properties with those tested in full-scale laboratory cutting rig. Measured and predicted values are compared in Table 2. As it can be clearly seen from this table, the predicted values are very close to actual values.

4.2.Performance prediction in difficult ground Tuzla-Dragos district is highly populated area of Istanbul. This fact limited the number of drill holes for side investigation. Geotechnical and other studies carried out before starting the excavation, indicated that highly fractured clayes zone with excessive water income should be expected during tunnel drivages resulting low machine utilization time and low daily advance rates than expected for competent rock. A data base accumulated during past experiences aided to formulate a rating system for machine utilization which is given in Table 3. The one using this table must be remembered that this is only valid for a double shielded TBM and a support system with wire mesh, shotcrete, steel arch and a secondary lining. However it is recommended that for an open type TBM and a precast segment support system, the reader should refer to another paper (Bilgin et all 1993).
Table 2 Comparison and predicted of measured TBM performance values. Selected Zone Disc Cutting Measured Predicted Measured Predicted
Date Tunnel (km)
Depth (mm)
F′T kN./disc
F′T kN/disc
Net cutting rate m3/h
Net cutting rate m3/h
14.10.1997 172.7 11 73.9 91.3 71 80 15.10.1997 175.3 7 69.8 58.1 49 53 16.10.1997 190.2 8 69.9 66.4 57 61 17.10.1997 194.0 9 72.3 75.1 64 60 28.10.1997 225.6 7 59.3 58.1 49 53 30.10.1997 227.9 10 117.2 83.0 71 70 04.11.1997 251.3 8 111.2 66.4 57 61 11.10.1997 272.1 11 123.7 91.3 71 80 13.11.1997 275.4 9 89.0 75.1 64 60 14.11.1997 275.4 13 126.2 107.8 92 74 18.11.1997 284.5 8 96.0 66.4 57 61
Table 3 Rating for machine utilization (RMU) using double shielded TBM and wire mesh, shotcrete, steel arch and secondary lining system
RQD >70 70-50 50-30 30-20 <20 Ratings 10 8 4 2 0
Water Income Non Wet Drop Leakage High Income Ratings 4 3 2 1 0
Clay Content Non Very Little Filling Between fractures High amount Excessive
Ratings 4 3 2 0 0 Maintenance
Facilities Extremely good Very good Good Fair Poor
Ratings 6 5 4 2 0 Contractor Experience Extremely good Very good Good Fair Poor
Ratings 6 5 4 2 0
RMU<16 Machine Utilization %3-5 RMU<16-20 Machine Utilization %5-10 RMU<20-22 Machine Utilization %10-20 RMU<22-24 Machine Utilization %20-30 RMU<24-26 Machine Utilization %30-45
A typical example to the prediction of TBM performance in difficult ground in Tuzla Tunnel is given below;
Estimated cutting rate in competent shale is found to be 60m3/h (see section 4.1). In tunnel chainage 0+1028m, RQD is predicted to be 5, high amount of water income and excessive clay content between the fractured zones are expected to be encountered. The maintenance facilities and contractor experience are rated very good. Referring to Table 3. The rating for machine utilization in this zone is calculated to be (0+0+0+5+5); RMU=10 and machine
utilization factor is estimated to be 5%. 24 hours working time per day will result a daily advance rate of
daymmh
mh /.. 22
425
3060242
3=
××
××
π
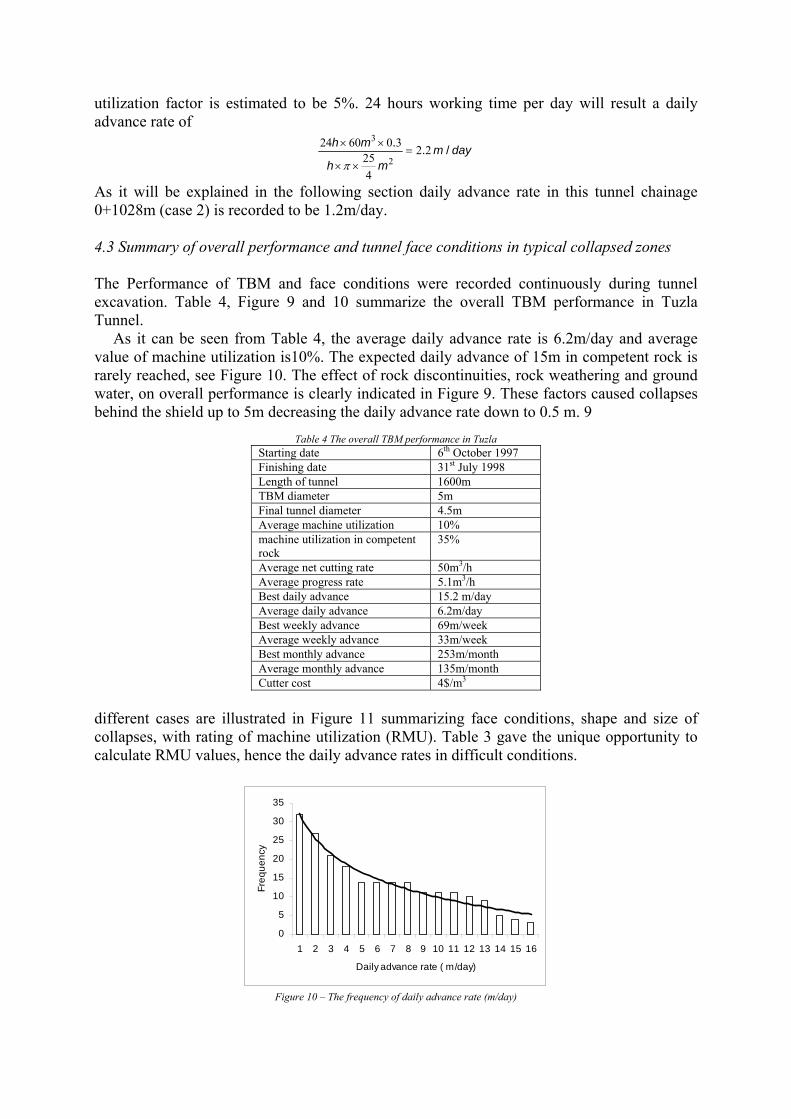
As it will be explained in the following section daily advance rate in this tunnel chainage 0+1028m (case 2) is recorded to be 1.2m/day. 4.3 Summary of overall performance and tunnel face conditions in typical collapsed zones The Performance of TBM and face conditions were recorded continuously during tunnel excavation. Table 4, Figure 9 and 10 summarize the overall TBM performance in Tuzla Tunnel.
As it can be seen from Table 4, the average daily advance rate is 6.2m/day and average value of machine utilization is10%. The expected daily advance of 15m in competent rock is rarely reached, see Figure 10. The effect of rock discontinuities, rock weathering and ground water, on overall performance is clearly indicated in Figure 9. These factors caused collapses behind the shield up to 5m decreasing the daily advance rate down to 0.5 m. 9
Table 4 The overall TBM performance in Tuzla
Starting date 6th October 1997 Finishing date 31st July 1998 Length of tunnel 1600m TBM diameter 5m Final tunnel diameter 4.5m Average machine utilization 10% machine utilization in competent rock
35%
Average net cutting rate 50m3/h Average progress rate 5.1m3/h Best daily advance 15.2 m/day Average daily advance 6.2m/day Best weekly advance 69m/week Average weekly advance 33m/week Best monthly advance 253m/month Average monthly advance 135m/month Cutter cost 4$/m3
different cases are illustrated in Figure 11 summarizing face conditions, shape and size of collapses, with rating of machine utilization (RMU). Table 3 gave the unique opportunity to calculate RMU values, hence the daily advance rates in difficult conditions.
0
5
10
15
20
25
30
35
1 2 3 4 5 6 7 8 9 10 11 12 13 14 15 16
Daily advance rate ( m/day)
Freq
uenc
y
Figure 10 – The frequency of daily advance rate (m/day)
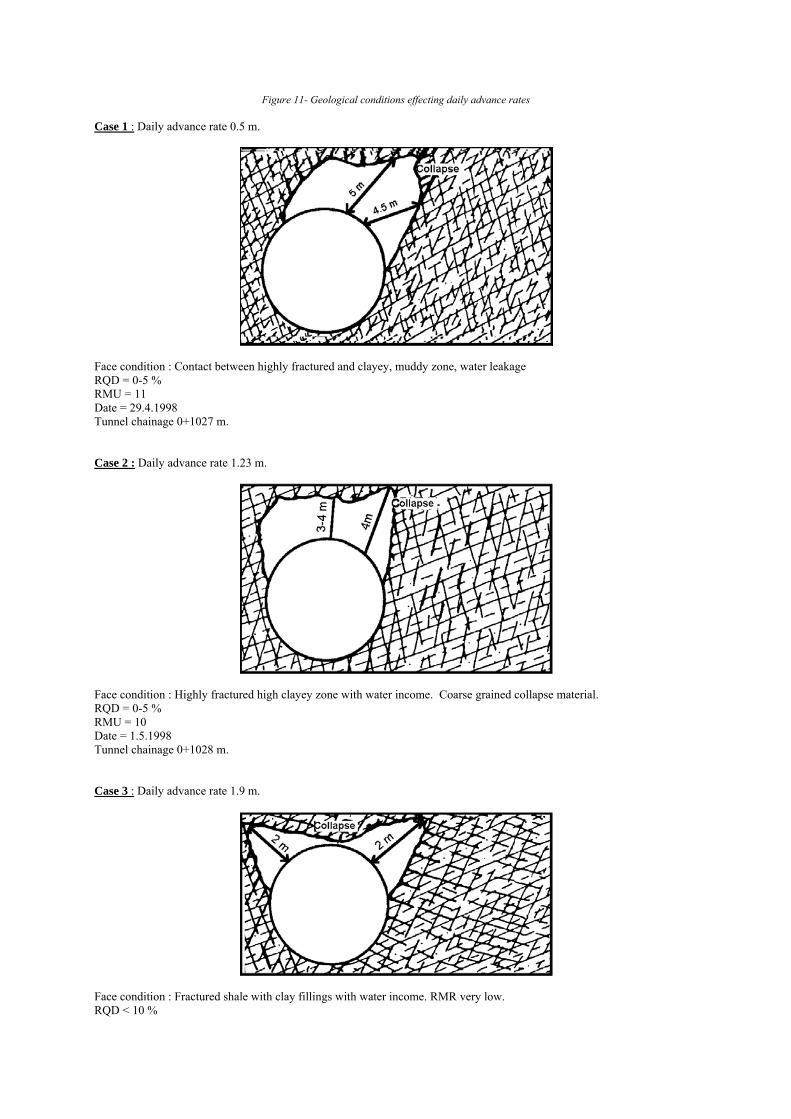
Figure 11- Geological conditions effecting daily advance rates Case 1 : Daily advance rate 0.5 m.
Face condition : Contact between highly fractured and clayey, muddy zone, water leakage RQD = 0-5 % RMU = 11 Date = 29.4.1998 Tunnel chainage 0+1027 m. Case 2 : Daily advance rate 1.23 m.
Face condition : Highly fractured high clayey zone with water income. Coarse grained collapse material. RQD = 0-5 % RMU = 10 Date = 1.5.1998 Tunnel chainage 0+1028 m. Case 3 : Daily advance rate 1.9 m.
Face condition : Fractured shale with clay fillings with water income. RMR very low. RQD < 10 %

RMU = 14 Date = 11.11.1997 Tunnel chainage 0+267 m. Case 4 : Daily advance rate 3.6 m.
Face condition : Very fractured shale RQD < 20 % RMU = 18 Date = 22.01.1998 Tunnel chainage 0+575 m. Case 5 : Daily advance rate 4.1 m.
Face condition : Altered mudstone – siltstone zone RQD = 20-30 % RMU = 20 Date = 16.12.1997 Tunnel chainage 0+380 m. Case 6 : Daily advance rate 6 m.
Face condition : Highly fractured mudstone – siltstone with water income. RMR very low. RQD< 25 % RMU = 19 Date = 19.04.1998 Tunnel chainage 0+1008 m. Case 7 : Daily advance rate 7.8 m.

Face condition : Fractured mudstone – sandstone, high water income which speeds the collapses. RQD = 30-50 % RMU = 19 Date = 15.07.1998 Tunnel chainage 0+1678 m. Case 8 : Daily advance rate 10.3 m.
Face condition : Shale, water leakage. RQD = 30-50 % RMU = 20 Date = 9.1.1998 Tunnel chainage 0+512 m. Case 9 : Daily advance rate 12.3 m.
Face condition : Mudstone – siltstone, fractured rock, water income is accelerating the overbreak. RQD = 30-50 % RMU = 21 Date = 6.6.1998 Tunnel chainage 0+1187 m. 5 - CONCLUSIONS One of the most important factors for the prediction of the cost and finishing time of a tunnelling operation using a TBM is the correct prediction of the overall performance. Full-scale laboratory cutting tests help to estimate the net cutting rate of the machine in a competent rock. However the effect of the machine utilization time is also dominant factor in the calculation of daily advance rates. In this paper a rating system taken into account the geological discontinuities, water income, clay content of the rock formation, maintenance facilities and contractor experience is discussed within the scope of the estimating machine

utilization time. However it should be mentioned that this rating system needs any further development since it is only valid for a double shielded TBM and a tunnel support system with wire mesh, steel arch, shotcrete and final lining. It is strongly emphasized that the accumulated data in difficult ground condition will help the tunnel engineer to make correct estimation of the overall performance of a tunneling operation. 6 - ACKNOWLEDGEMENT This paper is prepared within the research program of the NATO-TU Excavation Project. The research program described in this paper is financially sported by STFA Construction Company. The authors express their appreciation to the authorities of NATO Science for Stability Program, STFA Construction Company and Prof. Levent Özdemir from EMI, Colorado School of Mines for his generous help and consultancy, Dr. Rahmi Eyuboglu for help in drawings. REFERENCES 1. Bilgin N., Balcı C., Acaroğlu Ö., Tunçdemir H., Eskikaya Ş., Akgül M., Algan M, (1999), Performance
Prediction of a TBM in Tuzla-Dragos Sewerage Tunnel, World Tunnel Congress, Oslo 29th May –3rd June, Proceedings Published by Balkema
2. Bilgin N., Nasuf, E.,Cigla, M. (1993). Stability problems effecting the performance of a full face tunnel boring
machine in Istanbul Baltalimani Tunnel, Assessmnet and prevention of failure phenomena in rock engineering, Balkema ISBN 90 5410 3094, pp. 501-506.
3. Lislerud, (1988), Hard rock tunnel boring, prognasis and costs. Tunneling and Underground Space
Technology, Vol 3, pp. 9-17. 4. Johanessen, O; 1995. Hard rock tunneling boring, University of Trondheim, The Norwegian Institute of
Technology pp. 165. 5. Nilsen B, Ozdemir L. 1993. Hard rock tunnel boring prediction and field performance, RETC, Boston: pp.13-
17. 6. Rostami, J, Ozdemir, L,. Neil, M.D. (1994). Performance prediction, a key issue in mechanical hard rock
mining. Mining Engineer, 11, pp.1263-1267.


![TBM 렌탈솔루션 - cafe24mrrental.cafe24.com/tbm/tbmrs_service_introduction.pdf · 01. TBM 렌탈솔루션소개 [이미지출처: 효성에프엠에스뉴스레터(2019.01.28)]](https://img.pdfslide.net/doc/110x75/5ece13d36c14a753b559968e/tbm-eoefe-01-tbm-eoefeoeeoe-eoe-ee20190128.jpg)