Embed Size (px)
Citation preview
International Conference on Tunnel Boring Machines in Difficult Grounds (TBM DiGs) Singapore, 18–20 November 2015
THE ROLE OF SLURRY TBM PARAMETERS ON GROUND
DEFORMATION: FIELD RESULTS AND COMPUTATIONAL MODELING
Mike Mooney1, Jacob Grasmick
2, Bernadette Kenneally
3, Yong Fang
4
1Center for Underground, Colorado School of Mines, Golden, Colorado, USA. Email: [email protected]
2Center for Underground, Colorado School of Mines, Golden, Colorado, USA. Email: [email protected]
3Center for Underground, Colorado School of Mines, Golden, Colorado, USA. Email: [email protected]
4School of Civil Engineering, Southwest Jiaotong University, Chengdu, China, and Center for Underground,
Colorado School of Mines, Golden, Colorado, USA. Email: [email protected]
ABSTRACT: This paper examines the role of slurry TBM operational parameters, namely face, annulus
and grout pressures, on ground deformation. The analysis includes both field data and computational
modeling. Field data from the very successful Queens bored metro tunnels (6.9 m diameter) project in New
York city is employed to illustrate phenomenalogically how ground deformation was controlled via slurry
TBM parameters. Computational modeling is then employed to support the experimental findings and to
further investigate the relative influence of TBM parameters through parametric analysis. The results
quantify the importance of the various pressures on controlling ground deformation.
KEYWORDS: ground deformation; slurry; modeling
1. INTRODUCTION
Pressurized-face tunnel boring machines (TBM), such as slurry shield and earth pressure balance (EPB), are
increasingly employed in urban tunnel construction to control ground deformation. Pressurized-face TBMs
generate support pressures at the tunnel face (face pressure), along the shield skin (annulus pressure) and
behind the shield tail outside the lining segments (grout pressure) that play a significant role in limiting
ground and building deformation. The applied support pressures act against the total earth pressure (vertical
and horizontal effective stress and hydrostatic pore water pressure) along the TBM and tunnel boundary. It is
well understood from a geotechnical framework that changes in effective stress induce ground and thus
building deformation. Changes in effective stress during TBM tunnelling result from vertical and lateral
stress release, soil arching, and hydraulic gradients created if groundwater is allowed to flow into the face.
Ground surface settlement and building movements are classically related to volume loss at the TBM
(Peck 1969). Assumed and reported volume losses have decreased considerably from 1% of the excavated
volume 15 years ago (FHWA 2009) to less than 0.5% on numerous recent projects. One such example is the
Queens bored tunnel where surface settlements of 10 mm or less were the norm, equating to sub 0.2%
volume loss (Mooney et al. 2014). These data point to highly effective pressurized face TBM tunnelling. As
the industry comes to accept very limited ground deformation and volume loss as the norm, it becomes very
important to carefully understand the relationship between ground deformation and face, annulus and grout
pressures.
This paper presents the results of a data-driven modeling study to investigate the relationship between
ground deformation and face, annulus and grout pressures. Data from Queens bored slurry shield TBM
tunnelling project in New York City is used to both train a 3D finite element model and serve as input for a
parametric study. This paper provides a brief background to the East Side Access Queens bored tunnels.
Based upon construction records, computational modelling using finite difference (FD) analysis was
conducted to investigate 3D ground deformation during slurry shield pressurized-face tunnelling and the
results compared against field measurements. The paper then presents computational model based parametric
analysis of face pressure, annulus pressure and grouting pressure, examining their influence on ground
settlement.
2. GROUND CONDITIONS AND TBM
2.1 Overview
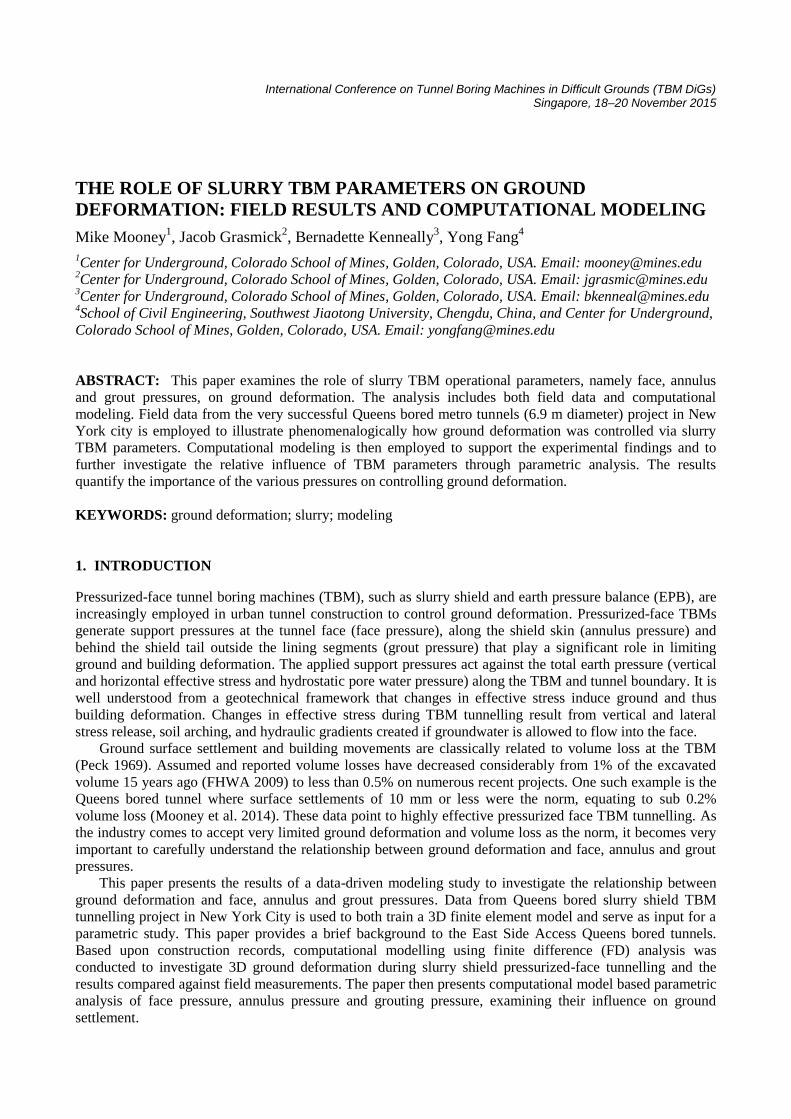
The East Side Access Queens bored tunnels project involved the construction of four near surface, closely
spaced metro transit tunnels beneath the rail yards and mainline railroad tracks in Sunnyside yards in
Queens, New York (Figure 1). The four tunnels totaling 3,251 m in length (refer to table in Figure 1 for
individual tunnel lengths) were constructed by the joint venture of Granite Construction Northeast, Inc.,
Traylor Bros. Inc., and Frontier-Kemper Constructors, Inc. in 2011 and 2012. The cross-section at the launch
wall (Figure 1) illustrates the four tunnel configuration. At the launch wall, excavation of tunnel YL began at
a depth of 22.9 m below the existing ground surface. Tunnel A began 11.9 m deep and tunnels D and BC
11.7 m deep. Tunnel YL was driven first, followed by tunnels A, D and BC. The project is described in detail
by Robinson & Wehrli (2013a,b).
Figure 1. Queens bored tunnels layout and launch wall configuration. Two 6.9m diameter Herrenknecht mix-
shield TBMs used for the four tunnel drives.
2.2 Geology
Along the tunnel alignment, the ground conditions consist of highly variable glacial till soils and outwash
deposits that include various sandy soil with some small lenses of clay, silt and gravel present. In addition,
large boulders (up to 2 ft) and cobbles were frequently encountered in the glacial till stratum. The majority of
tunnels A, D and BC were excavated in the glacial till soil. The first 130 m of tunnel YL was excavated in
fractured gneiss bedrock while the rest of the excavated alignment encountered glacial till and Gardner’s clay
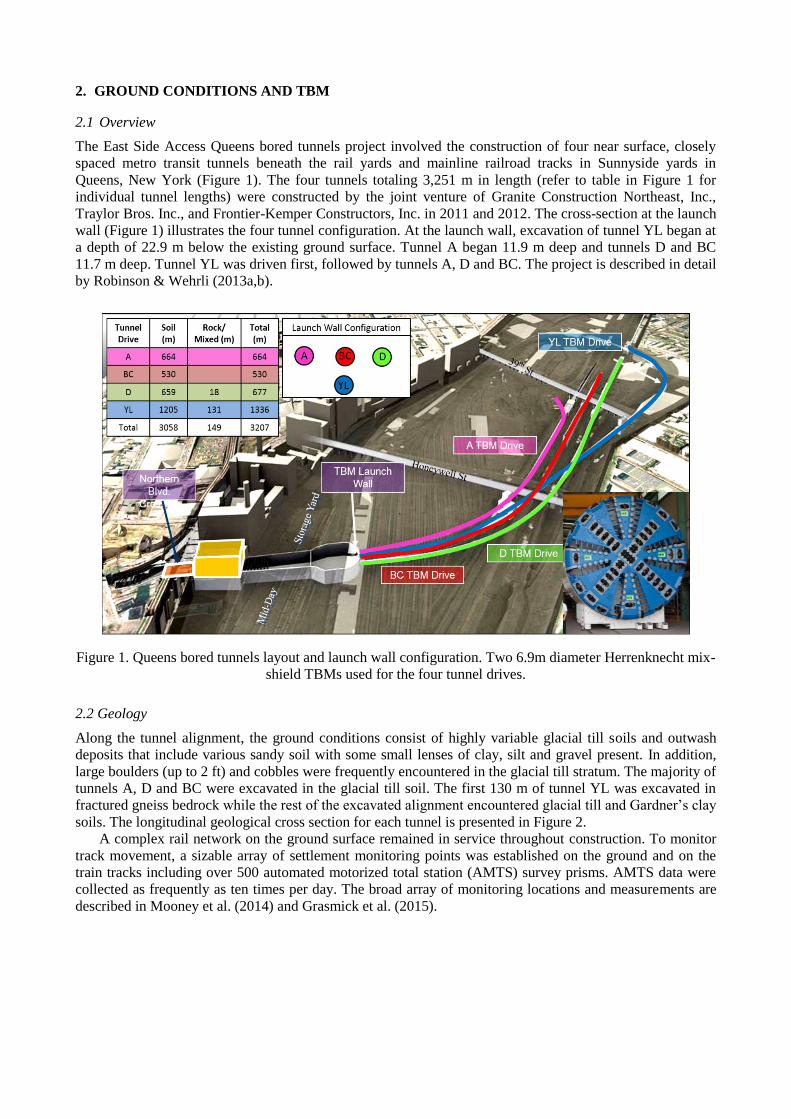
soils. The longitudinal geological cross section for each tunnel is presented in Figure 2.
A complex rail network on the ground surface remained in service throughout construction. To monitor
track movement, a sizable array of settlement monitoring points was established on the ground and on the
train tracks including over 500 automated motorized total station (AMTS) survey prisms. AMTS data were
collected as frequently as ten times per day. The broad array of monitoring locations and measurements are
described in Mooney et al. (2014) and Grasmick et al. (2015).
Figure 2. Geological profile along each of the four tunnels (from top to bottom):
YL (partial), A, D and BC.
2.3 Slurry Shield TBMs
Two 6.9 m (22.5 ft) diameter Herrenknecht slurry (mix) shield TBMs were used to construct the four
tunnels (Figure 1). As shown in Figure 3, face stability was maintained using bentonite slurry support. The
slurry forms a filter cake in front of the cutterhead at the plane of the soil/tool interface and acts against the
lateral effective earth pressure and pore water pressure. The slurry pressure was controlled by the air bubble
in the working chamber. The slurry pressure at the face, measured by an array of chamber pressure sensors,
increases with depth due to the unit weight of the slurry (approx. 12 kN/m3). The total cutterhead force,
created by aggregation of tool/soil normal force interaction, creates an additional horizontal average pressure
on the formation soil. The cutterhead force was not measured on this TBM and therefore is unknown.
Previous research suggests cutterhead pressure is negligible and face pressure is equal to chamber slurry
pressure (Bezuijen and Talmon 2014). Accordingly, we neglect cutterhead force/pressure in the FE
modelling and analysis.
The excavated diameter at the cutterhead was 30 mm greater than the shield diameter at the front and 50
mm greater than the tail shield diameter, creating a 15-25 mm annulus between the formation soil and shield
extrados that decreased with tool wear. Assuming that the shield is suspended concentrically within the
excavated diameter and that the annulus is hydraulically connected to the face, the annulus is pressurized
with slurry. The annulus pressure increases from the crown to the invert in a similar way to the face slurry
pressure. We assume annulus pressure is constant in the longitudinal direction along the 9.14m long shield.
Two part grout with a very short gel time (minutes) was used to backfill the 130 mm gap between the
segment extrados and the excavated diameter. With a short gel time compared to the nominally 60 minute
ring cycle, it is reasonable to assume that the annulus of only one ring is subjected to grout pressure during a
ring advance, and that the annulus grout in all trailing rings has become a solid with primarily elastic
properties. Grout pressures were measured near the tail shield and are generally 1-2 bar higher than slurry
pressures. While grout injected from the tail shield may flow forward into the soil-shield gap (Bezuijen and
Talmon 2008), this was not considered in the modelling.
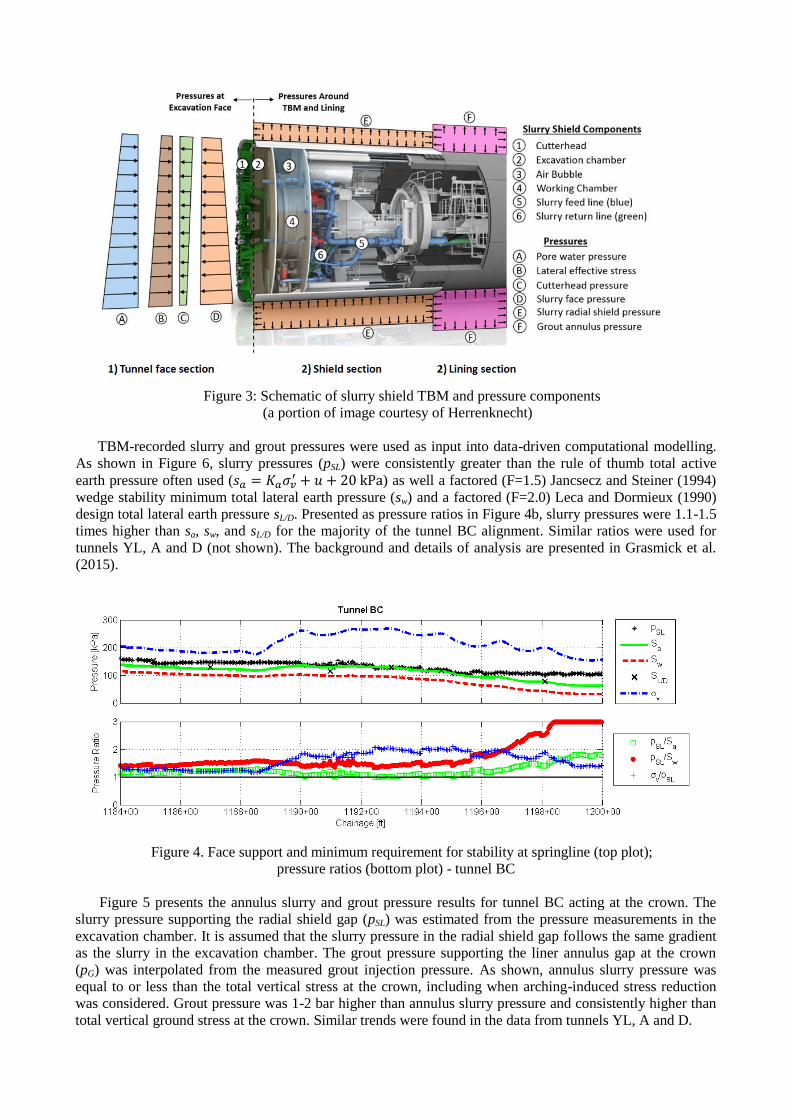
Figure 3: Schematic of slurry shield TBM and pressure components
(a portion of image courtesy of Herrenknecht)
TBM-recorded slurry and grout pressures were used as input into data-driven computational modelling.
As shown in Figure 6, slurry pressures (pSL) were consistently greater than the rule of thumb total active
earth pressure often used (𝑠𝑎 = 𝐾𝑎𝜎𝑣′ + 𝑢 + 20 kPa) as well a factored (F=1.5) Jancsecz and Steiner (1994)
wedge stability minimum total lateral earth pressure (sw) and a factored (F=2.0) Leca and Dormieux (1990)
design total lateral earth pressure sL/D. Presented as pressure ratios in Figure 4b, slurry pressures were 1.1-1.5
times higher than sa, sw, and sL/D for the majority of the tunnel BC alignment. Similar ratios were used for
tunnels YL, A and D (not shown). The background and details of analysis are presented in Grasmick et al.
(2015).
Figure 4. Face support and minimum requirement for stability at springline (top plot);
pressure ratios (bottom plot) - tunnel BC
Figure 5 presents the annulus slurry and grout pressure results for tunnel BC acting at the crown. The
slurry pressure supporting the radial shield gap (pSL) was estimated from the pressure measurements in the
excavation chamber. It is assumed that the slurry pressure in the radial shield gap follows the same gradient
as the slurry in the excavation chamber. The grout pressure supporting the liner annulus gap at the crown
(pG) was interpolated from the measured grout injection pressure. As shown, annulus slurry pressure was
equal to or less than the total vertical stress at the crown, including when arching-induced stress reduction
was considered. Grout pressure was 1-2 bar higher than annulus slurry pressure and consistently higher than
total vertical ground stress at the crown. Similar trends were found in the data from tunnels YL, A and D.
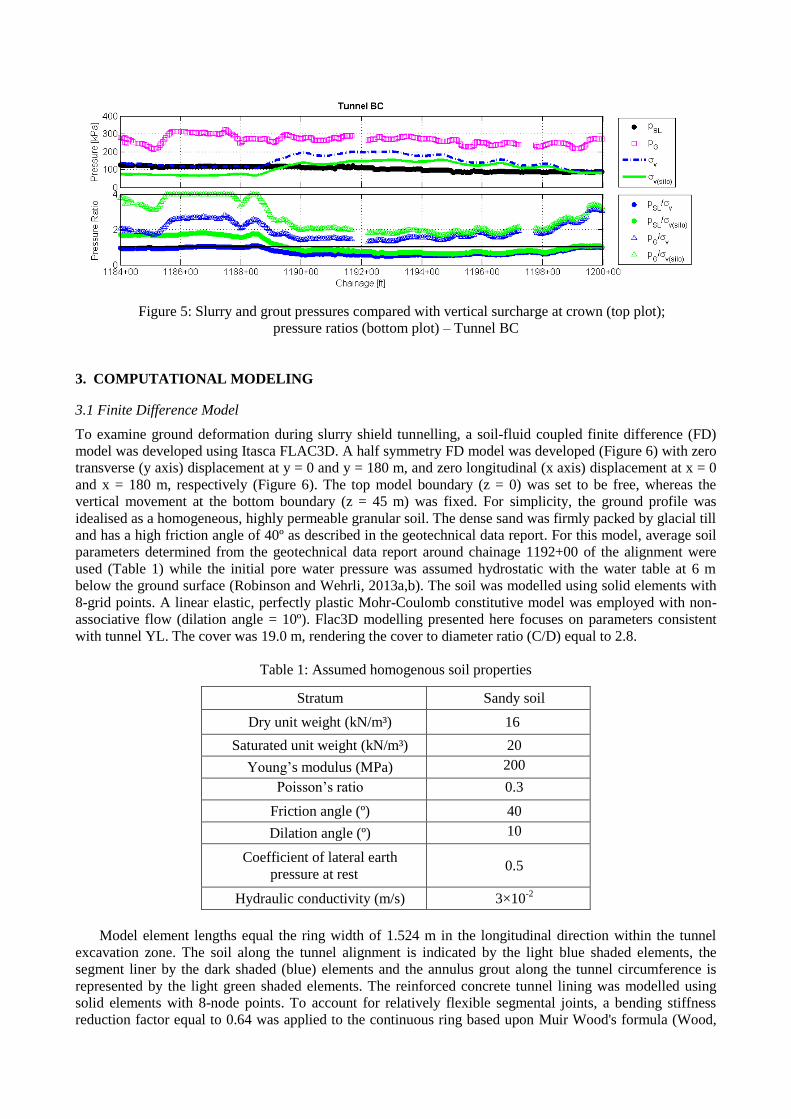
Figure 5: Slurry and grout pressures compared with vertical surcharge at crown (top plot);
pressure ratios (bottom plot) – Tunnel BC
3. COMPUTATIONAL MODELING
3.1 Finite Difference Model
To examine ground deformation during slurry shield tunnelling, a soil-fluid coupled finite difference (FD)
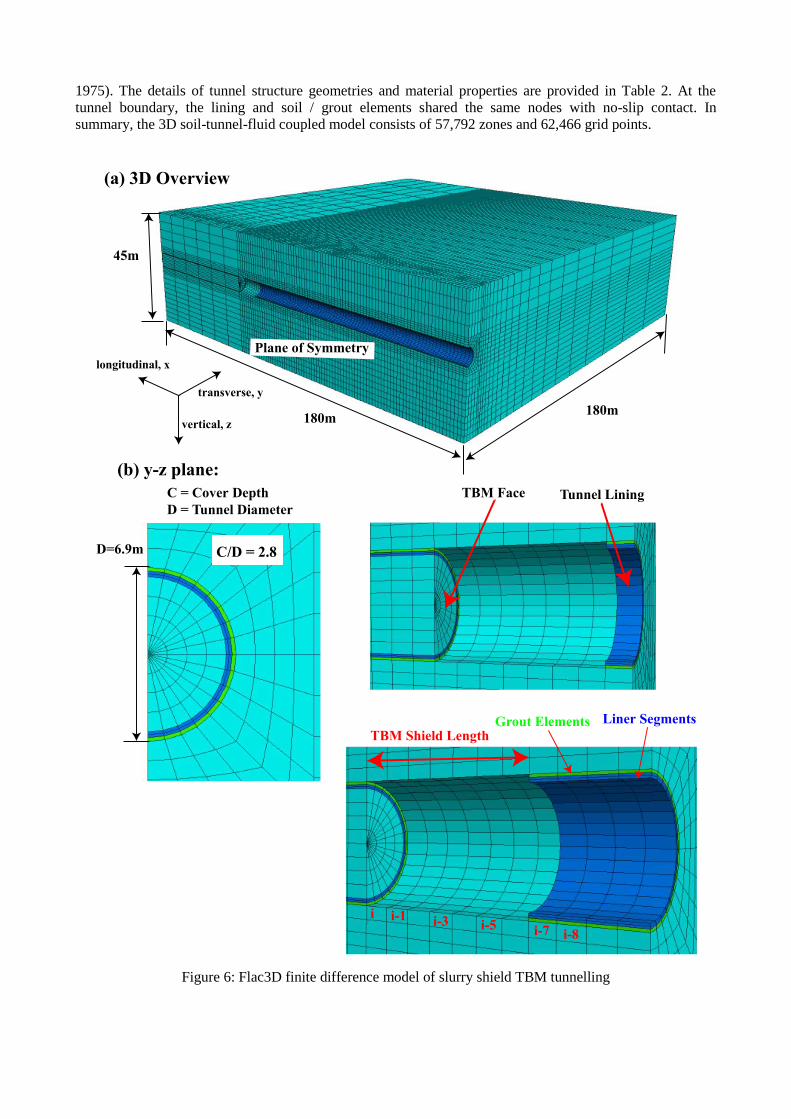
model was developed using Itasca FLAC3D. A half symmetry FD model was developed (Figure 6) with zero
transverse (y axis) displacement at y = 0 and y = 180 m, and zero longitudinal (x axis) displacement at x = 0
and x = 180 m, respectively (Figure 6). The top model boundary (z = 0) was set to be free, whereas the
vertical movement at the bottom boundary (z = 45 m) was fixed. For simplicity, the ground profile was
idealised as a homogeneous, highly permeable granular soil. The dense sand was firmly packed by glacial till
and has a high friction angle of 40º as described in the geotechnical data report. For this model, average soil
parameters determined from the geotechnical data report around chainage 1192+00 of the alignment were
used (Table 1) while the initial pore water pressure was assumed hydrostatic with the water table at 6 m
below the ground surface (Robinson and Wehrli, 2013a,b). The soil was modelled using solid elements with
8-grid points. A linear elastic, perfectly plastic Mohr-Coulomb constitutive model was employed with non-
associative flow (dilation angle = 10º). Flac3D modelling presented here focuses on parameters consistent
with tunnel YL. The cover was 19.0 m, rendering the cover to diameter ratio (C/D) equal to 2.8.
Table 1: Assumed homogenous soil properties
Stratum Sandy soil
Dry unit weight (kN/m³) 16
Saturated unit weight (kN/m³) 20
Young’s modulus (MPa) 200
Poisson’s ratio 0.3
Friction angle (º) 40
Dilation angle (º) 10
Coefficient of lateral earth
pressure at rest 0.5
Hydraulic conductivity (m/s) 3×10⁻²
Model element lengths equal the ring width of 1.524 m in the longitudinal direction within the tunnel
excavation zone. The soil along the tunnel alignment is indicated by the light blue shaded elements, the
segment liner by the dark shaded (blue) elements and the annulus grout along the tunnel circumference is
represented by the light green shaded elements. The reinforced concrete tunnel lining was modelled using
solid elements with 8-node points. To account for relatively flexible segmental joints, a bending stiffness
reduction factor equal to 0.64 was applied to the continuous ring based upon Muir Wood's formula (Wood,
1975). The details of tunnel structure geometries and material properties are provided in Table 2. At the
tunnel boundary, the lining and soil / grout elements shared the same nodes with no-slip contact. In
summary, the 3D soil-tunnel-fluid coupled model consists of 57,792 zones and 62,466 grid points.
Figure 6: Flac3D finite difference model of slurry shield TBM tunnelling
180m
45m
180m
Plane of Symmetry
vertical, z
transverse, y
longitudinal, x
(a) 3D Overview
(b) y-z plane:
D=6.9m C/D = 2.8
C = Cover Depth
D = Tunnel Diameter
Liner SegmentsGrout ElementsTBM Shield Length
i i-1 i-3 i-5 i-7 i-8
TBM Face Tunnel Lining
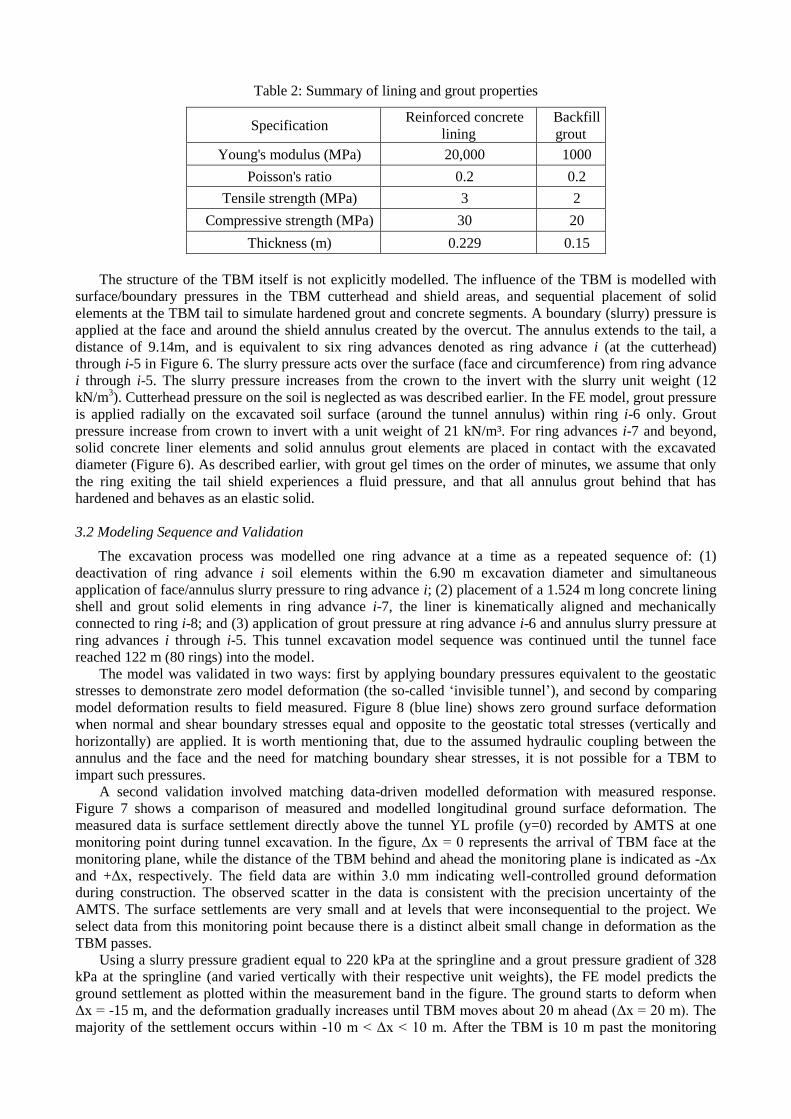
Table 2: Summary of lining and grout properties
Specification Reinforced concrete
lining
Backfill
grout
Young's modulus (MPa) 20,000 1000
Poisson's ratio 0.2 0.2
Tensile strength (MPa) 3 2
Compressive strength (MPa) 30 20
Thickness (m) 0.229 0.15
The structure of the TBM itself is not explicitly modelled. The influence of the TBM is modelled with
surface/boundary pressures in the TBM cutterhead and shield areas, and sequential placement of solid
elements at the TBM tail to simulate hardened grout and concrete segments. A boundary (slurry) pressure is
applied at the face and around the shield annulus created by the overcut. The annulus extends to the tail, a
distance of 9.14m, and is equivalent to six ring advances denoted as ring advance i (at the cutterhead)
through i-5 in Figure 6. The slurry pressure acts over the surface (face and circumference) from ring advance
i through i-5. The slurry pressure increases from the crown to the invert with the slurry unit weight (12
kN/m3). Cutterhead pressure on the soil is neglected as was described earlier. In the FE model, grout pressure
is applied radially on the excavated soil surface (around the tunnel annulus) within ring i-6 only. Grout
pressure increase from crown to invert with a unit weight of 21 kN/m³. For ring advances i-7 and beyond,
solid concrete liner elements and solid annulus grout elements are placed in contact with the excavated
diameter (Figure 6). As described earlier, with grout gel times on the order of minutes, we assume that only
the ring exiting the tail shield experiences a fluid pressure, and that all annulus grout behind that has
hardened and behaves as an elastic solid.
3.2 Modeling Sequence and Validation
The excavation process was modelled one ring advance at a time as a repeated sequence of: (1)
deactivation of ring advance i soil elements within the 6.90 m excavation diameter and simultaneous
application of face/annulus slurry pressure to ring advance i; (2) placement of a 1.524 m long concrete lining
shell and grout solid elements in ring advance i-7, the liner is kinematically aligned and mechanically
connected to ring i-8; and (3) application of grout pressure at ring advance i-6 and annulus slurry pressure at
ring advances i through i-5. This tunnel excavation model sequence was continued until the tunnel face
reached 122 m (80 rings) into the model. The model was validated in two ways: first by applying boundary pressures equivalent to the geostatic
stresses to demonstrate zero model deformation (the so-called ‘invisible tunnel’), and second by comparing
model deformation results to field measured. Figure 8 (blue line) shows zero ground surface deformation
when normal and shear boundary stresses equal and opposite to the geostatic total stresses (vertically and
horizontally) are applied. It is worth mentioning that, due to the assumed hydraulic coupling between the
annulus and the face and the need for matching boundary shear stresses, it is not possible for a TBM to
impart such pressures.
A second validation involved matching data-driven modelled deformation with measured response.
Figure 7 shows a comparison of measured and modelled longitudinal ground surface deformation. The
measured data is surface settlement directly above the tunnel YL profile (y=0) recorded by AMTS at one
monitoring point during tunnel excavation. In the figure, Δx = 0 represents the arrival of TBM face at the
monitoring plane, while the distance of the TBM behind and ahead the monitoring plane is indicated as -Δx
and +Δx, respectively. The field data are within 3.0 mm indicating well-controlled ground deformation
during construction. The observed scatter in the data is consistent with the precision uncertainty of the
AMTS. The surface settlements are very small and at levels that were inconsequential to the project. We
select data from this monitoring point because there is a distinct albeit small change in deformation as the
TBM passes.
Using a slurry pressure gradient equal to 220 kPa at the springline and a grout pressure gradient of 328
kPa at the springline (and varied vertically with their respective unit weights), the FE model predicts the
ground settlement as plotted within the measurement band in the figure. The ground starts to deform when
Δx = -15 m, and the deformation gradually increases until TBM moves about 20 m ahead (Δx = 20 m). The
majority of the settlement occurs within -10 m < Δx < 10 m. After the TBM is 10 m past the monitoring
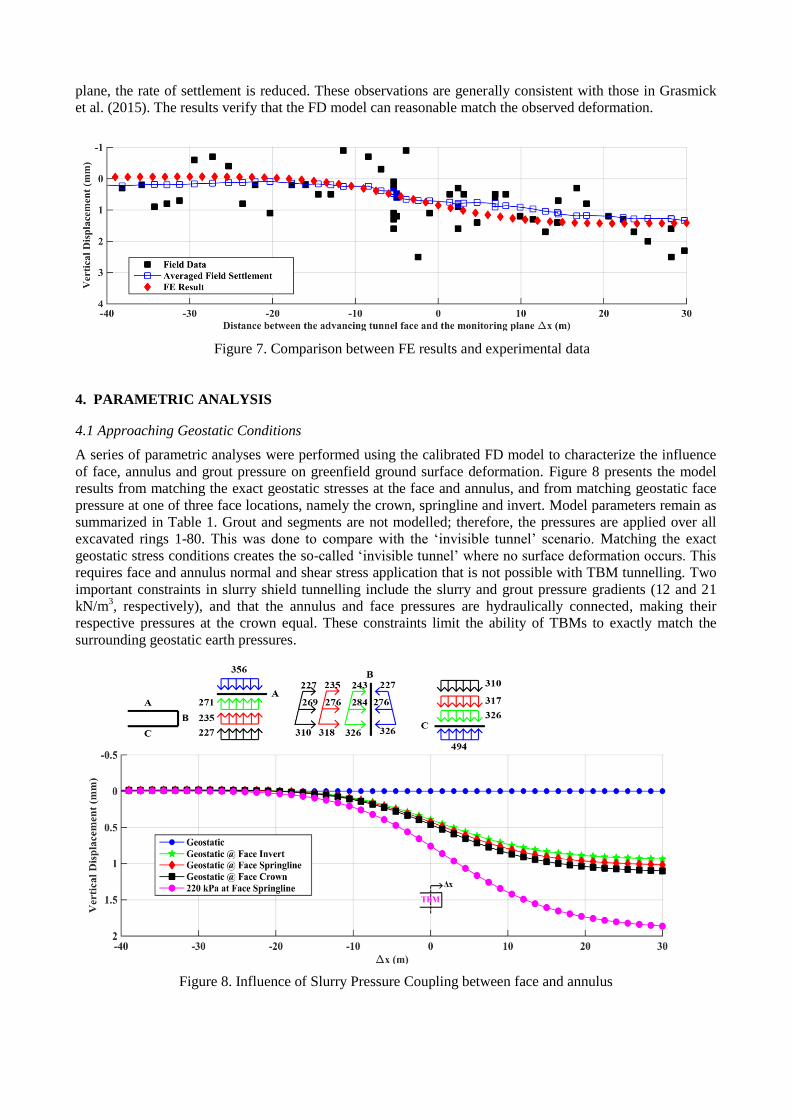
plane, the rate of settlement is reduced. These observations are generally consistent with those in Grasmick
et al. (2015). The results verify that the FD model can reasonable match the observed deformation.
Figure 7. Comparison between FE results and experimental data
4. PARAMETRIC ANALYSIS
4.1 Approaching Geostatic Conditions
A series of parametric analyses were performed using the calibrated FD model to characterize the influence
of face, annulus and grout pressure on greenfield ground surface deformation. Figure 8 presents the model
results from matching the exact geostatic stresses at the face and annulus, and from matching geostatic face
pressure at one of three face locations, namely the crown, springline and invert. Model parameters remain as
summarized in Table 1. Grout and segments are not modelled; therefore, the pressures are applied over all
excavated rings 1-80. This was done to compare with the ‘invisible tunnel’ scenario. Matching the exact
geostatic stress conditions creates the so-called ‘invisible tunnel’ where no surface deformation occurs. This
requires face and annulus normal and shear stress application that is not possible with TBM tunnelling. Two
important constraints in slurry shield tunnelling include the slurry and grout pressure gradients (12 and 21
kN/m3, respectively), and that the annulus and face pressures are hydraulically connected, making their
respective pressures at the crown equal. These constraints limit the ability of TBMs to exactly match the
surrounding geostatic earth pressures.
Figure 8. Influence of Slurry Pressure Coupling between face and annulus
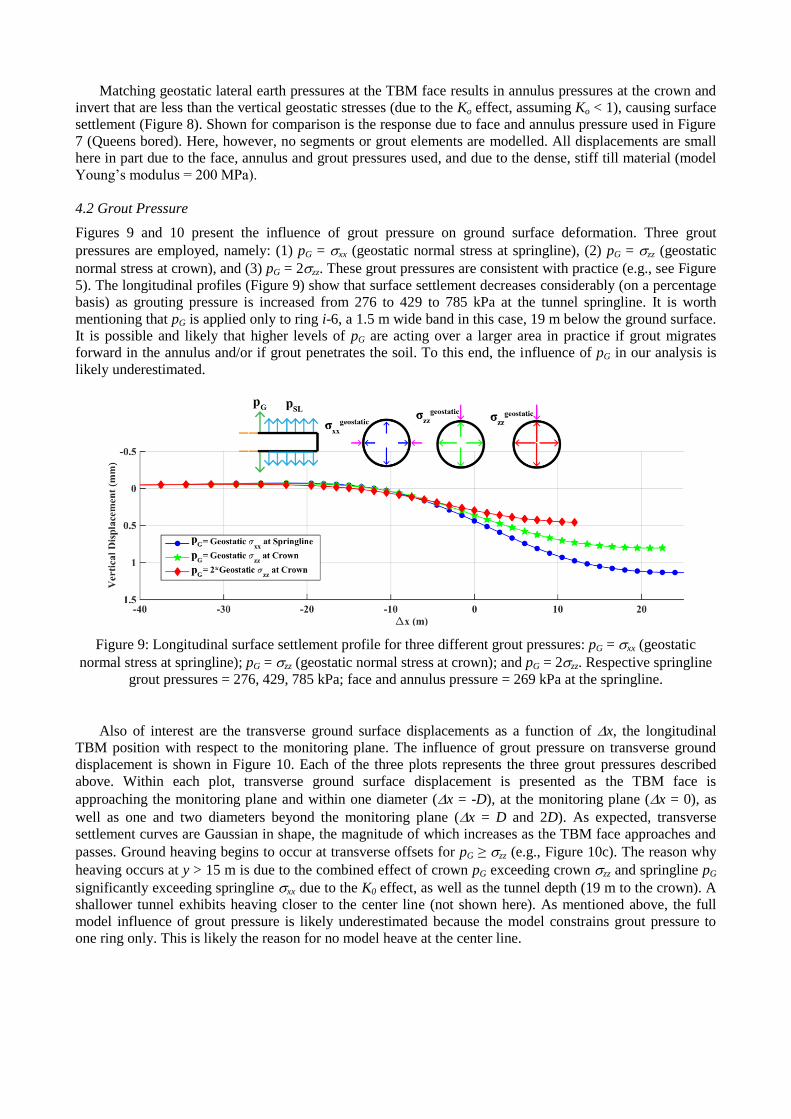
Matching geostatic lateral earth pressures at the TBM face results in annulus pressures at the crown and
invert that are less than the vertical geostatic stresses (due to the Ko effect, assuming Ko < 1), causing surface
settlement (Figure 8). Shown for comparison is the response due to face and annulus pressure used in Figure
7 (Queens bored). Here, however, no segments or grout elements are modelled. All displacements are small
here in part due to the face, annulus and grout pressures used, and due to the dense, stiff till material (model
Young’s modulus = 200 MPa).
4.2 Grout Pressure
Figures 9 and 10 present the influence of grout pressure on ground surface deformation. Three grout
pressures are employed, namely: (1) pG = xx (geostatic normal stress at springline), (2) pG = zz (geostatic
normal stress at crown), and (3) pG = 2zz. These grout pressures are consistent with practice (e.g., see Figure
5). The longitudinal profiles (Figure 9) show that surface settlement decreases considerably (on a percentage
basis) as grouting pressure is increased from 276 to 429 to 785 kPa at the tunnel springline. It is worth
mentioning that pG is applied only to ring i-6, a 1.5 m wide band in this case, 19 m below the ground surface.
It is possible and likely that higher levels of pG are acting over a larger area in practice if grout migrates
forward in the annulus and/or if grout penetrates the soil. To this end, the influence of pG in our analysis is
likely underestimated.
Figure 9: Longitudinal surface settlement profile for three different grout pressures: pG = xx (geostatic
normal stress at springline); pG = zz (geostatic normal stress at crown); and pG = 2zz. Respective springline
grout pressures = 276, 429, 785 kPa; face and annulus pressure = 269 kPa at the springline.
Also of interest are the transverse ground surface displacements as a function of x, the longitudinal
TBM position with respect to the monitoring plane. The influence of grout pressure on transverse ground
displacement is shown in Figure 10. Each of the three plots represents the three grout pressures described
above. Within each plot, transverse ground surface displacement is presented as the TBM face is
approaching the monitoring plane and within one diameter (x = -D), at the monitoring plane (x = 0), as
well as one and two diameters beyond the monitoring plane (x = D and 2D). As expected, transverse
settlement curves are Gaussian in shape, the magnitude of which increases as the TBM face approaches and
passes. Ground heaving begins to occur at transverse offsets for pG ≥ zz (e.g., Figure 10c). The reason why
heaving occurs at y > 15 m is due to the combined effect of crown pG exceeding crown zz and springline pG
significantly exceeding springline xx due to the K0 effect, as well as the tunnel depth (19 m to the crown). A
shallower tunnel exhibits heaving closer to the center line (not shown here). As mentioned above, the full
model influence of grout pressure is likely underestimated because the model constrains grout pressure to
one ring only. This is likely the reason for no model heave at the center line.
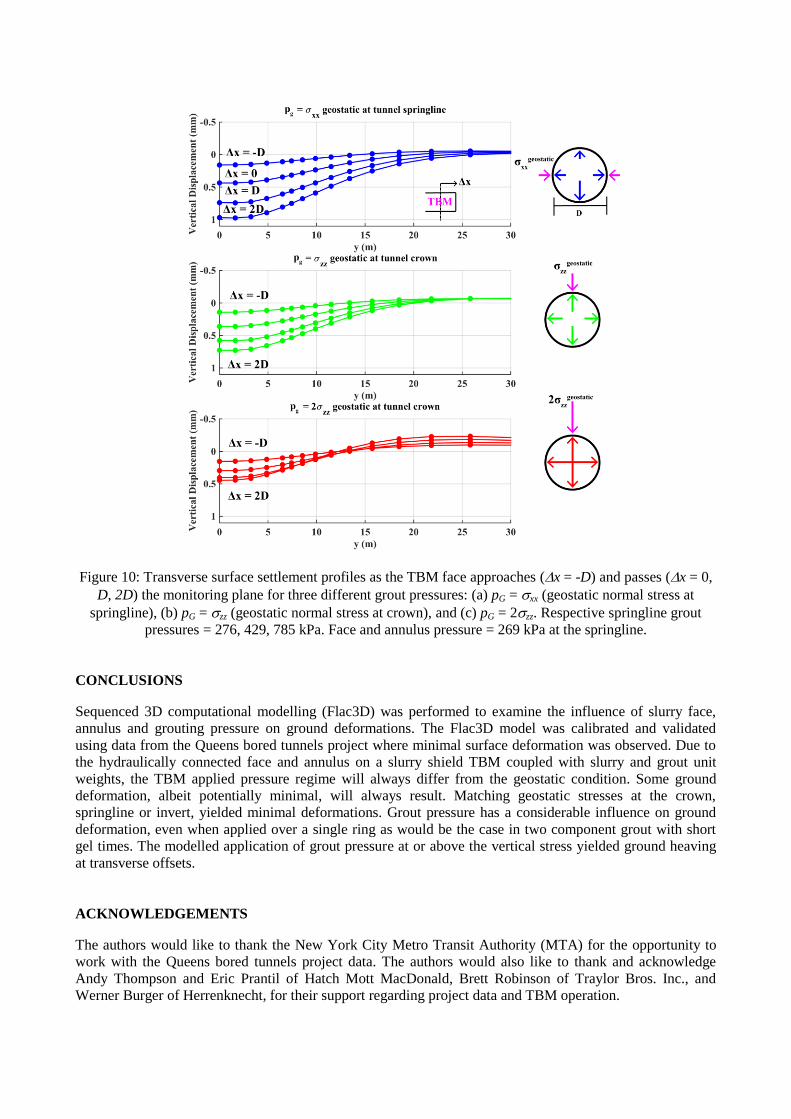
Figure 10: Transverse surface settlement profiles as the TBM face approaches (x = -D) and passes (x = 0,
D, 2D) the monitoring plane for three different grout pressures: (a) pG = xx (geostatic normal stress at
springline), (b) pG = zz (geostatic normal stress at crown), and (c) pG = 2zz. Respective springline grout
pressures = 276, 429, 785 kPa. Face and annulus pressure = 269 kPa at the springline.
CONCLUSIONS
Sequenced 3D computational modelling (Flac3D) was performed to examine the influence of slurry face,
annulus and grouting pressure on ground deformations. The Flac3D model was calibrated and validated
using data from the Queens bored tunnels project where minimal surface deformation was observed. Due to
the hydraulically connected face and annulus on a slurry shield TBM coupled with slurry and grout unit
weights, the TBM applied pressure regime will always differ from the geostatic condition. Some ground
deformation, albeit potentially minimal, will always result. Matching geostatic stresses at the crown,
springline or invert, yielded minimal deformations. Grout pressure has a considerable influence on ground
deformation, even when applied over a single ring as would be the case in two component grout with short
gel times. The modelled application of grout pressure at or above the vertical stress yielded ground heaving
at transverse offsets.
ACKNOWLEDGEMENTS
The authors would like to thank the New York City Metro Transit Authority (MTA) for the opportunity to
work with the Queens bored tunnels project data. The authors would also like to thank and acknowledge
Andy Thompson and Eric Prantil of Hatch Mott MacDonald, Brett Robinson of Traylor Bros. Inc., and
Werner Burger of Herrenknecht, for their support regarding project data and TBM operation.
REFERENCES
Bezuijen, A., Talmon, A.M. (2014) Soil pressures at the cutting wheel and the pressure bulkhead of an EPB-
shield, in Kim, Ban (Eds.), Geotechnical Aspects of Underground Construction in Soft Ground. Seoul,
Korea, pp. 523-529.
Jancsecz, S. and Steiner, W. (1994) Face support for a large mix-shield in heterogeneous ground conditions. Proc. Tunneling ’94. London, Institution of Mining and Metallurgy.
Grasmick, J.G., Rysdahl, B., Mooney, M.A., Robinson, B., Prantil, E., Thompson, A. Evaluation of slurry
TBM design support pressures using east side access Queens bored tunnels data, Proc. Rapid Excavation
and Tunneling, New Orleans, LA, June 7-10, 2015.
Leca, E., Dormieux, L. (1990). Upper and lower bound solutions for the face stability of shallow circular tunnels in frictional material. Geotechnique, 40(4), 581-606.
Mooney, M.A., Grasmick, J., Clemmensen, A., Thompson, A. Ground deformation from multiple tunnel
openings: analysis of Queens bored tunnels, Proc. North American Tunneling, Los Angeles, CA, June 22-
25, 2014.
Robinson, B., Wehrli, J.M. (2013a). East Side Access - Queens bored tunnels case study, in Proc. 21st Rapid Excavation and Tunneling Conference, Washington, D.C., pp. 1014-1141.
Robinson, B., Wehrli, J.M. (2013b). East Side Access - Queens bored tunnels engineering challenges, in Proc. 21st Rapid Excavation and Tunneling Conference, Washington, D.C., pp. 1086-1118.
Wood, A. M. (1975) “The circular tunnel in elastic ground.” Geotechnique, Vol.25, pp.115-127.


![TBM 렌탈솔루션 - cafe24mrrental.cafe24.com/tbm/tbmrs_service_introduction.pdf · 01. TBM 렌탈솔루션소개 [이미지출처: 효성에프엠에스뉴스레터(2019.01.28)]](https://img.pdfslide.net/doc/110x75/5ece13d36c14a753b559968e/tbm-eoefe-01-tbm-eoefeoeeoe-eoe-ee20190128.jpg)