Embed Size (px)
Citation preview
THE PROGNOSTIC VALUE OF THE STE/QUIST MECHANICAL ABILITY TEST
by
EUGENE A. WATERS
B. S., Kansas State Agricultural College, 1925
A THESIS
submitted in partial fulfillment of the requirements
for the degree of
MASTER OF SCIENCE
KANSAS STATE AGRICULTURAL COLLEGE
1929
2
TABLE OF CONTENTS
INTRODUCTION
THE TESTS USED IN THE STUDY
3
7
METHOD 11
RESULTS AND DISCUSSION 15
A. Analysis of College Data 15
B. Analysis of High School Data 21
ANALYSIS AND RELIABILITY OF THE STENQUIST TEST . . .26
CONCLUSIONS 31
ACKNOWLEDGEMENTS 32
BIBLIOGRAPHY 33
3
THE PROGNOSTIC VALUE OF THE SiENWIST MECHANICAL ABILITY TEST, SINGLE SERIES 1
INTRODUCTION
The objection on the part of shop teachers to the common
educational practice of directing students of relatively low
general intelligence* into shop courses is becoming more and
more insistent. From articles in current literature the gen-
eral impression is gained that shop teachers of long and suc-
cesful experience believe that those students possessing me-
chanical ability should be directed into shop courses, rather
than those students who are "misfits" in other courses or who
possess relatively low general intelligence. Practical ex-
perience has convinced the majority of shop teachers that the
students'who fail the more abstract courses will probably
fail the manual courses, also.
S. D. Horning and Ruth S. Leonard, in a study involving
twenty-five in mechanics classes of the Pasedena Junior High
School, have shown the correlation between scores in the
McQuarrie Test of Mechanical Ability and ranks in class pro-
* Throughout this study the term "general intelligence" must be used to signify that ability of which current "intel- ligence tests" are purported to yield a definite measure. Whether "general intelligence" is an entity, a composite of entities, or a "What not" does not fall within the premise of this study. This study is merely an effort to determine the practicability of using the Stenquist Test in educational guidance.
4
jects to be .66 .(3,349):. The writers interpret this cor-
relation to be significant of the possibility of using scores
in mechanical ability or aptitude tests as prognostic measures
in an educational guidance program in the field of manual
education. In this same study a correlation of only .02 was
reported to exist between scores in the Terman Group Test of
Mental Ability and scores in the McQuarrie Test. This low
correlation is interpreted by the authors to mean that a dull
student in the more abstract courses has an equal chance to
be dull in courses of a mechancial nature.
In support of this latter correlation and the tentative
conclusion derived from it, is a more pretentious study by
Edna Board and others of five hundred 7th and 8th grade stu-
dents selected at random from the five junior high schools of
Fresno, California. In this study a correlation of .05 is
secured between general intelligence, measured by the Terman
Group Test, and mechanical ability, measured by the Stenquist
Mechanical Aptitude Test**. A higher correlation, .23, is
*The first number in the parenthesis refers to the refer- ence in the bibliography bearing this number. The second number in the parenthesis is the page number of the reference.
**It should here be noted that the Stenquist Mechanical Ap- titude Test is the familiar "picture test" whereas the Sten- quist Mechanical Ability Test used in the present study is the less familiar "assembling test", Single Series 1.
5
established by Board and others between general intelligence
and scores in the McQuarrie Test of Mechanical Aptitude. In
concluding their article these writers assert that if mechan-
ical ability is measured by the mechanical aptitude tests then
the students of low and of high intelligence have an almost
equal chance to succeed in courses in manual arts (1,331).
S. S. Sutherland of the Iowa State College, Ames, Iowa,
has made a study bearing directly upon the question of the
relation of general intelligence to success in shop courses
(8,256). Scores in the revised Army Alpha Test were used as
measures of general intelligence and the grades received in
shop courses were considered as varying degrees of success in
the shop courses. From the study of two hundred ten fresh-
men of the Iowa State College he draws the following general
conclusions:
a. "The chance of a student of inferior intelligence
doing superior shop work is one in ten."
b. "Chances are eight to one against a student of
superior intelligence receiving a low shop grade."
c. "Nine out of ten students of below average intelli-
gence receive grades of average or below."
These conclusions are based upon a study involving a suffici-
ent number of cases to establish certain validity.
6
The above studies are cited as typical examples of those
appearing in current literature devoted to manual arts and
the problems in connection with manual arts teaching. All of
these studies point to two general conclusions; first, that
shop teachers are sustained in their objection to the use of
low intelligence test scores as criteria of probable success
in shop courses; and secondly, that there is a possibility
of using scores in certain mechanical ability tests as prog-
nostic measures which would be of value in educational gui-
dance in the field of manual education.
With these facts in mind the writer undertook a study of
the prognostic value of the Stenquist Assembling Test of Gen-
eral Mechanical Ability, Single Series 1. The study had as
its major objectives:
a. The value of the Stenquist Mechanical Ability Test
as a prognostic instrument in educational guidance.
b. The relation of general intelligence, as measured by
standard intelligence tests, to general mechanical
ability, measured by the Stenquist Test of Mechani-
cal Ability.
c. The relation of general intelligence to success in
school courses of a mechanical nature.
The chief contribution hoped for was the presentation of suf-
ficient data to establish the predictive value of the scores
received in the Stenquist Mechanical Ability Test.
7
THE TESTS USED IN THE STUDY
Three tests were used in this study; (1) Stenquist
Assembling Test of General Mechanical Ability, Single Series
1; (2) Otis Self-Administering Test of Mental Ability, Inter-
mediate and Higher Examinations, Form A; and (3) Peterson
Uniform Test of Mental Performance*. The intelligence test
scores were, for the most part, secured from the office files
of the schools involved.
The Stenquist Assembling Test of Mechanical Ability,
Single Series 1, was prepared by John L. Stenquist while at
Teachers College, Columbia University, and may be secured
from the Charles Stoelting Co., Chicago. The test consists
of ten common mechanical devices placed in separate compart-
ments of a box, 22 x 5 x 25 inches in size. The compartments
of this box are labeled A, B, C, etc. Compartment A contains
a cupboard catch, B contains a clothes pin, C a paper clip,
D a chain, E a bicycle bell, F a rubber hose shut-off, G a
wire bottle stopper, H a push button, I a door lock, and J a
mouse trap. The mechanical devices are placed in the proper
compartment unassembled. The test consists of assembling
*This test was first published under the title "A Uniform Test of Intelligence" but the term intelligence has since been replaced by the less presumptive term, mental perfor- mance.
8
each of these devices under standard conditions in a stan-
dard length of time. In the photograph of the test, shown in
Plate 1, the nature and arrangement of the test elements are
shown. It will be seen that, as the students are directed to
open the box with the hook fasteners away from them, the lid
of the box makes a convenient tray in which to place the
loose parts of the device being assembled. The time allowed
for the completion of the test is thirty minutes and a time
bonus of one-half point per minute is given those students
who complete the test in less than the regular allotted time.
Thus if a student finishes at the end of twenty-four minutes
three points will be added to his raw score.
In the standard score sheet, supplied with the test,
there are described two methods of scoring the completed
test. The "Partial Score Method" and the "Short Form Method."
Descriptions of these methods are included in order to make
subseouent terminology understood.
The "Partial Score Method" involves the assigning of a
partial score to the various degrees of perfection in assem-
bling each of the ten test devices. A score of ten is
assigned to a correctly assembled device, while any score
from zero to ten is assigned a dvice which is only partially
assembled. The exact partial score assigned a device depends
upon the degree of perfection achieved in assembling it. In
the score sheet are listed the partial score values to be
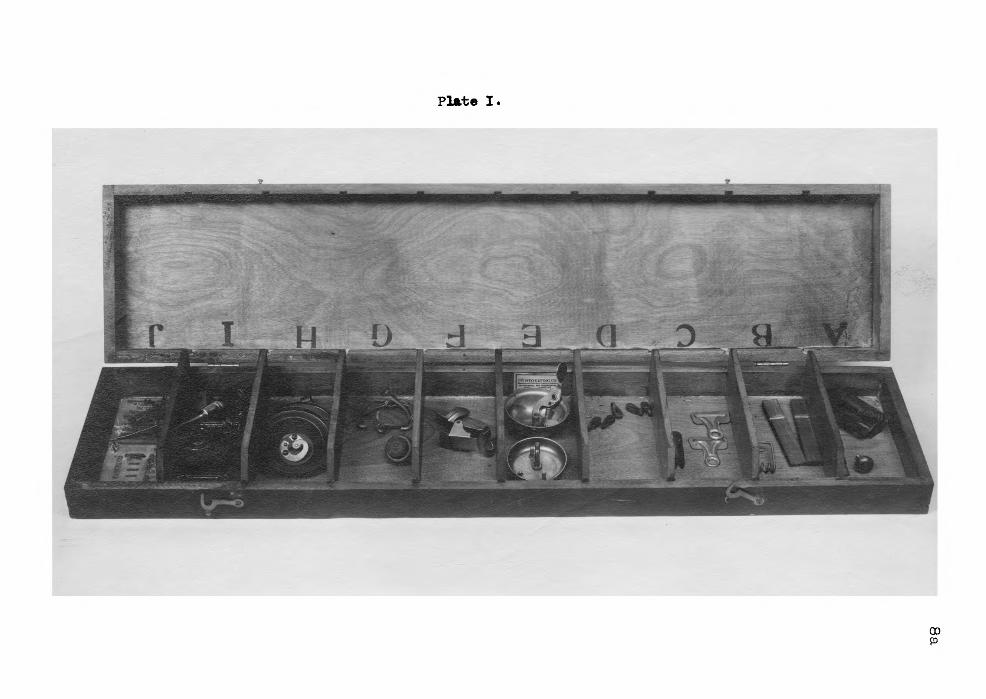
Plate I.
9
given to each possible degree of perfection which may be
achieved in assembling each of the ten devices. After each
of the ten devices has been assigned a partial score the
"raw score" is computed by obtaining the sum of the ten par-
tial scores and any time bonus which may have been given.
The "Short Form Method" of scoring consists of count-
ing only those devices which have been completely assembled.
Partial scores are disregarded entirely and the correctly
assembled devices are assigned a score of ten. In utilizing
this method of scoring the examiner is instructed to count as
complete all devices which would receive a partial score of
eight or nine if the "Partial Score Method" was being used.
The "raw score" is equal to the sum of the separate scores
and any time bonus which may be due.
After having determined the raw score by either of the
scoring methods described the final step in scoring consists
of converting this raw score into the corresponding "T" Score.
The "T" Scale scores are the mean square deviation equiva-
lents for the distribution of twelve year old boys. A table
furnished with the test contains a list of the possible raw
scores and opposite each is placed the corresponding "T"
Scale Score. Scores thus derived are designated as HT"
Scores. Throughout this study "T" Scores derived from raw
scores have been used. The Partial Score Method was employed
to secure the raw scores since this method is recommended by
IQ
the author of the test as being the more accurate.
The Otis Self-Administering Test of Mental Ability was
used as the measure of general intelligence of the junior and
senior hign school students included in this study. The
Higher Examination and Intermediate Examination being used in
the senior and junior high schools, respectively. This test
is one of the standard intelligence tests whose validity is
generally recognized and needs no detailed description here.
The Peterson Uniform Test of Mental Performance is a
test of general intelligence. It was devised by Dr. J. C.
Peterson, of the Education Department, Kansas State College.
This test is used regularly by the Department of Education in
determining the percentile rank in intelligence of all stu-
dents at that college. The intelligence ratings of the col-
lege students included in this study were taken from the
files in the offices of the Education Department.
11
METHOD
The study involved five hundred six students. Three
hundred twelve were students in shop courses at the Kansas
State College, Manhattan, Kansas. The majority were of
freshman or sophomore standing but some were junior, senior
and graduate students. The remaining one hundred ninety-four
cases were taken from the junior and senior high schools of
Butler and Greenwood Counites, Kansas. Of this latter group
the majority were taken fram the junior and senior high
schools of Eureka and El Dorado, Kansas.
Both of the college and junior-senior high school
groups were given the Stenquist Mechanical Ability Test,
Single Series 1, at or near the beginning of their shop
course during the school year 1928-1929. The test was given
to groups of thirteen students, this,being the number of
tests at the writer's disposal. All of the tests were given
under the direct supervision of the writer according to the
following directions, which are those included in the manual
of directions accompanying the test.
Directions for giving test:
Use regular class room, and single desks if possi-
ble. With pupils seated, and 40-50 boxes, and also score
sheets, near the examiner's desk, proceed as follows:
12
1. Distribute score sheets, one for each pupil (be sure
to have the right ones). Each pupil fills out the score
sheet blanks; name, age, etc. - and leaves blank on his desk
to be enclosed in the box when he finishes. (if he fails to
enclose it there is no way of identifying his box).
2. Appoint one boy for each row to distribute the boxes
to each row. Do not permit the boxes to be opened until all
begin.
3. When each pupil has his box instruct as follows:
"We will now read the directions; you read them silently
while I read them aloud." (Examiner now takes a box and
reads the directions on the box aloud, while the pupils read
silently). As soon as the examiner has finished, and all
understand, he says, "You have thirty minutes; already? be-
gin." Note that boxes open backward. See that all get
started right, beginning with model A, B, etc. After about
three minutes say again, "Do not spend more than about three
minutes on any one model." Examiner should be sure to allow
exactly thirty minutes.
4. When time is up, each pupil hands in his box (with
score sheet inside). Stack the boxes immediately beside the
scorer's desk if they are to be scored at once.
All the tests were scored by the writer immediately fol-
lowing their completion. Thus it would seem that absolute
uniformity had been achieved in administering and scoring the
13
tests. The "T" Scores resulting from these tests are, accord
ing to Stenquist (7,87), an objective measure of these quali-
ties in pupils that are considered by shop teachers in judg-
ing pupils relative abilities in shop courses. Hence we
should expect that these "T" Scores would correlate highly
with the pupils' subsequent success in shop courses. Since
the major objective of this study was to determine the reli-
ability of the Stenquist test as a prognostic instrument, the
next step was to compute the actual correlation which existed
between "T" scores made by students and the students' subse-
quent success in shop courses.
The percentile ranks in intelligence of the college
cases included in this study were secured from the files of
the psychology offices of the Department of Education. In
some cases this data was incomplete and as a result the corm.
lations involving intelligence ratings include a fewer number
of cases than the correlation of "T" Scores and shop grades.
Since there were two hundred forty-eight complete cases, how-
ever, it was not considered necessary to administer any of
the Peterson Ability Tests.
In the case of the high school groups the intelligence
ratings were so often lacking on the office cards that it was
necessary to administer the Otis Intelligence Tests to eppra*
imately eighty-five students. The Otis tests were given in
14
regular class rooms according to the directions accompanying
the test.
Shop grades in the college group were secured from the
office files of the Department of Shop Practice. In the high
school group the shop grades were taken from the shop teachEeh
grade book and were those grades subsequently reported as the
student's final grade in the shop course. In this study I
have considered these shop grades as the measure of relative
success or failure in the shop courses.
15
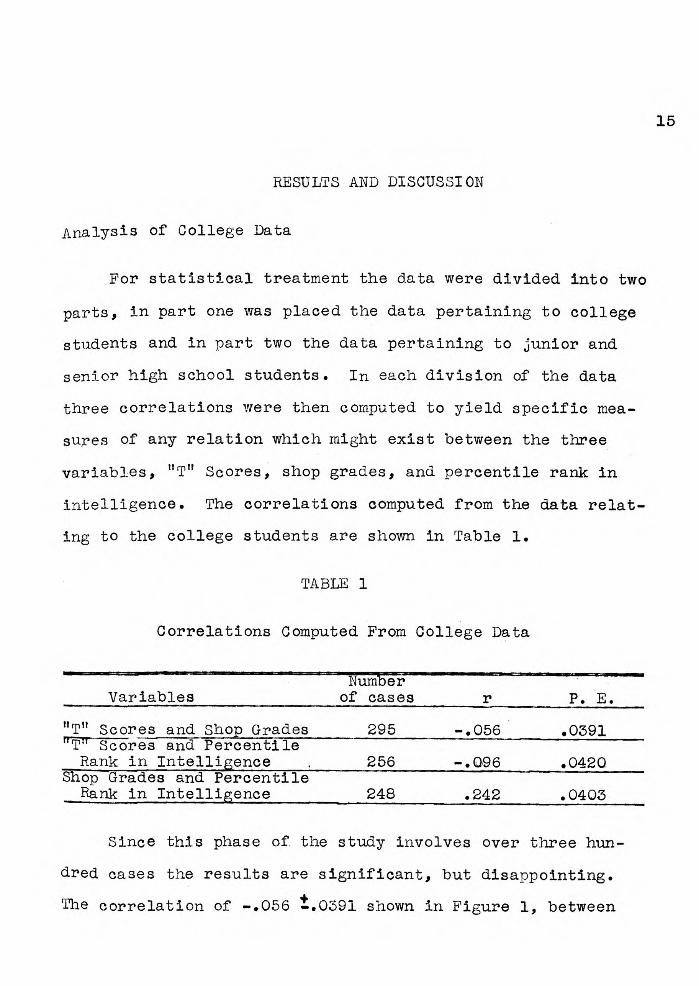
RESULTS AND DISCUSSION
Analysis of College Data
For statistical treatment the data were divided into two
parts, in part one was placed the data pertaining to college
students and in part two the data pertaining to junior and
senior high school students. In each division of the data
three correlations were then computed to yield specific mea-
sures of any relation which might exist between the three
variables, "T" Scores, shop grades, and percentile rank in
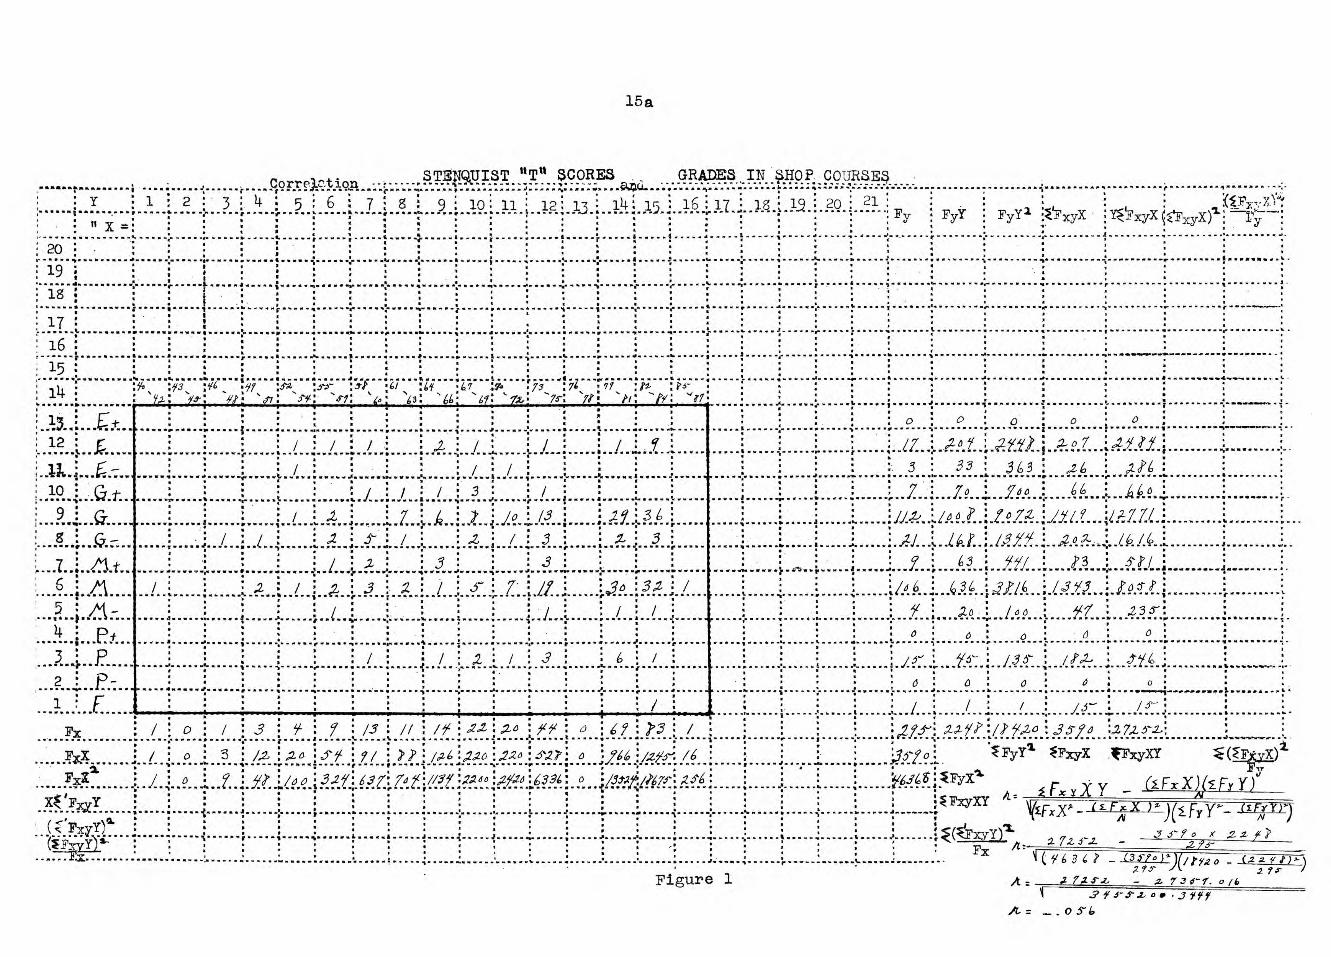
intelligence. The correlations computed from the data relat-
ing to the college students are shown in Table 1.
TABT:R 1
Correlations Computed From College Data
Variables Number
of cases r P. E.
"T" Scores and Shop Grades 295 -.056 .0391 "T" Scores and Percentile Rank in Intelligence
. 256 -.096 .0420 Shop Grades and Percentile
Rank in Intelligence 248 .242 .0403
Since this phase of the study involves over three hun-
dred cases the results are significant, but disappointing.
The correlation of -.056 ±.0391 shown in Figure 1, between
: Y
x
20
19
18
i , Co rr e).c.t lost 1 2 : 3 i 4 : 5 6 : 7
f. , .--4, .,
17
16
15
14
13
10
9 1.Q. g -
t 6
PD
3 p 2 -
E
Fx
Y,2
:a6, '70`: s e7
i
a
STENQUIST
: 9 . 10 11 12 13
15a
"T" FORE'S GRADES INA401!, couRs§ lITl
.172 ;iv: St, "7: .71:
/ : / /
7
:7. 67:
14: 15 16;12 : 20 :
- 4
; ;
73 :76 1- :71 1 fi' Pi Pr
J
3
0
FTX
FxX2.
'FvY
(;-Fxye. (FxvY)1-
0
/ 3 54 : 9 : A5 // 5 ,26 7/
4,
0
L7 3
FY FyY FyY 2 .pFxyX YV xyX 4-Fx Y
7
41.
V.
II
.. A
....9. .:
Jig, . A l
/4 '6 5
0
3
f.i316)' /do j.3.2i E37 1/Y7
Figure 1
o
/ Ili- 2.15 ' i : /1 5(.20 J5-1 o :27,z, o-.2, ---
,55 to FyYl" FxyX IrFxy)CY (.1- -
0
.2
33
°
/40? Zbi
63
... .... 26....
o
O''
6
/
0
et ,563
766
fo7z Z.49 .P' J``./
dii6 .. loo
: 0
: /36" : o
: /
.26 66
/.,(i ,202-
73
/3 5C5
47'
O
/102.
e)
/.3
0
j.251,,f lid .4 4o
il,2-77/ :
/6 /61 .::. i" i
i Pl., i
: .23 3-1,
O
i <1-46
: 0 . .-.........,
/ -3-
:
. .
.
i
6346' 1 F. Y X Y Fy y)
1.5czi1CY IT rFxX' ry y. -.yY)1. z .1".L - .5- 9 0 x 2 .2
Fx ( 6 3 4 (3.,7°)':X/tvz 0 (2 a '1)'-)
?$ "
A r .2 72J L - Z 734-f. o ft. J- .z, .5 ffif
16
Stenquist test scores and shop grades is too low, of course,
to possess positive or negative significance. There is ap-
parently no definite relation between "T" Scores and grades
received by students in college shop courses. Either the
Stenquist Test of Mechanical Ability does not yield objective
measures of mechanical ability, or mechanical ability is not
essential to success in college shop courses. It is here
assumed that when assigning grades shop teachers are attempt-
ing to measure a student's relative success in the shop
course. To the extent that mechanical ability functions in
achieving this success the shop teacher is in reality there-
fore estimating the amount of mechanical ability possessed by
the student. It seems only reasonable to assume that if such
a trait as general mechanical intelligence and ability exists
that the amount of such trait possessed by a student would
have a definite relation to the student's success or failure
in the shop course. The results of any instrument yielding
actual objective measures of mechanical intelligence or abil-
ity should, therefore, correlate highly with grades received
in shop courses. The Stenquist Mechanical Ability Test is
claimed by its author to be an instrument "for obtaining a
definite measure of a trait which is generally estimated with
great inaccuracy by school authorities as well as by parents
and pupils themselves." (7,61) Whatever may be the trait
measured by this test we are forced to conclude that it can
17
have no relation to success or failure in school courses of a
mechanical nature.
There are certain well known characteristics of shop
courses which in themselvesmight account for a low correla-
tion between shop grades and other criteria of mechanical a-
bility. Chief among these characteristics is the stereotyped
form of the courses and of the elements composing these
courses. There is little chance for the student of superior
mental or mechanical ability to demonstrate his superiority.
As a result of this there is the tendency for fixed levels of
achievement which are too few in number and too closely
grouped to permit a normal distribution of grades in a shop
course. That this condition prevails in the shop courses
included in the present study is clearly shown in Table II.
The question of the reliability of shop teachers' grades
might well be raised at this point but the author of the test
states that "while shop teachers grades are no more accurate
than those of the regular teachers, they are equally as good"
(7,87).
In Table III is given the distribution of the "T" Scores
received by the college students.
The distribution of "T" Scores does not appear to be a
normal one. There is a marked tendency toward high scores.
It will be observed that 66.76% of the scores fall within the
approximate limits of the upper fourth of the "T" score range.
18
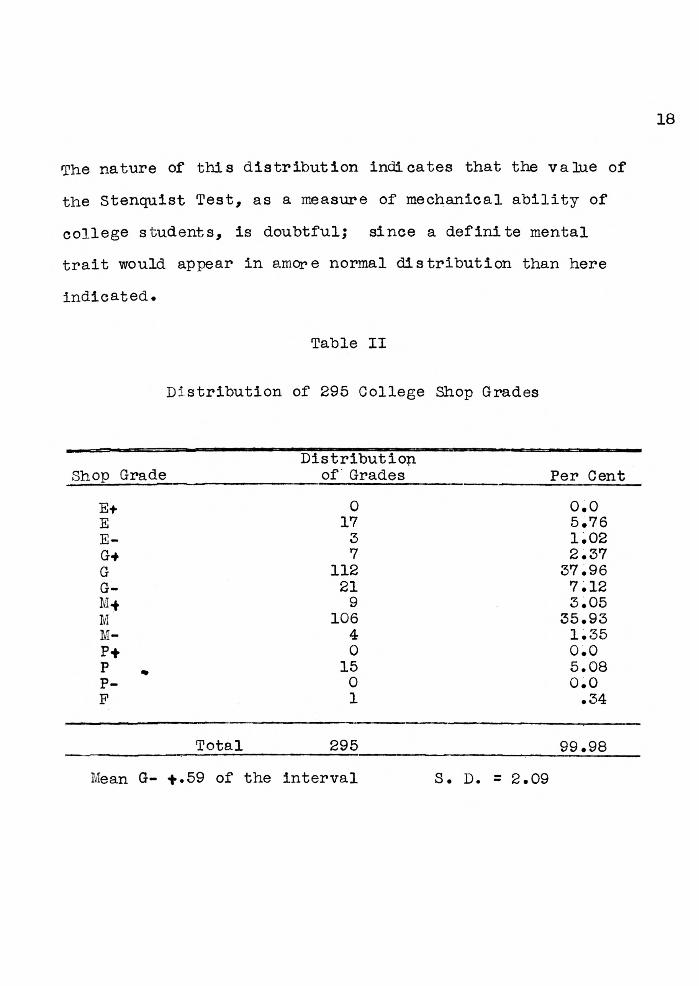
The nature of this distribution indicates that the value of
the Stenquist Test, as a measure of mechanical ability of
college students, is doubtful; since a definite mental
trait would appear in amore normal distribution than here
indicated.
Table II
Distribution of 295 College Shop Grades
Distribution Shop Grade of Grades Per Cent
E+ 0 0.0 E 17 5.76 E- 3 1.02 G+ 7 2.37 G 112 37.96 G- 21 7.12 M4 9 3.05 M 106 35.93 M- 4 1.35 P+ 0 0.0 P ., 15 5.08 P- 0 0.0 F 1 .34
Total 295 99.98
Mean G- .59 of the interval S. D. = 2.09
19
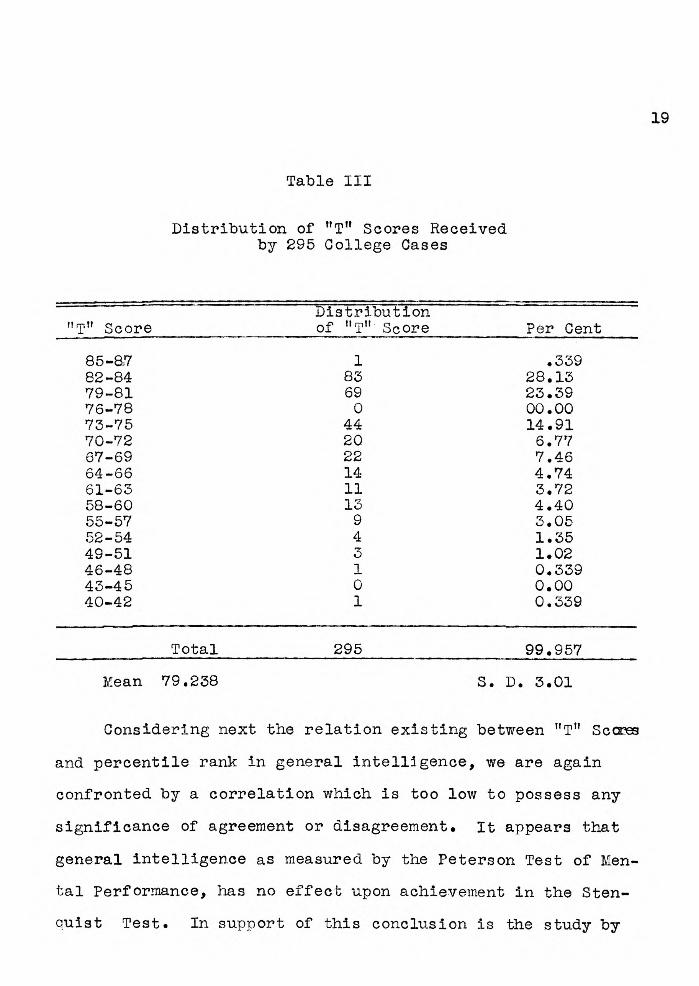
Table III
Distribution of "T" Scores Received by 295 College Cases
"T" Score Distribution of "T" Score Per Cent
85-87 1 .339 82-84 83 28.13 79-81 69 23.39 76-78 0 00.00 73-75 44 14.91 70-72 20 6.77 67-69 22 7.46 64-66 14 4.74 61-63 11 3.72 58-60 13 4.40 55-57 9 3.05 52-54 4 1.35 49-51 3 1.02 46-48 1 0.339 43-45 0 0.00 40-42 1 0.339
Total 295 99.957
Mean 79.238 S. D. 3.01
Considering next the relation existing between "T" Scor
and percentile rank in general intelligence, we are again
confronted by a correlation which is too low to possess any
significance of agreement or disagreement. It appears that
general intelligence as measured by the Peterson Test of Men-
tal Performance, has no effect upon achievement in the Sten-
quist Test. In support of this conclusion is the study by
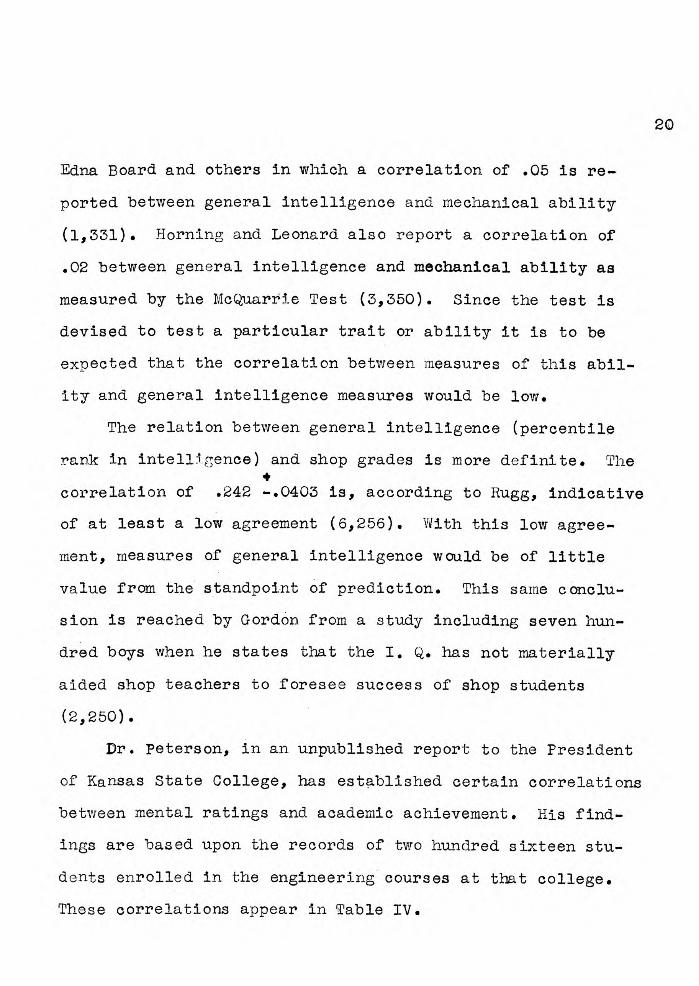
20
Edna Board and others in which a correlation of .05 is re-
ported between general intelligence and mechanical ability
(1,331). Horning and Leonard also report a correlation of
.02 between general intelligence and mechanical ability as
measured by the McQuarrie Test (3,350). Since the test is
devised to test a particular trait or ability it is to be
expected that the correlation between measures of this abil-
ity and general intelligence measures would be low.
The relation between general intelligence (percentile
rank in intelligence) and shop grades is more definite. The
correlation of .242 -.0403 is, according to Rugg, indicative
of at least a low agreement (6,256). With this low agree-
ment, measures of general intelligence would be of little
value from the standpoint of prediction. This same conclu-
sion is reached by Gordon from a study including seven hun-
dred boys when he states that the I. Q. has not materially
aided shop teachers to foresee success of shop students
(2,250).
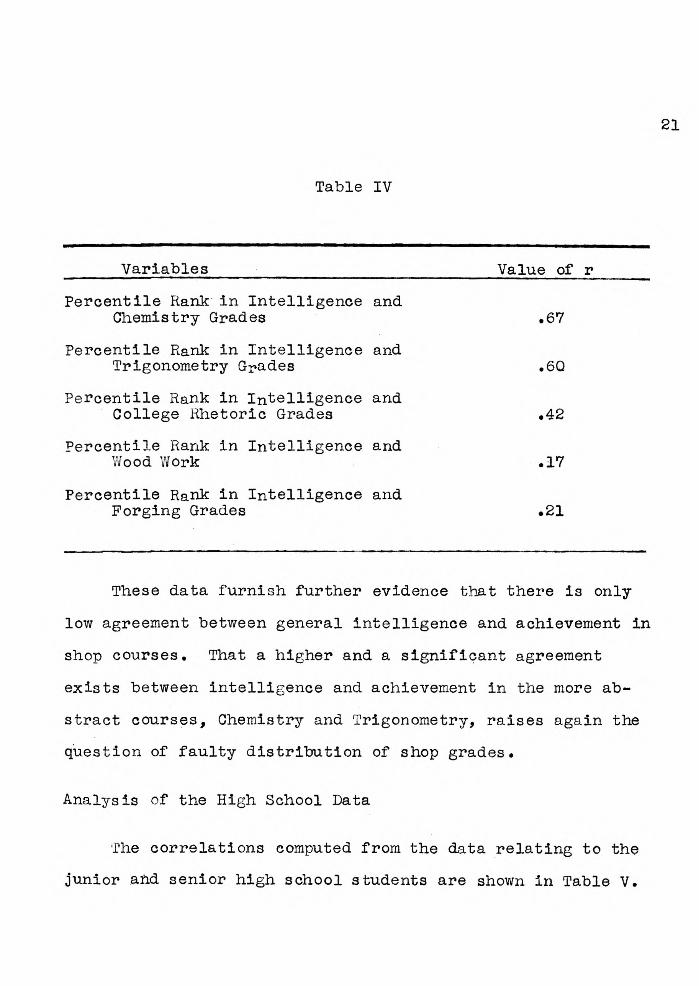
Dr. Peterson, in an unpublished report to the President
of Kansas State College, has established certain correlations
between mental ratings and academic achievement. His find-
ings are based upon the records of two hundred sixteen stu-
dents enrolled in the engineering courses at that college.
These correlations appear in Table IV.
21
Table IV
Variables
Percentile Rank in Intelligence and Chemistry Grades
Percentile Rank in Intelligence and Trigonometry Grades
Value of r
.67
.60
Percentile Rank in Intelligence and College Rhetoric Grades .42
Percentile Rank in Intelligence and Wood Work .17
Percentile Rank in Intelligence and Forging Grades .21
These data furnish further evidence that there is only
low agreement between general intelligence and achievement in
shop courses. That a higher and a significant agreement
exists between intelligence and achievement in the more ab-
stract courses, Chemistry and Trigonometry, raises again the
question of faulty distribution of shop grades.
Analysis of the High School Data
The correlations computed from the data relating to the
junior and senior high school students are shown in Table V.
22
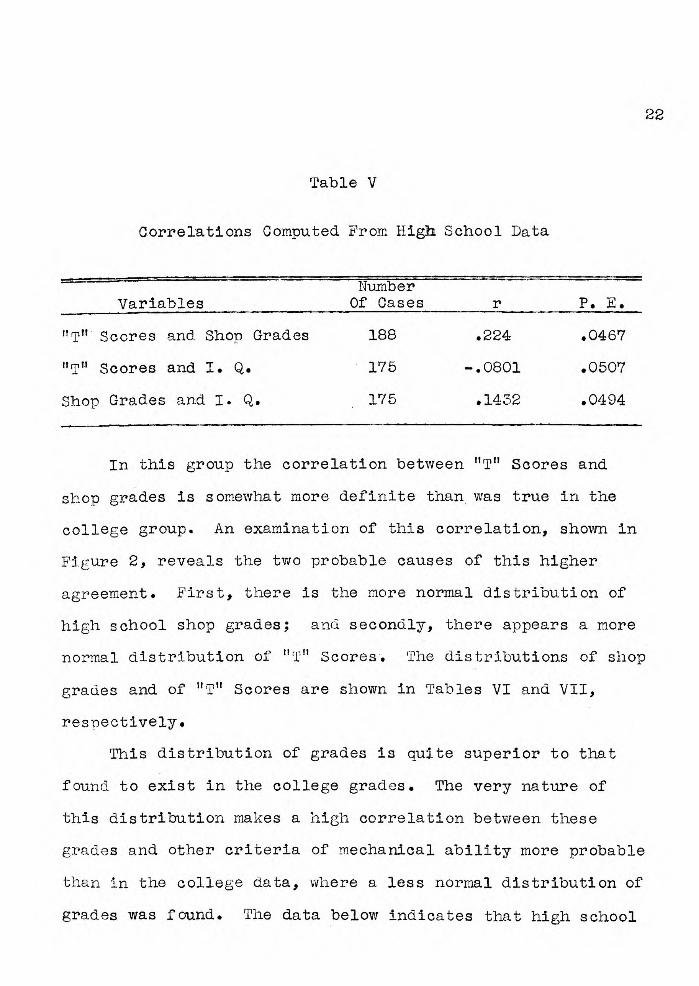
Table V
Correlations Computed From High School Data
Variables Number
Of Cases r P. E.
"T" Scores and Shop Grades 188 .224 .0467
"T" Scores and I. Q. 175 -.0801 .0507
Shop Grades and I. Q. 175 .1432 .0494
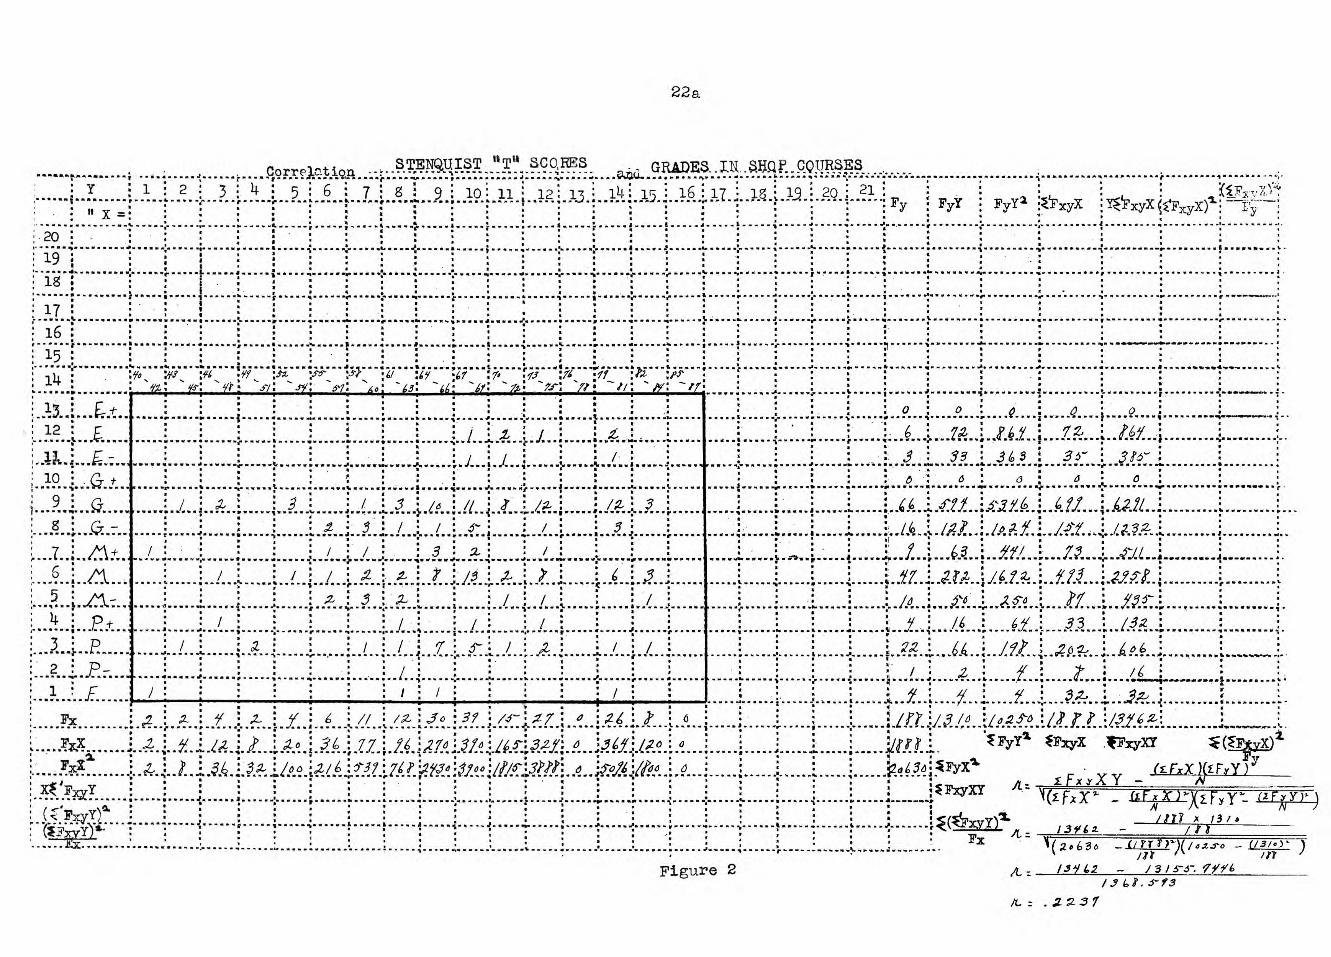
In this group the correlation between "T" Scores and
shop grades is somewhat more definite than was true in the
college group. An examination of this correlation, shown in
Figure 2, reveals the two probable causes of this higher
agreement. First, there is the more normal distribution of
high school shop grades; and secondly, there appears a more
normal distribution of "T" Scores. The distributions of shop
grades and of "T" Scores are shown in Tables VI and VII,
respectively.
This distribution of grades is quite superior to that
found to exist in the college grades. The very nature of
this distribution makes a high correlation between these
grades and other criteria of mechanical ability more probable
than in the college data, where a less normal distribution of
grades was found. The data below indicates that high school
: y ;
1 2
.20
19
18
" X =-::
Co rr e).at lost 3 4 : 5 6 :
:. 7
17 :
16 1
15
11+
13 Efi 12
10
9
4 pt 3 ..P. ..... 2 : P 1 :
Wf.
. STENWJST SCARES
:14
ti
.6/
9 10: 11 :1 12 :
'
/
..... ; .....
Fx
ti
r
4
22 a
GRAAES_.N...Iii?.CQURSES
14 i 15 : 16 ..17...; 1g i,7..Q : 20 i 21
: .
I I A ' ;
I .. .. .
1 .- ?--h ; 1
: 11. :.
. r
. i. 1 i ;
. ;
. .:,
. . .
. .
. i .
. . . . I gAt ...... ,.. :4,, :67, :9z ff...,1 :76 .9'9 :42,
- -7": - -,i/: - . :
.
. : . .
; i . .
. .
;.-1-- ,l' --/ 11 . t. s It .4
a , ..... .........4,,, i . ./....i../...; S......J.
p
'
.
1. IL g ''. r
1.
/ : 3 : ..
0: // 4
z /g, . . .
/ : / : 3 z : / i 5........: "I 4
. .
.
/ : °I '': : 3.. ,/.....i. Z' i ). 4
.
' . . .... . .2, ' .3 ,2- : : / :i / . / ; .: ! .1. .
; ... ...... .. ...t 1 . ...
:. .1 // 7' -i / 2 i .: J. i ; /
:
S
t
: / ti
FAX
FxX2' S
: a- 11.
4 Al-.V
a6 i.Z.Z.
. .. . . $1./.°;///6,131'1" " '
/.Z
;
e .26 61'
/26
6
FY
. -:
1
.:-
. .
4
. 7
: 7 : . .
.. .
1
. 4 : . i
? ..... . ... i. Q i : 0 i 0
, i 6 Z,,Z : (poi .1.
..
3 : 33 : 363 . :
:. : 6 : 6 : a :.,
o -.-
I :,....f... _O.. ...5.if./. .. i ... 7.1.....i....4:/.(...i i
Fyy FyY 2 liFxyX
S.
7z
33 /52 ,262 fob t : /6
3.2 :
Z? Tip:43116z: a *FxyX fFxyXY *afy20 o
F-
(x. Er X ) tFyY)I .. IxYXY - , ..
i316z - 1 ityr /.
3(2.60 (//w)--)(/2.0-0 _ 03/.)' Irr
Figure 2 A, i 1.5H 42 - / 3 /6-4-, Y3'6 /361'..1-93
t
IT5r2iXY
C (EXFY). FX
I
. 23 7
23
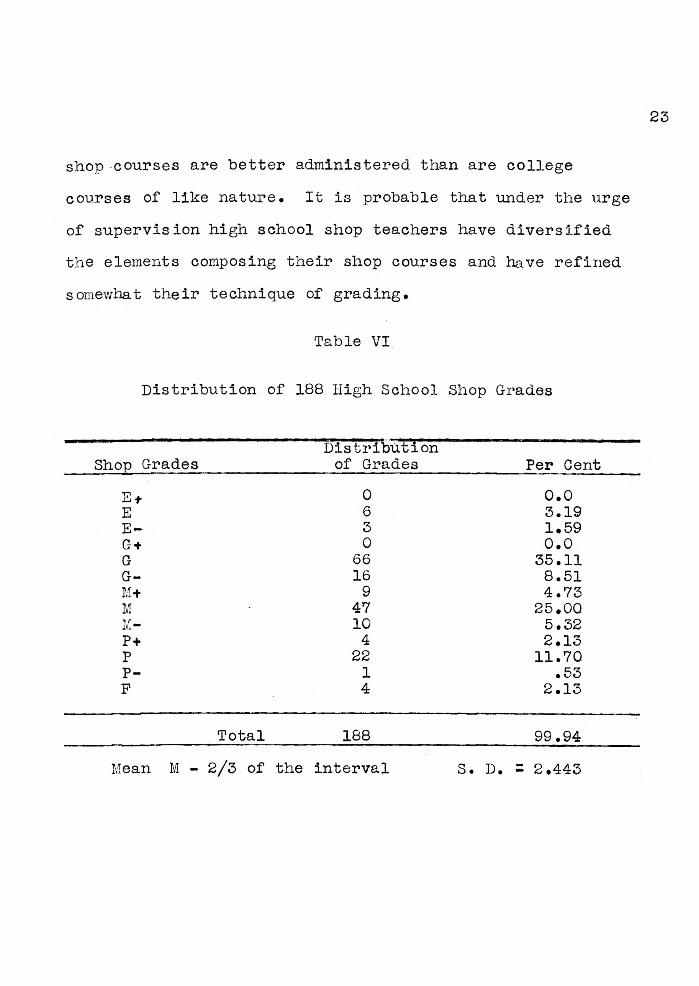
shop courses are better administered than are college
courses of like nature. It is probable that under the urge
of supervision high school shop teachers have diversified
the elements composing their shop courses and have refined
somewhat their technique of grading.
Table VI
Distribution of 188 High School Shop Grades
Distribution Shop Grades of Grades Per Cent
El. 0 0.0 E 6 3.19 E- 3 1.59 G+ 0 0.0 G 66 35.11 G- 16 8.51 Mt 9 4.73 M 47 25.00 M... 10 5.32 P+ 4 2.13 P 22 11.70 P- 1 .53 F 4 2.13
Total 188 99.94
Mean M - 2/3 of the interval S. D. = 2.443
24
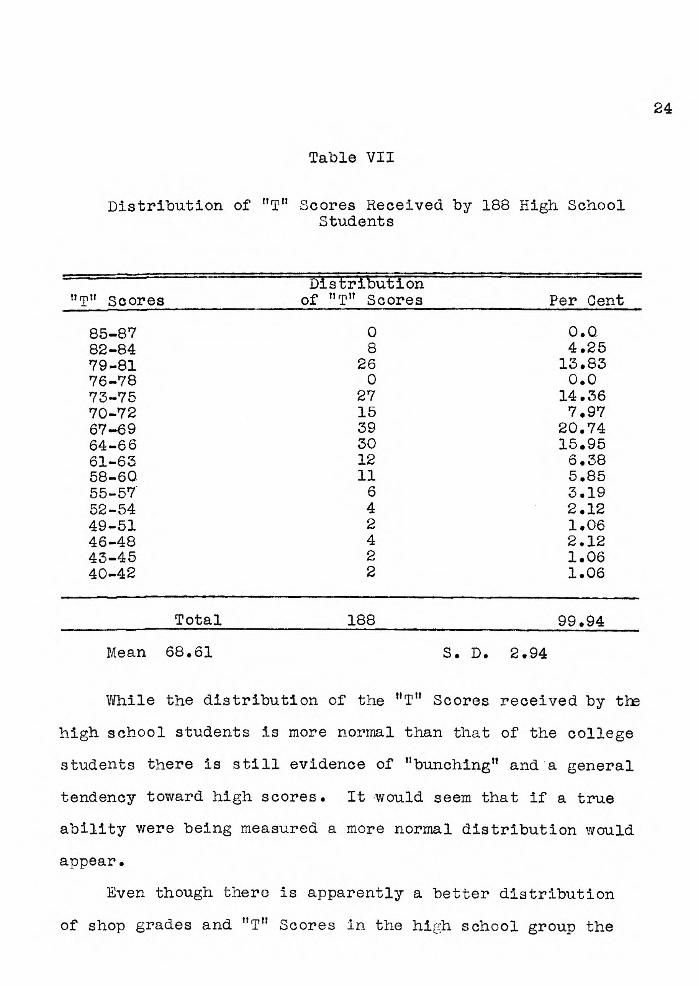
Table VII
Distribution of "T" Scores Received by 188 High School Students
Distribution "T" Scores of "T" Scores Per Cent
85-87 0 0.0 82-84 8 4.25 79-81 26 13.83 76-78 0 0.0 73-75 27 14.36 70-72 15 7.97 67-69 39 20.74 64-66 30 15.95 61-63 12 6.38 58-60 11 5.85 55-57 6 3.19 52-54 4 2.12 49-51 2 1.06 46-48 4 2.12 43-45 2 1.06 40-42 2 1.06
Total 188 99.94
Mean 68.61 S. D. 2.94
While the distribution of the "T" Scores received by the
high school students is more normal than that of the college
students there is still evidence of "bunching" and a general
tendency toward high scores. It would seem that if a true
ability were being measured a more normal distribution would
appear.
Even though there is apparently a better distribution
of shop grades and "T" Scores in the high school group the
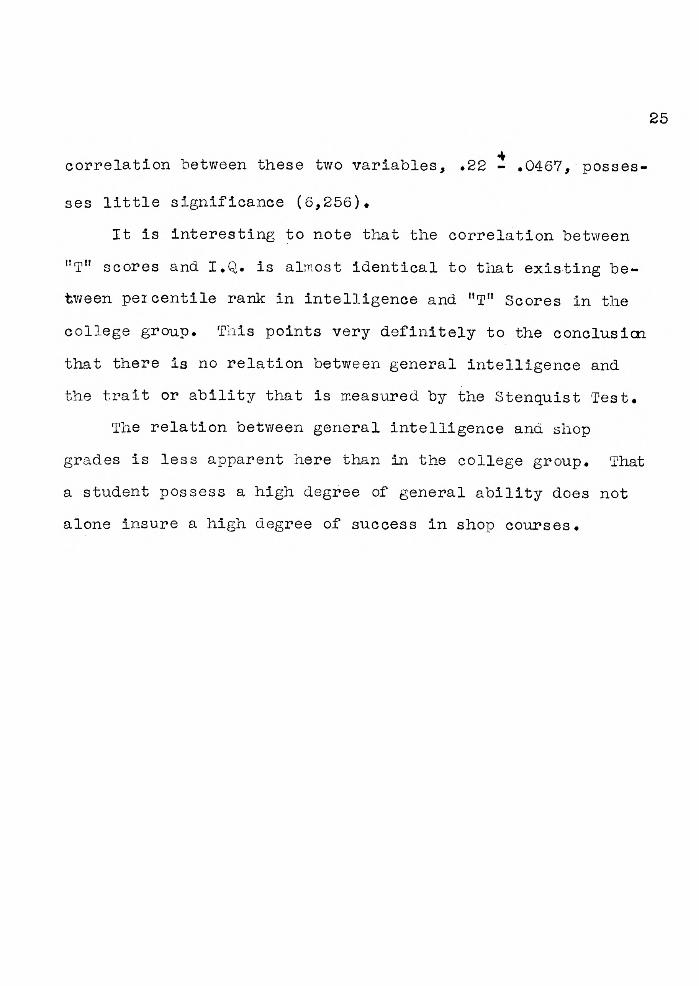
25
correlation between these two variables, .22 - .0467, posses-
ses little significance (6,256).
It is interesting to note that the correlation between
"T" scores and I.Q. is almost identical to that existing be-
tween percentile rank in intelligence and "T" Scores in the
college group. This points very definitely to the conclusion
that there is no relation between general intelligence and
the trait or ability that is measured by the Stenquist Test.
The relation between general intelligence and shop
grades is less apparent here than in the college group. That
a student possess a high degree of general ability does not
alone insure a high degree of success in shop courses.
26
ANALYSIS AND RELIABILITY OF THE STENQUIST TEST
In administering the tests many other questions of in-
terest in regard to the nature and validity of the test it-
self suggested themselves. While the ten elements of the
test possess varying degrees of difficulty, it is evident
that the order of difficulty is not the same for the college
and high school groups. In order to determine the rank in
difficulty of the ten test elements, average partial scores
of each element were computed. Only those cases were inclu-
ded which had received a partial score of 1 or greater in J,
the last element of the test. It was believed that, since
these cases had apparently attempted all of the test elements,
the average partial score of each element would be a measure
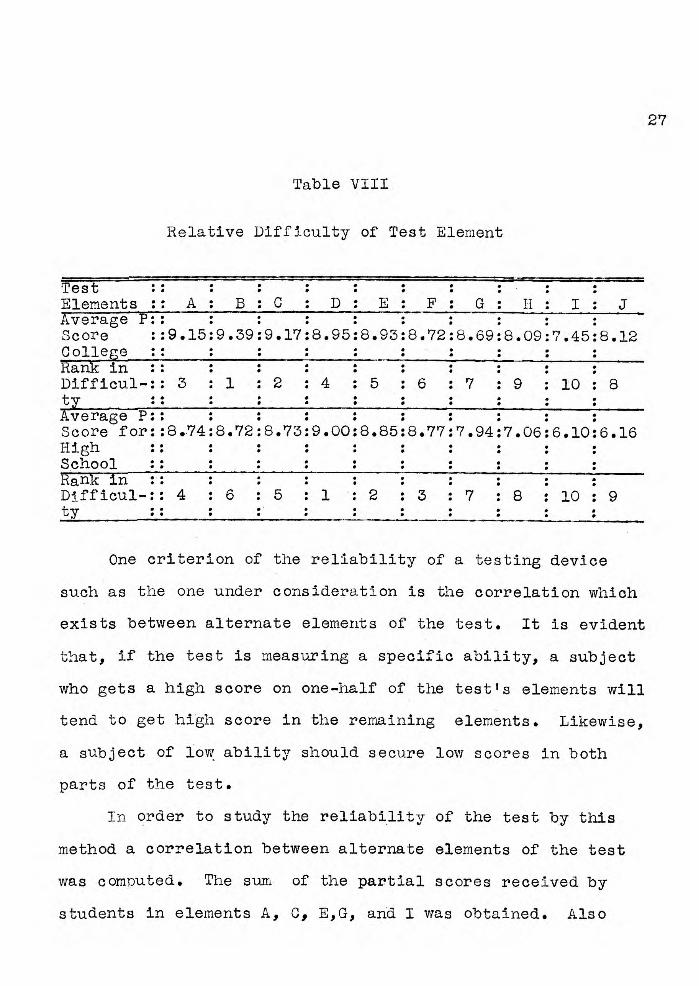
of its relative difficulty. The results appear in Table VIII.
The last four elements of the test apparently present
somewhat the same order of difficulty for both groups. Prac-
tically no further agreement is present. For the group tes-
ted the arrangement of elements has a different order of
relative difficulty than that believed to exist by the author
of the test (7,40).
27
Table VIII
Relative Difficulty of Test Element
Test Elements :: A: B:C : E: F: G: H: I: J Average P:: Score ::9.15:9.39:9.17:8.95:8.93:8.72:8.69:8.09:7.45:8.12 College Rank in ::
Difficul-:: 3 : 1 : 2 : 4 : 5 : 6 : 7 : 9 : 10 : 8 ty Average P:: Score for::8.74:8.72:8.73:9.00:8.85: 8.77:7.94:7.06:6.10:6.16 High School Rank in ::
Difficul-:: 4 : 6 : 5 : 1 : 2 : 3 : 7 : 8 : 10 : 9 ty
One criterion of the reliability of a testing device
such as the one under consideration is the correlation which
exists between alternate elements of the test. It is evident
that, if the test is measuring a specific ability, a subject
who gets a high score on one-half of the test's elements will
tend to get high score in the remaining elements. Likewise,
a subject of low ability should secure low scores in both
parts of the test.
In order to study the reliability of the test by this
method a correlation between alternate elements of the test
was computed. The sum of the partial scores received by
students in elements A, C, E,G, and I was obtained. Also
28
the sum of the partial scores received in elements B, D, F,
H, and J was computed. The value of "r" for these two vari-
ables was derived in the usual manner (Pearson's Product
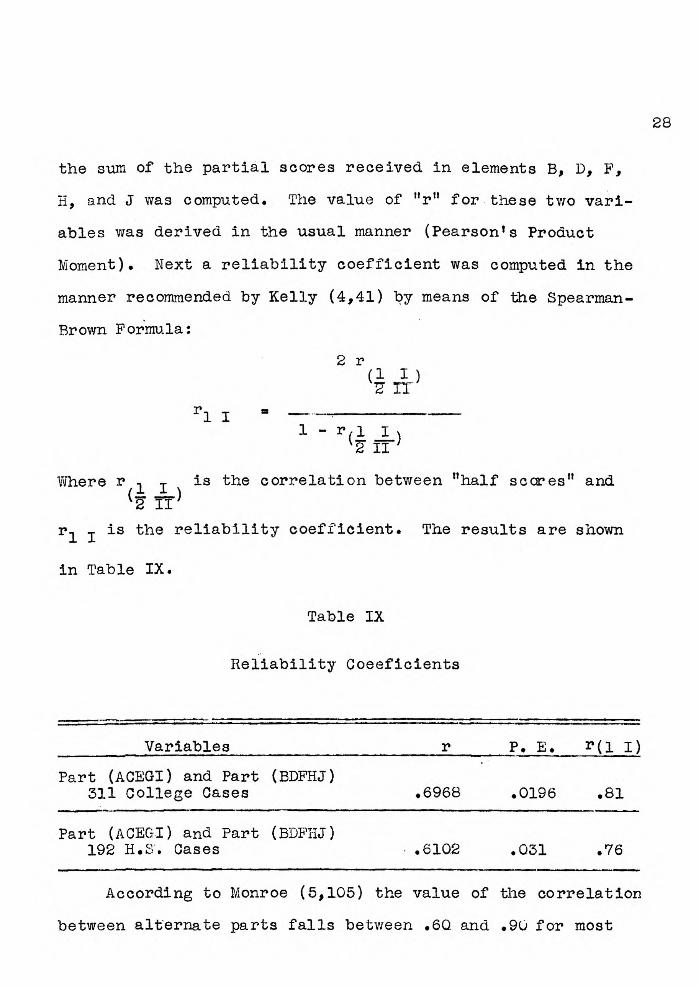
Moment). Next a reliability coefficient was computed in the
manner recommended by Kelly (4,41) by means of the Spearman-
Brown Formula:
r 1 I
2 r (7 1 I )
IT
1 -
2
r(1 ' II
)
Where r (I. I is the correlation between "half scares" and
'2 II'
r1 is the reliability coefficient. The results are shown
in Table IX.
Table IX
Reliability Coeeficients
Variables r P. E. r(1 I)
Part (ACEGI) and Part (BDFHJ) 311 College Cases .6968 .0196 .81
Part (ACEGI) and Part (BDFHJ) 192 H.S. Cases .6102 .031 .76
According to Monroe (5,105) the value of the correlation
between alternate parts falls between .60 and .9U for most
29
educational tests. This would place the Stenquist intercorre-
lation rather near the lower boundary and would indicate that
the test elements were not measuring uniformily the trait,
for which the test is a measure.
Kelley states that the value of "r" is an excellent
estimate of the true measuring value of any test (4,41). He
further asserts that the value of r(a. I) should exceed .94 if
the test has sufficient reliability to be used in individual
diagnosis (4,211). With these facts in mind we have still
further reason to doubt the reliability of the test. It
seems certain that the Stenquist Test falls far short of
possessing any value as an individual diagnostic test.
Considerable experience with the Stenquist Test has
gradually caused the writer to not only doubt the validity
and the reliability of the test but to question also the na-
ture of the trait or quality which it measures. Whatever may
be the nature of this quality or trait, it has been shown
that it has no definite relation to other measures of mechan-
ical ability. It has also been shown that there is a ten-
dency toward high scores in the test. Evidently it is mea-
suring some trait or quality which is possessed in a high de-
gree by the majority of students who have taken the test.
The writer can think of no trait or quality that so well fits
this description as does that gained by experience with com-
mon mechanical devices. It would seem that experience with
30,
the multitude of common mechanical devices present in the
environment of the average individual would in itself have a
definite effect upon the individual's ability to perform this
type of test. Since such experience is possessed by practi-
cally all students there follows as a natural result the ten-
dency toward high scores. In the study by Board and others
(1,332) the concluding remarks contain the pertinent question
"Do mechanical ability tests measure mechanical ability or
mechanical experience?" There is a need for controlled ex-
periments to determine the effect of experience with mechani-
cal devices upon scores received in current mechanical abil-
ity tests.
31
CONCLUSIONS
1. There is no definite relation between the "T"
Scores received by a student in the Stenquist Mechanical
Ability Test and the student's subsequent success or failure
in shop courses.
2. Since "T" Scores possess no relation to success or
failure in shop courses, they possess no prognostic value and
consequently are valueless in educational guidance.
3. There is no definite relation between general intel-
ligence and ability to perform the Stenquist Test.
4. The student of high general intelligence has little
if any better chance to excel in shop work than does the
student of low general intelligence.
5. Low intercorrelations of alternate test parts indi-
cate that the Stenquist Test is of doubtful value as a true
ability test.
6. Low reliability coefficients show the Stenquist Test
to have no value as an individual prognostic test.
7. From the above findings the writer reaches the final
tentative conclusion that the Stenquist Test is a measure of
experience rather than of any ability.
32
ACKNOWLEDGEMENTS
I wish to express my sincere appreciation of the kindly
critical supervision I have received throughout this study
from Doctor V. L. Strickland. The author is also indebted to
Doctor Strickland for first suggesting the problem and for
the use of the testing material supplied at his own personal
effort and expense. Whatever merit this study may possess is
largely due his patient and ever ready counsel.
I am indebted to Doctor W. H.Andrews for scholarly and
educational idealism gained in his graduate courses. His in-
struction in the technique of editing articles and of statis-
tical treatment of data have proven invaluable aids in pre-
paring the report of this study.
I wish also to acknowledge my obligation to Doctor J. C.
Peterson for his many stimulating comments on the study and
for assistance in the statistical treatment of data.
Credit is also due to the various shop teachers, prin-
cipals, and superintendents who co-operated in giving the
tests.
BIBLIOGRAPHY
1. Board, Edna; Marsh, Wilda and Stockwell, Lynn E. 1927. The Relation of General Intelligence to Me-
chanical Ability. Ind. Arts M. 16:330-332 2. Gordon, George, Jr.
1929. The Relation of Pupils' Intelligence Quotients to Their Grades in the High School Shop. Ind. Educ. M. 250 Jan. 1929.
3. Horning, D. S. and Leonard, Ruth S. 1926. Testing Mechanical Ability by the McQuarrie
Test. Ind. Arts M. 15:348-350. 0 '26 4. Kelley, Truman Lee.
1927. Interpretation of Educational Measurements. World Book Co., N. Y.
5. Monroe, Walter Scott. 1923. An Introduction to the Theory of Educational
Measurements. Houghton Mifflin Co., N. Y. 6. Rugg, Harold 0.
1917. Statistical Methods Applied to Education. Houghton Mifflin Co., N. Y.
7. Stenquist, John L. 1923. Measurements of Mechanical Ability. Contribu-
tions to Education, No. 130. Teachers College N. Y.
8. Sutherland, S. S. 1928. Correlations of Intelligence and Skill in Shop
Work. Ind. Arts M. June 1928.