Embed Size (px)
Citation preview
N
The Projected Demand for Physicians,
Nurse Practitioners, and Physician
Assistants in Oregon: 2013-2020
February 2014
Prepared for: The Oregon Health Authority
Prepared by:
Office for Oregon Health Policy & Research Oregon Health & Science University, Center for Health System Effectiveness
Oregon Healthcare Workforce Institute
Revised 2/2/2014

[This page intentionally left blank]
i
Table of Contents
Executive Summary .......................................................................................................... iii
Background ......................................................................................................................... 1
Projection Methodology ...................................................................................................... 3
Data Sources ........................................................................................................................ 4
Findings ............................................................................................................................... 7
Discussion ......................................................................................................................... 17
Policy Implications ............................................................................................................ 19
Appendices ........................................................................................................................ 21
Appendix A: Summary of Recent Studies Projecting Primary Care Clinician
Demand as a Result of Health Care Reform ........................................... 22
Appendix B: Number of Clinician FTEs by County ..................................................... 23
Appendix C: Estimated Population Changes by Insurance Coverage Type ................. 25
Appendix D: Annual County-Level Clinician Projection Counts by Scenario ............. 27
Appendix E: County Ranking by Projected Percentage Change in the Clinician
Workforce by Scenario 2013-2020 ......................................................... 39
Endnotes ............................................................................................................................ 42

ii
[This page intentionally left blank]
iii
Executive Summary
This study estimates the number of physicians, nurse practitioners, and physician assistants
needed in Oregon between 2013 and 2020 to address the demand for health services created by
Oregon’s health system transformation, federal health reform, and a growing and aging
population. The study uses unique data from Oregon-specific sources, including Oregon’s All
Payer, All Claims database and the Oregon Health Care Workforce Licensing Database, to
identify utilization by type of health insurance coverage and to allow for the estimation of
clinician demand at the state and county level.
Baseline clinician demand projections were estimated by applying observed rates of utilization of
health care services per-person and per-clinician providing this care to population projections of
coverage changes. Adjustments to the model were developed to estimate the potential workforce
impacts of Oregon’s health system transformation, team-based care, full implementation of health
information technologies, and a combination of team-based care and health information
technologies.
The baseline projection between 2013 and 2020 for all three health professions is 16% growth
over current demand. At the county level, the 2013-2020 baseline projections ranged from 9.3%
additional demand in Umatilla County to 28.5% in Curry County. In addition, Wheeler, Coos,
Tillamook, Wallowa, and Josephine counties have estimated demand rates at 25% or greater for
all three professions. The variation in growth rates is driven by differing proportions of uninsured
(and other coverage types) in areas that feed the providers in those counties.
Adjusting for a two percent reduction in Medicaid utilization—corresponding to the Oregon’s
commitment to reduce Medicaid cost growth—the demand for physicians, nurse practitioners and
physician assistants drops slightly to a 14% growth rate. For all three professions, the
implementation of the full-range of health information technologies reduces demand to an 11%
growth rate.
The demand shift among clinicians is seen in the team-based care scenario where projected
physician demand drops to a 12% growth rate while simultaneously increasing that of nurse
practitioners and physician assistants to 31%. Combining both team-based care and health
information technologies further reduces the projected physician demand curve to a 7% growth
rate, but increases the projected demand for both nurse practitioners and physician assistants by
24% between 2013 and 2020.
These projections, specifically at the county-level, help inform workforce capacity adjustment
efforts such as directing finite public and private resources for technical assistance, health
profession education, workforce development, and recruitment and retention efforts to areas of
greatest need. The findings demonstrate that projected clinician demand varies widely under
possible scenarios. These projections also highlight the critical links among provider access,
workforce capacity, health profession education, payment structures, and delivery system design
that are important components in meeting the goals of the Triple Aim.

iv
[This page intentionally left blank]
1
The Projected Demand for Physicians, Nurse Practitioners,
and Physician Assistants in Oregon: 2013-2020
The importance of understanding the dynamics of the demand for and supply of health care
providers in Oregon has never been greater. The ability of state and federal health reforms to
meet the stated “Triple Aim” of better health, better care and lower costs will depend in large part
on the health care workforce and its capacity to meet the increase in demand for health services
that is likely to accompany expansions in health insurance coverage. At the same time, health
care delivery models are being substantially reconsidered and redesigned. This study aims to
address the question of how many clinicians will be needed in Oregon after health care reform.
Background
Expansions in health insurance coverage tend to lead to increases in the use of health care
services, particularly primary care services.1 For example, recent findings from the Oregon
Health Study show that Oregonians gaining access to Medicaid coverage increased their use of
health care services by 35 percent, with primary and preventive care a large share of that increase.
Additionally, those with Medicaid coverage were 70 percent more likely to have a regular place
of care and 55 percent more likely to have a regular physician than those without coverage.2
Similar outcomes were reported after Massachusetts passed legislation to expand access to health
insurance coverage in 2006. Between 2006 and 2010, the number of state survey respondents
reporting a regular source of care increased from 86 to 90 percent and the number visiting a
physician for preventive services within the previous 12 months increased from 70 to 76 percent.3
Massachusetts’s experience with health care reform underscores the need to anticipate the effect
of coverage expansion and other changes on health care delivery systems. That state’s expansion
efforts did not address health care workforce implications and, following implementation, the
state’s health care infrastructure showed signs of strain. Although the proportion of residents
without a primary care provider decreased by 10 percent between 2006 and 2008, the share of
family medicine and internal medicine physician offices accepting new patients also declined, by
10 and 22 percent, respectively from 2005 to 2009. In 2009, more than one in five residents
reported difficulty obtaining health care, even though Massachusetts has the highest primary care
physician-to-population ratio of all 50 states.4,5
Immediately following its reforms, Massachusetts
saw stronger growth among health care administrative personnel, such as financial and business
managers, than among its clinician workforce.6
2
The question of whether the supply of clinicians will be sufficient to meet demand is being raised
nationwide with increasing urgency in both the health care literature and popular media, with
approaches ranging from pure opinion pieces to complex simulation models. Opinions and
conclusions vary widely along with the methods used, with some studies projecting grave
shortages and others suggesting only minor increases in capacity are needed.
Once reason for the variation of conclusions is the rapid, ongoing changes in the way health care
is delivered and financed. These operational changes will likely impact demand in ways that are
not yet clear. Evidence from primary care home models and care coordination initiatives
suggests that practices which emphasize case management, patient-centered care, and technology
reduce costs by preventing hospitalizations and emergency department visits.7,8
These models
have very different implications for how many and what kind of health professionals and non-
clinical personnel would be needed.
Several recent national studies which estimate the future demand for different types of health care
providers are described in Appendix A. Building on that literature, this study uses a utilization-
based macro-simulation model to project clinician demand specific to Oregon through 2020. The
model encompasses physicians, physician assistants and nurse practitioners, making the
projections broader than several national studies focused solely on physicians. The model also
incorporates demographic trends and the expected impact of insurance coverage expansion
through state and federal health care reforms. At the same time, this study includes additional
analyses to investigate and further refine the projected workforce impacts of new care delivery
practices, such as team-based staffing and increased use of technology.
Unlike other studies that use national data to identify state workforce needs, this study uses data
from Oregon sources, including Oregon’s All Payer, All Claims database and the Oregon Health
Care Workforce Licensing Database, to identify Oregon-specific utilization by type of coverage
and to allow for the examination of workforce demand at the county level. This wealth of data
provides the opportunity to focus on Oregon and its counties, exploring regional need to a degree
unavailable in national studies.
Even with these data sources, this study is not intended to produce definitive figures on the
number of providers needed in Oregon in a given year. Instead, the goal is to produce a
3
reasonable range of estimates based on current trends and how potential changes in care delivery
or policy might affect those trends.
Projection Methodology
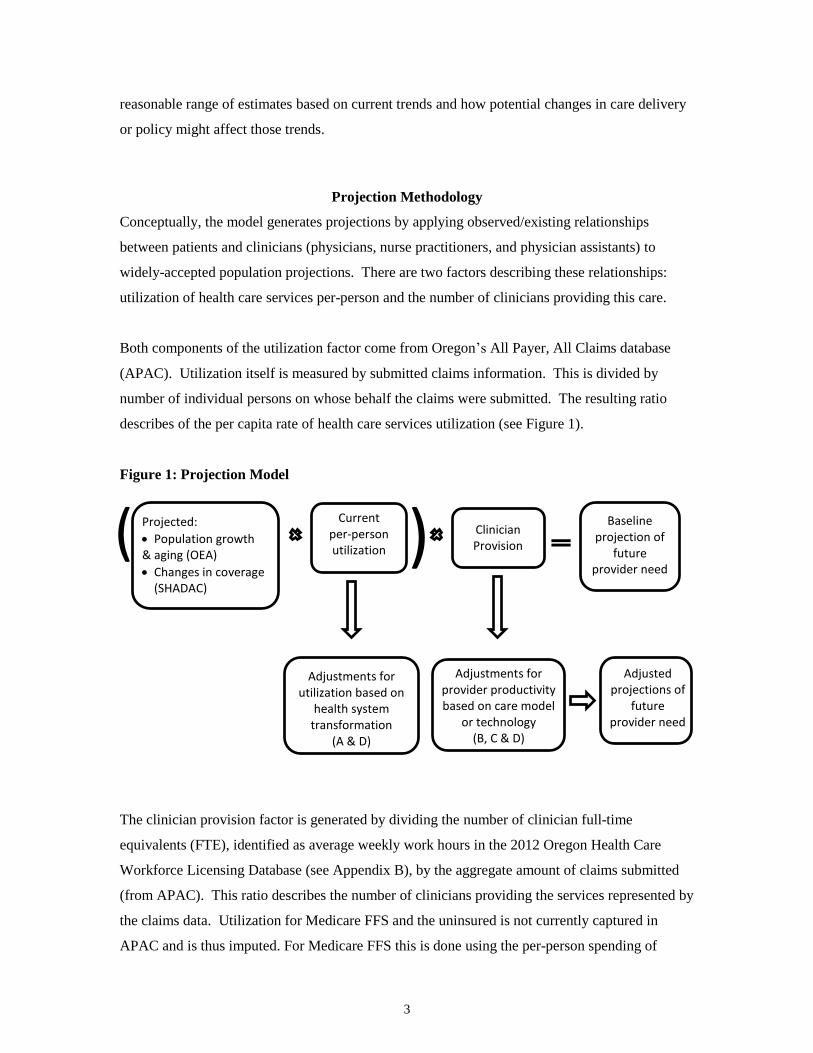
Conceptually, the model generates projections by applying observed/existing relationships
between patients and clinicians (physicians, nurse practitioners, and physician assistants) to
widely-accepted population projections. There are two factors describing these relationships:
utilization of health care services per-person and the number of clinicians providing this care.
Both components of the utilization factor come from Oregon’s All Payer, All Claims database
(APAC). Utilization itself is measured by submitted claims information. This is divided by
number of individual persons on whose behalf the claims were submitted. The resulting ratio
describes of the per capita rate of health care services utilization (see Figure 1).
Figure 1: Projection Model
The clinician provision factor is generated by dividing the number of clinician full-time
equivalents (FTE), identified as average weekly work hours in the 2012 Oregon Health Care
Workforce Licensing Database (see Appendix B), by the aggregate amount of claims submitted
(from APAC). This ratio describes the number of clinicians providing the services represented by
the claims data. Utilization for Medicare FFS and the uninsured is not currently captured in
APAC and is thus imputed. For Medicare FFS this is done using the per-person spending of
Projected:
Population growth & aging (OEA)
Changes in coverage (SHADAC)
Adjustments for utilization based on
health system transformation
(A & D)
Current per-person utilization
Clinician Provision
Baseline projection of
future provider need
Adjustments for provider productivity based on care model
or technology (B, C & D)
Adjusted projections of
future provider need
) (
4
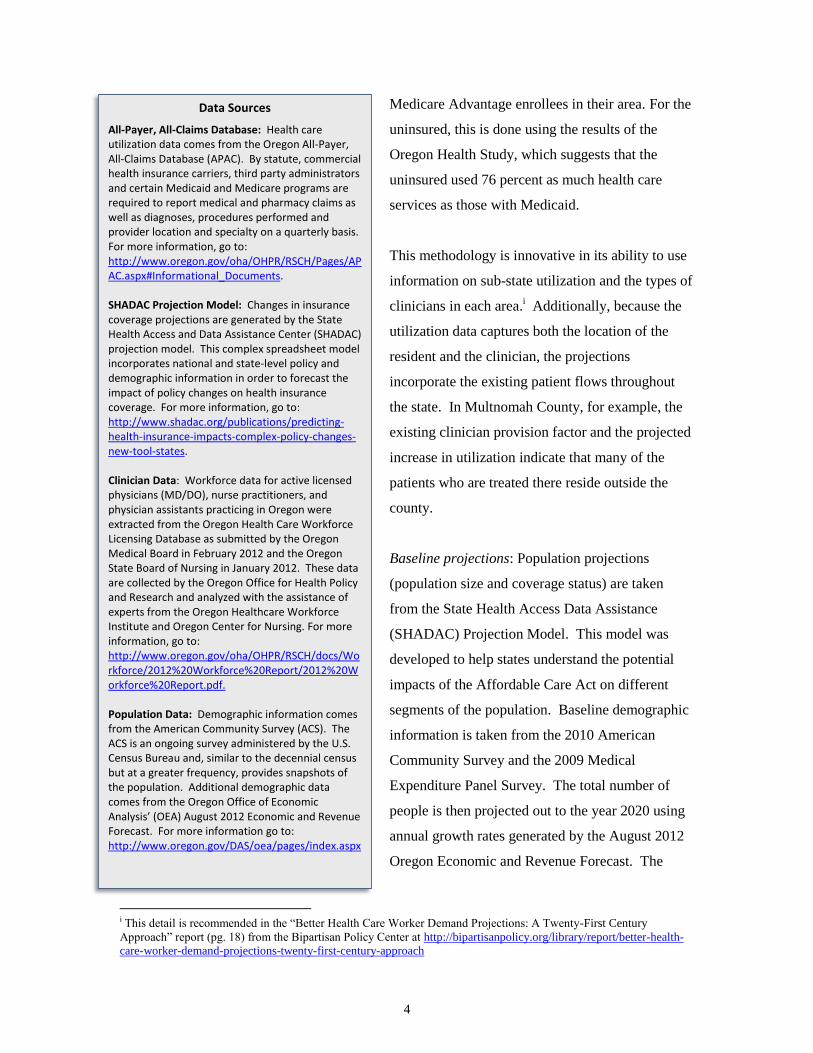
Medicare Advantage enrollees in their area. For the
uninsured, this is done using the results of the
Oregon Health Study, which suggests that the
uninsured used 76 percent as much health care
services as those with Medicaid.
This methodology is innovative in its ability to use
information on sub-state utilization and the types of
clinicians in each area.i Additionally, because the
utilization data captures both the location of the
resident and the clinician, the projections
incorporate the existing patient flows throughout
the state. In Multnomah County, for example, the
existing clinician provision factor and the projected
increase in utilization indicate that many of the
patients who are treated there reside outside the
county.
Baseline projections: Population projections
(population size and coverage status) are taken
from the State Health Access Data Assistance
(SHADAC) Projection Model. This model was
developed to help states understand the potential
impacts of the Affordable Care Act on different
segments of the population. Baseline demographic
information is taken from the 2010 American
Community Survey and the 2009 Medical
Expenditure Panel Survey. The total number of
people is then projected out to the year 2020 using
annual growth rates generated by the August 2012
Oregon Economic and Revenue Forecast. The
i This detail is recommended in the “Better Health Care Worker Demand Projections: A Twenty-First Century
Approach” report (pg. 18) from the Bipartisan Policy Center at http://bipartisanpolicy.org/library/report/better-health-
care-worker-demand-projections-twenty-first-century-approach
Data Sources
All-Payer, All-Claims Database: Health care utilization data comes from the Oregon All-Payer, All-Claims Database (APAC). By statute, commercial health insurance carriers, third party administrators and certain Medicaid and Medicare programs are required to report medical and pharmacy claims as well as diagnoses, procedures performed and provider location and specialty on a quarterly basis. For more information, go to: http://www.oregon.gov/oha/OHPR/RSCH/Pages/APAC.aspx#Informational_Documents. SHADAC Projection Model: Changes in insurance coverage projections are generated by the State Health Access and Data Assistance Center (SHADAC) projection model. This complex spreadsheet model incorporates national and state-level policy and demographic information in order to forecast the impact of policy changes on health insurance coverage. For more information, go to: http://www.shadac.org/publications/predicting-health-insurance-impacts-complex-policy-changes-new-tool-states. Clinician Data: Workforce data for active licensed physicians (MD/DO), nurse practitioners, and physician assistants practicing in Oregon were extracted from the Oregon Health Care Workforce Licensing Database as submitted by the Oregon Medical Board in February 2012 and the Oregon State Board of Nursing in January 2012. These data are collected by the Oregon Office for Health Policy and Research and analyzed with the assistance of experts from the Oregon Healthcare Workforce Institute and Oregon Center for Nursing. For more information, go to: http://www.oregon.gov/oha/OHPR/RSCH/docs/Workforce/2012%20Workforce%20Report/2012%20Workforce%20Report.pdf. Population Data: Demographic information comes from the American Community Survey (ACS). The ACS is an ongoing survey administered by the U.S. Census Bureau and, similar to the decennial census but at a greater frequency, provides snapshots of the population. Additional demographic data comes from the Oregon Office of Economic Analysis’ (OEA) August 2012 Economic and Revenue Forecast. For more information go to: http://www.oregon.gov/DAS/oea/pages/index.aspx
5
distribution of insurance coverage by type is estimated using results from the economics literature
and the policy and administrative aims of the Patient Protection and Affordable Care Act (ACA)
(see Appendix C).
Total utilization is projected by multiplying the population projections by the utilization-per-
person factor. The workforce figures are then generated by multiplying the utilization projections
by the clinician provision factor. These components can then be disaggregated by geographic
factors (county), insurance type (private, Medicare, Medicaid and uninsured) and provider type
(physician, nurse practitioner, or physician assistant). These forecasts comprise the baseline
projections.
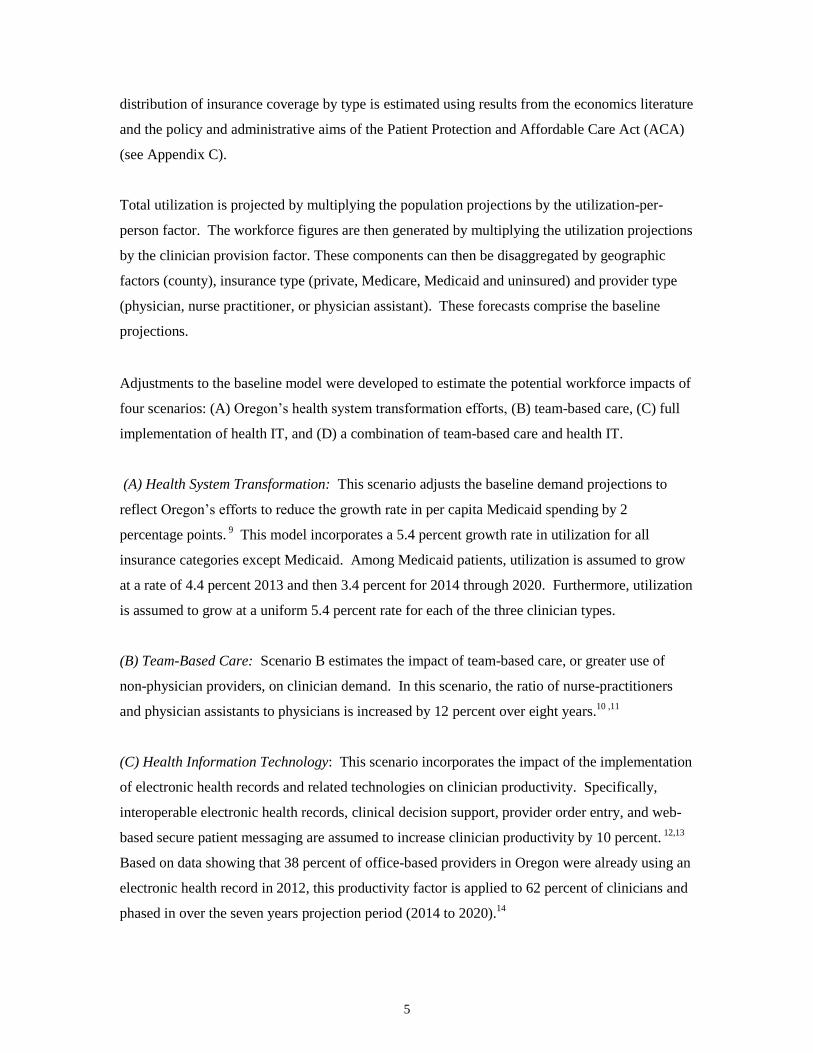
Adjustments to the baseline model were developed to estimate the potential workforce impacts of
four scenarios: (A) Oregon’s health system transformation efforts, (B) team-based care, (C) full
implementation of health IT, and (D) a combination of team-based care and health IT.
(A) Health System Transformation: This scenario adjusts the baseline demand projections to
reflect Oregon’s efforts to reduce the growth rate in per capita Medicaid spending by 2
percentage points. 9 This model incorporates a 5.4 percent growth rate in utilization for all
insurance categories except Medicaid. Among Medicaid patients, utilization is assumed to grow
at a rate of 4.4 percent 2013 and then 3.4 percent for 2014 through 2020. Furthermore, utilization
is assumed to grow at a uniform 5.4 percent rate for each of the three clinician types.
(B) Team-Based Care: Scenario B estimates the impact of team-based care, or greater use of
non-physician providers, on clinician demand. In this scenario, the ratio of nurse-practitioners
and physician assistants to physicians is increased by 12 percent over eight years.10 ,11
(C) Health Information Technology: This scenario incorporates the impact of the implementation
of electronic health records and related technologies on clinician productivity. Specifically,
interoperable electronic health records, clinical decision support, provider order entry, and web-
based secure patient messaging are assumed to increase clinician productivity by 10 percent. 12,13
Based on data showing that 38 percent of office-based providers in Oregon were already using an
electronic health record in 2012, this productivity factor is applied to 62 percent of clinicians and
phased in over the seven years projection period (2014 to 2020).14
6
(D) Team-Based Care and Health Information Technology: The final modification combines
elements of scenarios B and C. First, with the implementation of team-based care (scenario B),
the physician utilization is adjusted downward while the utilization of nurse practitioners and
physician assistants is adjusted upward. Second, with the incorporation of health information
technology (scenario C), the productivity of all clinicians is increased.
Additional Scenarios (Not Modeled): Of course, these four scenarios are far from a complete
enumeration of all potential changes to the health care system that may affect utilization. Due to
data limitations, the alternate scenarios do not incorporate other potential changes such as:
increased focus on prevention activities; changes in population health status (other than
population aging); moving more care into community settings that do not employ licensed health
professionals; or delegation of clinical care to providers other than physician assistants and nurse
practitioners, such as pharmacists, registered nurses, or traditional health workers. This study’s
focus on physicians, nurse practitioners, and physician assistants is partly a necessary response to
limited evidence but also a recognition that these providers serve as the point of entry to care for
many patients, especially those with new coverage.
7
Findings
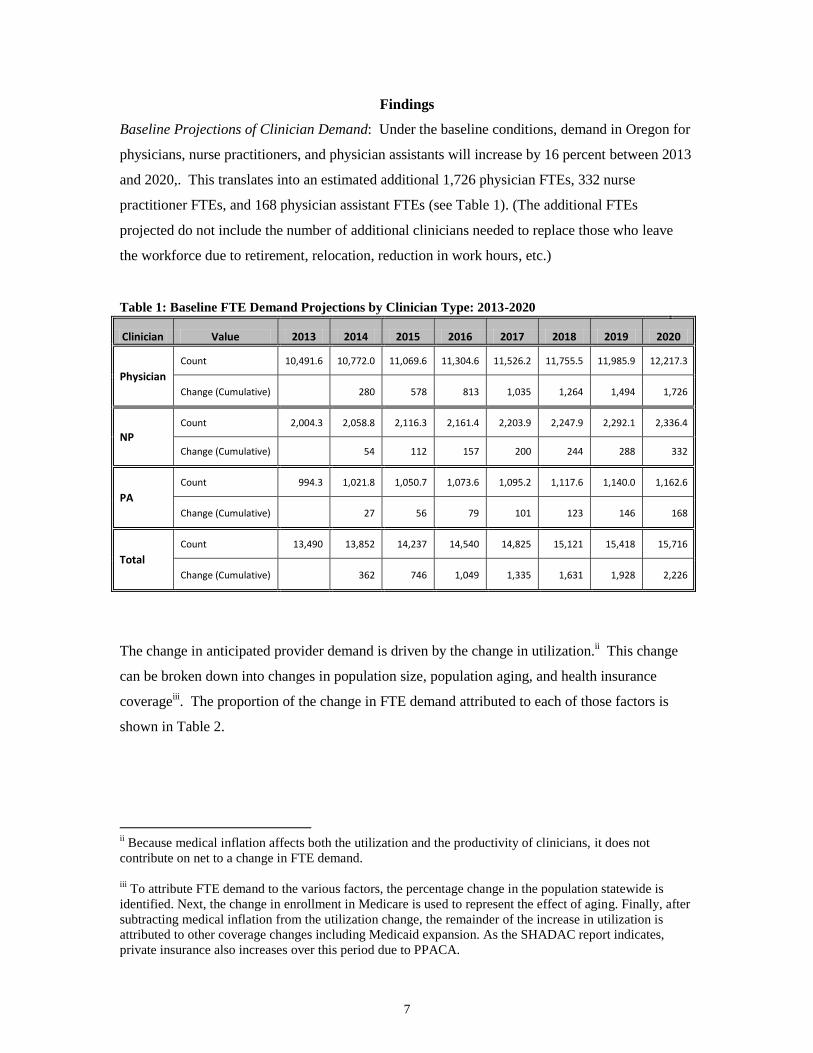
Baseline Projections of Clinician Demand: Under the baseline conditions, demand in Oregon for
physicians, nurse practitioners, and physician assistants will increase by 16 percent between 2013
and 2020,. This translates into an estimated additional 1,726 physician FTEs, 332 nurse
practitioner FTEs, and 168 physician assistant FTEs (see Table 1). (The additional FTEs
projected do not include the number of additional clinicians needed to replace those who leave
the workforce due to retirement, relocation, reduction in work hours, etc.)
The change in anticipated provider demand is driven by the change in utilization.ii This change
can be broken down into changes in population size, population aging, and health insurance
coverageiii. The proportion of the change in FTE demand attributed to each of those factors is
shown in Table 2.
ii Because medical inflation affects both the utilization and the productivity of clinicians, it does not
contribute on net to a change in FTE demand.
iii
To attribute FTE demand to the various factors, the percentage change in the population statewide is
identified. Next, the change in enrollment in Medicare is used to represent the effect of aging. Finally, after
subtracting medical inflation from the utilization change, the remainder of the increase in utilization is
attributed to other coverage changes including Medicaid expansion. As the SHADAC report indicates,
private insurance also increases over this period due to PPACA.
Table 1: Baseline FTE Demand Projections by Clinician Type: 2013-2020
Clinician Value 2013 2014 2015 2016 2017 2018 2019 2020
Physician
Count 10,491.6 10,772.0 11,069.6 11,304.6 11,526.2 11,755.5 11,985.9 12,217.3
Change (Cumulative) 280 578 813 1,035 1,264 1,494 1,726
NP Count 2,004.3 2,058.8 2,116.3 2,161.4 2,203.9 2,247.9 2,292.1 2,336.4
Change (Cumulative) 54 112 157 200 244 288 332
PA
Count 994.3 1,021.8 1,050.7 1,073.6 1,095.2 1,117.6 1,140.0 1,162.6
Change (Cumulative) 27 56 79 101 123 146 168
Total
Count 13,490 13,852 14,237 14,540 14,825 15,121 15,418 15,716
Change (Cumulative) 362 746 1,049 1,335 1,631 1,928 2,226
8
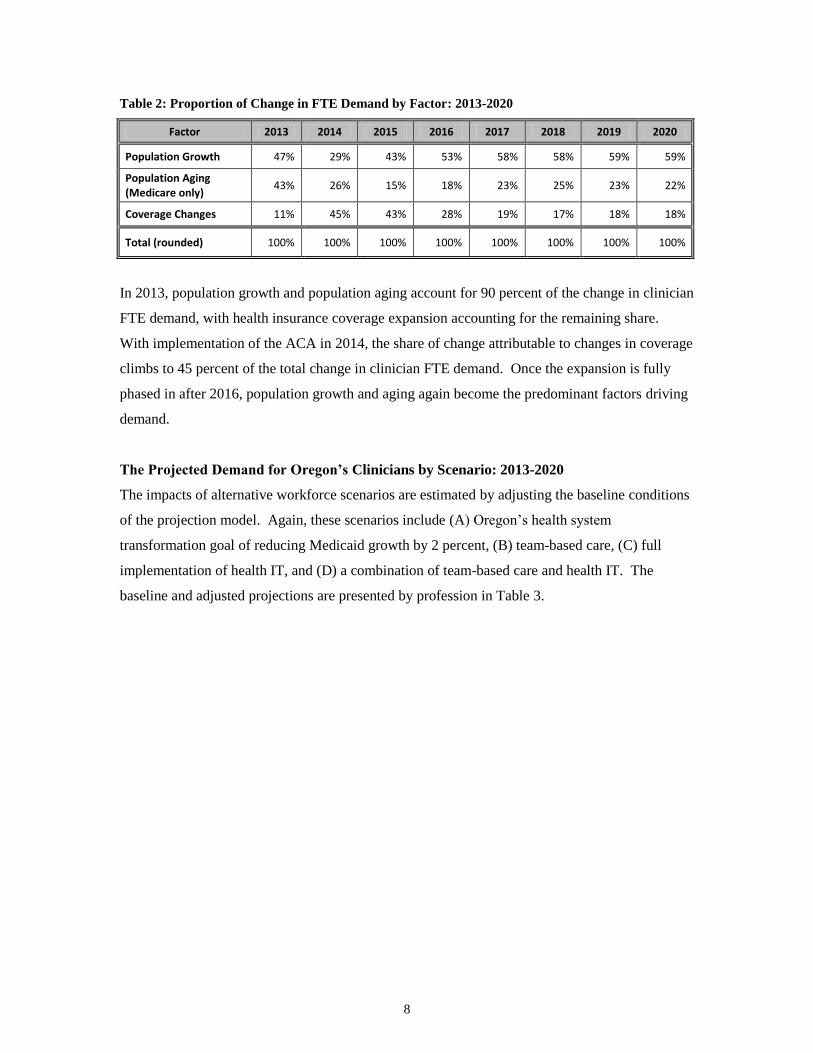
Table 2: Proportion of Change in FTE Demand by Factor: 2013-2020
Factor 2013 2014 2015 2016 2017 2018 2019 2020
Population Growth 47% 29% 43% 53% 58% 58% 59% 59%
Population Aging (Medicare only)
43% 26% 15% 18% 23% 25% 23% 22%
Coverage Changes 11% 45% 43% 28% 19% 17% 18% 18%
Total (rounded) 100% 100% 100% 100% 100% 100% 100% 100%
In 2013, population growth and population aging account for 90 percent of the change in clinician
FTE demand, with health insurance coverage expansion accounting for the remaining share.
With implementation of the ACA in 2014, the share of change attributable to changes in coverage
climbs to 45 percent of the total change in clinician FTE demand. Once the expansion is fully
phased in after 2016, population growth and aging again become the predominant factors driving
demand.
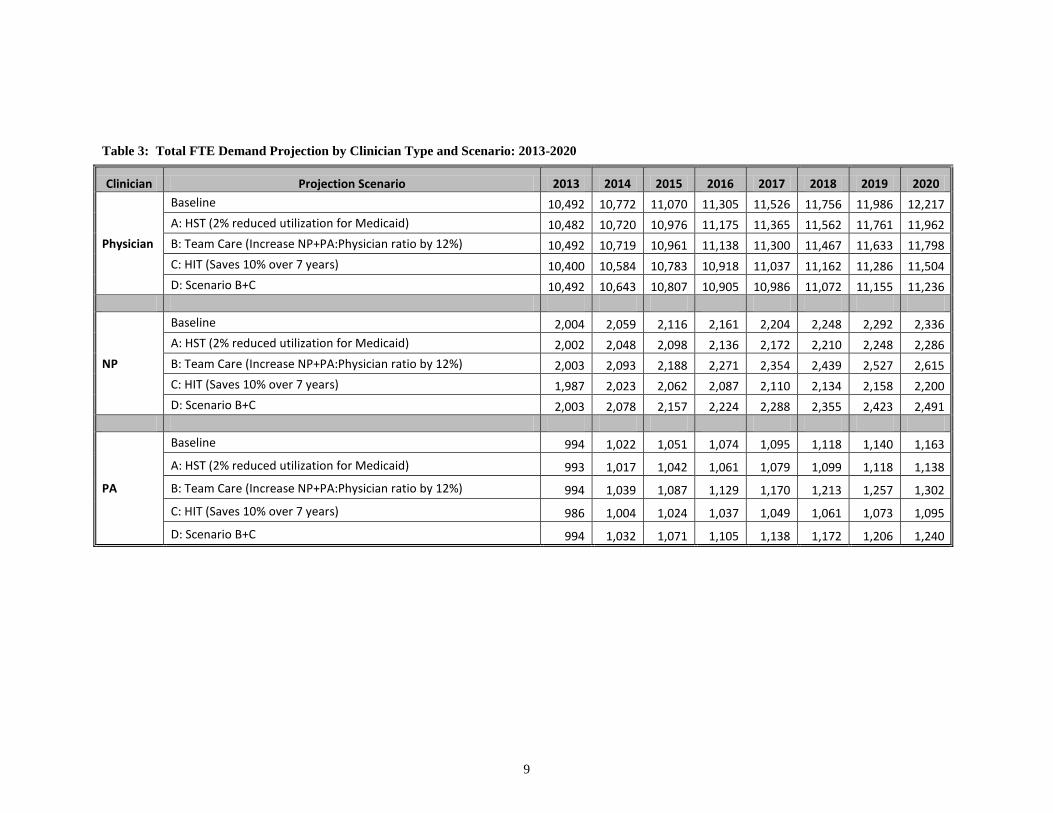
The Projected Demand for Oregon’s Clinicians by Scenario: 2013-2020
The impacts of alternative workforce scenarios are estimated by adjusting the baseline conditions
of the projection model. Again, these scenarios include (A) Oregon’s health system
transformation goal of reducing Medicaid growth by 2 percent, (B) team-based care, (C) full
implementation of health IT, and (D) a combination of team-based care and health IT. The
baseline and adjusted projections are presented by profession in Table 3.
9
Table 3: Total FTE Demand Projection by Clinician Type and Scenario: 2013-2020
Clinician Projection Scenario 2013 2014 2015 2016 2017 2018 2019 2020
Physician
Baseline 10,492 10,772 11,070 11,305 11,526 11,756 11,986 12,217
A: HST (2% reduced utilization for Medicaid) 10,482 10,720 10,976 11,175 11,365 11,562 11,761 11,962
B: Team Care (Increase NP+PA:Physician ratio by 12%) 10,492 10,719 10,961 11,138 11,300 11,467 11,633 11,798
C: HIT (Saves 10% over 7 years) 10,400 10,584 10,783 10,918 11,037 11,162 11,286 11,504
D: Scenario B+C 10,492 10,643 10,807 10,905 10,986 11,072 11,155 11,236
NP
Baseline 2,004 2,059 2,116 2,161 2,204 2,248 2,292 2,336
A: HST (2% reduced utilization for Medicaid) 2,002 2,048 2,098 2,136 2,172 2,210 2,248 2,286
B: Team Care (Increase NP+PA:Physician ratio by 12%) 2,003 2,093 2,188 2,271 2,354 2,439 2,527 2,615
C: HIT (Saves 10% over 7 years) 1,987 2,023 2,062 2,087 2,110 2,134 2,158 2,200
D: Scenario B+C 2,003 2,078 2,157 2,224 2,288 2,355 2,423 2,491
PA
Baseline 994 1,022 1,051 1,074 1,095 1,118 1,140 1,163
A: HST (2% reduced utilization for Medicaid) 993 1,017 1,042 1,061 1,079 1,099 1,118 1,138
B: Team Care (Increase NP+PA:Physician ratio by 12%) 994 1,039 1,087 1,129 1,170 1,213 1,257 1,302
C: HIT (Saves 10% over 7 years) 986 1,004 1,024 1,037 1,049 1,061 1,073 1,095
D: Scenario B+C 994 1,032 1,071 1,105 1,138 1,172 1,206 1,240
10
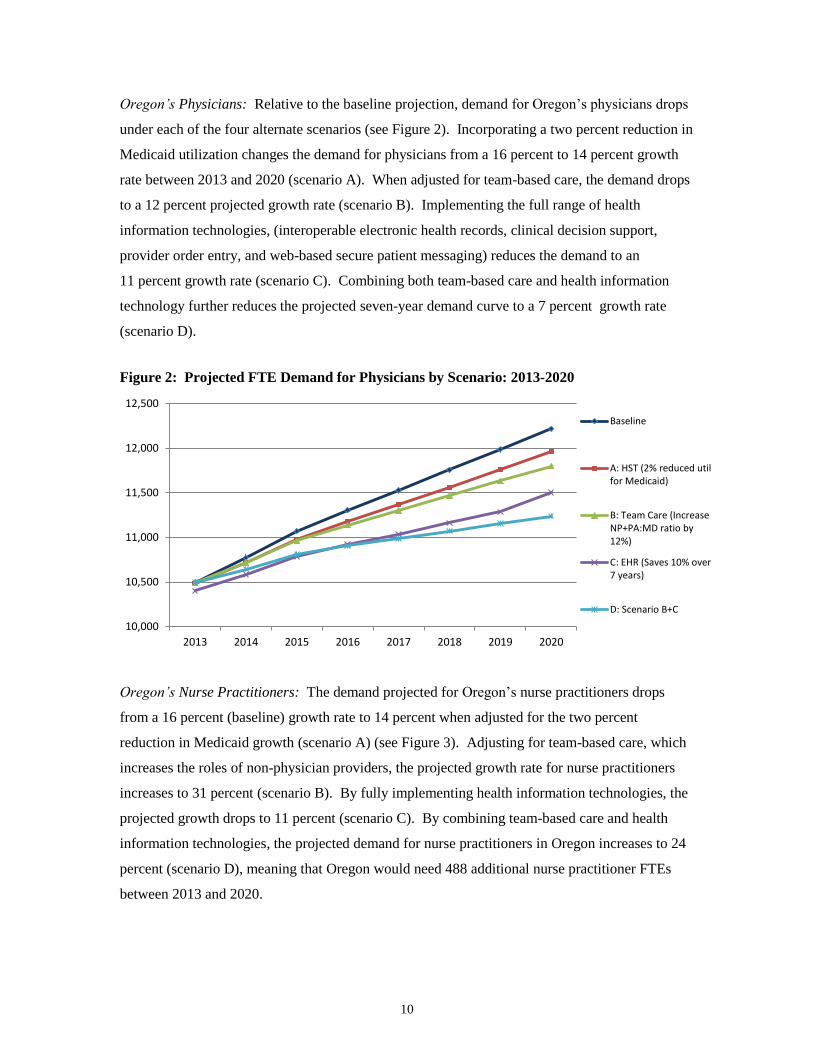
Oregon’s Physicians: Relative to the baseline projection, demand for Oregon’s physicians drops
under each of the four alternate scenarios (see Figure 2). Incorporating a two percent reduction in
Medicaid utilization changes the demand for physicians from a 16 percent to 14 percent growth
rate between 2013 and 2020 (scenario A). When adjusted for team-based care, the demand drops
to a 12 percent projected growth rate (scenario B). Implementing the full range of health
information technologies, (interoperable electronic health records, clinical decision support,
provider order entry, and web-based secure patient messaging) reduces the demand to an
11 percent growth rate (scenario C). Combining both team-based care and health information
technology further reduces the projected seven-year demand curve to a 7 percent growth rate
(scenario D).
Figure 2: Projected FTE Demand for Physicians by Scenario: 2013-2020
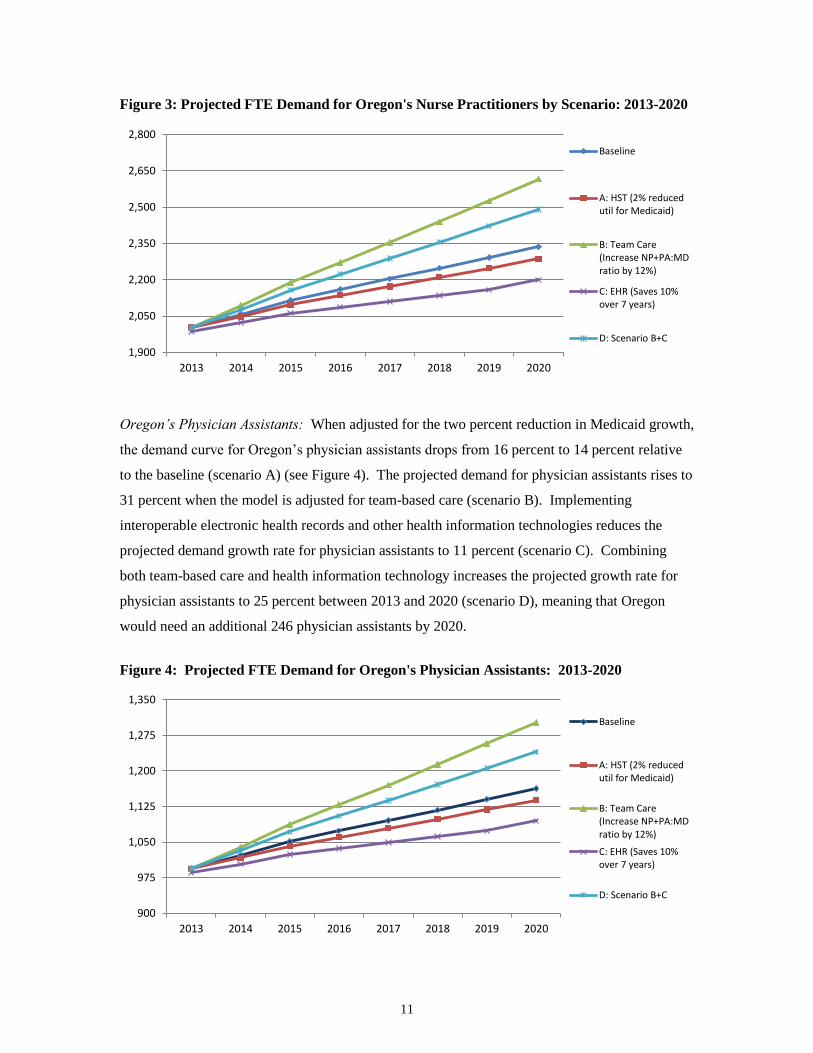
Oregon’s Nurse Practitioners: The demand projected for Oregon’s nurse practitioners drops
from a 16 percent (baseline) growth rate to 14 percent when adjusted for the two percent
reduction in Medicaid growth (scenario A) (see Figure 3). Adjusting for team-based care, which
increases the roles of non-physician providers, the projected growth rate for nurse practitioners
increases to 31 percent (scenario B). By fully implementing health information technologies, the
projected growth drops to 11 percent (scenario C). By combining team-based care and health
information technologies, the projected demand for nurse practitioners in Oregon increases to 24
percent (scenario D), meaning that Oregon would need 488 additional nurse practitioner FTEs
between 2013 and 2020.
10,000
10,500
11,000
11,500
12,000
12,500
2013 2014 2015 2016 2017 2018 2019 2020
Baseline
A: HST (2% reduced utilfor Medicaid)
B: Team Care (IncreaseNP+PA:MD ratio by12%)
C: EHR (Saves 10% over7 years)
D: Scenario B+C
11
Figure 3: Projected FTE Demand for Oregon's Nurse Practitioners by Scenario: 2013-2020
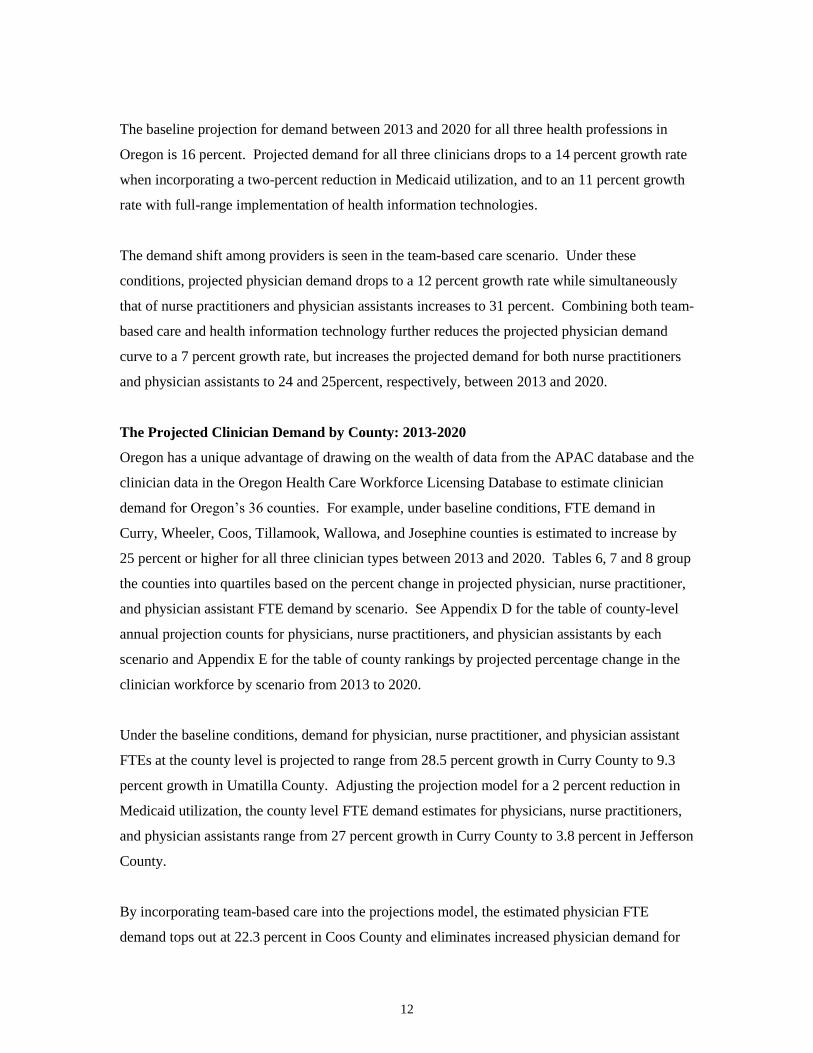
Oregon’s Physician Assistants: When adjusted for the two percent reduction in Medicaid growth,
the demand curve for Oregon’s physician assistants drops from 16 percent to 14 percent relative
to the baseline (scenario A) (see Figure 4). The projected demand for physician assistants rises to
31 percent when the model is adjusted for team-based care (scenario B). Implementing
interoperable electronic health records and other health information technologies reduces the
projected demand growth rate for physician assistants to 11 percent (scenario C). Combining
both team-based care and health information technology increases the projected growth rate for
physician assistants to 25 percent between 2013 and 2020 (scenario D), meaning that Oregon
would need an additional 246 physician assistants by 2020.
Figure 4: Projected FTE Demand for Oregon's Physician Assistants: 2013-2020
1,900
2,050
2,200
2,350
2,500
2,650
2,800
2013 2014 2015 2016 2017 2018 2019 2020
Baseline
A: HST (2% reducedutil for Medicaid)
B: Team Care(Increase NP+PA:MDratio by 12%)
C: EHR (Saves 10%over 7 years)
D: Scenario B+C
900
975
1,050
1,125
1,200
1,275
1,350
2013 2014 2015 2016 2017 2018 2019 2020
Baseline
A: HST (2% reducedutil for Medicaid)
B: Team Care(Increase NP+PA:MDratio by 12%)
C: EHR (Saves 10%over 7 years)
D: Scenario B+C
12
The baseline projection for demand between 2013 and 2020 for all three health professions in
Oregon is 16 percent. Projected demand for all three clinicians drops to a 14 percent growth rate
when incorporating a two-percent reduction in Medicaid utilization, and to an 11 percent growth
rate with full-range implementation of health information technologies.
The demand shift among providers is seen in the team-based care scenario. Under these
conditions, projected physician demand drops to a 12 percent growth rate while simultaneously
that of nurse practitioners and physician assistants increases to 31 percent. Combining both team-
based care and health information technology further reduces the projected physician demand
curve to a 7 percent growth rate, but increases the projected demand for both nurse practitioners
and physician assistants to 24 and 25percent, respectively, between 2013 and 2020.
The Projected Clinician Demand by County: 2013-2020
Oregon has a unique advantage of drawing on the wealth of data from the APAC database and the
clinician data in the Oregon Health Care Workforce Licensing Database to estimate clinician
demand for Oregon’s 36 counties. For example, under baseline conditions, FTE demand in
Curry, Wheeler, Coos, Tillamook, Wallowa, and Josephine counties is estimated to increase by
25 percent or higher for all three clinician types between 2013 and 2020. Tables 6, 7 and 8 group
the counties into quartiles based on the percent change in projected physician, nurse practitioner,
and physician assistant FTE demand by scenario. See Appendix D for the table of county-level
annual projection counts for physicians, nurse practitioners, and physician assistants by each
scenario and Appendix E for the table of county rankings by projected percentage change in the
clinician workforce by scenario from 2013 to 2020.
Under the baseline conditions, demand for physician, nurse practitioner, and physician assistant
FTEs at the county level is projected to range from 28.5 percent growth in Curry County to 9.3
percent growth in Umatilla County. Adjusting the projection model for a 2 percent reduction in
Medicaid utilization, the county level FTE demand estimates for physicians, nurse practitioners,
and physician assistants range from 27 percent growth in Curry County to 3.8 percent in Jefferson
County.
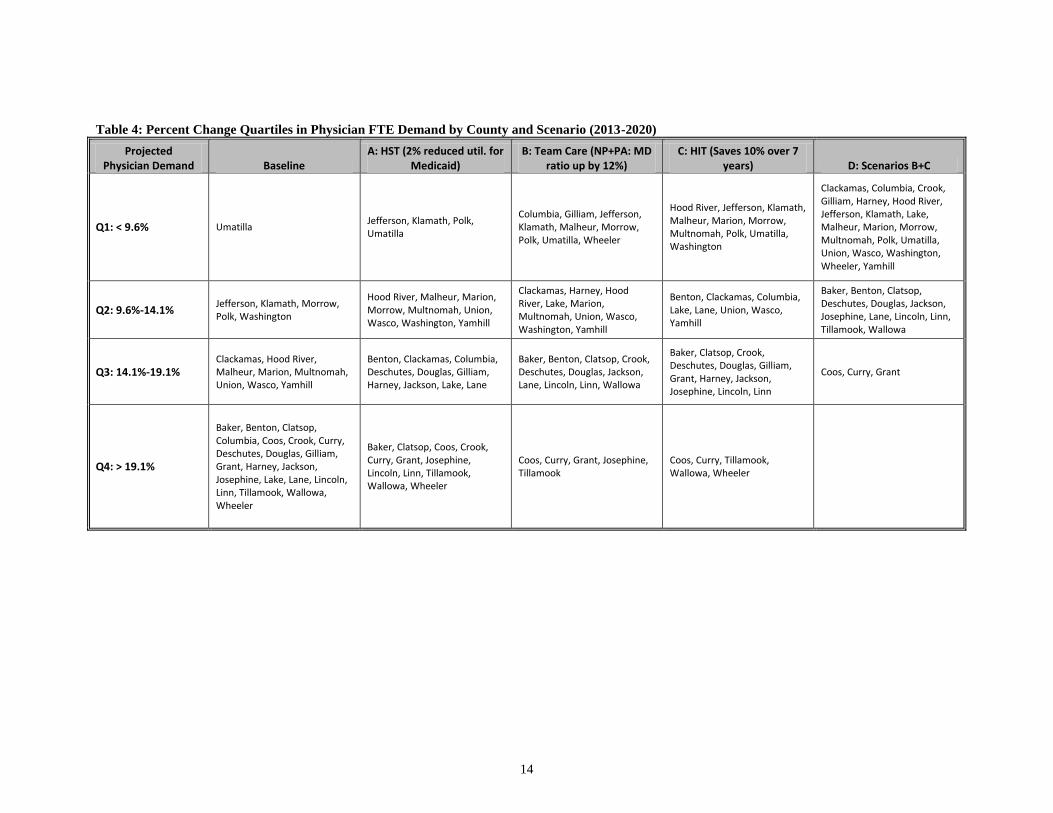
By incorporating team-based care into the projections model, the estimated physician FTE
demand tops out at 22.3 percent in Coos County and eliminates increased physician demand for
13
Morrow (-0.2%), Columbia (-2.6%), Wheeler (-14.4%), and Gilliam (-28.3%) counties. By fully
implementing health information technologies, the physician FTE demand ranges from 22.1
percent in Curry County to 3.8 percent in Umatilla County. Combining both team-based care and
health information technologies, the estimated physician FTE demand growth rate reaches 16.5%
percent in Coos County and eliminates physician demand in Umatilla (-1.1%), Jefferson (-2.0%),
Morrow (-5%), Columbia (-7.3%), Wheeler (-18.5%), and Gilliam (-31.7%) counties.
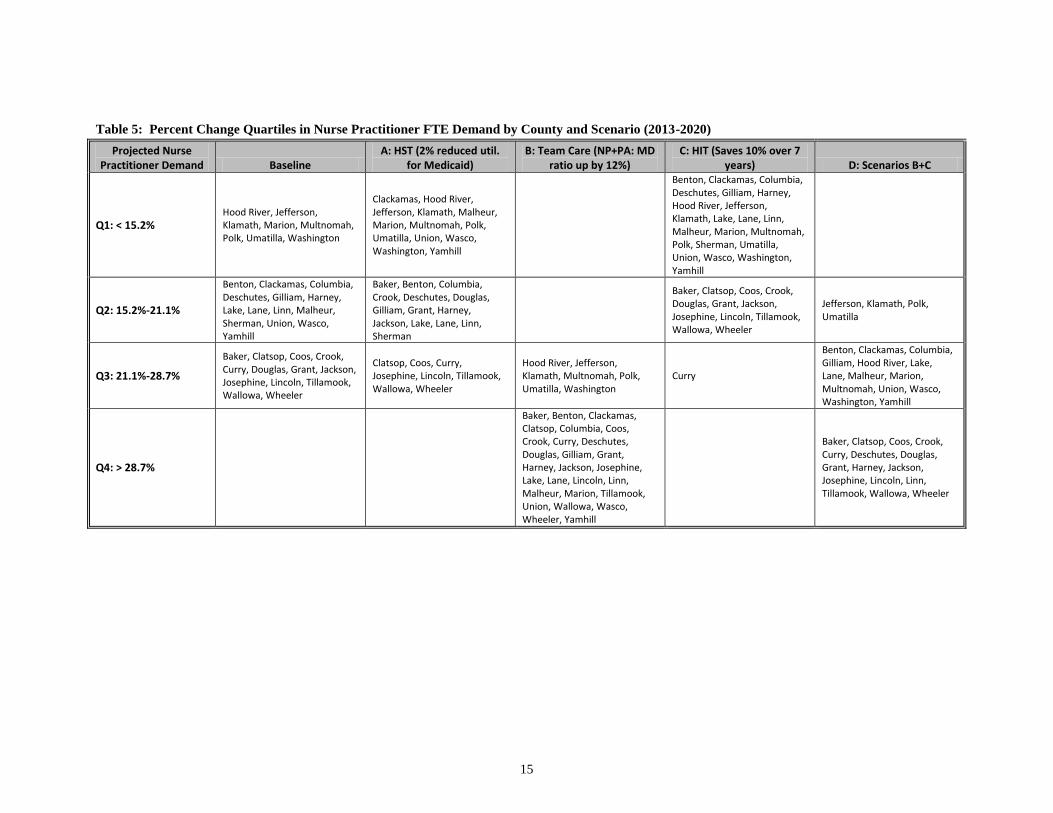
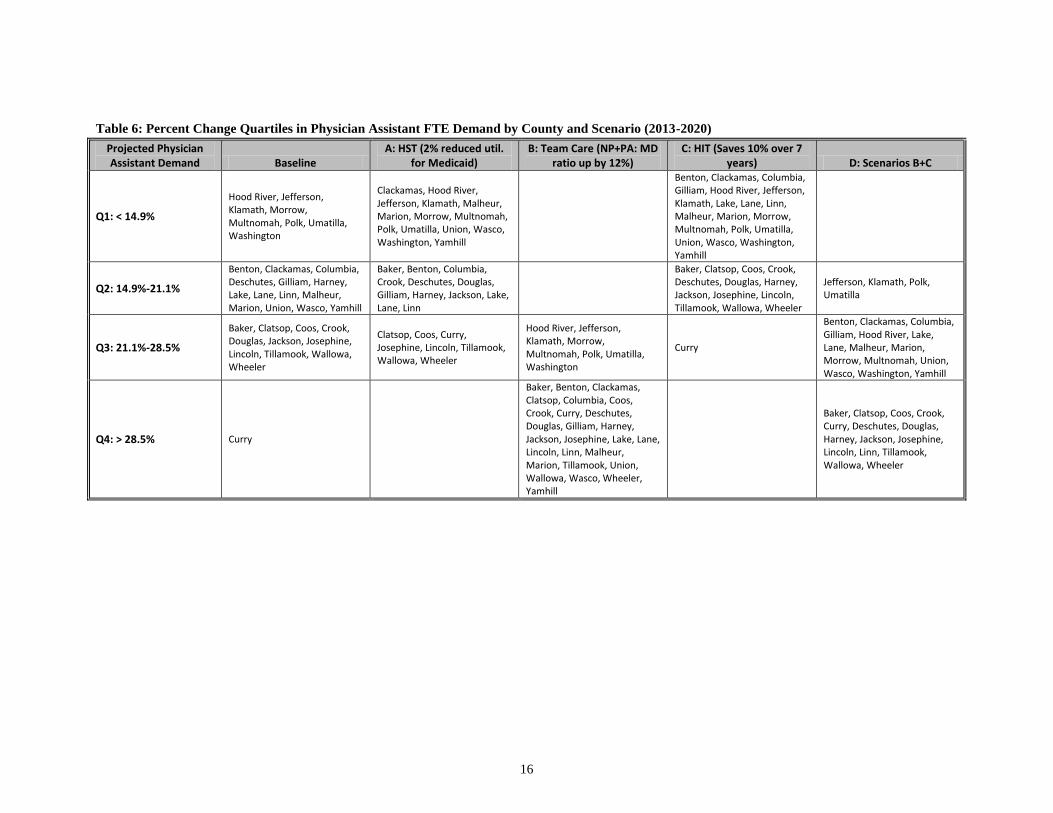
In shifting to team-based care, the estimated FTE demand for nurse practitioners and physician
assistants range from 43.9 percent in Curry County to 22.4 percent in Umatilla County. Under
full implementation of health information technologies, the nurse practitioner and physician
assistant FTE demand estimates vary from 22.1 percent in Curry County to 3.8 percent in
Umatilla County.
Combining both team-based care and health information technologies, the estimated FTE demand
for nurse practitioners and physician assistants range from a high of 37.0 percent in Curry County
to a low of 16.6 percent in Umatilla County.
14
Table 4: Percent Change Quartiles in Physician FTE Demand by County and Scenario (2013-2020)
Projected Physician Demand Baseline
A: HST (2% reduced util. for Medicaid)
B: Team Care (NP+PA: MD ratio up by 12%)
C: HIT (Saves 10% over 7 years) D: Scenarios B+C
Q1: < 9.6% Umatilla Jefferson, Klamath, Polk, Umatilla
Columbia, Gilliam, Jefferson, Klamath, Malheur, Morrow, Polk, Umatilla, Wheeler
Hood River, Jefferson, Klamath, Malheur, Marion, Morrow, Multnomah, Polk, Umatilla, Washington
Clackamas, Columbia, Crook, Gilliam, Harney, Hood River, Jefferson, Klamath, Lake, Malheur, Marion, Morrow, Multnomah, Polk, Umatilla, Union, Wasco, Washington, Wheeler, Yamhill
Q2: 9.6%-14.1% Jefferson, Klamath, Morrow, Polk, Washington
Hood River, Malheur, Marion, Morrow, Multnomah, Union, Wasco, Washington, Yamhill
Clackamas, Harney, Hood River, Lake, Marion, Multnomah, Union, Wasco, Washington, Yamhill
Benton, Clackamas, Columbia, Lake, Lane, Union, Wasco, Yamhill
Baker, Benton, Clatsop, Deschutes, Douglas, Jackson, Josephine, Lane, Lincoln, Linn, Tillamook, Wallowa
Q3: 14.1%-19.1% Clackamas, Hood River, Malheur, Marion, Multnomah, Union, Wasco, Yamhill
Benton, Clackamas, Columbia, Deschutes, Douglas, Gilliam, Harney, Jackson, Lake, Lane
Baker, Benton, Clatsop, Crook, Deschutes, Douglas, Jackson, Lane, Lincoln, Linn, Wallowa
Baker, Clatsop, Crook, Deschutes, Douglas, Gilliam, Grant, Harney, Jackson, Josephine, Lincoln, Linn
Coos, Curry, Grant
Q4: > 19.1%
Baker, Benton, Clatsop, Columbia, Coos, Crook, Curry, Deschutes, Douglas, Gilliam, Grant, Harney, Jackson, Josephine, Lake, Lane, Lincoln, Linn, Tillamook, Wallowa, Wheeler
Baker, Clatsop, Coos, Crook, Curry, Grant, Josephine, Lincoln, Linn, Tillamook, Wallowa, Wheeler
Coos, Curry, Grant, Josephine, Tillamook
Coos, Curry, Tillamook, Wallowa, Wheeler
15
Table 5: Percent Change Quartiles in Nurse Practitioner FTE Demand by County and Scenario (2013-2020)
Projected Nurse Practitioner Demand Baseline
A: HST (2% reduced util. for Medicaid)
B: Team Care (NP+PA: MD ratio up by 12%)
C: HIT (Saves 10% over 7 years) D: Scenarios B+C
Q1: < 15.2% Hood River, Jefferson, Klamath, Marion, Multnomah, Polk, Umatilla, Washington
Clackamas, Hood River, Jefferson, Klamath, Malheur, Marion, Multnomah, Polk, Umatilla, Union, Wasco, Washington, Yamhill
Benton, Clackamas, Columbia, Deschutes, Gilliam, Harney, Hood River, Jefferson, Klamath, Lake, Lane, Linn, Malheur, Marion, Multnomah, Polk, Sherman, Umatilla, Union, Wasco, Washington, Yamhill
Q2: 15.2%-21.1%
Benton, Clackamas, Columbia, Deschutes, Gilliam, Harney, Lake, Lane, Linn, Malheur, Sherman, Union, Wasco, Yamhill
Baker, Benton, Columbia, Crook, Deschutes, Douglas, Gilliam, Grant, Harney, Jackson, Lake, Lane, Linn, Sherman
Baker, Clatsop, Coos, Crook, Douglas, Grant, Jackson, Josephine, Lincoln, Tillamook, Wallowa, Wheeler
Jefferson, Klamath, Polk, Umatilla
Q3: 21.1%-28.7%
Baker, Clatsop, Coos, Crook, Curry, Douglas, Grant, Jackson, Josephine, Lincoln, Tillamook, Wallowa, Wheeler
Clatsop, Coos, Curry, Josephine, Lincoln, Tillamook, Wallowa, Wheeler
Hood River, Jefferson, Klamath, Multnomah, Polk, Umatilla, Washington
Curry
Benton, Clackamas, Columbia, Gilliam, Hood River, Lake, Lane, Malheur, Marion, Multnomah, Union, Wasco, Washington, Yamhill
Q4: > 28.7%
Baker, Benton, Clackamas, Clatsop, Columbia, Coos, Crook, Curry, Deschutes, Douglas, Gilliam, Grant, Harney, Jackson, Josephine, Lake, Lane, Lincoln, Linn, Malheur, Marion, Tillamook, Union, Wallowa, Wasco, Wheeler, Yamhill
Baker, Clatsop, Coos, Crook, Curry, Deschutes, Douglas, Grant, Harney, Jackson, Josephine, Lincoln, Linn, Tillamook, Wallowa, Wheeler
16
Table 6: Percent Change Quartiles in Physician Assistant FTE Demand by County and Scenario (2013-2020)
Projected Physician Assistant Demand Baseline
A: HST (2% reduced util. for Medicaid)
B: Team Care (NP+PA: MD ratio up by 12%)
C: HIT (Saves 10% over 7 years) D: Scenarios B+C
Q1: < 14.9%
Hood River, Jefferson, Klamath, Morrow, Multnomah, Polk, Umatilla, Washington
Clackamas, Hood River, Jefferson, Klamath, Malheur, Marion, Morrow, Multnomah, Polk, Umatilla, Union, Wasco, Washington, Yamhill
Benton, Clackamas, Columbia, Gilliam, Hood River, Jefferson, Klamath, Lake, Lane, Linn, Malheur, Marion, Morrow, Multnomah, Polk, Umatilla, Union, Wasco, Washington, Yamhill
Q2: 14.9%-21.1%
Benton, Clackamas, Columbia, Deschutes, Gilliam, Harney, Lake, Lane, Linn, Malheur, Marion, Union, Wasco, Yamhill
Baker, Benton, Columbia, Crook, Deschutes, Douglas, Gilliam, Harney, Jackson, Lake, Lane, Linn
Baker, Clatsop, Coos, Crook, Deschutes, Douglas, Harney, Jackson, Josephine, Lincoln, Tillamook, Wallowa, Wheeler
Jefferson, Klamath, Polk, Umatilla
Q3: 21.1%-28.5%
Baker, Clatsop, Coos, Crook, Douglas, Jackson, Josephine, Lincoln, Tillamook, Wallowa, Wheeler
Clatsop, Coos, Curry, Josephine, Lincoln, Tillamook, Wallowa, Wheeler
Hood River, Jefferson, Klamath, Morrow, Multnomah, Polk, Umatilla, Washington
Curry
Benton, Clackamas, Columbia, Gilliam, Hood River, Lake, Lane, Malheur, Marion, Morrow, Multnomah, Union, Wasco, Washington, Yamhill
Q4: > 28.5% Curry
Baker, Benton, Clackamas, Clatsop, Columbia, Coos, Crook, Curry, Deschutes, Douglas, Gilliam, Harney, Jackson, Josephine, Lake, Lane, Lincoln, Linn, Malheur, Marion, Tillamook, Union, Wallowa, Wasco, Wheeler, Yamhill
Baker, Clatsop, Coos, Crook, Curry, Deschutes, Douglas, Harney, Jackson, Josephine, Lincoln, Linn, Tillamook, Wallowa, Wheeler
17
Discussion
This study produces a range of demand projections for physicians, nurse practitioners, and
physician assistants specific to Oregon and its 36 counties. Additionally, adjustments to the
projection model provide valuable information on how potential changes in care delivery,
practices, or policies may affect health care utilization and provider demand.
The findings demonstrate that projected clinician demand varies widely under different, plausible
scenarios. This range of estimates may be especially relevant in Oregon, given the variety and
scope of health system transformation activities already underway. The expansion of team-based
care, where the handling of less complex cases is shifted to nurse practitioners and physician
assistants, has the potential to decrease the demand for physicians in Oregon significantly while
increasing the demand for non-physician providers. This is an important consideration given that
between 2010 and 2012, Oregon’s physician workforce decreased by 3 percent (313) while the
number of nurse practitioners increased by 11 percent (218) and the number of physician
assistants increased by 6 percent (54). 15
Additionally, the full implementation of interoperable electronic health records and other health
information technology may produce practice efficiencies that allow clinicians to maintain a
higher case load than could otherwise be achieved without electronic communication.
These projections highlight the intricate and critical links between provider access, workforce
capacity, health profession education, payment structures, and delivery system design, all
important components in meeting the goals of the Triple Aim. For example, the number of
clinicians and practices choosing to implement team-based care and health information
technologies is likely to depend on changes in the payment model that encourage increased
access, better patient outcomes, and innovation.
Because of the timeline, the number and nature of analytic factors, and the inclusion of all
physicians, nurse practitioners, and physician assistants working in Oregon (as opposed to only
primary care clinicians), the findings from this study do not easily lend themselves to comparison
with recent national studies (summarized in Appendix A) that project demand as a result of health
care reform. Still it does appear that in general, Oregon is in a better position when compared to
national projections.
18
Caveats and Limitations of the Study
Projecting the demand for the health care workforce is a complex methodological process that is
unable to take into account all factors, such as developments in medical knowledge and social
forces.16,17
For example, data from the 2012 Workforce Licensing Database, used to generate
baseline conditions, tell us how many health care providers are practicing in Oregon but do not
address whether an area has adequate supply for its population.
The projected clinician demand represents new FTEs and does not include the additional
clinicians needed in Oregon to replace those who, during this time period, will be lost to attrition
or outflow (e.g. retirement, reduction in practice hours, relocation out-of-state). This is important
to note as 14.6 percent of Oregon’s physicians, nurse practitioners, and physician assistants are 65
years of age or older and another 27.3 percent are between 55 and 64 years of age.18
Furthermore, the model does not incorporate information on settings where current clinicians
practice (private clinics, safety-net sites, etc.) or the extent to which they accept different payer
sources (commercial, Medicaid, Medicare). In 2012, approximately 85% of Oregon’s physicians
reported that they accepted new Medicaid clients with no limitations or some restrictions.19
This study also relies on current health care utilization to predict future use. Thus, if unforeseen
technological advances enable clinicians to deliver more care in the same amount of time, these
projections will overstate demand. Similarly, both the baseline and alternative scenario
projections rely on static estimates of utilization-per-person and utilization-per-provider. If
population health declines over time in ways not captured by aging, these projections will
underestimate utilization per person. (If population health improves, the opposite will be true.)
Additionally, a critical driver of near-future demand will come from the provision of health
insurance to the previously uninsured. We have assumed—based on Oregon experience—that this
population currently uses 76% of the care it would receive if covered by Medicaid. If this figure
is closer to 100% then much more moderate growth is needed. However, if the population of
newly-insured Oregonians requires more services than suggested by the Oregon Health Study,
demand for providers will be greater than estimates here indicate.
Another limitation of these projections is that we are not able to disaggregate provider type
(physician, nurse practitioner, physician assistant) by practice specialty (primary vs. non-primary
care). While we are able observe the number of clinicians and their practice type in an area by
19
their license data, we are not able to link this information to the utilization data. As a result, we
are unable to generate accurate estimates of the amount of utilization provided by clinician and
practice type. Furthermore, the utilization data suggest that providers do not always fall into one
practice type of care, as measured by the billed claims. For example, between 36-40 percent of
clinicians would be categorized as primary care providers based on the practice specialties they
report in the licensing database. In comparison, in the APAC data 71.3 percent% of claims are
paid to clinicians whose taxonomies identify them as providing primary care services. This
conceptual ambiguity leads to empirical difficulties when trying to match services and providers
by specialty, resulting in more generalized projections.
Policy Implications
There are several policy implications that result from this study. First and foremost, these
projections underscore the need for Oregon to engage proactive measures to address potential
inadequacies in the supply, recruitment and retention of clinicians.
Importantly, some steps have already been taken. For example, the Oregon Health Policy
Board’s statutorily-created Health Care Workforce Committee was created in 2009 to coordinate
efforts in Oregon to educate, recruit and retain health care professionals in order “to meet the
demand created by the expansion in health care coverage, system transformation and an
increasingly diverse population.” This work includes the Committee’s development of a
statewide strategic plan to recruit primary care providers.20
Additionally, the $4 million
Medicaid Primary Care Provider Loan Repayment Program, a component of Oregon’s 2012
waiver from the Centers for Medicaid and Medicare Services, provides debt relief to primary care
providers who commit to serving Medicaid beneficiaries in underserved areas and can be used as
an incentive to recruit new or out-of-state clinicians.iv This new initiative joins a handful of other
federal and state programs designed to increase the primary care workforce in Oregon.v
iv More information about the Oregon Health Care Workforce Committee, the Medicaid Primary Care Provider Loan
Repayment Program, and other health workforce-related efforts is available at
http://www.oregon.gov/OHA/OHPR/HPB/Pages/workforce/HealhCareWorkforceCommittee.aspx
v Information relating to ongoing federal and state health care workforce recruitment and retention incentive programs
can be found at http://www.oregon.gov/oha/OHPR/PCO/Pages/index.aspx and
http://www.ohsu.edu/xd/outreach/oregon-rural-health/index.cfm

20
Technical assistance and expertise for practice redesign and strategic planning is a valuable
resource for clinicians who have little time to research the steps of transition into team-based care
models. The Oregon Health Authority’s Transformation Center and the Patient-Centered Primary
Care Institute, a public-private partnership, provide technical support and learning opportunities
for clinics and health systems engaging in transformation. Moreover, resources to assist with
purchasing and maintenance of interoperable electronic health records, clinical decision support
tools, provider order entry, and secure patient messaging systems may be necessary, especially
for small or rural practices. Federal incentive payments for meaningful use for HIT are helping
with technology adoption, and Oregon is developing concrete plans to support health information
exchange across the state.21
These projections, specifically at county-level, are designed to inform adjustments to workforce
capacity. They may also help policy makers and administrators direct finite resources—both
public and private—for clinician education and workforce development. They may also help
target recruitment and retention efforts to areas of greatest need.
The use of Oregon’s APAC database in conjunction with the Oregon Health Care Workforce
Licensing Database creates a unique opportunity for Oregon in projecting clinician demand
specific to the state and county levels. Monitoring the balance of health service utilization and
provider supply through the APAC and health professions’ licensing database is extremely
valuable in informing and evaluating policy responses in unchartered territory.

21
APPENDICES
22
Appendix A:
Summary of Recent Studies Projecting Primary Care Clinician
Demand as a Result of Health Care Reform
Several recent studies have estimated the demand for different individual and combined elements
of health care services.22,23,24
For example, one recent study from the American Medical
Association assessed that the national primary care physician workforce would need to increase
by 24 percent to meet projected health care utilization demand in 2025.25
Sixty-three percent of
the estimated increase was due to the growth and aging of the population and 15 percent was due
to insurance coverage expansion in 2014-2015.
Recently, the Robert Graham Center released a report on primary care physician workforce
(defined as those specializing in family medicine, internal medicine, general practice, and
geriatrics) projections to 2030 for all 50 states.26
Using national data, and taking into account the
newly insured population resulting from the ACA as well as the growing and aging population,
the Center projected that Oregon would need a 38% increase in the primary care physician
workforce by 2030 in order to maintain current utilization rates.27
Looking more broadly at primary care clinicians, a study by the University of Chicago projected
that between 2010 and 2014, a 2.5 percent increase (or 7,200) overall in the number of primary
care physicians, physician assistants and nurse practitioners would be needed to meet the demand
for increased health care services as a result of coverage expansion in the ACA.28
Nationally, the
geographic variation in projected increase in primary care provider demand ranged from 0.7
percent to 5 percent across states and from zero to 76 percent in primary care service areas.
Other recent studies submit that workforce shortages may be eased by integrating care teams into
redesigned delivery structures and greater use of health information technologies (health IT). For
example, one study estimated that up to 24 percent of a clinician’s time in providing preventive,
chronic and acute care to adult patients can be saved by reallocating work to other licensed and
non-licensed staff, such as registered nurses, pharmacists, and medical assistants.29,30,31
A recent study at Johns Hopkins University suggested that the full implementation of health IT
(including interoperable electronic health records, clinical decision support, provider order entry,
and web-based secure patient messaging), could reduce future national physician demand by four
percent to 19 percent, depending on the level of health IT penetration.32
The authors further
estimated an additional seven percent demand reduction by integrating both health IT and the
delegation of care from physicians to nurse practitioners and physician assistants.
A 2013 Columbia University study focused on the need for primary care physicians into 2025,
but incorporated into their projection model the supply of non-physician providers, shared
practice settings and electronic health records.33
The authors concluded that by pooling patients
among two to three physicians and diverting as little as 20 percent of demand to non-physician
providers and/or using electronic health records, most if not all of the projected primary care
shortage could be eliminated.
23
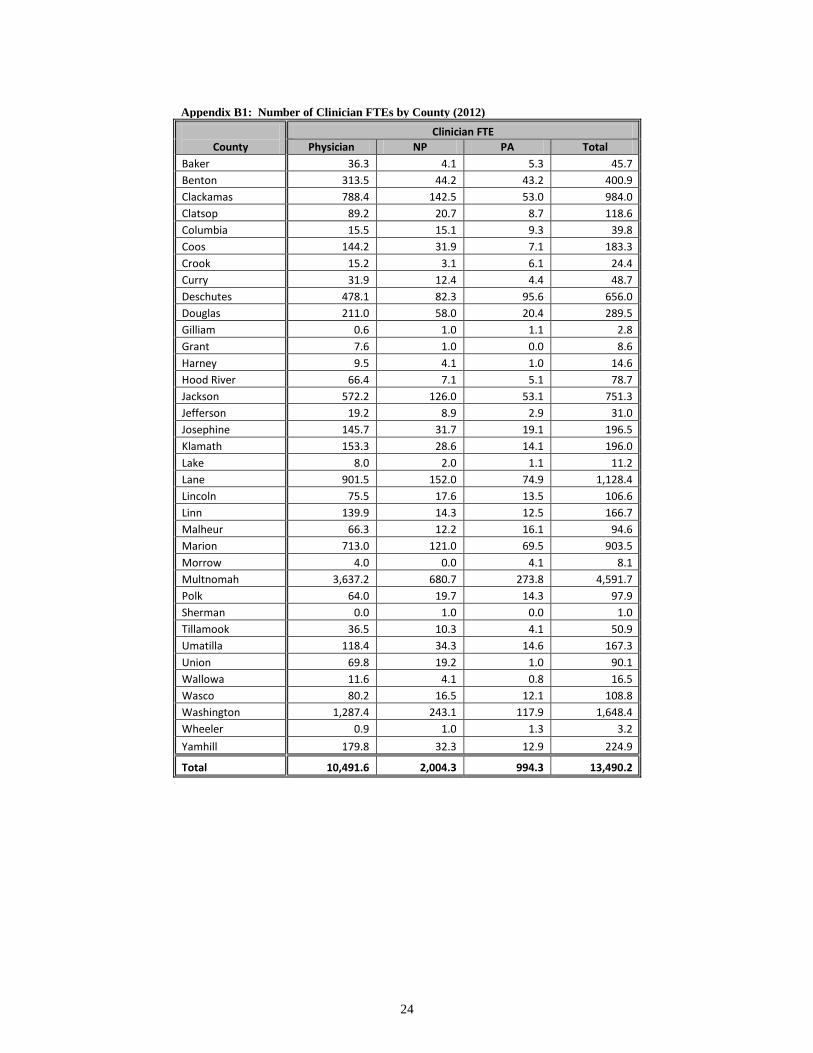
Appendix B: Number of Clinician FTEs by County
The projection model identifies by county the (2012) population to clinician FTE ratio and the
patient flow adjusted ratio, which captures both the location of the resident and the clinician (see
Table 1). The adjusted patient flow-to-clinician ratios for Benton, Deschutes, Jackson, Lane,
Marion, Multnomah, Wasco and Washington counties, home to regional health centers, reflect
referral and commute patterns of patients from other counties. For example, the number of
patients who obtained care in Multnomah County in 2012 is 56 percent greater than the number
of residents in the county.
Determining clinician demand for Oregon’s border counties represents a unique challenge as the
APAC utilization data does not capture those patients who reside outside of Oregon but obtain
health services within Oregon. For example, the ratios for Clackamas County are not able to
count those Kaiser Permanente patients who reside in Southwest Washington but obtain hospital
care at Kaiser Sunnyside Medical Center in Clackamas, Oregon.
24
Appendix B1: Number of Clinician FTEs by County (2012)
County
Clinician FTE
Physician NP PA Total
Baker 36.3 4.1 5.3 45.7
Benton 313.5 44.2 43.2 400.9
Clackamas 788.4 142.5 53.0 984.0
Clatsop 89.2 20.7 8.7 118.6
Columbia 15.5 15.1 9.3 39.8
Coos 144.2 31.9 7.1 183.3
Crook 15.2 3.1 6.1 24.4
Curry 31.9 12.4 4.4 48.7
Deschutes 478.1 82.3 95.6 656.0
Douglas 211.0 58.0 20.4 289.5
Gilliam 0.6 1.0 1.1 2.8
Grant 7.6 1.0 0.0 8.6
Harney 9.5 4.1 1.0 14.6
Hood River 66.4 7.1 5.1 78.7
Jackson 572.2 126.0 53.1 751.3
Jefferson 19.2 8.9 2.9 31.0
Josephine 145.7 31.7 19.1 196.5
Klamath 153.3 28.6 14.1 196.0
Lake 8.0 2.0 1.1 11.2
Lane 901.5 152.0 74.9 1,128.4
Lincoln 75.5 17.6 13.5 106.6
Linn 139.9 14.3 12.5 166.7
Malheur 66.3 12.2 16.1 94.6
Marion 713.0 121.0 69.5 903.5
Morrow 4.0 0.0 4.1 8.1
Multnomah 3,637.2 680.7 273.8 4,591.7
Polk 64.0 19.7 14.3 97.9
Sherman 0.0 1.0 0.0 1.0
Tillamook 36.5 10.3 4.1 50.9
Umatilla 118.4 34.3 14.6 167.3
Union 69.8 19.2 1.0 90.1
Wallowa 11.6 4.1 0.8 16.5
Wasco 80.2 16.5 12.1 108.8
Washington 1,287.4 243.1 117.9 1,648.4
Wheeler 0.9 1.0 1.3 3.2
Yamhill 179.8 32.3 12.9 224.9
Total 10,491.6 2,004.3 994.3 13,490.2
25
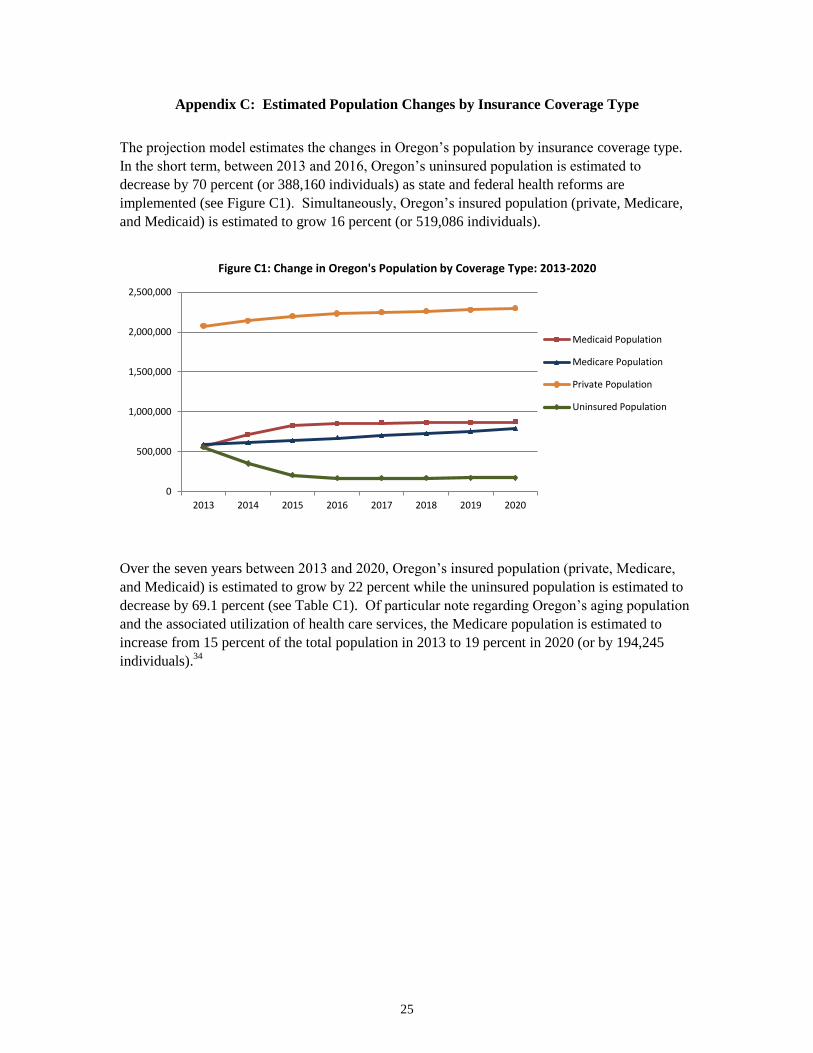
Appendix C: Estimated Population Changes by Insurance Coverage Type
The projection model estimates the changes in Oregon’s population by insurance coverage type.
In the short term, between 2013 and 2016, Oregon’s uninsured population is estimated to
decrease by 70 percent (or 388,160 individuals) as state and federal health reforms are
implemented (see Figure C1). Simultaneously, Oregon’s insured population (private, Medicare,
and Medicaid) is estimated to grow 16 percent (or 519,086 individuals).
Over the seven years between 2013 and 2020, Oregon’s insured population (private, Medicare,
and Medicaid) is estimated to grow by 22 percent while the uninsured population is estimated to
decrease by 69.1 percent (see Table C1). Of particular note regarding Oregon’s aging population
and the associated utilization of health care services, the Medicare population is estimated to
increase from 15 percent of the total population in 2013 to 19 percent in 2020 (or by 194,245
individuals).34
0
500,000
1,000,000
1,500,000
2,000,000
2,500,000
2013 2014 2015 2016 2017 2018 2019 2020
Figure C1: Change in Oregon's Population by Coverage Type: 2013-2020
Medicaid Population
Medicare Population
Private Population
Uninsured Population
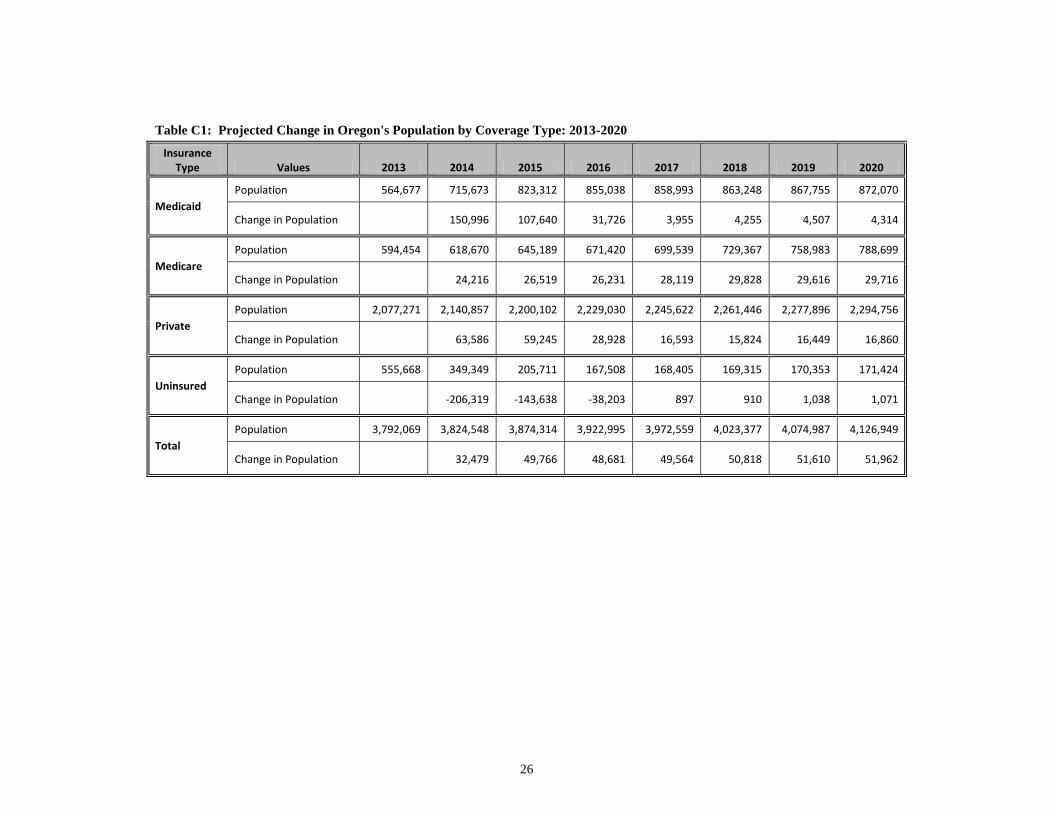
26
Table C1: Projected Change in Oregon's Population by Coverage Type: 2013-2020
Insurance Type Values 2013 2014 2015 2016 2017 2018 2019 2020
Medicaid
Population 564,677 715,673 823,312 855,038 858,993 863,248 867,755 872,070
Change in Population 150,996 107,640 31,726 3,955 4,255 4,507 4,314
Medicare
Population 594,454 618,670 645,189 671,420 699,539 729,367 758,983 788,699
Change in Population 24,216 26,519 26,231 28,119 29,828 29,616 29,716
Private
Population 2,077,271 2,140,857 2,200,102 2,229,030 2,245,622 2,261,446 2,277,896 2,294,756
Change in Population 63,586 59,245 28,928 16,593 15,824 16,449 16,860
Uninsured
Population 555,668 349,349 205,711 167,508 168,405 169,315 170,353 171,424
Change in Population -206,319 -143,638 -38,203 897 910 1,038 1,071
Total
Population 3,792,069 3,824,548 3,874,314 3,922,995 3,972,559 4,023,377 4,074,987 4,126,949
Change in Population 32,479 49,766 48,681 49,564 50,818 51,610 51,962
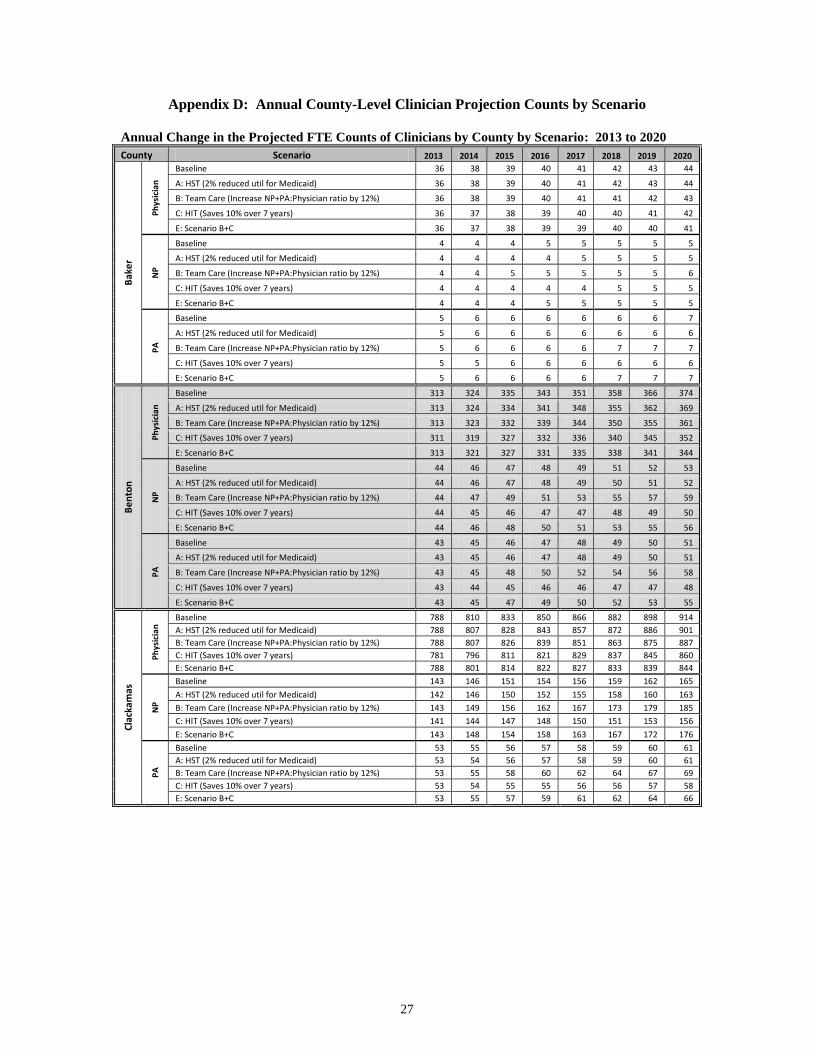
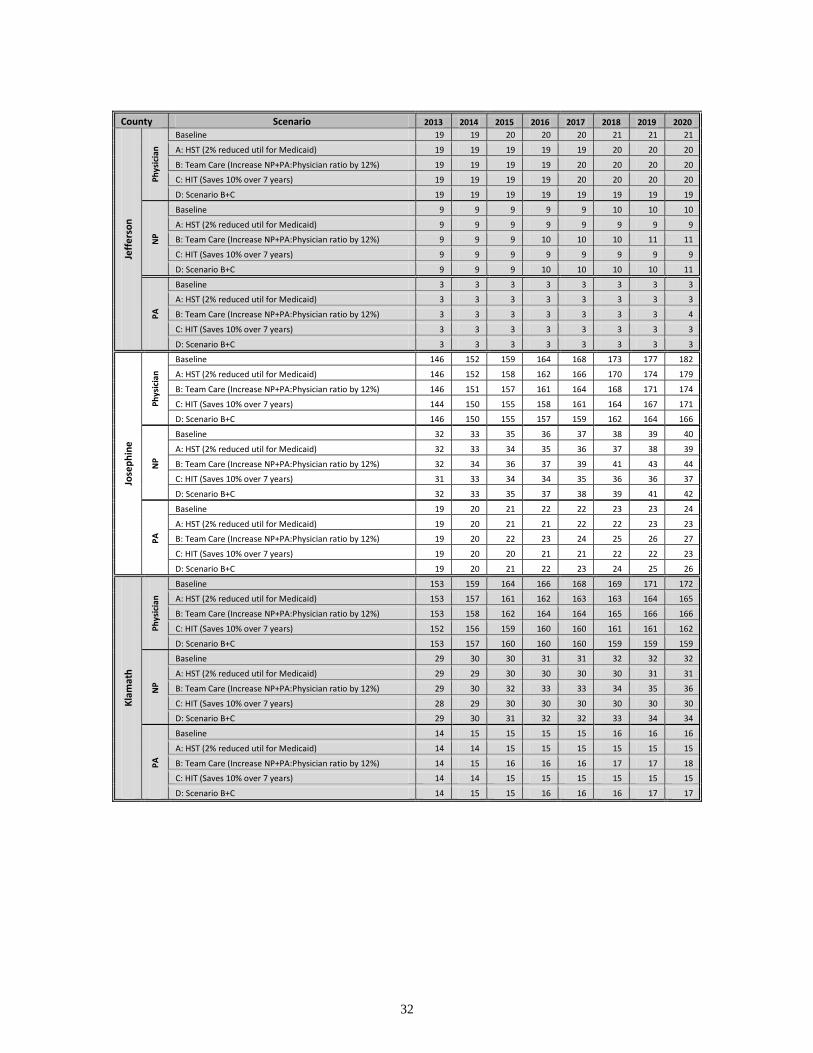
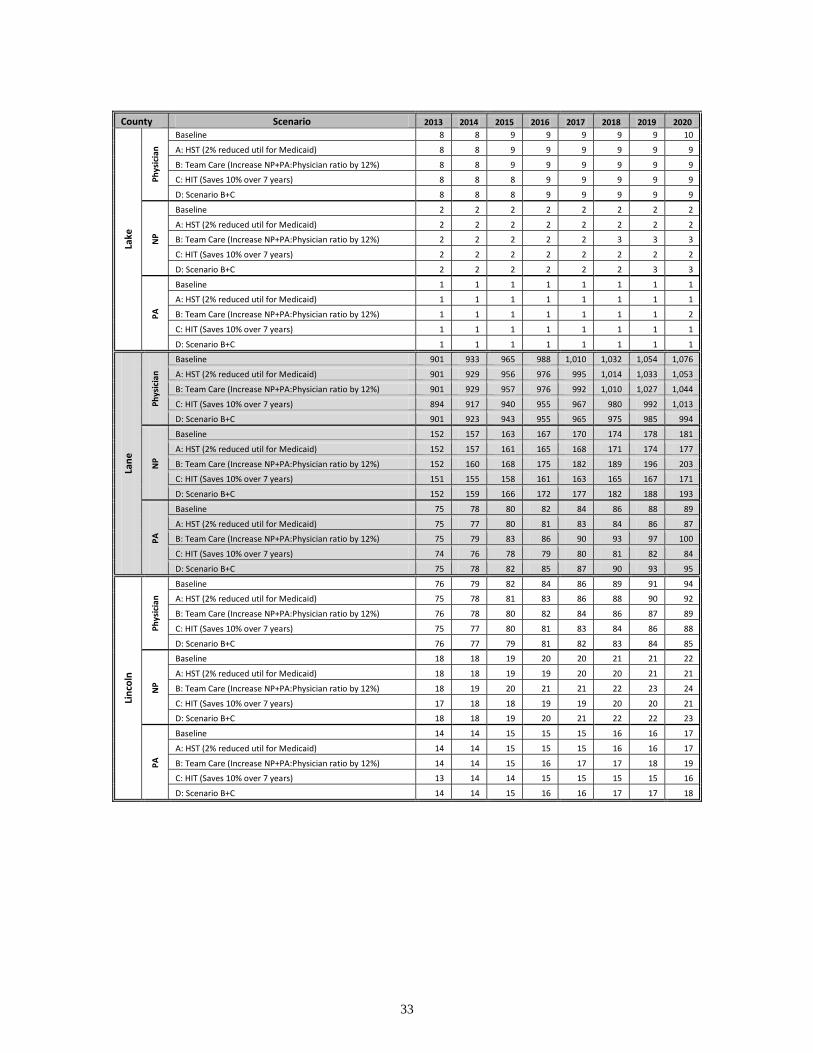
27
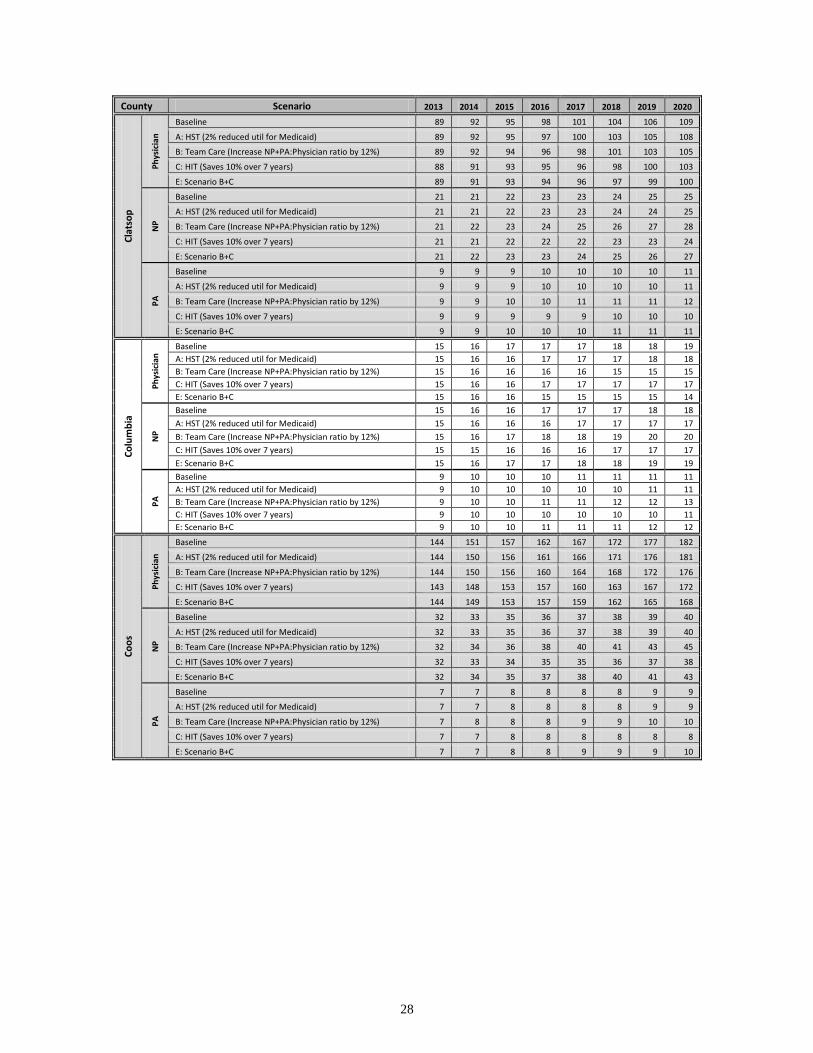
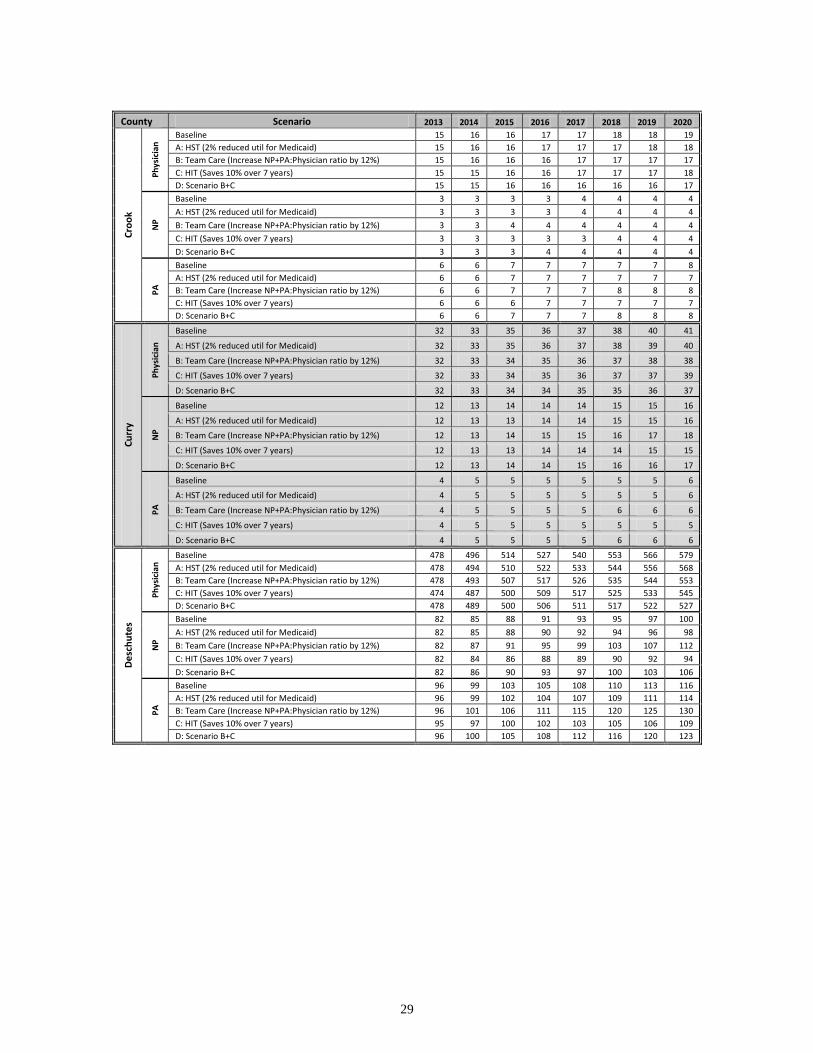
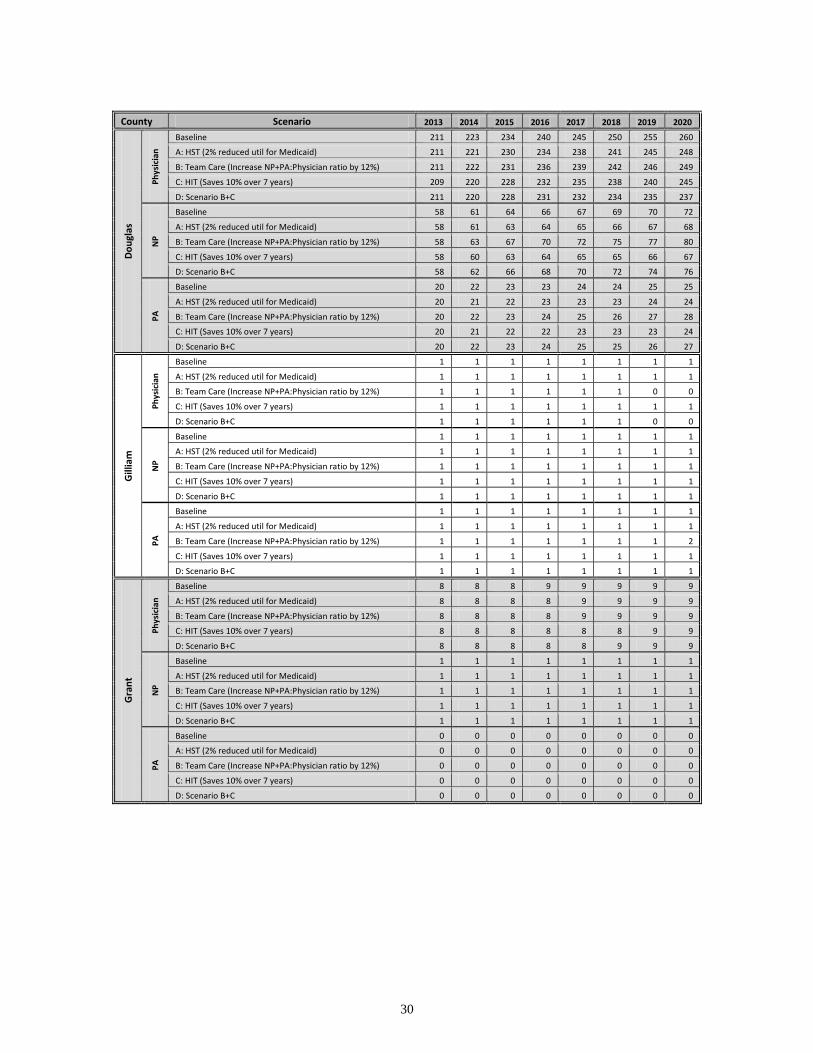
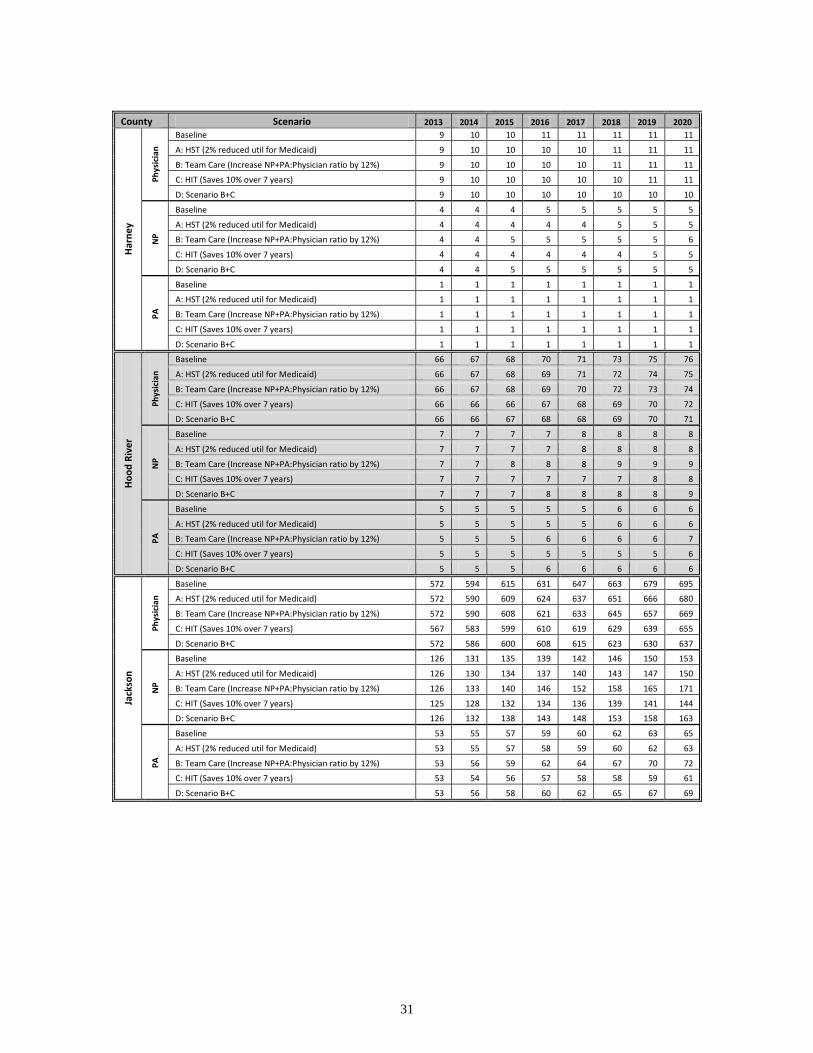
Appendix D: Annual County-Level Clinician Projection Counts by Scenario
Annual Change in the Projected FTE Counts of Clinicians by County by Scenario: 2013 to 2020
County Scenario 2013 2014 2015 2016 2017 2018 2019 2020
Bak
er
Ph
ysic
ian
Baseline 36 38 39 40 41 42 43 44
A: HST (2% reduced util for Medicaid) 36 38 39 40 41 42 43 44
B: Team Care (Increase NP+PA:Physician ratio by 12%) 36 38 39 40 41 41 42 43
C: HIT (Saves 10% over 7 years) 36 37 38 39 40 40 41 42
E: Scenario B+C 36 37 38 39 39 40 40 41
NP
Baseline 4 4 4 5 5 5 5 5
A: HST (2% reduced util for Medicaid) 4 4 4 4 5 5 5 5
B: Team Care (Increase NP+PA:Physician ratio by 12%) 4 4 5 5 5 5 5 6
C: HIT (Saves 10% over 7 years) 4 4 4 4 4 5 5 5
E: Scenario B+C 4 4 4 5 5 5 5 5
PA
Baseline 5 6 6 6 6 6 6 7
A: HST (2% reduced util for Medicaid) 5 6 6 6 6 6 6 6
B: Team Care (Increase NP+PA:Physician ratio by 12%) 5 6 6 6 6 7 7 7
C: HIT (Saves 10% over 7 years) 5 5 6 6 6 6 6 6
E: Scenario B+C 5 6 6 6 6 7 7 7
Be
nto
n
Ph
ysic
ian
Baseline 313 324 335 343 351 358 366 374
A: HST (2% reduced util for Medicaid) 313 324 334 341 348 355 362 369
B: Team Care (Increase NP+PA:Physician ratio by 12%) 313 323 332 339 344 350 355 361
C: HIT (Saves 10% over 7 years) 311 319 327 332 336 340 345 352
E: Scenario B+C 313 321 327 331 335 338 341 344
NP
Baseline 44 46 47 48 49 51 52 53
A: HST (2% reduced util for Medicaid) 44 46 47 48 49 50 51 52
B: Team Care (Increase NP+PA:Physician ratio by 12%) 44 47 49 51 53 55 57 59
C: HIT (Saves 10% over 7 years) 44 45 46 47 47 48 49 50
E: Scenario B+C 44 46 48 50 51 53 55 56
PA
Baseline 43 45 46 47 48 49 50 51
A: HST (2% reduced util for Medicaid) 43 45 46 47 48 49 50 51
B: Team Care (Increase NP+PA:Physician ratio by 12%) 43 45 48 50 52 54 56 58
C: HIT (Saves 10% over 7 years) 43 44 45 46 46 47 47 48
E: Scenario B+C 43 45 47 49 50 52 53 55
Cla
ckam
as
Ph
ysic
ian
Baseline 788 810 833 850 866 882 898 914
A: HST (2% reduced util for Medicaid) 788 807 828 843 857 872 886 901
B: Team Care (Increase NP+PA:Physician ratio by 12%) 788 807 826 839 851 863 875 887
C: HIT (Saves 10% over 7 years) 781 796 811 821 829 837 845 860
E: Scenario B+C 788 801 814 822 827 833 839 844
NP
Baseline 143 146 151 154 156 159 162 165
A: HST (2% reduced util for Medicaid) 142 146 150 152 155 158 160 163
B: Team Care (Increase NP+PA:Physician ratio by 12%) 143 149 156 162 167 173 179 185
C: HIT (Saves 10% over 7 years) 141 144 147 148 150 151 153 156
E: Scenario B+C 143 148 154 158 163 167 172 176
PA
Baseline 53 55 56 57 58 59 60 61
A: HST (2% reduced util for Medicaid) 53 54 56 57 58 59 60 61
B: Team Care (Increase NP+PA:Physician ratio by 12%) 53 55 58 60 62 64 67 69
C: HIT (Saves 10% over 7 years) 53 54 55 55 56 56 57 58
E: Scenario B+C 53 55 57 59 61 62 64 66
28
County Scenario 2013 2014 2015 2016 2017 2018 2019 2020
Cla
tso
p
Ph
ysic
ian
Baseline 89 92 95 98 101 104 106 109
A: HST (2% reduced util for Medicaid) 89 92 95 97 100 103 105 108
B: Team Care (Increase NP+PA:Physician ratio by 12%) 89 92 94 96 98 101 103 105
C: HIT (Saves 10% over 7 years) 88 91 93 95 96 98 100 103
E: Scenario B+C 89 91 93 94 96 97 99 100
NP
Baseline 21 21 22 23 23 24 25 25
A: HST (2% reduced util for Medicaid) 21 21 22 23 23 24 24 25
B: Team Care (Increase NP+PA:Physician ratio by 12%) 21 22 23 24 25 26 27 28
C: HIT (Saves 10% over 7 years) 21 21 22 22 22 23 23 24
E: Scenario B+C 21 22 23 23 24 25 26 27
PA
Baseline 9 9 9 10 10 10 10 11
A: HST (2% reduced util for Medicaid) 9 9 9 10 10 10 10 11
B: Team Care (Increase NP+PA:Physician ratio by 12%) 9 9 10 10 11 11 11 12
C: HIT (Saves 10% over 7 years) 9 9 9 9 9 10 10 10
E: Scenario B+C 9 9 10 10 10 11 11 11
Co
lum
bia
Ph
ysic
ian
Baseline 15 16 17 17 17 18 18 19
A: HST (2% reduced util for Medicaid) 15 16 16 17 17 17 18 18
B: Team Care (Increase NP+PA:Physician ratio by 12%) 15 16 16 16 16 15 15 15
C: HIT (Saves 10% over 7 years) 15 16 16 17 17 17 17 17
E: Scenario B+C 15 16 16 15 15 15 15 14
NP
Baseline 15 16 16 17 17 17 18 18
A: HST (2% reduced util for Medicaid) 15 16 16 16 17 17 17 17
B: Team Care (Increase NP+PA:Physician ratio by 12%) 15 16 17 18 18 19 20 20
C: HIT (Saves 10% over 7 years) 15 15 16 16 16 17 17 17
E: Scenario B+C 15 16 17 17 18 18 19 19
PA
Baseline 9 10 10 10 11 11 11 11
A: HST (2% reduced util for Medicaid) 9 10 10 10 10 10 11 11
B: Team Care (Increase NP+PA:Physician ratio by 12%) 9 10 10 11 11 12 12 13
C: HIT (Saves 10% over 7 years) 9 10 10 10 10 10 10 11
E: Scenario B+C 9 10 10 11 11 11 12 12
Co
os
Ph
ysic
ian
Baseline 144 151 157 162 167 172 177 182
A: HST (2% reduced util for Medicaid) 144 150 156 161 166 171 176 181
B: Team Care (Increase NP+PA:Physician ratio by 12%) 144 150 156 160 164 168 172 176
C: HIT (Saves 10% over 7 years) 143 148 153 157 160 163 167 172
E: Scenario B+C 144 149 153 157 159 162 165 168
NP
Baseline 32 33 35 36 37 38 39 40
A: HST (2% reduced util for Medicaid) 32 33 35 36 37 38 39 40
B: Team Care (Increase NP+PA:Physician ratio by 12%) 32 34 36 38 40 41 43 45
C: HIT (Saves 10% over 7 years) 32 33 34 35 35 36 37 38
E: Scenario B+C 32 34 35 37 38 40 41 43
PA
Baseline 7 7 8 8 8 8 9 9
A: HST (2% reduced util for Medicaid) 7 7 8 8 8 8 9 9
B: Team Care (Increase NP+PA:Physician ratio by 12%) 7 8 8 8 9 9 10 10
C: HIT (Saves 10% over 7 years) 7 7 8 8 8 8 8 8
E: Scenario B+C 7 7 8 8 9 9 9 10
29
County Scenario 2013 2014 2015 2016 2017 2018 2019 2020 C
roo
k
Ph
ysic
ian
Baseline 15 16 16 17 17 18 18 19
A: HST (2% reduced util for Medicaid) 15 16 16 17 17 17 18 18
B: Team Care (Increase NP+PA:Physician ratio by 12%) 15 16 16 16 17 17 17 17
C: HIT (Saves 10% over 7 years) 15 15 16 16 17 17 17 18
D: Scenario B+C 15 15 16 16 16 16 16 17
NP
Baseline 3 3 3 3 4 4 4 4
A: HST (2% reduced util for Medicaid) 3 3 3 3 4 4 4 4
B: Team Care (Increase NP+PA:Physician ratio by 12%) 3 3 4 4 4 4 4 4
C: HIT (Saves 10% over 7 years) 3 3 3 3 3 4 4 4
D: Scenario B+C 3 3 3 4 4 4 4 4
PA
Baseline 6 6 7 7 7 7 7 8
A: HST (2% reduced util for Medicaid) 6 6 7 7 7 7 7 7
B: Team Care (Increase NP+PA:Physician ratio by 12%) 6 6 7 7 7 8 8 8
C: HIT (Saves 10% over 7 years) 6 6 6 7 7 7 7 7
D: Scenario B+C 6 6 7 7 7 8 8 8
Cu
rry
Ph
ysic
ian
Baseline 32 33 35 36 37 38 40 41
A: HST (2% reduced util for Medicaid) 32 33 35 36 37 38 39 40
B: Team Care (Increase NP+PA:Physician ratio by 12%) 32 33 34 35 36 37 38 38
C: HIT (Saves 10% over 7 years) 32 33 34 35 36 37 37 39
D: Scenario B+C 32 33 34 34 35 35 36 37
NP
Baseline 12 13 14 14 14 15 15 16
A: HST (2% reduced util for Medicaid) 12 13 13 14 14 15 15 16
B: Team Care (Increase NP+PA:Physician ratio by 12%) 12 13 14 15 15 16 17 18
C: HIT (Saves 10% over 7 years) 12 13 13 14 14 14 15 15
D: Scenario B+C 12 13 14 14 15 16 16 17
PA
Baseline 4 5 5 5 5 5 5 6
A: HST (2% reduced util for Medicaid) 4 5 5 5 5 5 5 6
B: Team Care (Increase NP+PA:Physician ratio by 12%) 4 5 5 5 5 6 6 6
C: HIT (Saves 10% over 7 years) 4 5 5 5 5 5 5 5
D: Scenario B+C 4 5 5 5 5 6 6 6
De
sch
ute
s
Ph
ysic
ian
Baseline 478 496 514 527 540 553 566 579
A: HST (2% reduced util for Medicaid) 478 494 510 522 533 544 556 568
B: Team Care (Increase NP+PA:Physician ratio by 12%) 478 493 507 517 526 535 544 553
C: HIT (Saves 10% over 7 years) 474 487 500 509 517 525 533 545
D: Scenario B+C 478 489 500 506 511 517 522 527
NP
Baseline 82 85 88 91 93 95 97 100
A: HST (2% reduced util for Medicaid) 82 85 88 90 92 94 96 98
B: Team Care (Increase NP+PA:Physician ratio by 12%) 82 87 91 95 99 103 107 112
C: HIT (Saves 10% over 7 years) 82 84 86 88 89 90 92 94
D: Scenario B+C 82 86 90 93 97 100 103 106
PA
Baseline 96 99 103 105 108 110 113 116
A: HST (2% reduced util for Medicaid) 96 99 102 104 107 109 111 114
B: Team Care (Increase NP+PA:Physician ratio by 12%) 96 101 106 111 115 120 125 130
C: HIT (Saves 10% over 7 years) 95 97 100 102 103 105 106 109
D: Scenario B+C 96 100 105 108 112 116 120 123
30
County Scenario 2013 2014 2015 2016 2017 2018 2019 2020 D
ou
glas
Ph
ysic
ian
Baseline 211 223 234 240 245 250 255 260
A: HST (2% reduced util for Medicaid) 211 221 230 234 238 241 245 248
B: Team Care (Increase NP+PA:Physician ratio by 12%) 211 222 231 236 239 242 246 249
C: HIT (Saves 10% over 7 years) 209 220 228 232 235 238 240 245
D: Scenario B+C 211 220 228 231 232 234 235 237
NP
Baseline 58 61 64 66 67 69 70 72
A: HST (2% reduced util for Medicaid) 58 61 63 64 65 66 67 68
B: Team Care (Increase NP+PA:Physician ratio by 12%) 58 63 67 70 72 75 77 80
C: HIT (Saves 10% over 7 years) 58 60 63 64 65 65 66 67
D: Scenario B+C 58 62 66 68 70 72 74 76
PA
Baseline 20 22 23 23 24 24 25 25
A: HST (2% reduced util for Medicaid) 20 21 22 23 23 23 24 24
B: Team Care (Increase NP+PA:Physician ratio by 12%) 20 22 23 24 25 26 27 28
C: HIT (Saves 10% over 7 years) 20 21 22 22 23 23 23 24
D: Scenario B+C 20 22 23 24 25 25 26 27
Gill
iam
Ph
ysic
ian
Baseline 1 1 1 1 1 1 1 1
A: HST (2% reduced util for Medicaid) 1 1 1 1 1 1 1 1
B: Team Care (Increase NP+PA:Physician ratio by 12%) 1 1 1 1 1 1 0 0
C: HIT (Saves 10% over 7 years) 1 1 1 1 1 1 1 1
D: Scenario B+C 1 1 1 1 1 1 0 0
NP
Baseline 1 1 1 1 1 1 1 1
A: HST (2% reduced util for Medicaid) 1 1 1 1 1 1 1 1
B: Team Care (Increase NP+PA:Physician ratio by 12%) 1 1 1 1 1 1 1 1
C: HIT (Saves 10% over 7 years) 1 1 1 1 1 1 1 1
D: Scenario B+C 1 1 1 1 1 1 1 1
PA
Baseline 1 1 1 1 1 1 1 1
A: HST (2% reduced util for Medicaid) 1 1 1 1 1 1 1 1
B: Team Care (Increase NP+PA:Physician ratio by 12%) 1 1 1 1 1 1 1 2
C: HIT (Saves 10% over 7 years) 1 1 1 1 1 1 1 1
D: Scenario B+C 1 1 1 1 1 1 1 1
Gra
nt
Ph
ysic
ian
Baseline 8 8 8 9 9 9 9 9
A: HST (2% reduced util for Medicaid) 8 8 8 8 9 9 9 9
B: Team Care (Increase NP+PA:Physician ratio by 12%) 8 8 8 8 9 9 9 9
C: HIT (Saves 10% over 7 years) 8 8 8 8 8 8 9 9
D: Scenario B+C 8 8 8 8 8 9 9 9
NP
Baseline 1 1 1 1 1 1 1 1
A: HST (2% reduced util for Medicaid) 1 1 1 1 1 1 1 1
B: Team Care (Increase NP+PA:Physician ratio by 12%) 1 1 1 1 1 1 1 1
C: HIT (Saves 10% over 7 years) 1 1 1 1 1 1 1 1
D: Scenario B+C 1 1 1 1 1 1 1 1
PA
Baseline 0 0 0 0 0 0 0 0
A: HST (2% reduced util for Medicaid) 0 0 0 0 0 0 0 0
B: Team Care (Increase NP+PA:Physician ratio by 12%) 0 0 0 0 0 0 0 0
C: HIT (Saves 10% over 7 years) 0 0 0 0 0 0 0 0
D: Scenario B+C 0 0 0 0 0 0 0 0
31
County Scenario 2013 2014 2015 2016 2017 2018 2019 2020 H
arn
ey
Ph
ysic
ian
Baseline 9 10 10 11 11 11 11 11
A: HST (2% reduced util for Medicaid) 9 10 10 10 10 11 11 11
B: Team Care (Increase NP+PA:Physician ratio by 12%) 9 10 10 10 10 11 11 11
C: HIT (Saves 10% over 7 years) 9 10 10 10 10 10 11 11
D: Scenario B+C 9 10 10 10 10 10 10 10
NP
Baseline 4 4 4 5 5 5 5 5
A: HST (2% reduced util for Medicaid) 4 4 4 4 4 5 5 5
B: Team Care (Increase NP+PA:Physician ratio by 12%) 4 4 5 5 5 5 5 6
C: HIT (Saves 10% over 7 years) 4 4 4 4 4 4 5 5
D: Scenario B+C 4 4 5 5 5 5 5 5
PA
Baseline 1 1 1 1 1 1 1 1
A: HST (2% reduced util for Medicaid) 1 1 1 1 1 1 1 1
B: Team Care (Increase NP+PA:Physician ratio by 12%) 1 1 1 1 1 1 1 1
C: HIT (Saves 10% over 7 years) 1 1 1 1 1 1 1 1
D: Scenario B+C 1 1 1 1 1 1 1 1
Ho
od
Riv
er
Ph
ysic
ian
Baseline 66 67 68 70 71 73 75 76
A: HST (2% reduced util for Medicaid) 66 67 68 69 71 72 74 75
B: Team Care (Increase NP+PA:Physician ratio by 12%) 66 67 68 69 70 72 73 74
C: HIT (Saves 10% over 7 years) 66 66 66 67 68 69 70 72
D: Scenario B+C 66 66 67 68 68 69 70 71
NP
Baseline 7 7 7 7 8 8 8 8
A: HST (2% reduced util for Medicaid) 7 7 7 7 8 8 8 8
B: Team Care (Increase NP+PA:Physician ratio by 12%) 7 7 8 8 8 9 9 9
C: HIT (Saves 10% over 7 years) 7 7 7 7 7 7 8 8
D: Scenario B+C 7 7 7 8 8 8 8 9
PA
Baseline 5 5 5 5 5 6 6 6
A: HST (2% reduced util for Medicaid) 5 5 5 5 5 6 6 6
B: Team Care (Increase NP+PA:Physician ratio by 12%) 5 5 5 6 6 6 6 7
C: HIT (Saves 10% over 7 years) 5 5 5 5 5 5 5 6
D: Scenario B+C 5 5 5 6 6 6 6 6
Jack
son
Ph
ysic
ian
Baseline 572 594 615 631 647 663 679 695
A: HST (2% reduced util for Medicaid) 572 590 609 624 637 651 666 680
B: Team Care (Increase NP+PA:Physician ratio by 12%) 572 590 608 621 633 645 657 669
C: HIT (Saves 10% over 7 years) 567 583 599 610 619 629 639 655
D: Scenario B+C 572 586 600 608 615 623 630 637
NP
Baseline 126 131 135 139 142 146 150 153
A: HST (2% reduced util for Medicaid) 126 130 134 137 140 143 147 150
B: Team Care (Increase NP+PA:Physician ratio by 12%) 126 133 140 146 152 158 165 171
C: HIT (Saves 10% over 7 years) 125 128 132 134 136 139 141 144
D: Scenario B+C 126 132 138 143 148 153 158 163
PA
Baseline 53 55 57 59 60 62 63 65
A: HST (2% reduced util for Medicaid) 53 55 57 58 59 60 62 63
B: Team Care (Increase NP+PA:Physician ratio by 12%) 53 56 59 62 64 67 70 72
C: HIT (Saves 10% over 7 years) 53 54 56 57 58 58 59 61
D: Scenario B+C 53 56 58 60 62 65 67 69
32
County Scenario 2013 2014 2015 2016 2017 2018 2019 2020 Je
ffe
rso
n
Ph
ysic
ian
Baseline 19 19 20 20 20 21 21 21
A: HST (2% reduced util for Medicaid) 19 19 19 19 19 20 20 20
B: Team Care (Increase NP+PA:Physician ratio by 12%) 19 19 19 19 20 20 20 20
C: HIT (Saves 10% over 7 years) 19 19 19 19 20 20 20 20
D: Scenario B+C 19 19 19 19 19 19 19 19
NP
Baseline 9 9 9 9 9 10 10 10
A: HST (2% reduced util for Medicaid) 9 9 9 9 9 9 9 9
B: Team Care (Increase NP+PA:Physician ratio by 12%) 9 9 9 10 10 10 11 11
C: HIT (Saves 10% over 7 years) 9 9 9 9 9 9 9 9
D: Scenario B+C 9 9 9 10 10 10 10 11
PA
Baseline 3 3 3 3 3 3 3 3
A: HST (2% reduced util for Medicaid) 3 3 3 3 3 3 3 3
B: Team Care (Increase NP+PA:Physician ratio by 12%) 3 3 3 3 3 3 3 4
C: HIT (Saves 10% over 7 years) 3 3 3 3 3 3 3 3
D: Scenario B+C 3 3 3 3 3 3 3 3
Jose
ph
ine
Ph
ysic
ian
Baseline 146 152 159 164 168 173 177 182
A: HST (2% reduced util for Medicaid) 146 152 158 162 166 170 174 179
B: Team Care (Increase NP+PA:Physician ratio by 12%) 146 151 157 161 164 168 171 174
C: HIT (Saves 10% over 7 years) 144 150 155 158 161 164 167 171
D: Scenario B+C 146 150 155 157 159 162 164 166
NP
Baseline 32 33 35 36 37 38 39 40
A: HST (2% reduced util for Medicaid) 32 33 34 35 36 37 38 39
B: Team Care (Increase NP+PA:Physician ratio by 12%) 32 34 36 37 39 41 43 44
C: HIT (Saves 10% over 7 years) 31 33 34 34 35 36 36 37
D: Scenario B+C 32 33 35 37 38 39 41 42
PA
Baseline 19 20 21 22 22 23 23 24
A: HST (2% reduced util for Medicaid) 19 20 21 21 22 22 23 23
B: Team Care (Increase NP+PA:Physician ratio by 12%) 19 20 22 23 24 25 26 27
C: HIT (Saves 10% over 7 years) 19 20 20 21 21 22 22 23
D: Scenario B+C 19 20 21 22 23 24 25 26
Kla
mat
h
Ph
ysic
ian
Baseline 153 159 164 166 168 169 171 172
A: HST (2% reduced util for Medicaid) 153 157 161 162 163 163 164 165
B: Team Care (Increase NP+PA:Physician ratio by 12%) 153 158 162 164 164 165 166 166
C: HIT (Saves 10% over 7 years) 152 156 159 160 160 161 161 162
D: Scenario B+C 153 157 160 160 160 159 159 159
NP
Baseline 29 30 30 31 31 32 32 32
A: HST (2% reduced util for Medicaid) 29 29 30 30 30 30 31 31
B: Team Care (Increase NP+PA:Physician ratio by 12%) 29 30 32 33 33 34 35 36
C: HIT (Saves 10% over 7 years) 28 29 30 30 30 30 30 30
D: Scenario B+C 29 30 31 32 32 33 34 34
PA
Baseline 14 15 15 15 15 16 16 16
A: HST (2% reduced util for Medicaid) 14 14 15 15 15 15 15 15
B: Team Care (Increase NP+PA:Physician ratio by 12%) 14 15 16 16 16 17 17 18
C: HIT (Saves 10% over 7 years) 14 14 15 15 15 15 15 15
D: Scenario B+C 14 15 15 16 16 16 17 17
33
County Scenario 2013 2014 2015 2016 2017 2018 2019 2020 La
ke
Ph
ysic
ian
Baseline 8 8 9 9 9 9 9 10
A: HST (2% reduced util for Medicaid) 8 8 9 9 9 9 9 9
B: Team Care (Increase NP+PA:Physician ratio by 12%) 8 8 9 9 9 9 9 9
C: HIT (Saves 10% over 7 years) 8 8 8 9 9 9 9 9
D: Scenario B+C 8 8 8 9 9 9 9 9
NP
Baseline 2 2 2 2 2 2 2 2
A: HST (2% reduced util for Medicaid) 2 2 2 2 2 2 2 2
B: Team Care (Increase NP+PA:Physician ratio by 12%) 2 2 2 2 2 3 3 3
C: HIT (Saves 10% over 7 years) 2 2 2 2 2 2 2 2
D: Scenario B+C 2 2 2 2 2 2 3 3
PA
Baseline 1 1 1 1 1 1 1 1
A: HST (2% reduced util for Medicaid) 1 1 1 1 1 1 1 1
B: Team Care (Increase NP+PA:Physician ratio by 12%) 1 1 1 1 1 1 1 2
C: HIT (Saves 10% over 7 years) 1 1 1 1 1 1 1 1
D: Scenario B+C 1 1 1 1 1 1 1 1
Lan
e
Ph
ysic
ian
Baseline 901 933 965 988 1,010 1,032 1,054 1,076
A: HST (2% reduced util for Medicaid) 901 929 956 976 995 1,014 1,033 1,053
B: Team Care (Increase NP+PA:Physician ratio by 12%) 901 929 957 976 992 1,010 1,027 1,044
C: HIT (Saves 10% over 7 years) 894 917 940 955 967 980 992 1,013
D: Scenario B+C 901 923 943 955 965 975 985 994
NP
Baseline 152 157 163 167 170 174 178 181
A: HST (2% reduced util for Medicaid) 152 157 161 165 168 171 174 177
B: Team Care (Increase NP+PA:Physician ratio by 12%) 152 160 168 175 182 189 196 203
C: HIT (Saves 10% over 7 years) 151 155 158 161 163 165 167 171
D: Scenario B+C 152 159 166 172 177 182 188 193
PA
Baseline 75 78 80 82 84 86 88 89
A: HST (2% reduced util for Medicaid) 75 77 80 81 83 84 86 87
B: Team Care (Increase NP+PA:Physician ratio by 12%) 75 79 83 86 90 93 97 100
C: HIT (Saves 10% over 7 years) 74 76 78 79 80 81 82 84
D: Scenario B+C 75 78 82 85 87 90 93 95
Lin
coln
Ph
ysic
ian
Baseline 76 79 82 84 86 89 91 94
A: HST (2% reduced util for Medicaid) 75 78 81 83 86 88 90 92
B: Team Care (Increase NP+PA:Physician ratio by 12%) 76 78 80 82 84 86 87 89
C: HIT (Saves 10% over 7 years) 75 77 80 81 83 84 86 88
D: Scenario B+C 76 77 79 81 82 83 84 85
NP
Baseline 18 18 19 20 20 21 21 22
A: HST (2% reduced util for Medicaid) 18 18 19 19 20 20 21 21
B: Team Care (Increase NP+PA:Physician ratio by 12%) 18 19 20 21 21 22 23 24
C: HIT (Saves 10% over 7 years) 17 18 18 19 19 20 20 21
D: Scenario B+C 18 18 19 20 21 22 22 23
PA
Baseline 14 14 15 15 15 16 16 17
A: HST (2% reduced util for Medicaid) 14 14 15 15 15 16 16 17
B: Team Care (Increase NP+PA:Physician ratio by 12%) 14 14 15 16 17 17 18 19
C: HIT (Saves 10% over 7 years) 13 14 14 15 15 15 15 16
D: Scenario B+C 14 14 15 16 16 17 17 18
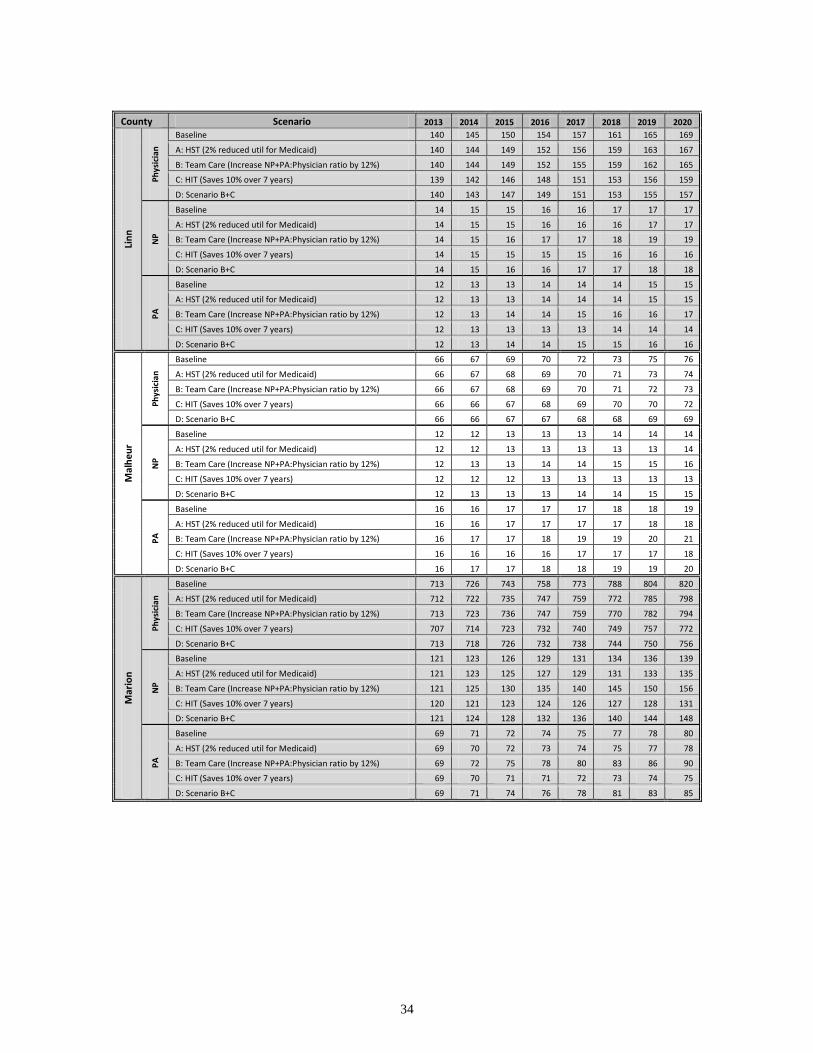
34
County Scenario 2013 2014 2015 2016 2017 2018 2019 2020 Li
nn
Ph
ysic
ian
Baseline 140 145 150 154 157 161 165 169
A: HST (2% reduced util for Medicaid) 140 144 149 152 156 159 163 167
B: Team Care (Increase NP+PA:Physician ratio by 12%) 140 144 149 152 155 159 162 165
C: HIT (Saves 10% over 7 years) 139 142 146 148 151 153 156 159
D: Scenario B+C 140 143 147 149 151 153 155 157
NP
Baseline 14 15 15 16 16 17 17 17
A: HST (2% reduced util for Medicaid) 14 15 15 16 16 16 17 17
B: Team Care (Increase NP+PA:Physician ratio by 12%) 14 15 16 17 17 18 19 19
C: HIT (Saves 10% over 7 years) 14 15 15 15 15 16 16 16
D: Scenario B+C 14 15 16 16 17 17 18 18
PA
Baseline 12 13 13 14 14 14 15 15
A: HST (2% reduced util for Medicaid) 12 13 13 14 14 14 15 15
B: Team Care (Increase NP+PA:Physician ratio by 12%) 12 13 14 14 15 16 16 17
C: HIT (Saves 10% over 7 years) 12 13 13 13 13 14 14 14
D: Scenario B+C 12 13 14 14 15 15 16 16
Mal
he
ur
Ph
ysic
ian
Baseline 66 67 69 70 72 73 75 76
A: HST (2% reduced util for Medicaid) 66 67 68 69 70 71 73 74
B: Team Care (Increase NP+PA:Physician ratio by 12%) 66 67 68 69 70 71 72 73
C: HIT (Saves 10% over 7 years) 66 66 67 68 69 70 70 72
D: Scenario B+C 66 66 67 67 68 68 69 69
NP
Baseline 12 12 13 13 13 14 14 14
A: HST (2% reduced util for Medicaid) 12 12 13 13 13 13 13 14
B: Team Care (Increase NP+PA:Physician ratio by 12%) 12 13 13 14 14 15 15 16
C: HIT (Saves 10% over 7 years) 12 12 12 13 13 13 13 13
D: Scenario B+C 12 13 13 13 14 14 15 15
PA
Baseline 16 16 17 17 17 18 18 19
A: HST (2% reduced util for Medicaid) 16 16 17 17 17 17 18 18
B: Team Care (Increase NP+PA:Physician ratio by 12%) 16 17 17 18 19 19 20 21
C: HIT (Saves 10% over 7 years) 16 16 16 16 17 17 17 18
D: Scenario B+C 16 17 17 18 18 19 19 20
Mar
ion
Ph
ysic
ian
Baseline 713 726 743 758 773 788 804 820
A: HST (2% reduced util for Medicaid) 712 722 735 747 759 772 785 798
B: Team Care (Increase NP+PA:Physician ratio by 12%) 713 723 736 747 759 770 782 794
C: HIT (Saves 10% over 7 years) 707 714 723 732 740 749 757 772
D: Scenario B+C 713 718 726 732 738 744 750 756
NP
Baseline 121 123 126 129 131 134 136 139
A: HST (2% reduced util for Medicaid) 121 123 125 127 129 131 133 135
B: Team Care (Increase NP+PA:Physician ratio by 12%) 121 125 130 135 140 145 150 156
C: HIT (Saves 10% over 7 years) 120 121 123 124 126 127 128 131
D: Scenario B+C 121 124 128 132 136 140 144 148
PA
Baseline 69 71 72 74 75 77 78 80
A: HST (2% reduced util for Medicaid) 69 70 72 73 74 75 77 78
B: Team Care (Increase NP+PA:Physician ratio by 12%) 69 72 75 78 80 83 86 90
C: HIT (Saves 10% over 7 years) 69 70 71 71 72 73 74 75
D: Scenario B+C 69 71 74 76 78 81 83 85
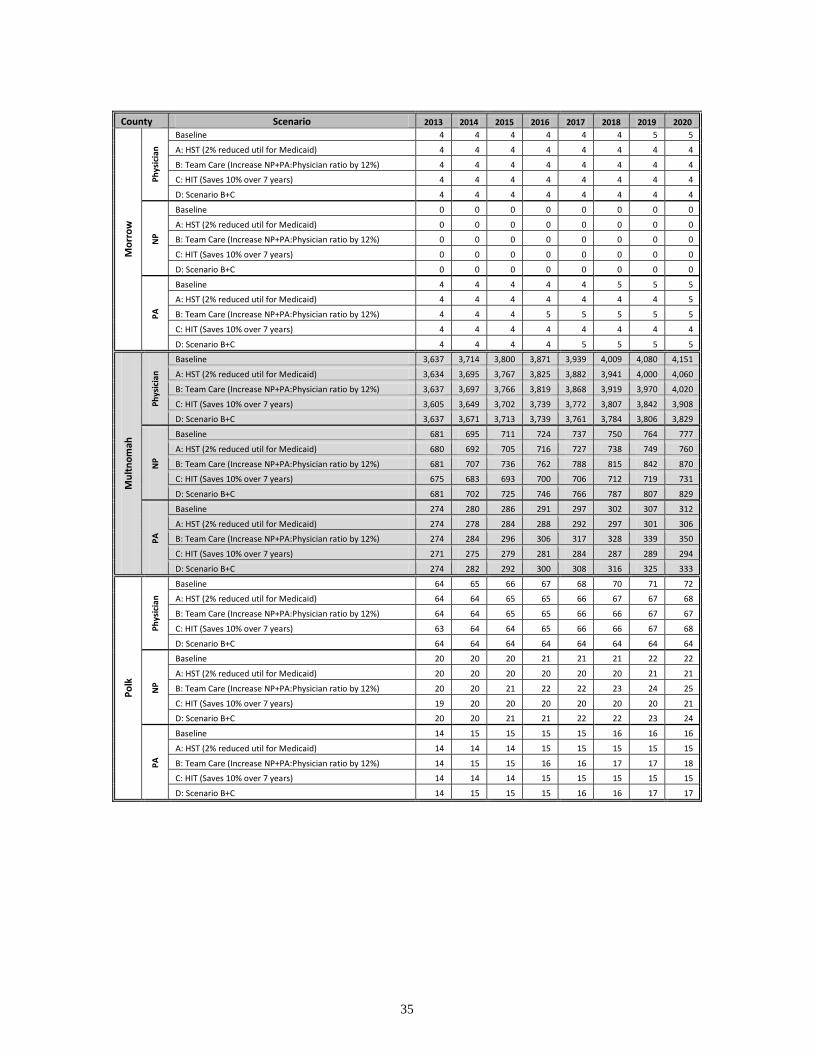
35
County Scenario 2013 2014 2015 2016 2017 2018 2019 2020 M
orr
ow
Ph
ysic
ian
Baseline 4 4 4 4 4 4 5 5
A: HST (2% reduced util for Medicaid) 4 4 4 4 4 4 4 4
B: Team Care (Increase NP+PA:Physician ratio by 12%) 4 4 4 4 4 4 4 4
C: HIT (Saves 10% over 7 years) 4 4 4 4 4 4 4 4
D: Scenario B+C 4 4 4 4 4 4 4 4
NP
Baseline 0 0 0 0 0 0 0 0
A: HST (2% reduced util for Medicaid) 0 0 0 0 0 0 0 0
B: Team Care (Increase NP+PA:Physician ratio by 12%) 0 0 0 0 0 0 0 0
C: HIT (Saves 10% over 7 years) 0 0 0 0 0 0 0 0
D: Scenario B+C 0 0 0 0 0 0 0 0
PA
Baseline 4 4 4 4 4 5 5 5
A: HST (2% reduced util for Medicaid) 4 4 4 4 4 4 4 5
B: Team Care (Increase NP+PA:Physician ratio by 12%) 4 4 4 5 5 5 5 5
C: HIT (Saves 10% over 7 years) 4 4 4 4 4 4 4 4
D: Scenario B+C 4 4 4 4 5 5 5 5
Mu
ltn
om
ah
Ph
ysic
ian
Baseline 3,637 3,714 3,800 3,871 3,939 4,009 4,080 4,151
A: HST (2% reduced util for Medicaid) 3,634 3,695 3,767 3,825 3,882 3,941 4,000 4,060
B: Team Care (Increase NP+PA:Physician ratio by 12%) 3,637 3,697 3,766 3,819 3,868 3,919 3,970 4,020
C: HIT (Saves 10% over 7 years) 3,605 3,649 3,702 3,739 3,772 3,807 3,842 3,908
D: Scenario B+C 3,637 3,671 3,713 3,739 3,761 3,784 3,806 3,829
NP
Baseline 681 695 711 724 737 750 764 777
A: HST (2% reduced util for Medicaid) 680 692 705 716 727 738 749 760
B: Team Care (Increase NP+PA:Physician ratio by 12%) 681 707 736 762 788 815 842 870
C: HIT (Saves 10% over 7 years) 675 683 693 700 706 712 719 731
D: Scenario B+C 681 702 725 746 766 787 807 829
PA
Baseline 274 280 286 291 297 302 307 312
A: HST (2% reduced util for Medicaid) 274 278 284 288 292 297 301 306
B: Team Care (Increase NP+PA:Physician ratio by 12%) 274 284 296 306 317 328 339 350
C: HIT (Saves 10% over 7 years) 271 275 279 281 284 287 289 294
D: Scenario B+C 274 282 292 300 308 316 325 333
Po
lk
Ph
ysic
ian
Baseline 64 65 66 67 68 70 71 72
A: HST (2% reduced util for Medicaid) 64 64 65 65 66 67 67 68
B: Team Care (Increase NP+PA:Physician ratio by 12%) 64 64 65 65 66 66 67 67
C: HIT (Saves 10% over 7 years) 63 64 64 65 66 66 67 68
D: Scenario B+C 64 64 64 64 64 64 64 64
NP
Baseline 20 20 20 21 21 21 22 22
A: HST (2% reduced util for Medicaid) 20 20 20 20 20 20 21 21
B: Team Care (Increase NP+PA:Physician ratio by 12%) 20 20 21 22 22 23 24 25
C: HIT (Saves 10% over 7 years) 19 20 20 20 20 20 20 21
D: Scenario B+C 20 20 21 21 22 22 23 24
PA
Baseline 14 15 15 15 15 16 16 16
A: HST (2% reduced util for Medicaid) 14 14 14 15 15 15 15 15
B: Team Care (Increase NP+PA:Physician ratio by 12%) 14 15 15 16 16 17 17 18
C: HIT (Saves 10% over 7 years) 14 14 14 15 15 15 15 15
D: Scenario B+C 14 15 15 15 16 16 17 17
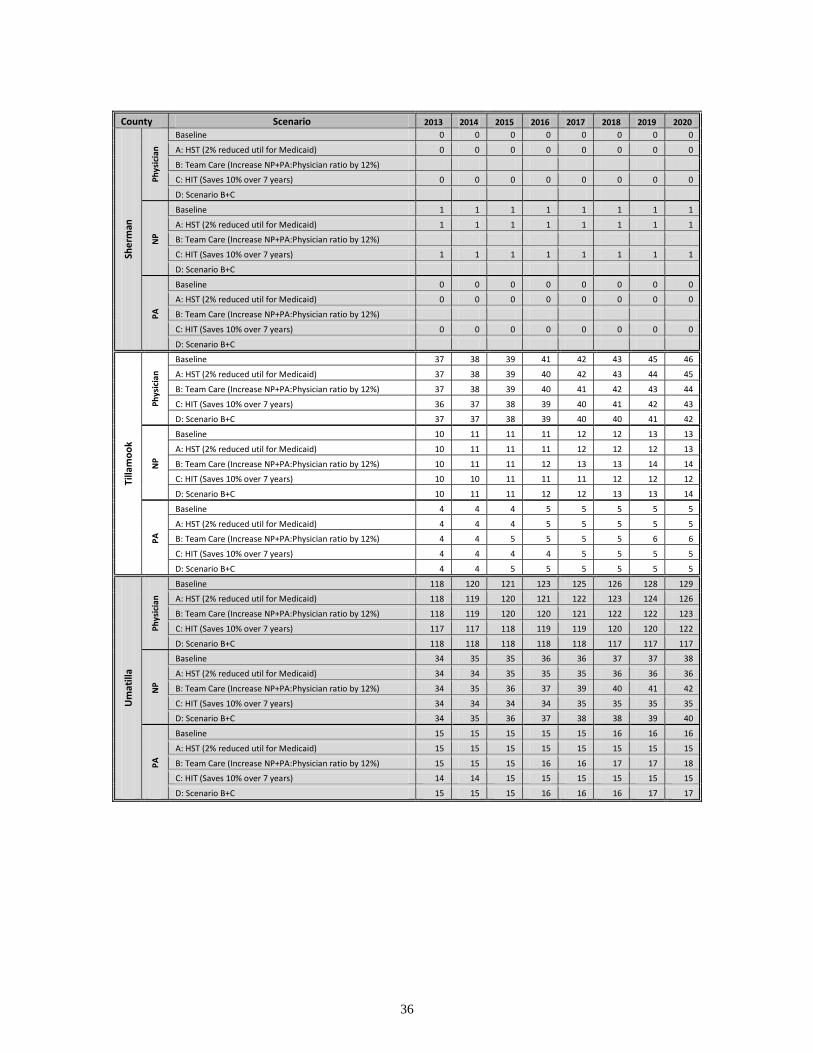
36
County Scenario 2013 2014 2015 2016 2017 2018 2019 2020 Sh
erm
an
Ph
ysic
ian
Baseline 0 0 0 0 0 0 0 0
A: HST (2% reduced util for Medicaid) 0 0 0 0 0 0 0 0
B: Team Care (Increase NP+PA:Physician ratio by 12%)
C: HIT (Saves 10% over 7 years) 0 0 0 0 0 0 0 0
D: Scenario B+C
NP
Baseline 1 1 1 1 1 1 1 1
A: HST (2% reduced util for Medicaid) 1 1 1 1 1 1 1 1
B: Team Care (Increase NP+PA:Physician ratio by 12%)
C: HIT (Saves 10% over 7 years) 1 1 1 1 1 1 1 1
D: Scenario B+C
PA
Baseline 0 0 0 0 0 0 0 0
A: HST (2% reduced util for Medicaid) 0 0 0 0 0 0 0 0
B: Team Care (Increase NP+PA:Physician ratio by 12%)
C: HIT (Saves 10% over 7 years) 0 0 0 0 0 0 0 0
D: Scenario B+C
Tilla
mo
ok
Ph
ysic
ian
Baseline 37 38 39 41 42 43 45 46
A: HST (2% reduced util for Medicaid) 37 38 39 40 42 43 44 45
B: Team Care (Increase NP+PA:Physician ratio by 12%) 37 38 39 40 41 42 43 44
C: HIT (Saves 10% over 7 years) 36 37 38 39 40 41 42 43
D: Scenario B+C 37 37 38 39 40 40 41 42
NP
Baseline 10 11 11 11 12 12 13 13
A: HST (2% reduced util for Medicaid) 10 11 11 11 12 12 12 13
B: Team Care (Increase NP+PA:Physician ratio by 12%) 10 11 11 12 13 13 14 14
C: HIT (Saves 10% over 7 years) 10 10 11 11 11 12 12 12
D: Scenario B+C 10 11 11 12 12 13 13 14
PA
Baseline 4 4 4 5 5 5 5 5
A: HST (2% reduced util for Medicaid) 4 4 4 5 5 5 5 5
B: Team Care (Increase NP+PA:Physician ratio by 12%) 4 4 5 5 5 5 6 6
C: HIT (Saves 10% over 7 years) 4 4 4 4 5 5 5 5
D: Scenario B+C 4 4 5 5 5 5 5 5
Um
atill
a
Ph
ysic
ian
Baseline 118 120 121 123 125 126 128 129
A: HST (2% reduced util for Medicaid) 118 119 120 121 122 123 124 126
B: Team Care (Increase NP+PA:Physician ratio by 12%) 118 119 120 120 121 122 122 123
C: HIT (Saves 10% over 7 years) 117 117 118 119 119 120 120 122
D: Scenario B+C 118 118 118 118 118 117 117 117
NP
Baseline 34 35 35 36 36 37 37 38
A: HST (2% reduced util for Medicaid) 34 34 35 35 35 36 36 36
B: Team Care (Increase NP+PA:Physician ratio by 12%) 34 35 36 37 39 40 41 42
C: HIT (Saves 10% over 7 years) 34 34 34 34 35 35 35 35
D: Scenario B+C 34 35 36 37 38 38 39 40
PA
Baseline 15 15 15 15 15 16 16 16
A: HST (2% reduced util for Medicaid) 15 15 15 15 15 15 15 15
B: Team Care (Increase NP+PA:Physician ratio by 12%) 15 15 15 16 16 17 17 18
C: HIT (Saves 10% over 7 years) 14 14 15 15 15 15 15 15
D: Scenario B+C 15 15 15 16 16 16 17 17
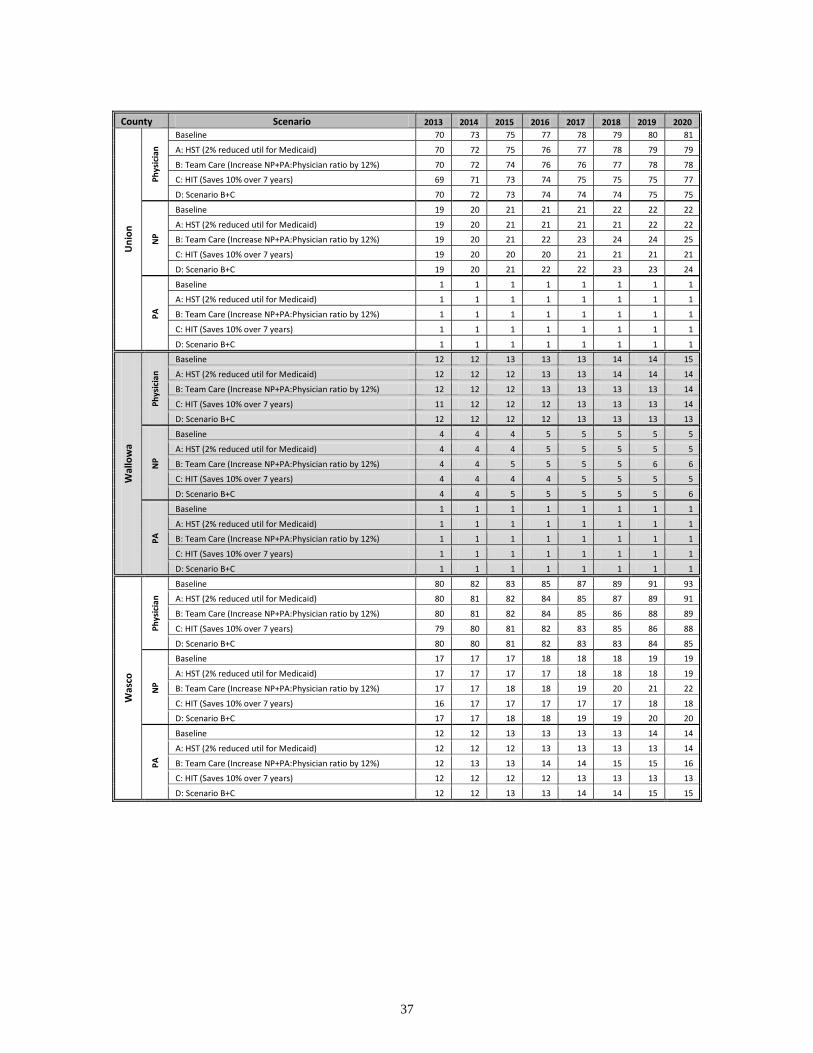
37
County Scenario 2013 2014 2015 2016 2017 2018 2019 2020 U
nio
n
Ph
ysic
ian
Baseline 70 73 75 77 78 79 80 81
A: HST (2% reduced util for Medicaid) 70 72 75 76 77 78 79 79
B: Team Care (Increase NP+PA:Physician ratio by 12%) 70 72 74 76 76 77 78 78
C: HIT (Saves 10% over 7 years) 69 71 73 74 75 75 75 77
D: Scenario B+C 70 72 73 74 74 74 75 75
NP
Baseline 19 20 21 21 21 22 22 22
A: HST (2% reduced util for Medicaid) 19 20 21 21 21 21 22 22
B: Team Care (Increase NP+PA:Physician ratio by 12%) 19 20 21 22 23 24 24 25
C: HIT (Saves 10% over 7 years) 19 20 20 20 21 21 21 21
D: Scenario B+C 19 20 21 22 22 23 23 24
PA
Baseline 1 1 1 1 1 1 1 1
A: HST (2% reduced util for Medicaid) 1 1 1 1 1 1 1 1
B: Team Care (Increase NP+PA:Physician ratio by 12%) 1 1 1 1 1 1 1 1
C: HIT (Saves 10% over 7 years) 1 1 1 1 1 1 1 1
D: Scenario B+C 1 1 1 1 1 1 1 1
Wal
low
a
Ph
ysic
ian
Baseline 12 12 13 13 13 14 14 15
A: HST (2% reduced util for Medicaid) 12 12 12 13 13 14 14 14
B: Team Care (Increase NP+PA:Physician ratio by 12%) 12 12 12 13 13 13 13 14
C: HIT (Saves 10% over 7 years) 11 12 12 12 13 13 13 14
D: Scenario B+C 12 12 12 12 13 13 13 13
NP
Baseline 4 4 4 5 5 5 5 5
A: HST (2% reduced util for Medicaid) 4 4 4 5 5 5 5 5
B: Team Care (Increase NP+PA:Physician ratio by 12%) 4 4 5 5 5 5 6 6
C: HIT (Saves 10% over 7 years) 4 4 4 4 5 5 5 5
D: Scenario B+C 4 4 5 5 5 5 5 6
PA
Baseline 1 1 1 1 1 1 1 1
A: HST (2% reduced util for Medicaid) 1 1 1 1 1 1 1 1
B: Team Care (Increase NP+PA:Physician ratio by 12%) 1 1 1 1 1 1 1 1
C: HIT (Saves 10% over 7 years) 1 1 1 1 1 1 1 1
D: Scenario B+C 1 1 1 1 1 1 1 1
Was
co
Ph
ysic
ian
Baseline 80 82 83 85 87 89 91 93
A: HST (2% reduced util for Medicaid) 80 81 82 84 85 87 89 91
B: Team Care (Increase NP+PA:Physician ratio by 12%) 80 81 82 84 85 86 88 89
C: HIT (Saves 10% over 7 years) 79 80 81 82 83 85 86 88
D: Scenario B+C 80 80 81 82 83 83 84 85
NP
Baseline 17 17 17 18 18 18 19 19
A: HST (2% reduced util for Medicaid) 17 17 17 17 18 18 18 19
B: Team Care (Increase NP+PA:Physician ratio by 12%) 17 17 18 18 19 20 21 22
C: HIT (Saves 10% over 7 years) 16 17 17 17 17 17 18 18
D: Scenario B+C 17 17 18 18 19 19 20 20
PA
Baseline 12 12 13 13 13 13 14 14
A: HST (2% reduced util for Medicaid) 12 12 12 13 13 13 13 14
B: Team Care (Increase NP+PA:Physician ratio by 12%) 12 13 13 14 14 15 15 16
C: HIT (Saves 10% over 7 years) 12 12 12 12 13 13 13 13
D: Scenario B+C 12 12 13 13 14 14 15 15
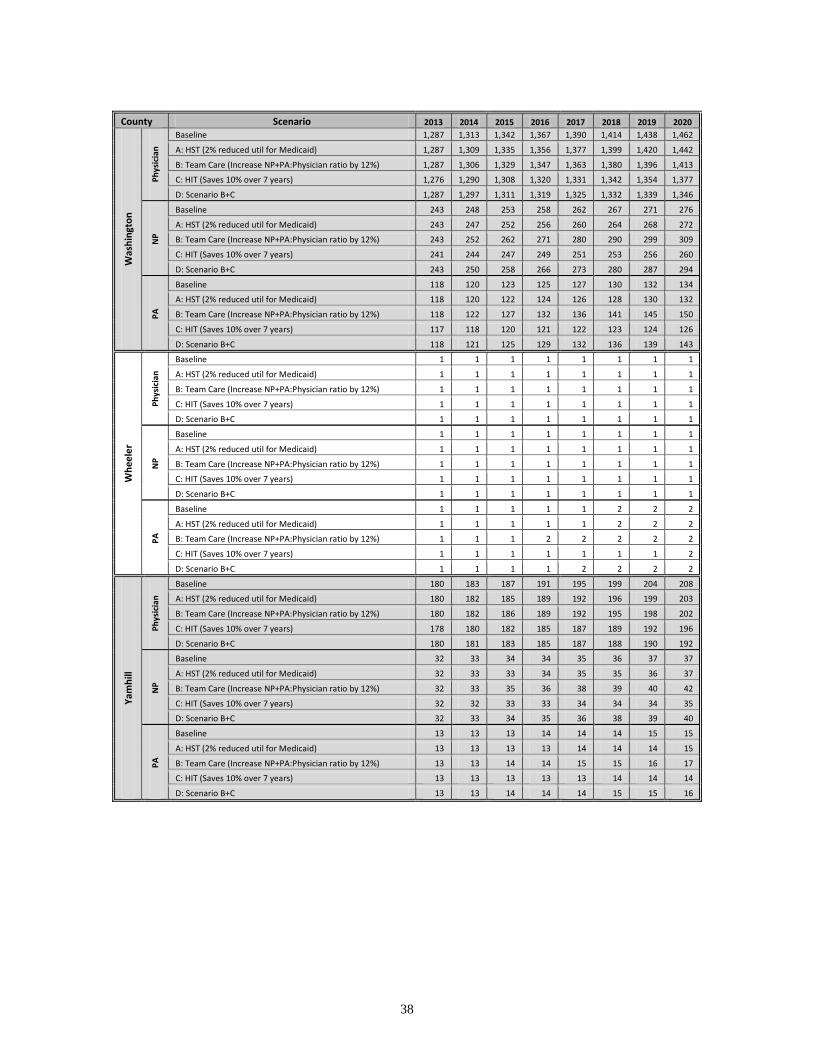
38
County Scenario 2013 2014 2015 2016 2017 2018 2019 2020 W
ash
ingt
on
Ph
ysic
ian
Baseline 1,287 1,313 1,342 1,367 1,390 1,414 1,438 1,462
A: HST (2% reduced util for Medicaid) 1,287 1,309 1,335 1,356 1,377 1,399 1,420 1,442
B: Team Care (Increase NP+PA:Physician ratio by 12%) 1,287 1,306 1,329 1,347 1,363 1,380 1,396 1,413
C: HIT (Saves 10% over 7 years) 1,276 1,290 1,308 1,320 1,331 1,342 1,354 1,377
D: Scenario B+C 1,287 1,297 1,311 1,319 1,325 1,332 1,339 1,346
NP
Baseline 243 248 253 258 262 267 271 276
A: HST (2% reduced util for Medicaid) 243 247 252 256 260 264 268 272
B: Team Care (Increase NP+PA:Physician ratio by 12%) 243 252 262 271 280 290 299 309
C: HIT (Saves 10% over 7 years) 241 244 247 249 251 253 256 260
D: Scenario B+C 243 250 258 266 273 280 287 294
PA
Baseline 118 120 123 125 127 130 132 134
A: HST (2% reduced util for Medicaid) 118 120 122 124 126 128 130 132
B: Team Care (Increase NP+PA:Physician ratio by 12%) 118 122 127 132 136 141 145 150
C: HIT (Saves 10% over 7 years) 117 118 120 121 122 123 124 126
D: Scenario B+C 118 121 125 129 132 136 139 143
Wh
eele
r
Ph
ysic
ian
Baseline 1 1 1 1 1 1 1 1
A: HST (2% reduced util for Medicaid) 1 1 1 1 1 1 1 1
B: Team Care (Increase NP+PA:Physician ratio by 12%) 1 1 1 1 1 1 1 1
C: HIT (Saves 10% over 7 years) 1 1 1 1 1 1 1 1
D: Scenario B+C 1 1 1 1 1 1 1 1
NP
Baseline 1 1 1 1 1 1 1 1
A: HST (2% reduced util for Medicaid) 1 1 1 1 1 1 1 1
B: Team Care (Increase NP+PA:Physician ratio by 12%) 1 1 1 1 1 1 1 1
C: HIT (Saves 10% over 7 years) 1 1 1 1 1 1 1 1
D: Scenario B+C 1 1 1 1 1 1 1 1
PA
Baseline 1 1 1 1 1 2 2 2
A: HST (2% reduced util for Medicaid) 1 1 1 1 1 2 2 2
B: Team Care (Increase NP+PA:Physician ratio by 12%) 1 1 1 2 2 2 2 2
C: HIT (Saves 10% over 7 years) 1 1 1 1 1 1 1 2
D: Scenario B+C 1 1 1 1 2 2 2 2
Yam
hill
Ph
ysic
ian
Baseline 180 183 187 191 195 199 204 208
A: HST (2% reduced util for Medicaid) 180 182 185 189 192 196 199 203
B: Team Care (Increase NP+PA:Physician ratio by 12%) 180 182 186 189 192 195 198 202
C: HIT (Saves 10% over 7 years) 178 180 182 185 187 189 192 196
D: Scenario B+C 180 181 183 185 187 188 190 192
NP
Baseline 32 33 34 34 35 36 37 37
A: HST (2% reduced util for Medicaid) 32 33 33 34 35 35 36 37
B: Team Care (Increase NP+PA:Physician ratio by 12%) 32 33 35 36 38 39 40 42
C: HIT (Saves 10% over 7 years) 32 32 33 33 34 34 34 35
D: Scenario B+C 32 33 34 35 36 38 39 40
PA
Baseline 13 13 13 14 14 14 15 15
A: HST (2% reduced util for Medicaid) 13 13 13 13 14 14 14 15
B: Team Care (Increase NP+PA:Physician ratio by 12%) 13 13 14 14 15 15 16 17
C: HIT (Saves 10% over 7 years) 13 13 13 13 13 14 14 14
D: Scenario B+C 13 13 14 14 14 15 15 16
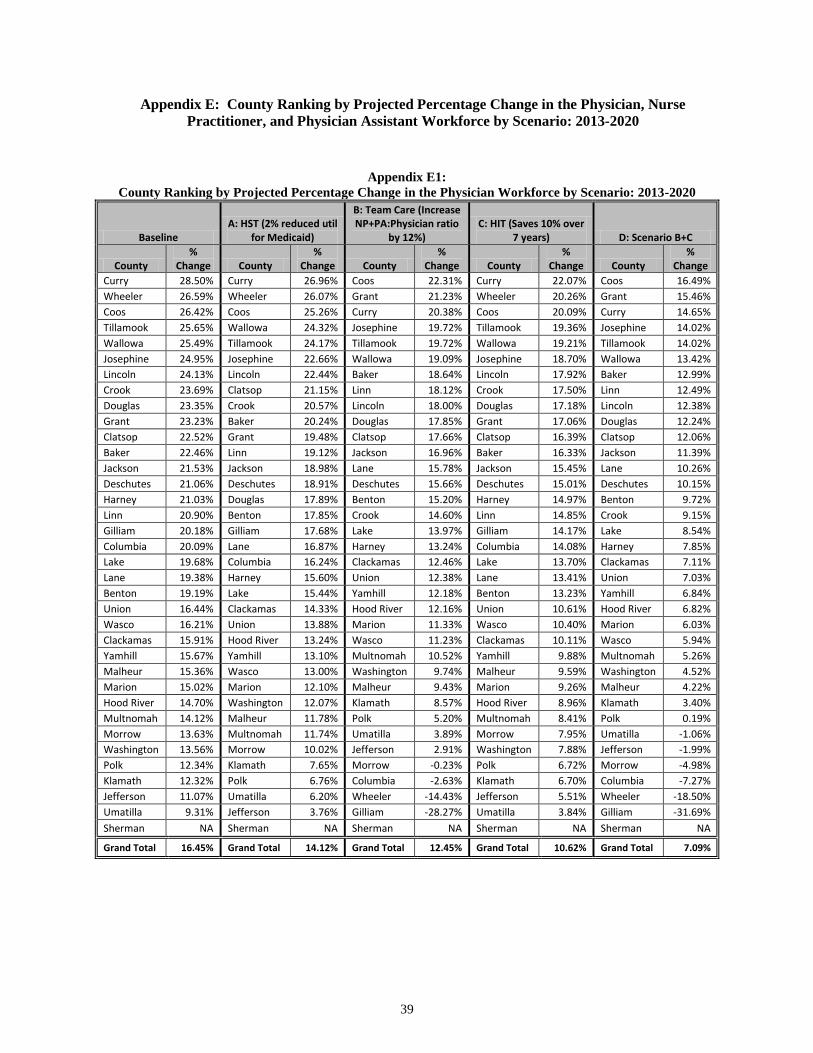
39
Appendix E: County Ranking by Projected Percentage Change in the Physician, Nurse
Practitioner, and Physician Assistant Workforce by Scenario: 2013-2020
Appendix E1:
County Ranking by Projected Percentage Change in the Physician Workforce by Scenario: 2013-2020
Baseline A: HST (2% reduced util
for Medicaid)
B: Team Care (Increase NP+PA:Physician ratio
by 12%) C: HIT (Saves 10% over
7 years) D: Scenario B+C
County %
Change County %
Change County %
Change County %
Change County %
Change
Curry 28.50% Curry 26.96% Coos 22.31% Curry 22.07% Coos 16.49%
Wheeler 26.59% Wheeler 26.07% Grant 21.23% Wheeler 20.26% Grant 15.46%
Coos 26.42% Coos 25.26% Curry 20.38% Coos 20.09% Curry 14.65%
Tillamook 25.65% Wallowa 24.32% Josephine 19.72% Tillamook 19.36% Josephine 14.02%
Wallowa 25.49% Tillamook 24.17% Tillamook 19.72% Wallowa 19.21% Tillamook 14.02%
Josephine 24.95% Josephine 22.66% Wallowa 19.09% Josephine 18.70% Wallowa 13.42%
Lincoln 24.13% Lincoln 22.44% Baker 18.64% Lincoln 17.92% Baker 12.99%
Crook 23.69% Clatsop 21.15% Linn 18.12% Crook 17.50% Linn 12.49%
Douglas 23.35% Crook 20.57% Lincoln 18.00% Douglas 17.18% Lincoln 12.38%
Grant 23.23% Baker 20.24% Douglas 17.85% Grant 17.06% Douglas 12.24%
Clatsop 22.52% Grant 19.48% Clatsop 17.66% Clatsop 16.39% Clatsop 12.06%
Baker 22.46% Linn 19.12% Jackson 16.96% Baker 16.33% Jackson 11.39%
Jackson 21.53% Jackson 18.98% Lane 15.78% Jackson 15.45% Lane 10.26%
Deschutes 21.06% Deschutes 18.91% Deschutes 15.66% Deschutes 15.01% Deschutes 10.15%
Harney 21.03% Douglas 17.89% Benton 15.20% Harney 14.97% Benton 9.72%
Linn 20.90% Benton 17.85% Crook 14.60% Linn 14.85% Crook 9.15%
Gilliam 20.18% Gilliam 17.68% Lake 13.97% Gilliam 14.17% Lake 8.54%
Columbia 20.09% Lane 16.87% Harney 13.24% Columbia 14.08% Harney 7.85%
Lake 19.68% Columbia 16.24% Clackamas 12.46% Lake 13.70% Clackamas 7.11%
Lane 19.38% Harney 15.60% Union 12.38% Lane 13.41% Union 7.03%
Benton 19.19% Lake 15.44% Yamhill 12.18% Benton 13.23% Yamhill 6.84%
Union 16.44% Clackamas 14.33% Hood River 12.16% Union 10.61% Hood River 6.82%
Wasco 16.21% Union 13.88% Marion 11.33% Wasco 10.40% Marion 6.03%
Clackamas 15.91% Hood River 13.24% Wasco 11.23% Clackamas 10.11% Wasco 5.94%
Yamhill 15.67% Yamhill 13.10% Multnomah 10.52% Yamhill 9.88% Multnomah 5.26%
Malheur 15.36% Wasco 13.00% Washington 9.74% Malheur 9.59% Washington 4.52%
Marion 15.02% Marion 12.10% Malheur 9.43% Marion 9.26% Malheur 4.22%
Hood River 14.70% Washington 12.07% Klamath 8.57% Hood River 8.96% Klamath 3.40%
Multnomah 14.12% Malheur 11.78% Polk 5.20% Multnomah 8.41% Polk 0.19%
Morrow 13.63% Multnomah 11.74% Umatilla 3.89% Morrow 7.95% Umatilla -1.06%
Washington 13.56% Morrow 10.02% Jefferson 2.91% Washington 7.88% Jefferson -1.99%
Polk 12.34% Klamath 7.65% Morrow -0.23% Polk 6.72% Morrow -4.98%
Klamath 12.32% Polk 6.76% Columbia -2.63% Klamath 6.70% Columbia -7.27%
Jefferson 11.07% Umatilla 6.20% Wheeler -14.43% Jefferson 5.51% Wheeler -18.50%
Umatilla 9.31% Jefferson 3.76% Gilliam -28.27% Umatilla 3.84% Gilliam -31.69%
Sherman NA Sherman NA Sherman NA Sherman NA Sherman NA
Grand Total 16.45% Grand Total 14.12% Grand Total 12.45% Grand Total 10.62% Grand Total 7.09%
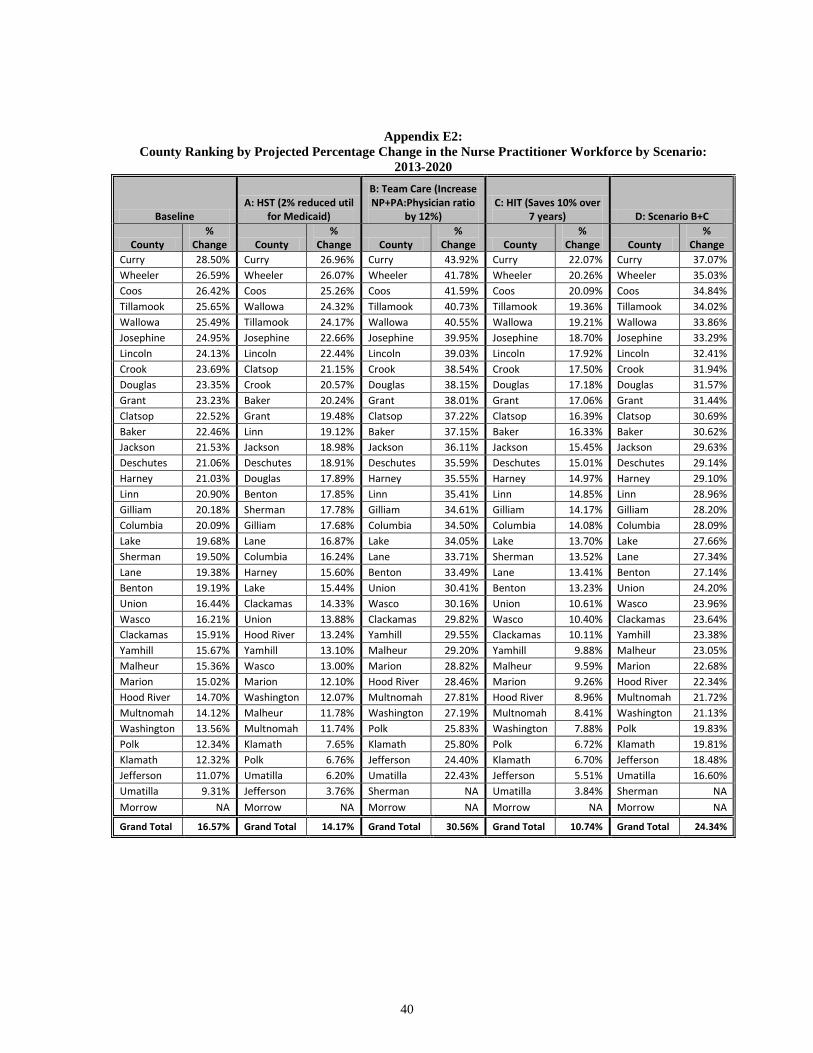
40
Appendix E2:
County Ranking by Projected Percentage Change in the Nurse Practitioner Workforce by Scenario:
2013-2020
Baseline A: HST (2% reduced util
for Medicaid)
B: Team Care (Increase NP+PA:Physician ratio
by 12%) C: HIT (Saves 10% over
7 years) D: Scenario B+C
County %
Change County %
Change County %
Change County %
Change County %
Change
Curry 28.50% Curry 26.96% Curry 43.92% Curry 22.07% Curry 37.07%
Wheeler 26.59% Wheeler 26.07% Wheeler 41.78% Wheeler 20.26% Wheeler 35.03%
Coos 26.42% Coos 25.26% Coos 41.59% Coos 20.09% Coos 34.84%
Tillamook 25.65% Wallowa 24.32% Tillamook 40.73% Tillamook 19.36% Tillamook 34.02%
Wallowa 25.49% Tillamook 24.17% Wallowa 40.55% Wallowa 19.21% Wallowa 33.86%
Josephine 24.95% Josephine 22.66% Josephine 39.95% Josephine 18.70% Josephine 33.29%
Lincoln 24.13% Lincoln 22.44% Lincoln 39.03% Lincoln 17.92% Lincoln 32.41%
Crook 23.69% Clatsop 21.15% Crook 38.54% Crook 17.50% Crook 31.94%
Douglas 23.35% Crook 20.57% Douglas 38.15% Douglas 17.18% Douglas 31.57%
Grant 23.23% Baker 20.24% Grant 38.01% Grant 17.06% Grant 31.44%
Clatsop 22.52% Grant 19.48% Clatsop 37.22% Clatsop 16.39% Clatsop 30.69%
Baker 22.46% Linn 19.12% Baker 37.15% Baker 16.33% Baker 30.62%
Jackson 21.53% Jackson 18.98% Jackson 36.11% Jackson 15.45% Jackson 29.63%
Deschutes 21.06% Deschutes 18.91% Deschutes 35.59% Deschutes 15.01% Deschutes 29.14%
Harney 21.03% Douglas 17.89% Harney 35.55% Harney 14.97% Harney 29.10%
Linn 20.90% Benton 17.85% Linn 35.41% Linn 14.85% Linn 28.96%
Gilliam 20.18% Sherman 17.78% Gilliam 34.61% Gilliam 14.17% Gilliam 28.20%
Columbia 20.09% Gilliam 17.68% Columbia 34.50% Columbia 14.08% Columbia 28.09%
Lake 19.68% Lane 16.87% Lake 34.05% Lake 13.70% Lake 27.66%
Sherman 19.50% Columbia 16.24% Lane 33.71% Sherman 13.52% Lane 27.34%
Lane 19.38% Harney 15.60% Benton 33.49% Lane 13.41% Benton 27.14%
Benton 19.19% Lake 15.44% Union 30.41% Benton 13.23% Union 24.20%
Union 16.44% Clackamas 14.33% Wasco 30.16% Union 10.61% Wasco 23.96%
Wasco 16.21% Union 13.88% Clackamas 29.82% Wasco 10.40% Clackamas 23.64%
Clackamas 15.91% Hood River 13.24% Yamhill 29.55% Clackamas 10.11% Yamhill 23.38%
Yamhill 15.67% Yamhill 13.10% Malheur 29.20% Yamhill 9.88% Malheur 23.05%
Malheur 15.36% Wasco 13.00% Marion 28.82% Malheur 9.59% Marion 22.68%
Marion 15.02% Marion 12.10% Hood River 28.46% Marion 9.26% Hood River 22.34%
Hood River 14.70% Washington 12.07% Multnomah 27.81% Hood River 8.96% Multnomah 21.72%
Multnomah 14.12% Malheur 11.78% Washington 27.19% Multnomah 8.41% Washington 21.13%
Washington 13.56% Multnomah 11.74% Polk 25.83% Washington 7.88% Polk 19.83%
Polk 12.34% Klamath 7.65% Klamath 25.80% Polk 6.72% Klamath 19.81%
Klamath 12.32% Polk 6.76% Jefferson 24.40% Klamath 6.70% Jefferson 18.48%
Jefferson 11.07% Umatilla 6.20% Umatilla 22.43% Jefferson 5.51% Umatilla 16.60%
Umatilla 9.31% Jefferson 3.76% Sherman NA Umatilla 3.84% Sherman NA
Morrow NA Morrow NA Morrow NA Morrow NA Morrow NA
Grand Total 16.57% Grand Total 14.17% Grand Total 30.56% Grand Total 10.74% Grand Total 24.34%
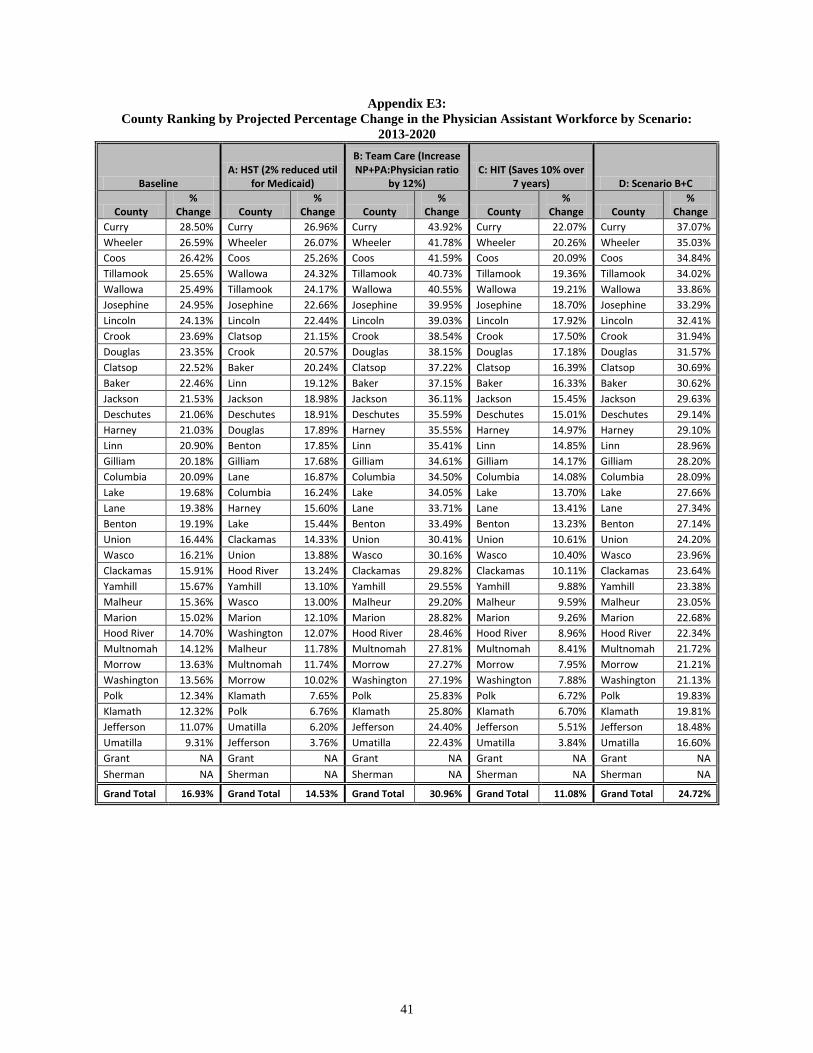
41
Appendix E3:
County Ranking by Projected Percentage Change in the Physician Assistant Workforce by Scenario:
2013-2020
Baseline A: HST (2% reduced util
for Medicaid)
B: Team Care (Increase NP+PA:Physician ratio
by 12%) C: HIT (Saves 10% over
7 years) D: Scenario B+C
County %
Change County %
Change County %
Change County %
Change County %
Change
Curry 28.50% Curry 26.96% Curry 43.92% Curry 22.07% Curry 37.07%
Wheeler 26.59% Wheeler 26.07% Wheeler 41.78% Wheeler 20.26% Wheeler 35.03%
Coos 26.42% Coos 25.26% Coos 41.59% Coos 20.09% Coos 34.84%
Tillamook 25.65% Wallowa 24.32% Tillamook 40.73% Tillamook 19.36% Tillamook 34.02%
Wallowa 25.49% Tillamook 24.17% Wallowa 40.55% Wallowa 19.21% Wallowa 33.86%
Josephine 24.95% Josephine 22.66% Josephine 39.95% Josephine 18.70% Josephine 33.29%
Lincoln 24.13% Lincoln 22.44% Lincoln 39.03% Lincoln 17.92% Lincoln 32.41%
Crook 23.69% Clatsop 21.15% Crook 38.54% Crook 17.50% Crook 31.94%
Douglas 23.35% Crook 20.57% Douglas 38.15% Douglas 17.18% Douglas 31.57%
Clatsop 22.52% Baker 20.24% Clatsop 37.22% Clatsop 16.39% Clatsop 30.69%
Baker 22.46% Linn 19.12% Baker 37.15% Baker 16.33% Baker 30.62%
Jackson 21.53% Jackson 18.98% Jackson 36.11% Jackson 15.45% Jackson 29.63%
Deschutes 21.06% Deschutes 18.91% Deschutes 35.59% Deschutes 15.01% Deschutes 29.14%
Harney 21.03% Douglas 17.89% Harney 35.55% Harney 14.97% Harney 29.10%
Linn 20.90% Benton 17.85% Linn 35.41% Linn 14.85% Linn 28.96%
Gilliam 20.18% Gilliam 17.68% Gilliam 34.61% Gilliam 14.17% Gilliam 28.20%
Columbia 20.09% Lane 16.87% Columbia 34.50% Columbia 14.08% Columbia 28.09%
Lake 19.68% Columbia 16.24% Lake 34.05% Lake 13.70% Lake 27.66%
Lane 19.38% Harney 15.60% Lane 33.71% Lane 13.41% Lane 27.34%
Benton 19.19% Lake 15.44% Benton 33.49% Benton 13.23% Benton 27.14%
Union 16.44% Clackamas 14.33% Union 30.41% Union 10.61% Union 24.20%
Wasco 16.21% Union 13.88% Wasco 30.16% Wasco 10.40% Wasco 23.96%
Clackamas 15.91% Hood River 13.24% Clackamas 29.82% Clackamas 10.11% Clackamas 23.64%
Yamhill 15.67% Yamhill 13.10% Yamhill 29.55% Yamhill 9.88% Yamhill 23.38%
Malheur 15.36% Wasco 13.00% Malheur 29.20% Malheur 9.59% Malheur 23.05%
Marion 15.02% Marion 12.10% Marion 28.82% Marion 9.26% Marion 22.68%
Hood River 14.70% Washington 12.07% Hood River 28.46% Hood River 8.96% Hood River 22.34%
Multnomah 14.12% Malheur 11.78% Multnomah 27.81% Multnomah 8.41% Multnomah 21.72%
Morrow 13.63% Multnomah 11.74% Morrow 27.27% Morrow 7.95% Morrow 21.21%
Washington 13.56% Morrow 10.02% Washington 27.19% Washington 7.88% Washington 21.13%
Polk 12.34% Klamath 7.65% Polk 25.83% Polk 6.72% Polk 19.83%
Klamath 12.32% Polk 6.76% Klamath 25.80% Klamath 6.70% Klamath 19.81%
Jefferson 11.07% Umatilla 6.20% Jefferson 24.40% Jefferson 5.51% Jefferson 18.48%
Umatilla 9.31% Jefferson 3.76% Umatilla 22.43% Umatilla 3.84% Umatilla 16.60%
Grant NA Grant NA Grant NA Grant NA Grant NA
Sherman NA Sherman NA Sherman NA Sherman NA Sherman NA
Grand Total 16.93% Grand Total 14.53% Grand Total 30.96% Grand Total 11.08% Grand Total 24.72%
42
Endnotes 1 State Health Access Data Assistance Center (2005). Pent-Up Demand for Health Care Services among
the Newly Insured. State Health Access Data Assistance Center, 2221 University Avenue, Suite 345,
University of Minnesota, Minneapolis, MN, 55414. Available at
http://www.azahcccs.gov/reporting/Downloads/HRSAgrant/publications/SHADAC_FINAL_REPORT.pdf
2 Baicker, K. and Finkelstein, A. (2011). The effects of Medicaid coverage - Learning from the Oregon
experiment, New England Journal of Medicine, August 25, 2011; 365:683-685.
3 Long, S.K., Stockley, K and Dahlen, H. (2012). Massachusetts Health Reforms: Uninsurance Remains
Low, Self-Reported Health Status Improves As State Prepares To Tackle Costs, Health Affairs, 31, no.2
(2012):444-451.
4 Commonwealth of Massachusetts, Division of Health Care Finance and Policy (2010). Primary Care in
Massachusetts: An Overview of Trends and Opportunities (July 2010). Accessed 10/27/2013 at
http://archives.lib.state.ma.us/handle/2452/50110
5 Association of American Medical Colleges (2011). State Physician Workforce Data Book (November
2011). Available at https://www.aamc.org/download/263512/data.
6 Staiger, D.O., Auerbach, D.I., and Buerhaus, B.I. (2011). Health Care Reform and the Health Care
Workforce - The Massachusetts Experience, The New England Journal of Medicine, 365:e24. Available at
http://www.nejm.org/doi/full/10.1056/NEJMp1106616.
7 Fields D., Leshen E, and Patel K (2010). Driving quality gains and cost savings through adoption of
medical homes. Health Affairs, 29(5): 819–826.
8 Grumbach K, and Grundy P (2010). Outcomes of Implementing Patient Centered Medical Home
Interventions: A Review of the Evidence from Prospective Evaluation Studies in the United States.
Washington DC: Patient-Centered Primary Care Collaborative.
9 Oregon Health Authority (2012). (Information Brief) Oregon’s 1115 Medicaid Waiver to Implement
Health System Transformation. Available at http://www.oregon.gov/oha/OHPB/Documents/cms-waiver-
brief.pdf.
10
Auerbach, D.I., Chen, P.G., Friedberg, M.W., Reid, R., Lau, C., Buerhaus, P.I., and Mehrotra A., (2013).
Nurse-managed health centers and patient-centered medical homes could mitigate expected primary care
physician shortage, Health Affairs, 32, no.11:1933-1941.
11
Green, L.V., Savin, S., and Lu, Y. (2013). Primary care physician shortages could be eliminated through
use of teams, nonphysicians, and electronic communication, Health Affairs, 32, no.1:11-19.
12
Weiner, J.P., Yeh, S., and Blumenthal, D. (2013). The impact of health information technology and e-
health on the future demand for physician services, Health Affairs, Nov. 32(11):1998–2004.
13
Green, L.V., Savin, S., and Lu, Y. (2013). Primary care physician shortages could be eliminated through
use of teams, nonphysicians, and electronic communication. Health Affairs, 32, no.1:11-19.
14
U.S. Department of Health and Human Services, Office of the National Coordinator. Health IT
Dashboard. Accessed November 2013. Available at http://dashboard.healthit.gov. 15
Oregon Office for Health Policy and Research (2013). Oregon Health Professions: Occupational and
County Profiles: 2013. Oregon Health Authority, Salem, OR. Available at
http://www.oregon.gov/oha/OHPR/RSCH/docs/Workforce/2012%20Workforce%20Report/2012%20Work
force%20Report.pdf.
43
16
Salsberg, E (2013). Projecting Future clinician Supply and Demand: Advances and Challenges.
National Health Policy Forum, Washington DC. Available at
http://bhpr.hrsa.gov/healthworkforce/supplydemand/supplyanddemand.pdf.
17
Kirch, D.G., Henderson, M.K., and Dill, M.J. (2012). Physician workforce projections in an era of health
care reform, Annual Review of Medicine, 63: 435-445.
18
Oregon Office for Health Policy and Research (2013). Oregon Health Professions: Occupational and
County Profiles: 2013. Oregon Health Authority, Salem, OR. Available at
http://www.oregon.gov/oha/OHPR/RSCH/docs/Workforce/2012%20Workforce%20Report/2012%20Work
force%20Report.pdf.
19
Oregon Health Authority (2013). Provider Access Questions from the Physician Workforce Survey.
Accessed November 2013. Available at http://www.oregon.gov/oha/Metrics/Pages/measure-provider.aspx
20
Oregon Health Care Workforce Committee (2013). 5-Year Strategic Plan for Primary Care
Provider Recruitment in Oregon. Available at
http://www.oregon.gov/oha/OHPR/HPB/Workforce/Docs/HB_2366_Report_and_Appendices.pdf
21
Oregon Health Authority (2013). Health IT Task Force. Accessed November 2013. Available at
http://healthit.oregon.gov/Initiatives/Pages/Task-Force.aspx
22
Hofer, A.N., Abraham, J.M., and Moscovice, I. (2011). Expansion of coverage under the Patient
Protection and Affordable Care Act and primary care utilization, Milbank Quarterly, 89, no. 1: 69-89.
23
Association of American Medical Colleges (2010). The Impact of Health Care Reform on the Future
supply and Demand for Physicians Updated Projections Through 2020. AAMC, June 2010, Washington,
DC. Available at: https://www.aamc.org/download/158076/data/updated_projections_through_2025.pdf.
24
Virginia Department of Health Professions (2010). Physician Forecasting in Virginia 2008-2030.
Henrico, Virginia. Available at:
http://www.dhp.virginia.gov/hwdc/docs/Physician2008/ForecastingSupplyAndDemand8-23-2010%20.pdf.
25
Petterson, S.M., Liaw, W.R., Phillips, R.L., Rabin, D.L., Meyers, D.S., and Basemore, A.W. (2012).
Projecting US primary care physician workforce needs: 2010-2025, Annals of Family Medicine, 10:503-
509.
26
Robert Graham Center (2013). State Workforce Projections. Accessed 10/22/2013 at
http://www.graham-center.org/online/graham/home/tools-resources/state-wrkfrc-proj-intro/state-wrkfrc-
proj.html
27
Robert Graham Center (2013). Oregon: Projecting Primary Care Physician Workforce. Accessed
10/22/2013 at http://www.graham-center.org/online/etc/medialib/graham/documents/tools-
resources/oregon-pdf.Par.0001.File.dat/Oregon_final.pdf. 28
Huang, E.S. and Finegold, K. (2013). Seven million Americans live in areas where demand for primary
care may exceed supply by more than 10 percent, Health Affairs, 32, no.3 (Online edition).
29
Bodenheimer, T. (2013). Primary care: Proposed solutions to the physician shortage without training
more physicians. Health Affairs, 32 no. 11:1881-1886.
30
Yarnall KSH, Østbye T, Krause KM, Pollak KI, Gradison M, Michener JL. (2009). Family physicians as
team leaders: “time” to share the care, Preventing Chronic Disease, 6, no.2. Available at
http://www.cdc.gov/pcd/issues/2009/apr/08_0023.htm.
44
31
Altschuler, J., Margolius, D., Bodenheimer, T., and Brumbach, K. (2012). Estimating a reasonable
patient panel size for primary care physicians with team-based task delegation, Annals of Family Medicine,
vol. 10, no. 5: 396-400.
32
Weiner, J.P., Yeh, S., and Blumenthal, D. (2013). The impact of health information technology and e-
health on the future demand for physician services,” Health Affairs, Nov. 32(11):1998–2004.
33
Green, L.V., Savin, S., and Lu, Y. (2013). Primary care physician shortages could be eliminated through
use of teams, nonphysicians, and electronic communication. Health Affairs, 32, no.1:11-19.
34
Cherry D., Lucas, C., and Decker, S.L. (2010). Population aging and the use of office-based physician
services. NCHS data brief, no. 41. National Center for Health Statistics, Hyattsville, MD.


![Welcome [ce.mayo.edu]€¦ · Web viewMayo Clinic School of Continuous Professional Development 10 th Annual Hospital Medicine for Nurse Practitioners and Physicians Assistants June](https://img.pdfslide.net/doc/110x75/5ecdaff9c36c81086508e443/welcome-cemayoedu-web-view-mayo-clinic-school-of-continuous-professional-development.jpg)