Embed Size (px)
Citation preview
Sept. 21, 2012 S2012-07 ISBN: 978-0-9883921-0-6
The Projected Economic Impact of Proposal 3 and Michigan’s Renewable Energy StandardBy David G. tuerck, paul Bachman and Michael Head
ABout tHe AutHorSDr. David G. Tuerck is executive director of the Beacon Hill Institute for public policy research at Suffolk university, where he also serves as chairman and professor of economics. He holds a ph.D. in economics from the university of Virginia and has written extensively on issues of taxation and public economics.
Paul Bachman is director of research at BHI. He manages the institute’s research projects, including the development and deployment of the StAMp® model. Mr. Bachman has authored research papers on state and national tax policy and on state labor policy and produces the institute’s state revenue forecasts for the Massachusetts legislature. He holds a Master of Science in International economics from Suffolk university.
Michael Head is a research economist at BHI. He holds a Master of Science in economic policy from Suffolk university.the authors would like to thank Frank Conte, BHI Director of Communications, for his editorial assistance.
Executive Summary* In October 2008, then-Gov. Jennifer Granholm signed into law the Clean, Renewable and Efficient Energy Act. The act imposed a “renewable energy standard” mandating that specific “renewable energy sources,” including wind, solar and biomass power, be used to generate 10 percent of retail electricity sales in Michigan by 2015. The law also mandates that lower but escalating percentages of retail electricity sales derive from renewable sources in 2012, 2013 and 2014.
The Beacon Hill Institute has used its State Tax Analysis Modeling Program — the STAMP® model — to estimate the economic effects of the RES mandates. In this study, we provide three estimates of the cost of the mandates —
* Citations provided in the main text.
low, medium and high — using different cost and capacity growth projections for renewable and conventional electricity-generating technologies. In our calculations, we set aside electricity rate cost caps in the RES in order to determine the economic impact on Michigan if the RES standard is met in full.
Our findings suggest that in 2015, because of the 2008 Clean, Renewable and Efficient Energy Act:
• The cost of electricity for the state’s consumers will be $950 million higher than it would have been otherwise, within a range of $850 million to $1.04 billion; and
• Michigan’s electricity prices will be 7.9 percent higher than they would have been otherwise, within a range of 7.0 percent to 8.6 percent.
These increased energy prices will affect Michigan’s households, businesses and economy. In 2015, the RES will:
• Lower employment by 7,220 jobs, within a range of 6,430 to 7,870;
• Reduce disposable income by $600 million, within a range of $540 million to $660 million;
• Reduce net investment by $83 million, within a range of $74 million to $91 million;
• Increase the average household’s annual electricity bill by $70, within a range of $65 to $80;
• Increase the average commercial business’s annual electricity bill by $650, within a range of $580 to $710; and
• Increase the average industrial business’s annual electricity bill by $21,470, within a range of $19,120 to $23,410.
the authors have written about other states’ renewable energy standards. Some of the language and organization from those studies appears again in this policy Brief.
2 MACkInAC CEnTER fOR PuBLIC POLICy
now there is a proposal to increase the standard. In July 2012, petition signatures were submitted by supporters of a “Michigan Energy, Michigan Jobs” ballot initiative that would incorporate a similar renewable energy standard in the state constitution. This proposed standard, also known as “25 x 25,” would increase the renewable energy requirement to 25 percent of retail electricity sales by 2025. The proposal ostensibly prevents the cost of compliance with the RES from causing consumers’ electricity bills to increase more than 1 percent annually. The proposal has been placed on the nov. 6, 2012, state general election ballot as Proposal 3.
use of the STAMP® model indicates that the proposed “Michigan Energy, Michigan Jobs” mandate would lead to electricity prices and economic costs even higher than the current policy. Setting aside the cost cap in the proposed standard, we predict that in 2025 the ballot measure would, in comparison to having no RES at all:
• Impose net costs on the Michigan economy of $2.55 billion, between a low estimate of $2.37 billion and a high estimate of $2.65 billion.
• Increase Michigan’s electricity prices by 16.2 percent, within a range of 15.1 percent to 16.9 percent.
• Lower employment by 10,540 jobs, within a range of 9,780 to 10,960 job losses;
• Lower disposable income by $1.42 billion, within a range of $1.32 billion to $1.47 billion;
• Reduce net investment by $147 million, within a range of $136 million to $153 million;
• Increase the average household‘s annual electricity bill by $180, within a range of $170 to $190;
• Increase the average commercial business’s annual electricity bill by $1,630, within a range of $1,520 to $1,700; and
• Increase the average industrial business’s annual electricity bill by $53,580, within a range of $49,730 to $55,680.
The cost caps included in the existing 10 percent RES and the proposed 25 percent RES could reduce the costs estimated above. It is not obvious, however, just how effective the caps would be in protecting Michigan’s economy. Electricity providers may be able to pass the costs of complying with the RES onto consumers in ways the caps do not prevent. If, on the other hand, the caps do protect ratepayers, the costs may end up being borne by the utilities — a dynamic that can also adversely affect the economy. And regardless of the caps, the cost of these renewable energy standards may be borne in part by residents not as ratepayers, but as taxpayers who must finance state and federal subsidies to renewable energy producers.
MACkInAC CEnTER fOR PuBLIC POLICy 3
Introduction: The Clean, Renewable and Efficient Energy ActIn October 2008, Michigan Gov. Jennifer Granholm signed into law Public Act 295, known as the Clean, Renewable and Efficient Energy Act.1 The law instituted the state’s “renewable energy standard.”2
This standard requires that the “renewable energy resources” specified in the bill generate 10 percent of the annual retail electricity sales made by investor-owned electric utilities, alternative suppliers, electric cooperatives and municipal electric utilities by the year 2015 and thereafter.3 under the law, renewable energy resources are “ultimately derived from solar power, water power, or wind power” and include biomass energy, geothermal energy and energy from landfill gas produced by municipal solid waste.4 The act stipulates that a renewable energy resource “does not include petroleum, nuclear, natural gas, or coal”; nor does it include a new hydroelectric facility or a “hydroelectric pumped storage facility.”5
The act also requires that before 2015, Michigan’s power suppliers steadily increase the percentage of electricity sold* from new renewable energy resources. The RES mandates that in 2012, providers supply enough electricity generated by renewable energy to cover 20 percent of the gap between 10 percent full compliance and baseline electricity production from renewable energy resources in the year prior to passage of the act. In 2013, 33 percent of the gap must be filled. In 2014, 50 percent of the gap between the baseline and full compliance must be covered, with full compliance required in 2015.6 The 10 percent standard would have to be maintained in subsequent years.7
The act also contains a cost cap meant to limit the impact on retail customers of implementing the renewable energy standard. This means that electricity providers are not required to comply if, as determined by the Michigan Public Service Commission, the cost to end-users has any of the following effects per month: The RES increases the average electricity bill by $3 for a residential customer meter; by $16.58 per commercial secondary customer meter; or by $187.50 per commercial primary or industrial customer meter.8
* ThemandatesintheClean,Renewable,andEfficientEnergyActaresometimes based on energy sales and sometimes on energy production. Compare, for instance, MCL § 460.1027(3), where computations involve generation and production, and MCL § 460.1027(4)(b), where computations involve the amount of electricity sold. As noted in the main text, the act contains a requirement for renewable energy capacity as well.
While the cost cap could prove effective in preventing large price increases, we set it aside in our calculations in order to determine the economic impact if the RES standard is met in full. We will discuss this assumption and its relationship to our findings below, but we would note that the cost caps do not apply to consumers’ overall electrical bills; rather, they “apply only to the incremental costs of compliance [with the RES] and do not apply to costs approved for recovery by the commission other than as provided in this act.”9 In other words, a consumer’s bill can rise by more than the cap as long as the amount considered attributable to the RES is less than the cap. In addition, if the Michigan Public Service Commission does enforce the cost caps, the cost of the policy would be reduced, but the direction of the standard’s effect would not change. The policy’s net costs would not become net benefits or vice versa.
The law assigns bonus credits for specific types of electricity generation.† Solar power generation effectively counts for three total megawatt-hours of production toward the RES: one for the actual production, and two bonus credits.10 In addition, renewable generation that takes place utilizing equipment manufactured in Michigan receives an additional 0.1 MWh, or 10 percent of one credit, for the first three years of production. Similarly, if in-state workers are used to build the facility, then an additional 0.1 MWh, or 10 percent of one credit, for the first three years of production is awarded.11 Despite the bonus credits, the u.S. Energy Information Administration’s projections — which account for Michigan’s RES — estimate that solar power will not deliver any significant electricity production in Michigan between now and 2035.12
Still, these large government subsidies may lead to the installation of solar energy, even in Michigan, where Detroit experiences approximately 20 percent clear days, 30 percent partly cloudy and 50 percent cloudy days.13 To take this possibility into account, we assumed that Michigan installs solar capacity equal to the projected national level of solar capacity. Each MWh produced would in effect count as three MWh under the RES, reducing the total amount of renewable energy required. This solar power scenario falls under our “high-cost case” below. In the early years of the RES, the relatively immature solar power market increases the net cost of the RES by displacing other renewables, such as biomass and wood waste, that are more affordable. As time
† MCL § 460.1039(2). these bonus credits are technically referred to as “Michigan incentive renewable energy credits.”
4 MACkInAC CEnTER fOR PuBLIC POLICy
passes, the cost of solar power would decline relative to other renewables.
Another component of the act — the banking of unused Renewable Energy Credits — could help defray costs.14 By producing more green energy than required by the act, energy suppliers could bank credits to use for RES compliance in the future. However, the EIA projections made prior to the law show a baseline scenario in which renewable electricity generations will fall below RES minimums. Therefore, it is unlikely that producers will supply excess renewable energy to trigger banking. Producers will use all renewable energy production to fulfill the requirement that same year, and not bank any for future compliance. for this reason, we assume that banking will have no effect on overall price of renewable energy production.
finally, the RES contains a costing provision that applies to two specific electricity companies. In addition to the percentage-based mandates discussed above, Public Act 295 institutes a separate renewable energy “capacity” requirement. This capacity standard requires that the companies install 500 megawatts of renewable energy capacity by the end of 2015 (with an interim mandate of 200 MW by the end of 2013) if they have between 1 million and 2 million retail customers as of Jan. 1, 2008. Similarly, utility companies with two million or more customers as of Jan. 1, 2008, must have 600 MW of renewable capacity by the end of 2015 and 300 MW by the end of 2013.15
Consumers Energy is the only utility that qualifies under the first case, while DTE Energy is the only utility that qualifies under the second. It is difficult to determine the exact cost effect of this section of the law, but a few details are obvious. first, both of these companies will need to build capacity, buy contracted capacity or buy RECs to cover their RES requirements. The first two would count toward the capacity requirement, while the third would not. So it appears that the capacity requirement was put in place to require these two larger companies not to fulfill their RES requirement via RECs only. Why part of the law would seemingly encourage the use of RECs while another section does not is not understood. We believe that this section of the law is adequately accounted for in our range of estimates.*
* Based on our projections, the reCs will have little effect on prices and therefore will not affect our range of estimates.
Proposal 3: The Proposed ‘25 x 25’ Amendment to the Michigan Constitutionfor some, the 10 percent RES does not go far enough. The group “Michigan Energy, Michigan Jobs” has filed an initiative petition often referred to as “25 x 25” and slated to appear on the nov. 6 ballot as Proposal 3. Proposal 3 would amend the Michigan Constitution to require electricity providers to increase the percentage of their annual retail electricity sales generated by “renewable electric energy sources” to 25 percent by 2025. These energy sources are broadly defined as “wind, solar, biomass and hydropower.” The initiative directs that the resulting program “shall be implemented incrementally and in a manner that fosters a diversity of energy generation technologies.”16
The initiative ostensibly encourages investment inside the state, stating, “facilities used for satisfying the standard shall be located within Michigan or within the retail customer service territory of any … [major] utility operating in Michigan.”17 The initiative also directs, “The legislature shall enact laws to promote and encourage the employment of Michigan residents and the use of equipment manufactured in Michigan in the production and distribution of electricity derived from clean renewable electric energy sources.”
The proposal also states, “To protect consumers, compliance with the clean renewable electric energy standard shall not cause rates charged by electricity providers to increase by more than 1% in any year.”18
note that here, as with the current 10 percent RES, the cost cap applies only to the cost attributable to compliance with the RES. A consumer’s bill would be permitted to rise by more than 1 percent as long as the amount considered attributable to the RES was less than 1 percent.
Considerations in Modeling the Proposed Amendment’s Economic EffectSupporters of the initiative argue it will help the state’s economy. A member of Gov. Granholm’s Green Energy Task force recently said about the initiative, “There’s [sic] billions of dollars in investments that are going to come into this type of program here.”19
While some new investment in the state is likely to result due to the mandate, other investment will be delayed or fully cancelled due to the higher expected electricity costs. The requirement of more renewable energy will
MACkInAC CEnTER fOR PuBLIC POLICy 5
Gfk 5: [DAn: THE LABEL On THE VERTICAL AXIS SHOuLD READ “.”]
lead to investment in renewable energy facilities, but the statement above does not consider the economy as a whole. Manufacturing plants and other companies which utilize large amounts of electricity will see the potential for large utility increases, as well as the uncertainty surrounding an ever-changing regulatory environment, as negatives. This would dynamically alter the total new investment in the state. In this study, we quantify the negative as well as the positive effects of the RES programs.
Since renewable energy generally costs more than conventional energy, many have voiced concerns about higher electricity rates. A wide variety of cost estimates exist for renewable electricity sources. The EIA provides estimates for the cost of conventional and renewable electricity generating technologies. However, the EIA’s assumptions are optimistic regarding the cost and capacity of renewable electricity generating sources to produce reliable energy.
We reviewed other academic literature and found that in most cases the EIA’s cost projections are at the low end of the range of estimates, while the EIA’s capacity factor for wind tends to be at the high end of the range. The EIA does not take into account the actual experience of existing renewable electricity power plants in Michigan. Therefore we provide three estimates of the cost of Michigan’s RES mandate — low, medium and high — using different cost and capacity factor estimates for electricity-generating technologies from the academic literature. See the Appendix for details.
One could justify the higher electricity costs if the environmental benefits — in terms of reduced greenhouse gases and other emissions — outweighed the costs. However, it is unclear that the use of renewable energy resources — especially wind and solar — significantly reduce GHG emissions. Due to their intermittency, wind and solar require significant backup power sources that are cycled up and down to accommodate the variability in the production of wind and solar power. A 2010 study by Bentek Energy LLC found that wind power actually increases pollution and greenhouse gas emissions due to cycling of coal plant capacity during fluctuations in wind power generation.20 Thus there appear to be few benefits to implementing RES policies based on heavy uses of wind.
Governments enact RES policies because most sources of renewable electricity generation are less efficient and thus more costly than conventional sources of generation. The RES policy forces utilities to buy
electricity from renewable sources and thus guarantees a market for them. These higher costs are passed on to electricity consumers, including residential, commercial and industrial customers.*
Increases in electricity costs are not unlike taxes in that they are known to have a profound negative effect on the economy. Prosperity and economic growth are dependent upon access to reliable and affordable energy. Since electricity is an essential commodity, consumers will have limited opportunity to avoid these costs. for the poorest members of society, these energy taxes will compete directly with essential purchases in the household budget, such as food, transportation and shelter.
As noted above, the proposed initiative contains a 1 percent cap on electricity rate increases due to the move to renewable energy. In this study, we set aside this cap in order to provide an apples-to-apples comparison between a baseline case, a 10 percent RES case and the proposed 25 percent RES by 2025.
Estimates and ResultsWe have applied the State Tax Analysis Modeling Program — known as STAMP® — to estimate the costs and economic effects of Michigan’s 2008 state RES mandate and the proposed “Michigan Energy, Michigan Jobs” ballot proposal. STAMP® is a comprehensive computer model that captures the detailed impact of tax and regulatory policy changes on a state’s economy.† To analyze this RES policy, the net percentage change in electricity was calculated and its effects were determined based on elasticities of economic variables with respect to changes in utility costs.‡ The modeling results appear below.
In light of the wide divergence in the costs and capacity factor estimates available for the different electricity generation technologies, we provide three estimates of the effects of Michigan’s RES mandate, using low,
* As noted earlier, for the purposes of determining the economic impact of the existing and proposed renewable energy standards if they were met in full, we have set aside the cost caps in both standards. We will return to the cost caps below in our discussion of the results from the model.
† Detailed information about the StAMp® model is located at http://goo.gl/3tCj3. In brief, however, StAMp® is a “computable generalized equilibrium model.” A CGe model is ‘computable’ in the sense that it requires the solution of a system of nonlinear simultaneous equations for each policy simulation. It is ‘general’ because it allows for the interdependence and interaction of all markets, their prices and their quantities. It is in “equilibrium” because supply is assumed to equal demand in each market.
‡ See Appendix for details.
6 MACkInAC CEnTER fOR PuBLIC POLICy
medium and high cost estimates of both renewable and conventional generation technologies. Each estimate represents the change that will take place in the indicated variable against the absence of the RES mandate. The Appendix details our methodology.
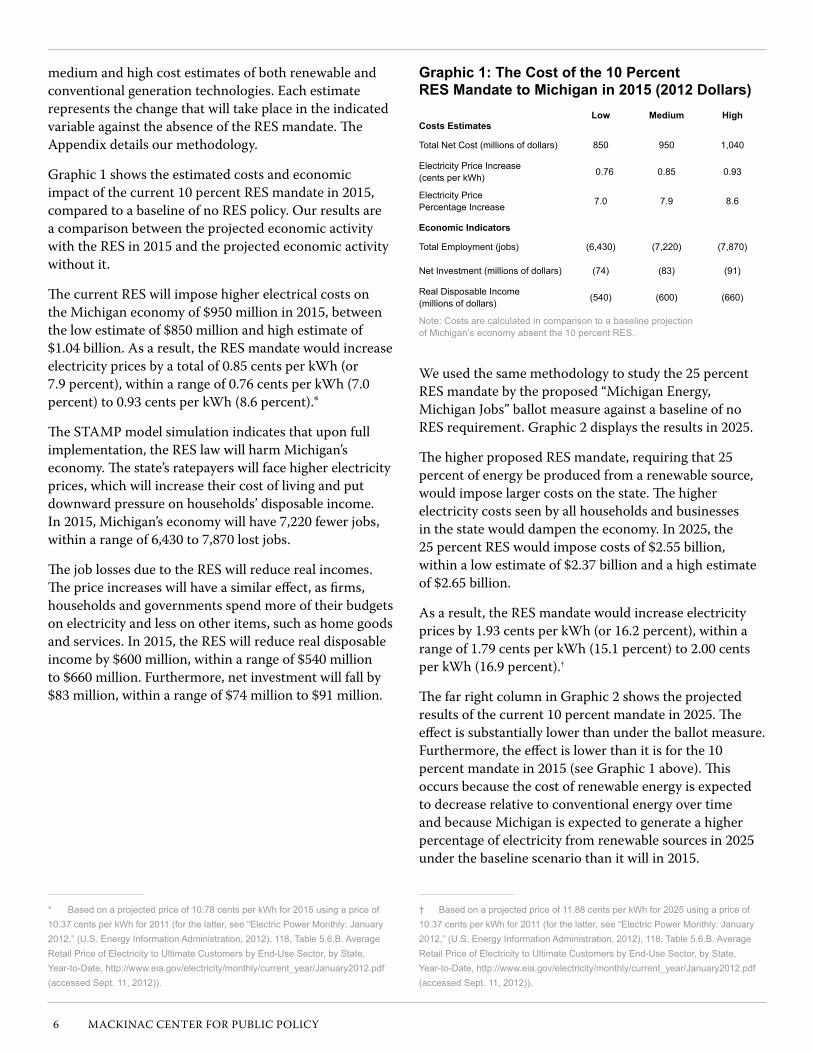
Graphic 1 shows the estimated costs and economic impact of the current 10 percent RES mandate in 2015, compared to a baseline of no RES policy. Our results are a comparison between the projected economic activity with the RES in 2015 and the projected economic activity without it.
The current RES will impose higher electrical costs on the Michigan economy of $950 million in 2015, between the low estimate of $850 million and high estimate of $1.04 billion. As a result, the RES mandate would increase electricity prices by a total of 0.85 cents per kWh (or 7.9 percent), within a range of 0.76 cents per kWh (7.0 percent) to 0.93 cents per kWh (8.6 percent).*
The STAMP model simulation indicates that upon full implementation, the RES law will harm Michigan’s economy. The state’s ratepayers will face higher electricity prices, which will increase their cost of living and put downward pressure on households’ disposable income. In 2015, Michigan’s economy will have 7,220 fewer jobs, within a range of 6,430 to 7,870 lost jobs.
The job losses due to the RES will reduce real incomes. The price increases will have a similar effect, as firms, households and governments spend more of their budgets on electricity and less on other items, such as home goods and services. In 2015, the RES will reduce real disposable income by $600 million, within a range of $540 million to $660 million. furthermore, net investment will fall by $83 million, within a range of $74 million to $91 million.
* Based on a projected price of 10.78 cents per kWh for 2015 using a price of 10.37 cents per kWh for 2011 (for the latter, see “electric power Monthly: January 2012,” (u.S. energy Information Administration, 2012), 118, table 5.6.B. Average retail price of electricity to ultimate Customers by end-use Sector, by State, Year-to-Date, http://www.eia.gov/electricity/monthly/current_year/January2012.pdf (accessed Sept. 11, 2012)).
Graphic 1: The Cost of the 10 Percent RES Mandate to Michigan in 2015 (2012 Dollars)
Low Medium HighCosts Estimates
total Net Cost (millions of dollars) 850 950 1,040
electricity price Increase (cents per kWh) 0.76 0.85 0.93
electricity price percentage Increase 7.0 7.9 8.6
Economic Indicators
total employment (jobs) (6,430) (7,220) (7,870)
Net Investment (millions of dollars) (74) (83) (91)
real Disposable Income (millions of dollars) (540) (600) (660)
Note: Costs are calculated in comparison to a baseline projection of Michigan’s economy absent the 10 percent reS.
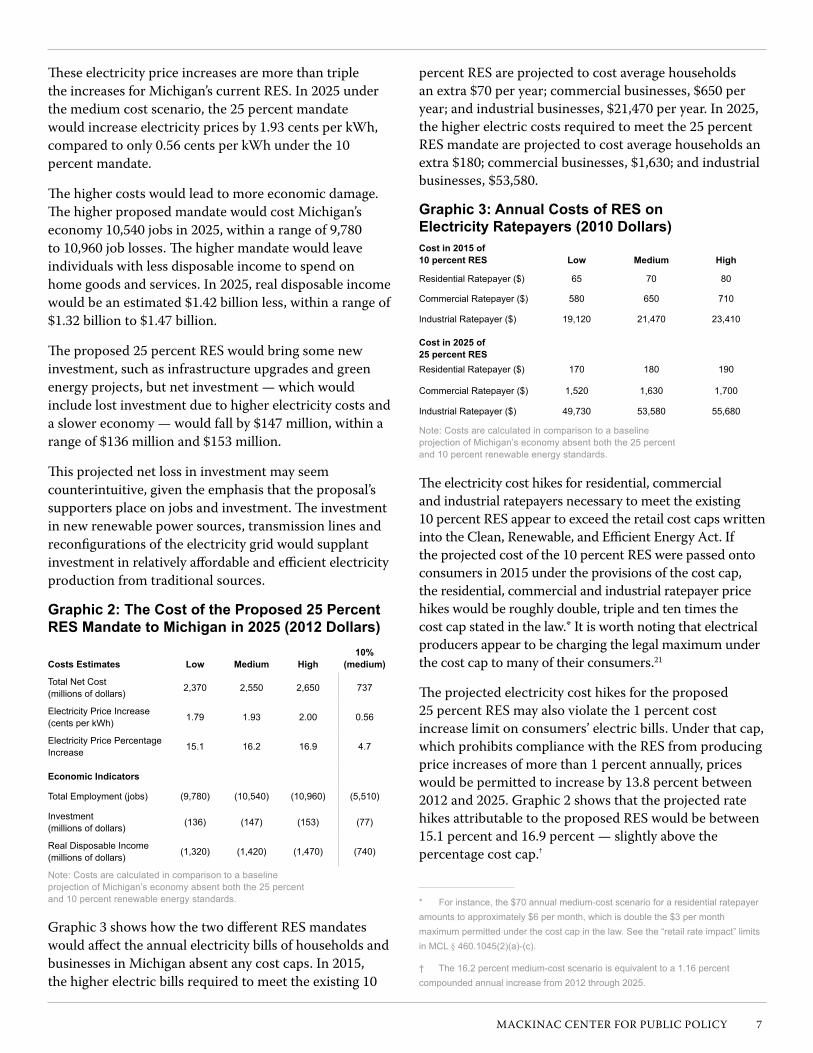
We used the same methodology to study the 25 percent RES mandate by the proposed “Michigan Energy, Michigan Jobs” ballot measure against a baseline of no RES requirement. Graphic 2 displays the results in 2025.
The higher proposed RES mandate, requiring that 25 percent of energy be produced from a renewable source, would impose larger costs on the state. The higher electricity costs seen by all households and businesses in the state would dampen the economy. In 2025, the 25 percent RES would impose costs of $2.55 billion, within a low estimate of $2.37 billion and a high estimate of $2.65 billion.
As a result, the RES mandate would increase electricity prices by 1.93 cents per kWh (or 16.2 percent), within a range of 1.79 cents per kWh (15.1 percent) to 2.00 cents per kWh (16.9 percent).†
The far right column in Graphic 2 shows the projected results of the current 10 percent mandate in 2025. The effect is substantially lower than under the ballot measure. furthermore, the effect is lower than it is for the 10 percent mandate in 2015 (see Graphic 1 above). This occurs because the cost of renewable energy is expected to decrease relative to conventional energy over time and because Michigan is expected to generate a higher percentage of electricity from renewable sources in 2025 under the baseline scenario than it will in 2015.
† Based on a projected price of 11.88 cents per kWh for 2025 using a price of 10.37 cents per kWh for 2011 (for the latter, see “electric power Monthly: January 2012,” (u.S. energy Information Administration, 2012), 118, table 5.6.B. Average retail price of electricity to ultimate Customers by end-use Sector, by State, Year-to-Date, http://www.eia.gov/electricity/monthly/current_year/January2012.pdf (accessed Sept. 11, 2012)).
MACkInAC CEnTER fOR PuBLIC POLICy 7
These electricity price increases are more than triple the increases for Michigan’s current RES. In 2025 under the medium cost scenario, the 25 percent mandate would increase electricity prices by 1.93 cents per kWh, compared to only 0.56 cents per kWh under the 10 percent mandate.
The higher costs would lead to more economic damage. The higher proposed mandate would cost Michigan’s economy 10,540 jobs in 2025, within a range of 9,780 to 10,960 job losses. The higher mandate would leave individuals with less disposable income to spend on home goods and services. In 2025, real disposable income would be an estimated $1.42 billion less, within a range of $1.32 billion to $1.47 billion.
The proposed 25 percent RES would bring some new investment, such as infrastructure upgrades and green energy projects, but net investment — which would include lost investment due to higher electricity costs and a slower economy — would fall by $147 million, within a range of $136 million and $153 million.
This projected net loss in investment may seem counterintuitive, given the emphasis that the proposal’s supporters place on jobs and investment. The investment in new renewable power sources, transmission lines and reconfigurations of the electricity grid would supplant investment in relatively affordable and efficient electricity production from traditional sources.
Graphic 2: The Cost of the Proposed 25 Percent RES Mandate to Michigan in 2025 (2012 Dollars)
Costs Estimates Low Medium High10%
(medium)
total Net Cost (millions of dollars) 2,370 2,550 2,650 737
electricity price Increase (cents per kWh) 1.79 1.93 2.00 0.56
electricity price percentage Increase 15.1 16.2 16.9 4.7
Economic Indicators
total employment (jobs) (9,780) (10,540) (10,960) (5,510)
Investment (millions of dollars) (136) (147) (153) (77)
real Disposable Income (millions of dollars) (1,320) (1,420) (1,470) (740)
Note: Costs are calculated in comparison to a baseline projection of Michigan’s economy absent both the 25 percent and 10 percent renewable energy standards.
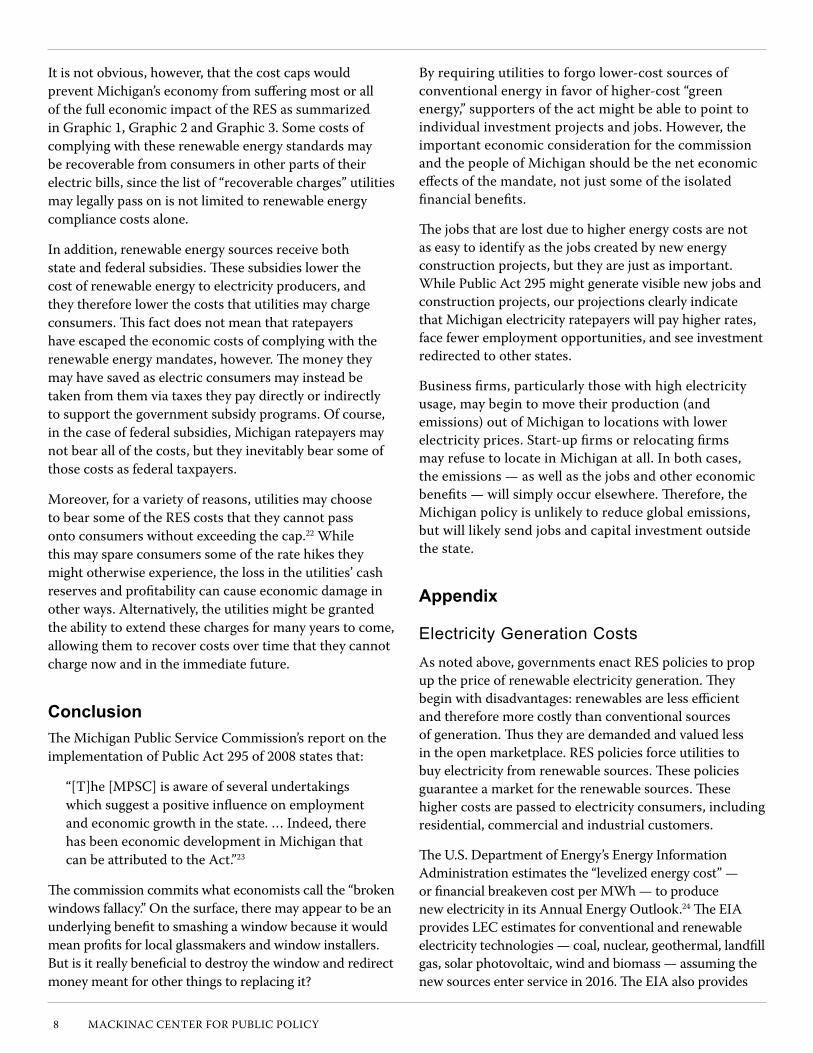
Graphic 3 shows how the two different RES mandates would affect the annual electricity bills of households and businesses in Michigan absent any cost caps. In 2015, the higher electric bills required to meet the existing 10
percent RES are projected to cost average households an extra $70 per year; commercial businesses, $650 per year; and industrial businesses, $21,470 per year. In 2025, the higher electric costs required to meet the 25 percent RES mandate are projected to cost average households an extra $180; commercial businesses, $1,630; and industrial businesses, $53,580.
Graphic 3: Annual Costs of RES on Electricity Ratepayers (2010 Dollars)Cost in 2015 of 10 percent RES Low Medium High
residential ratepayer ($) 65 70 80
Commercial ratepayer ($) 580 650 710
Industrial ratepayer ($) 19,120 21,470 23,410
Cost in 2025 of 25 percent RESresidential ratepayer ($) 170 180 190
Commercial ratepayer ($) 1,520 1,630 1,700
Industrial ratepayer ($) 49,730 53,580 55,680
Note: Costs are calculated in comparison to a baseline projection of Michigan’s economy absent both the 25 percent and 10 percent renewable energy standards.
The electricity cost hikes for residential, commercial and industrial ratepayers necessary to meet the existing 10 percent RES appear to exceed the retail cost caps written into the Clean, Renewable, and Efficient Energy Act. If the projected cost of the 10 percent RES were passed onto consumers in 2015 under the provisions of the cost cap, the residential, commercial and industrial ratepayer price hikes would be roughly double, triple and ten times the cost cap stated in the law.* It is worth noting that electrical producers appear to be charging the legal maximum under the cost cap to many of their consumers.21
The projected electricity cost hikes for the proposed 25 percent RES may also violate the 1 percent cost increase limit on consumers’ electric bills. under that cap, which prohibits compliance with the RES from producing price increases of more than 1 percent annually, prices would be permitted to increase by 13.8 percent between 2012 and 2025. Graphic 2 shows that the projected rate hikes attributable to the proposed RES would be between 15.1 percent and 16.9 percent — slightly above the percentage cost cap.†
* For instance, the $70 annual medium-cost scenario for a residential ratepayer amounts to approximately $6 per month, which is double the $3 per month maximum permitted under the cost cap in the law. See the “retail rate impact” limits in MCL § 460.1045(2)(a)-(c).
† the 16.2 percent medium-cost scenario is equivalent to a 1.16 percent compounded annual increase from 2012 through 2025.
8 MACkInAC CEnTER fOR PuBLIC POLICy
It is not obvious, however, that the cost caps would prevent Michigan’s economy from suffering most or all of the full economic impact of the RES as summarized in Graphic 1, Graphic 2 and Graphic 3. Some costs of complying with these renewable energy standards may be recoverable from consumers in other parts of their electric bills, since the list of “recoverable charges” utilities may legally pass on is not limited to renewable energy compliance costs alone.
In addition, renewable energy sources receive both state and federal subsidies. These subsidies lower the cost of renewable energy to electricity producers, and they therefore lower the costs that utilities may charge consumers. This fact does not mean that ratepayers have escaped the economic costs of complying with the renewable energy mandates, however. The money they may have saved as electric consumers may instead be taken from them via taxes they pay directly or indirectly to support the government subsidy programs. Of course, in the case of federal subsidies, Michigan ratepayers may not bear all of the costs, but they inevitably bear some of those costs as federal taxpayers.
Moreover, for a variety of reasons, utilities may choose to bear some of the RES costs that they cannot pass onto consumers without exceeding the cap.22 While this may spare consumers some of the rate hikes they might otherwise experience, the loss in the utilities’ cash reserves and profitability can cause economic damage in other ways. Alternatively, the utilities might be granted the ability to extend these charges for many years to come, allowing them to recover costs over time that they cannot charge now and in the immediate future.
ConclusionThe Michigan Public Service Commission’s report on the implementation of Public Act 295 of 2008 states that:
“[T]he [MPSC] is aware of several undertakings which suggest a positive influence on employment and economic growth in the state. … Indeed, there has been economic development in Michigan that can be attributed to the Act.”23
The commission commits what economists call the “broken windows fallacy.” On the surface, there may appear to be an underlying benefit to smashing a window because it would mean profits for local glassmakers and window installers. But is it really beneficial to destroy the window and redirect money meant for other things to replacing it?
By requiring utilities to forgo lower-cost sources of conventional energy in favor of higher-cost “green energy,” supporters of the act might be able to point to individual investment projects and jobs. However, the important economic consideration for the commission and the people of Michigan should be the net economic effects of the mandate, not just some of the isolated financial benefits.
The jobs that are lost due to higher energy costs are not as easy to identify as the jobs created by new energy construction projects, but they are just as important. While Public Act 295 might generate visible new jobs and construction projects, our projections clearly indicate that Michigan electricity ratepayers will pay higher rates, face fewer employment opportunities, and see investment redirected to other states.
Business firms, particularly those with high electricity usage, may begin to move their production (and emissions) out of Michigan to locations with lower electricity prices. Start-up firms or relocating firms may refuse to locate in Michigan at all. In both cases, the emissions — as well as the jobs and other economic benefits — will simply occur elsewhere. Therefore, the Michigan policy is unlikely to reduce global emissions, but will likely send jobs and capital investment outside the state.
Appendix
electricity Generation CostsAs noted above, governments enact RES policies to prop up the price of renewable electricity generation. They begin with disadvantages: renewables are less efficient and therefore more costly than conventional sources of generation. Thus they are demanded and valued less in the open marketplace. RES policies force utilities to buy electricity from renewable sources. These policies guarantee a market for the renewable sources. These higher costs are passed to electricity consumers, including residential, commercial and industrial customers.
The u.S. Department of Energy’s Energy Information Administration estimates the “levelized energy cost” — or financial breakeven cost per MWh — to produce new electricity in its Annual Energy Outlook.24 The EIA provides LEC estimates for conventional and renewable electricity technologies — coal, nuclear, geothermal, landfill gas, solar photovoltaic, wind and biomass — assuming the new sources enter service in 2016. The EIA also provides
MACkInAC CEnTER fOR PuBLIC POLICy 9
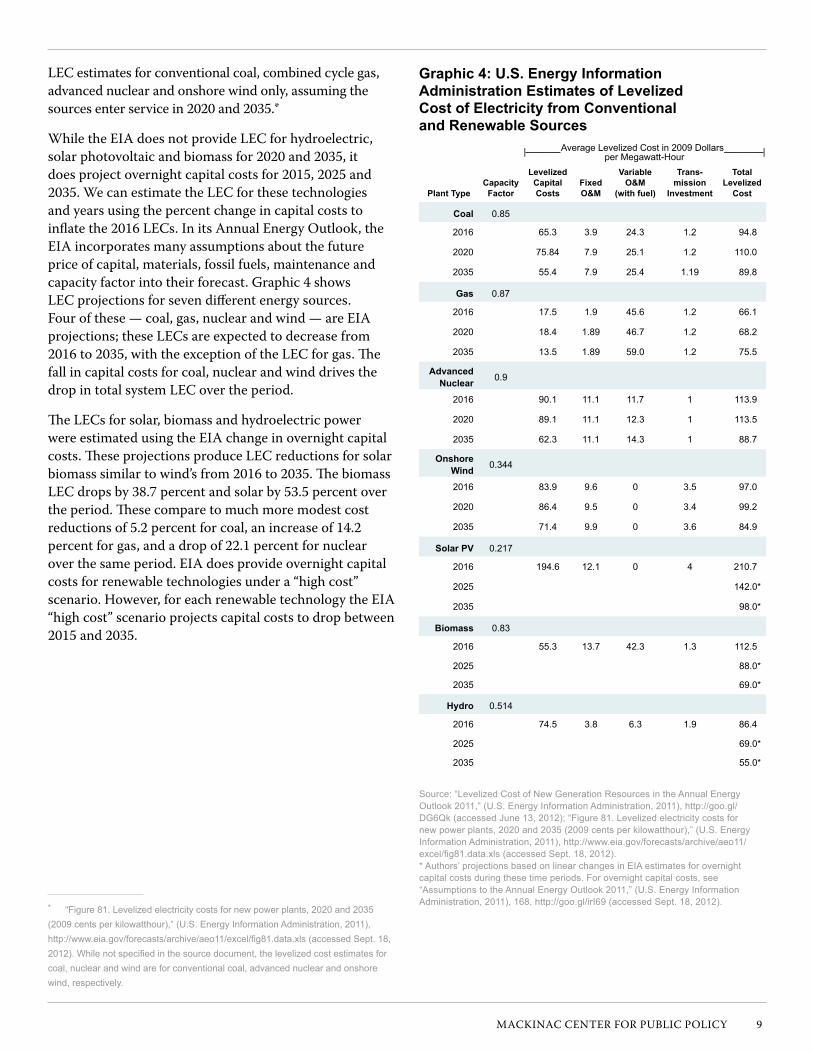
LEC estimates for conventional coal, combined cycle gas, advanced nuclear and onshore wind only, assuming the sources enter service in 2020 and 2035.*
While the EIA does not provide LEC for hydroelectric, solar photovoltaic and biomass for 2020 and 2035, it does project overnight capital costs for 2015, 2025 and 2035. We can estimate the LEC for these technologies and years using the percent change in capital costs to inflate the 2016 LECs. In its Annual Energy Outlook, the EIA incorporates many assumptions about the future price of capital, materials, fossil fuels, maintenance and capacity factor into their forecast. Graphic 4 shows LEC projections for seven different energy sources. four of these — coal, gas, nuclear and wind — are EIA projections; these LECs are expected to decrease from 2016 to 2035, with the exception of the LEC for gas. The fall in capital costs for coal, nuclear and wind drives the drop in total system LEC over the period.
The LECs for solar, biomass and hydroelectric power were estimated using the EIA change in overnight capital costs. These projections produce LEC reductions for solar biomass similar to wind’s from 2016 to 2035. The biomass LEC drops by 38.7 percent and solar by 53.5 percent over the period. These compare to much more modest cost reductions of 5.2 percent for coal, an increase of 14.2 percent for gas, and a drop of 22.1 percent for nuclear over the same period. EIA does provide overnight capital costs for renewable technologies under a “high cost” scenario. However, for each renewable technology the EIA “high cost” scenario projects capital costs to drop between 2015 and 2035.
* “Figure 81. Levelized electricity costs for new power plants, 2020 and 2035 (2009 cents per kilowatthour),” (u.S. energy Information Administration, 2011), http://www.eia.gov/forecasts/archive/aeo11/excel/fig81.data.xls(accessedSept.18,2012).Whilenotspecifiedinthesourcedocument,thelevelizedcostestimatesforcoal, nuclear and wind are for conventional coal, advanced nuclear and onshore wind, respectively.
Graphic 4: U.S. Energy Information Administration Estimates of Levelized Cost of Electricity from Conventional and Renewable Sources
|---------------- Average Levelized Cost in 2009 Dollars------------------| per Megawatt-Hour
Plant TypeCapacity
Factor
Levelized Capital Costs
Fixed O&M
Variable O&M
(with fuel)
Trans-mission
Investment
Total Levelized
Cost
Coal 0.85
2016 65.3 3.9 24.3 1.2 94.8
2020 75.84 7.9 25.1 1.2 110.0
2035 55.4 7.9 25.4 1.19 89.8
Gas 0.87
2016 17.5 1.9 45.6 1.2 66.1
2020 18.4 1.89 46.7 1.2 68.2
2035 13.5 1.89 59.0 1.2 75.5
Advanced Nuclear 0.9
2016 90.1 11.1 11.7 1 113.9
2020 89.1 11.1 12.3 1 113.5
2035 62.3 11.1 14.3 1 88.7
Onshore Wind 0.344
2016 83.9 9.6 0 3.5 97.0
2020 86.4 9.5 0 3.4 99.2
2035 71.4 9.9 0 3.6 84.9
Solar PV 0.217
2016 194.6 12.1 0 4 210.7
2025 142.0*
2035 98.0*
Biomass 0.83
2016 55.3 13.7 42.3 1.3 112.5
2025 88.0*
2035 69.0*
Hydro 0.514
2016 74.5 3.8 6.3 1.9 86.4
2025 69.0*
2035 55.0*
Source: “Levelized Cost of New Generation resources in the Annual energy outlook 2011,” (u.S. energy Information Administration, 2011), http://goo.gl/DG6Qk (accessed June 13, 2012); “Figure 81. Levelized electricity costs for new power plants, 2020 and 2035 (2009 cents per kilowatthour),” (u.S. energy Information Administration, 2011), http://www.eia.gov/forecasts/archive/aeo11/excel/fig81.data.xls(accessedSept.18,2012). * Authors’ projections based on linear changes in eIA estimates for overnight capital costs during these time periods. For overnight capital costs, see “Assumptions to the Annual energy outlook 2011,” (u.S. energy Information Administration, 2011), 168, http://goo.gl/irI69 (accessed Sept. 18, 2012).
10 MACkInAC CEnTER fOR PuBLIC POLICy
Graphic 4 also displays capacity factors for each technology. The capacity factor measures the ratio of electrical energy produced by a generating unit over a period of time to the electrical energy that could have been produced at 100 percent operation during the same period. In this case, the capacity factor measures the potential productivity of the generating technology. Solar, wind and hydroelectric have the lowest capacity factors due to the intermittent nature of their power sources. EIA projects a 34.4 percent capacity factor for onshore wind power, which, as we will see below, appears to be at the high end of any range of estimates.
Estimating a capacity factor for wind power is particularly challenging. Wind is not only intermittent but its variation is unpredictable, making it impossible to dispatch to the grid with any certainty. This unique aspect of wind power argues for a capacity factor rating of close to zero. nevertheless, wind capacity factors have been estimated to be between 20 percent and 40 percent.25 The other variables that affect the capacity factor of wind are the quality and consistency of the wind, and the size and technology of the wind turbines deployed. As the u.S. and other countries add more wind power over time, presumably the wind turbine technology will improve, but the new locations for power plants will likely have less productive wind resources.
The EIA estimates of LEC and capacity factors paint a particularly rosy view of the future cost of renewable electricity generation, particularly wind. Other forecasters and the experience of current renewable energy projects portray a less sanguine outlook.
Today, wind and biomass are the largest renewable power sources and are the most likely to satisfy future RES mandates. The most prominent issues that will affect the future availability and cost of renewable electricity resources are diminishing marginal returns and competition for scarce resources. These issues will affect wind and biomass in different ways as state RES mandates ratchet up over the next decade.
Both wind and biomass resources face land-use issues. Conventional energy plants can be built within a space of several acres, but a wind power plant with the same nameplate capacity (not actual capacity) would require many square miles of land. According to one study, wind power would require 7,579 miles of mountain ridgeline to satisfy current state RES mandates and a 20 percent federal mandate by 2025.26 Mountain ridgelines produce
the most promising locations for electric wind production in the eastern and far western united States.
After taking into account capacity factors, a wind power plant would need a land mass of 20 by 25 kilometers to produce the same energy as a nuclear power plant that can be situated on 500 meters square (one-quarter square kilometer).27
The need for large areas of land to site wind power plants will require the purchase of vast areas of land by private wind developers, and/or allowing wind production on public lands. In either case land acquisition/rent or public permitting processes will likely increase costs as wind power plants are built. Offshore wind is vastly more expensive than onshore wind power and suffers from the same type of permitting process faced by onshore wind power plants, as seen in the 10-year permitting process for the planned Cape Wind project off the coast of Massachusetts.
The swift expansion of wind power will also suffer from diminishing marginal returns as new wind capacity will be located in areas with lower and less consistent wind speeds. As a result, fewer megawatt-hours of power will be produced from newly built wind projects. Moreover the new wind capacity will be developed in increasingly remote areas that will require larger investments in transmission and distribution, which will drive costs even higher.
The EIA estimates of the average capacity factor used for onshore wind power plants, at 34.4 percent, appears to be at the higher end of the estimates for current wind projects. This figure is inconsistent with estimates from other studies.28 According to the EIA’s own reporting from 137 current wind power plants in 2003, the average capacity factor was 26.9 percent.29 In addition, a recent analysis of wind capacity factors around the world finds an actual average capacity factor of 21 percent.30 Moreover, other estimates find capacity factors in the mid-teens and as low as 13 percent.31
Biomass is a more promising renewable power source. Biomass combines low incremental costs relative to other renewable technologies and reliability. Biomass is not intermittent and therefore it is distributable with a capacity factor that is competitive with conventional energy sources. Moreover, biomass plants can be located close to urban areas with high electricity demand. But biomass electricity suffers from land use issues even more so than wind.
The expansion of biomass power plants will require huge additional sources of fuel. Wood and wood waste comprise the largest source of biomass energy today. According to the national Renewable Energy Laboratory, other sources
MACkInAC CEnTER fOR PuBLIC POLICy 11
of biomass “include food crops, grassy and woody plants, residues from agriculture or forestry, oil-rich algae, and the organic component of municipal and industrial wastes.”32 Biomass power plants will compete directly with other sectors (construction, paper, furniture) of the economy for wood, food products and arable land.
One study estimates that 66 million acres of land would be required to provide enough fuel to satisfy the current state RES mandates and a 20 percent federal RES in 2025.33 When the clearing of new farm and forestlands are figured into the GHG production of biomass, it is likely that biomass increases GHG emissions.
The competition for farm and forestry resources would not only cause biomass fuel prices to skyrocket, but also cause the prices of domestically produced food, lumber, furniture and other products to rise. The recent experience of ethanol and its role in surging corn prices can be causally linked to the recent food riots in Mexico,34 and also to the struggle facing international aid organizations that address hunger in places such as the Darfur region of Sudan.35 These two examples serve as reminders of the unintended consequences of government mandates for biofuels. The lesson is clear: Biofuels compete with food production and other basic products, and distort the market.
Calculation of the Net Cost of New renewable electricityTo calculate the cost of renewable energy under the RES, BHI used data from the Energy Information Administration, a division of the u.S. Department of Energy, to determine the percent increase in utility costs that Michigan residents and businesses would experience. This calculated percent change was then applied to calculated elasticities, as described in the STAMP® modeling section.
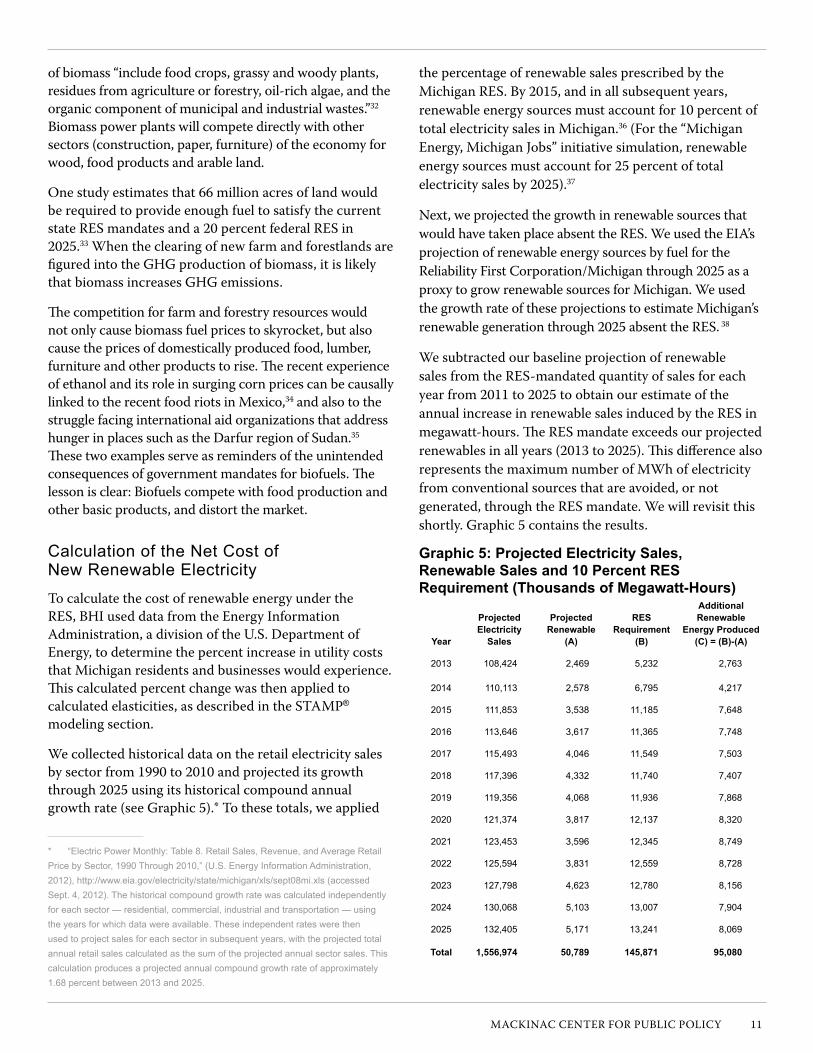
We collected historical data on the retail electricity sales by sector from 1990 to 2010 and projected its growth through 2025 using its historical compound annual growth rate (see Graphic 5).* To these totals, we applied
* “electric power Monthly: table 8. retail Sales, revenue, and Average retail price by Sector, 1990 through 2010,” (u.S. energy Information Administration, 2012), http://www.eia.gov/electricity/state/michigan/xls/sept08mi.xls (accessed Sept. 4, 2012). the historical compound growth rate was calculated independently for each sector — residential, commercial, industrial and transportation — using the years for which data were available. these independent rates were then used to project sales for each sector in subsequent years, with the projected total annual retail sales calculated as the sum of the projected annual sector sales. this calculation produces a projected annual compound growth rate of approximately 1.68 percent between 2013 and 2025.
the percentage of renewable sales prescribed by the Michigan RES. By 2015, and in all subsequent years, renewable energy sources must account for 10 percent of total electricity sales in Michigan.36 (for the “Michigan Energy, Michigan Jobs” initiative simulation, renewable energy sources must account for 25 percent of total electricity sales by 2025).37
next, we projected the growth in renewable sources that would have taken place absent the RES. We used the EIA’s projection of renewable energy sources by fuel for the Reliability first Corporation/Michigan through 2025 as a proxy to grow renewable sources for Michigan. We used the growth rate of these projections to estimate Michigan’s renewable generation through 2025 absent the RES. 38
We subtracted our baseline projection of renewable sales from the RES-mandated quantity of sales for each year from 2011 to 2025 to obtain our estimate of the annual increase in renewable sales induced by the RES in megawatt-hours. The RES mandate exceeds our projected renewables in all years (2013 to 2025). This difference also represents the maximum number of MWh of electricity from conventional sources that are avoided, or not generated, through the RES mandate. We will revisit this shortly. Graphic 5 contains the results.
Graphic 5: Projected Electricity Sales, Renewable Sales and 10 Percent RES Requirement (Thousands of Megawatt-Hours)
Year
Projected Electricity
Sales
Projected Renewable
(A)
RES Requirement
(B)
Additional Renewable
Energy Produced(C) = (B)-(A)
2013 108,424 2,469 5,232 2,763
2014 110,113 2,578 6,795 4,217
2015 111,853 3,538 11,185 7,648
2016 113,646 3,617 11,365 7,748
2017 115,493 4,046 11,549 7,503
2018 117,396 4,332 11,740 7,407
2019 119,356 4,068 11,936 7,868
2020 121,374 3,817 12,137 8,320
2021 123,453 3,596 12,345 8,749
2022 125,594 3,831 12,559 8,728
2023 127,798 4,623 12,780 8,156
2024 130,068 5,103 13,007 7,904
2025 132,405 5,171 13,241 8,069
Total 1,556,974 50,789 145,871 95,080
12 MACkInAC CEnTER fOR PuBLIC POLICy
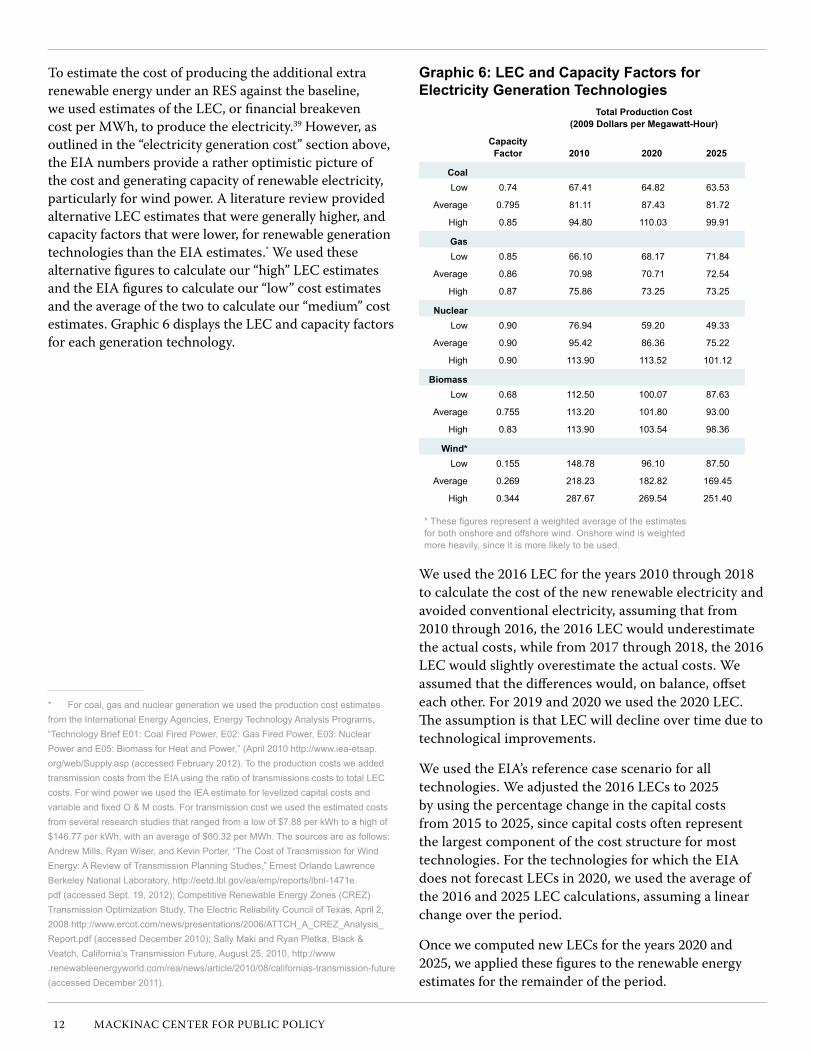
To estimate the cost of producing the additional extra renewable energy under an RES against the baseline, we used estimates of the LEC, or financial breakeven cost per MWh, to produce the electricity.39 However, as outlined in the “electricity generation cost” section above, the EIA numbers provide a rather optimistic picture of the cost and generating capacity of renewable electricity, particularly for wind power. A literature review provided alternative LEC estimates that were generally higher, and capacity factors that were lower, for renewable generation technologies than the EIA estimates.* We used these alternative figures to calculate our “high” LEC estimates and the EIA figures to calculate our “low” cost estimates and the average of the two to calculate our “medium” cost estimates. Graphic 6 displays the LEC and capacity factors for each generation technology.
* For coal, gas and nuclear generation we used the production cost estimates from the International energy Agencies, energy technology Analysis programs, “technology Brief e01: Coal Fired power, e02: Gas Fired power, e03: Nuclear power and e05: Biomass for Heat and power,” (April 2010 http://www.iea-etsap.org/web/Supply.asp (accessed February 2012). to the production costs we added transmission costs from the eIA using the ratio of transmissions costs to total LeC costs. For wind power we used the IeA estimate for levelized capital costs and variableandfixedO&Mcosts.Fortransmissioncostweusedtheestimatedcostsfrom several research studies that ranged from a low of $7.88 per kWh to a high of $146.77 per kWh, with an average of $60.32 per MWh. the sources are as follows: Andrew Mills, ryan Wiser, and Kevin porter, “the Cost of transmission for Wind energy: A review of transmission planning Studies,” ernest orlando Lawrence Berkeley National Laboratory, http://eetd.lbl.gov/ea/emp/reports/lbnl-1471e.pdf (accessed Sept. 19, 2012); Competitive renewable energy Zones (CreZ) transmission optimization Study, the electric reliability Council of texas, April 2, 2008 http://www.ercot.com/news/presentations/2006/AttCH_A_CreZ_Analysis_report.pdf(accessedDecember2010);SallyMakiandRyanPletka,Black&Veatch, California’s transmission Future, August 25, 2010, http://www .renewableenergyworld.com/rea/news/article/2010/08/californias-transmission-future (accessed December 2011).
Graphic 6: LEC and Capacity Factors for Electricity Generation Technologies
Total Production Cost (2009 Dollars per Megawatt-Hour)
Capacity Factor 2010 2020 2025
CoalLow 0.74 67.41 64.82 63.53
Average 0.795 81.11 87.43 81.72
High 0.85 94.80 110.03 99.91
GasLow 0.85 66.10 68.17 71.84
Average 0.86 70.98 70.71 72.54
High 0.87 75.86 73.25 73.25
NuclearLow 0.90 76.94 59.20 49.33
Average 0.90 95.42 86.36 75.22
High 0.90 113.90 113.52 101.12
BiomassLow 0.68 112.50 100.07 87.63
Average 0.755 113.20 101.80 93.00
High 0.83 113.90 103.54 98.36
Wind*Low 0.155 148.78 96.10 87.50
Average 0.269 218.23 182.82 169.45
High 0.344 287.67 269.54 251.40
*Thesefiguresrepresentaweightedaverageoftheestimatesfor both onshore and offshore wind. onshore wind is weighted more heavily, since it is more likely to be used.
We used the 2016 LEC for the years 2010 through 2018 to calculate the cost of the new renewable electricity and avoided conventional electricity, assuming that from 2010 through 2016, the 2016 LEC would underestimate the actual costs, while from 2017 through 2018, the 2016 LEC would slightly overestimate the actual costs. We assumed that the differences would, on balance, offset each other. for 2019 and 2020 we used the 2020 LEC. The assumption is that LEC will decline over time due to technological improvements.
We used the EIA’s reference case scenario for all technologies. We adjusted the 2016 LECs to 2025 by using the percentage change in the capital costs from 2015 to 2025, since capital costs often represent the largest component of the cost structure for most technologies. for the technologies for which the EIA does not forecast LECs in 2020, we used the average of the 2016 and 2025 LEC calculations, assuming a linear change over the period.
Once we computed new LECs for the years 2020 and 2025, we applied these figures to the renewable energy estimates for the remainder of the period.
MACkInAC CEnTER fOR PuBLIC POLICy 13
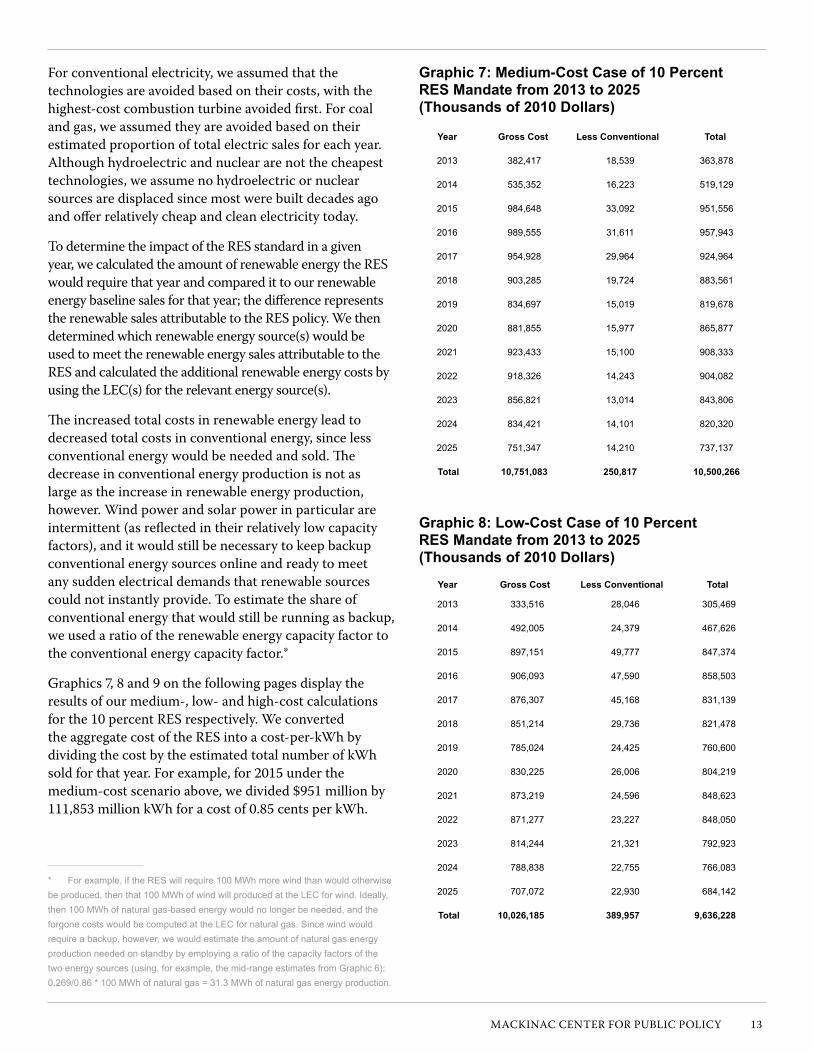
Graphic 7: Medium-Cost Case of 10 Percent RES Mandate from 2013 to 2025 (Thousands of 2010 Dollars)
Year Gross Cost Less Conventional Total
2013 382,417 18,539 363,878
2014 535,352 16,223 519,129
2015 984,648 33,092 951,556
2016 989,555 31,611 957,943
2017 954,928 29,964 924,964
2018 903,285 19,724 883,561
2019 834,697 15,019 819,678
2020 881,855 15,977 865,877
2021 923,433 15,100 908,333
2022 918,326 14,243 904,082
2023 856,821 13,014 843,806
2024 834,421 14,101 820,320
2025 751,347 14,210 737,137
Total 10,751,083 250,817 10,500,266
Graphic 8: Low-Cost Case of 10 Percent RES Mandate from 2013 to 2025 (Thousands of 2010 Dollars)
Year Gross Cost Less Conventional Total
2013 333,516 28,046 305,469
2014 492,005 24,379 467,626
2015 897,151 49,777 847,374
2016 906,093 47,590 858,503
2017 876,307 45,168 831,139
2018 851,214 29,736 821,478
2019 785,024 24,425 760,600
2020 830,225 26,006 804,219
2021 873,219 24,596 848,623
2022 871,277 23,227 848,050
2023 814,244 21,321 792,923
2024 788,838 22,755 766,083
2025 707,072 22,930 684,142
Total 10,026,185 389,957 9,636,228
for conventional electricity, we assumed that the technologies are avoided based on their costs, with the highest-cost combustion turbine avoided first. for coal and gas, we assumed they are avoided based on their estimated proportion of total electric sales for each year. Although hydroelectric and nuclear are not the cheapest technologies, we assume no hydroelectric or nuclear sources are displaced since most were built decades ago and offer relatively cheap and clean electricity today.
To determine the impact of the RES standard in a given year, we calculated the amount of renewable energy the RES would require that year and compared it to our renewable energy baseline sales for that year; the difference represents the renewable sales attributable to the RES policy. We then determined which renewable energy source(s) would be used to meet the renewable energy sales attributable to the RES and calculated the additional renewable energy costs by using the LEC(s) for the relevant energy source(s).
The increased total costs in renewable energy lead to decreased total costs in conventional energy, since less conventional energy would be needed and sold. The decrease in conventional energy production is not as large as the increase in renewable energy production, however. Wind power and solar power in particular are intermittent (as reflected in their relatively low capacity factors), and it would still be necessary to keep backup conventional energy sources online and ready to meet any sudden electrical demands that renewable sources could not instantly provide. To estimate the share of conventional energy that would still be running as backup, we used a ratio of the renewable energy capacity factor to the conventional energy capacity factor.*
Graphics 7, 8 and 9 on the following pages display the results of our medium-, low- and high-cost calculations for the 10 percent RES respectively. We converted the aggregate cost of the RES into a cost-per-kWh by dividing the cost by the estimated total number of kWh sold for that year. for example, for 2015 under the medium-cost scenario above, we divided $951 million by 111,853 million kWh for a cost of 0.85 cents per kWh.
* For example, if the reS will require 100 MWh more wind than would otherwise be produced, then that 100 MWh of wind will produced at the LeC for wind. Ideally, then 100 MWh of natural gas-based energy would no longer be needed, and the forgone costs would be computed at the LeC for natural gas. Since wind would require a backup, however, we would estimate the amount of natural gas energy production needed on standby by employing a ratio of the capacity factors of the two energy sources (using, for example, the mid-range estimates from Graphic 6): 0.269/0.86 * 100 MWh of natural gas = 31.3 MWh of natural gas energy production.
14 MACkInAC CEnTER fOR PuBLIC POLICy
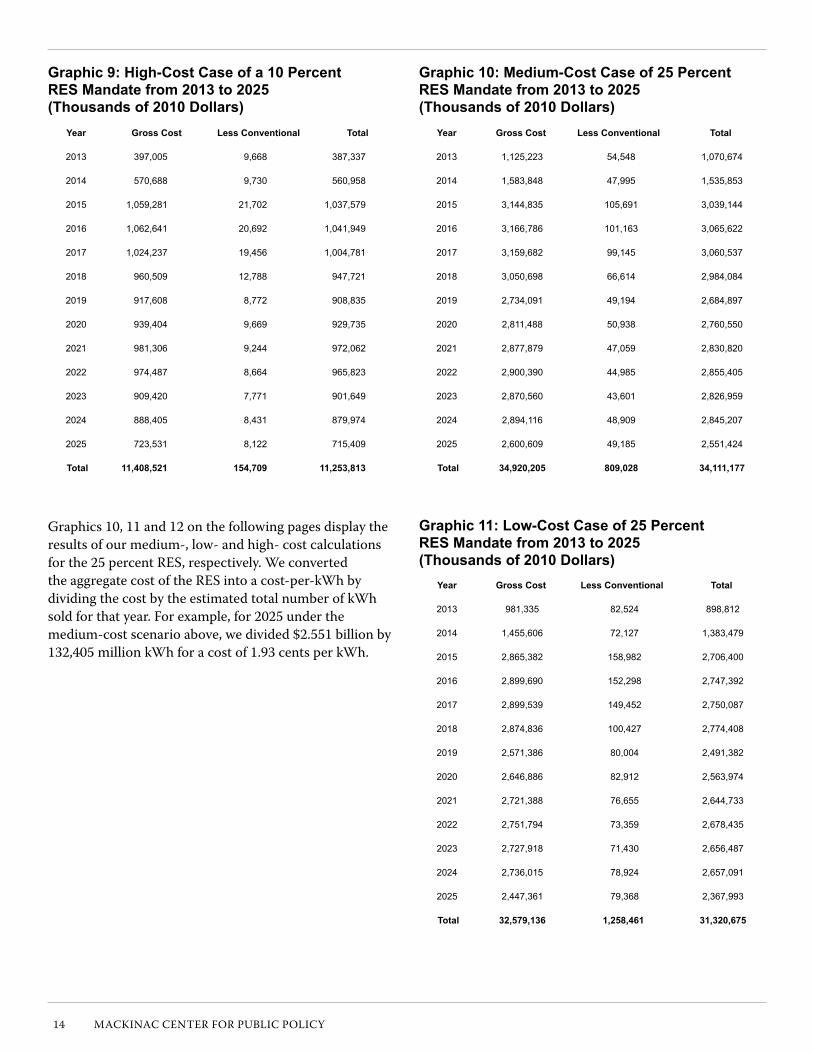
Graphic 9: High-Cost Case of a 10 Percent RES Mandate from 2013 to 2025 (Thousands of 2010 Dollars)
Year Gross Cost Less Conventional Total
2013 397,005 9,668 387,337
2014 570,688 9,730 560,958
2015 1,059,281 21,702 1,037,579
2016 1,062,641 20,692 1,041,949
2017 1,024,237 19,456 1,004,781
2018 960,509 12,788 947,721
2019 917,608 8,772 908,835
2020 939,404 9,669 929,735
2021 981,306 9,244 972,062
2022 974,487 8,664 965,823
2023 909,420 7,771 901,649
2024 888,405 8,431 879,974
2025 723,531 8,122 715,409
Total 11,408,521 154,709 11,253,813
Graphics 10, 11 and 12 on the following pages display the results of our medium-, low- and high- cost calculations for the 25 percent RES, respectively. We converted the aggregate cost of the RES into a cost-per-kWh by dividing the cost by the estimated total number of kWh sold for that year. for example, for 2025 under the medium-cost scenario above, we divided $2.551 billion by 132,405 million kWh for a cost of 1.93 cents per kWh.
Graphic 10: Medium-Cost Case of 25 Percent RES Mandate from 2013 to 2025 (Thousands of 2010 Dollars)
Year Gross Cost Less Conventional Total
2013 1,125,223 54,548 1,070,674
2014 1,583,848 47,995 1,535,853
2015 3,144,835 105,691 3,039,144
2016 3,166,786 101,163 3,065,622
2017 3,159,682 99,145 3,060,537
2018 3,050,698 66,614 2,984,084
2019 2,734,091 49,194 2,684,897
2020 2,811,488 50,938 2,760,550
2021 2,877,879 47,059 2,830,820
2022 2,900,390 44,985 2,855,405
2023 2,870,560 43,601 2,826,959
2024 2,894,116 48,909 2,845,207
2025 2,600,609 49,185 2,551,424
Total 34,920,205 809,028 34,111,177
Graphic 11: Low-Cost Case of 25 Percent RES Mandate from 2013 to 2025 (Thousands of 2010 Dollars)
Year Gross Cost Less Conventional Total
2013 981,335 82,524 898,812
2014 1,455,606 72,127 1,383,479
2015 2,865,382 158,982 2,706,400
2016 2,899,690 152,298 2,747,392
2017 2,899,539 149,452 2,750,087
2018 2,874,836 100,427 2,774,408
2019 2,571,386 80,004 2,491,382
2020 2,646,886 82,912 2,563,974
2021 2,721,388 76,655 2,644,733
2022 2,751,794 73,359 2,678,435
2023 2,727,918 71,430 2,656,487
2024 2,736,015 78,924 2,657,091
2025 2,447,361 79,368 2,367,993
Total 32,579,136 1,258,461 31,320,675
MACkInAC CEnTER fOR PuBLIC POLICy 15
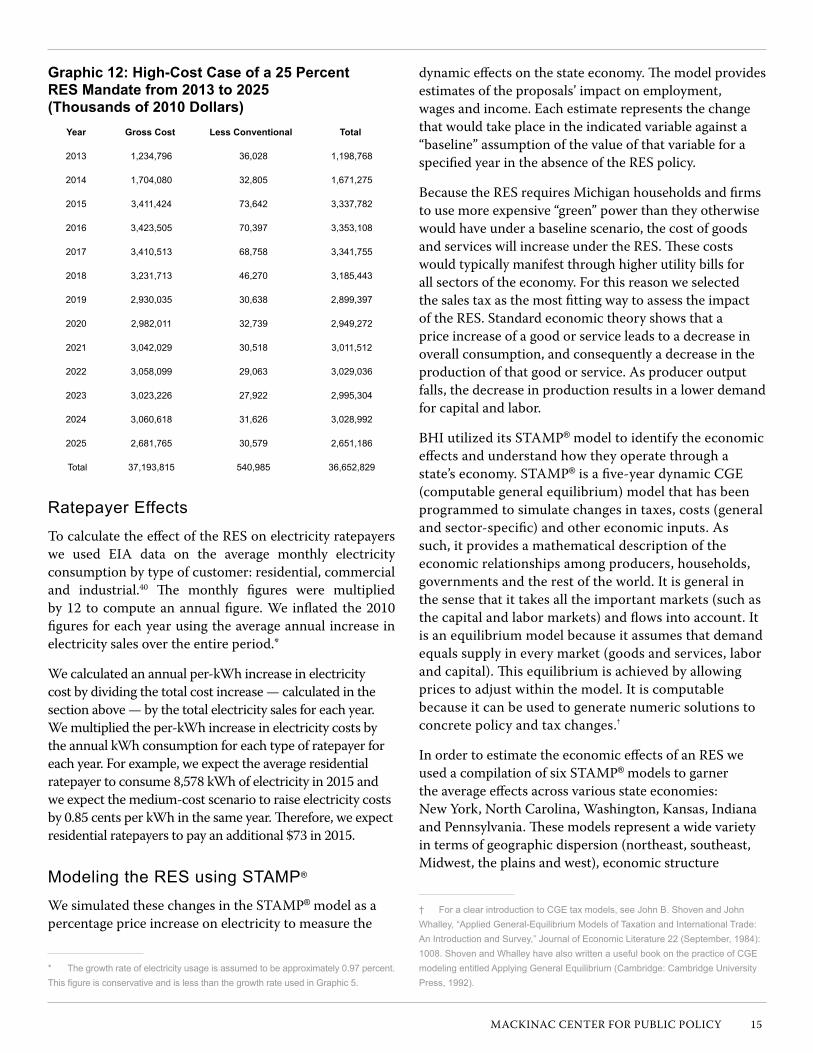
Graphic 12: High-Cost Case of a 25 Percent RES Mandate from 2013 to 2025 (Thousands of 2010 Dollars)
Year Gross Cost Less Conventional Total
2013 1,234,796 36,028 1,198,768
2014 1,704,080 32,805 1,671,275
2015 3,411,424 73,642 3,337,782
2016 3,423,505 70,397 3,353,108
2017 3,410,513 68,758 3,341,755
2018 3,231,713 46,270 3,185,443
2019 2,930,035 30,638 2,899,397
2020 2,982,011 32,739 2,949,272
2021 3,042,029 30,518 3,011,512
2022 3,058,099 29,063 3,029,036
2023 3,023,226 27,922 2,995,304
2024 3,060,618 31,626 3,028,992
2025 2,681,765 30,579 2,651,186
total 37,193,815 540,985 36,652,829
ratepayer effectsTo calculate the effect of the RES on electricity ratepayers we used EIA data on the average monthly electricity consumption by type of customer: residential, commercial and industrial.40 The monthly figures were multiplied by 12 to compute an annual figure. We inflated the 2010 figures for each year using the average annual increase in electricity sales over the entire period.*
We calculated an annual per-kWh increase in electricity cost by dividing the total cost increase — calculated in the section above — by the total electricity sales for each year. We multiplied the per-kWh increase in electricity costs by the annual kWh consumption for each type of ratepayer for each year. for example, we expect the average residential ratepayer to consume 8,578 kWh of electricity in 2015 and we expect the medium-cost scenario to raise electricity costs by 0.85 cents per kWh in the same year. Therefore, we expect residential ratepayers to pay an additional $73 in 2015.
Modeling the reS using StAMp®
We simulated these changes in the STAMP® model as a percentage price increase on electricity to measure the
* the growth rate of electricity usage is assumed to be approximately 0.97 percent. ThisfigureisconservativeandislessthanthegrowthrateusedinGraphic5.
dynamic effects on the state economy. The model provides estimates of the proposals’ impact on employment, wages and income. Each estimate represents the change that would take place in the indicated variable against a “baseline” assumption of the value of that variable for a specified year in the absence of the RES policy.
Because the RES requires Michigan households and firms to use more expensive “green” power than they otherwise would have under a baseline scenario, the cost of goods and services will increase under the RES. These costs would typically manifest through higher utility bills for all sectors of the economy. for this reason we selected the sales tax as the most fitting way to assess the impact of the RES. Standard economic theory shows that a price increase of a good or service leads to a decrease in overall consumption, and consequently a decrease in the production of that good or service. As producer output falls, the decrease in production results in a lower demand for capital and labor.
BHI utilized its STAMP® model to identify the economic effects and understand how they operate through a state’s economy. STAMP® is a five-year dynamic CGE (computable general equilibrium) model that has been programmed to simulate changes in taxes, costs (general and sector-specific) and other economic inputs. As such, it provides a mathematical description of the economic relationships among producers, households, governments and the rest of the world. It is general in the sense that it takes all the important markets (such as the capital and labor markets) and flows into account. It is an equilibrium model because it assumes that demand equals supply in every market (goods and services, labor and capital). This equilibrium is achieved by allowing prices to adjust within the model. It is computable because it can be used to generate numeric solutions to concrete policy and tax changes.†
In order to estimate the economic effects of an RES we used a compilation of six STAMP® models to garner the average effects across various state economies: new york, north Carolina, Washington, kansas, Indiana and Pennsylvania. These models represent a wide variety in terms of geographic dispersion (northeast, southeast, Midwest, the plains and west), economic structure
† For a clear introduction to CGe tax models, see John B. Shoven and John Whalley, “Applied General-equilibrium Models of taxation and International trade: An Introduction and Survey,” Journal of economic Literature 22 (September, 1984): 1008. Shoven and Whalley have also written a useful book on the practice of CGe modeling entitled Applying General equilibrium (Cambridge: Cambridge university press, 1992).
16 MACkInAC CEnTER fOR PuBLIC POLICy
(industrial, high-tech, service and agricultural), and electricity sector makeup.
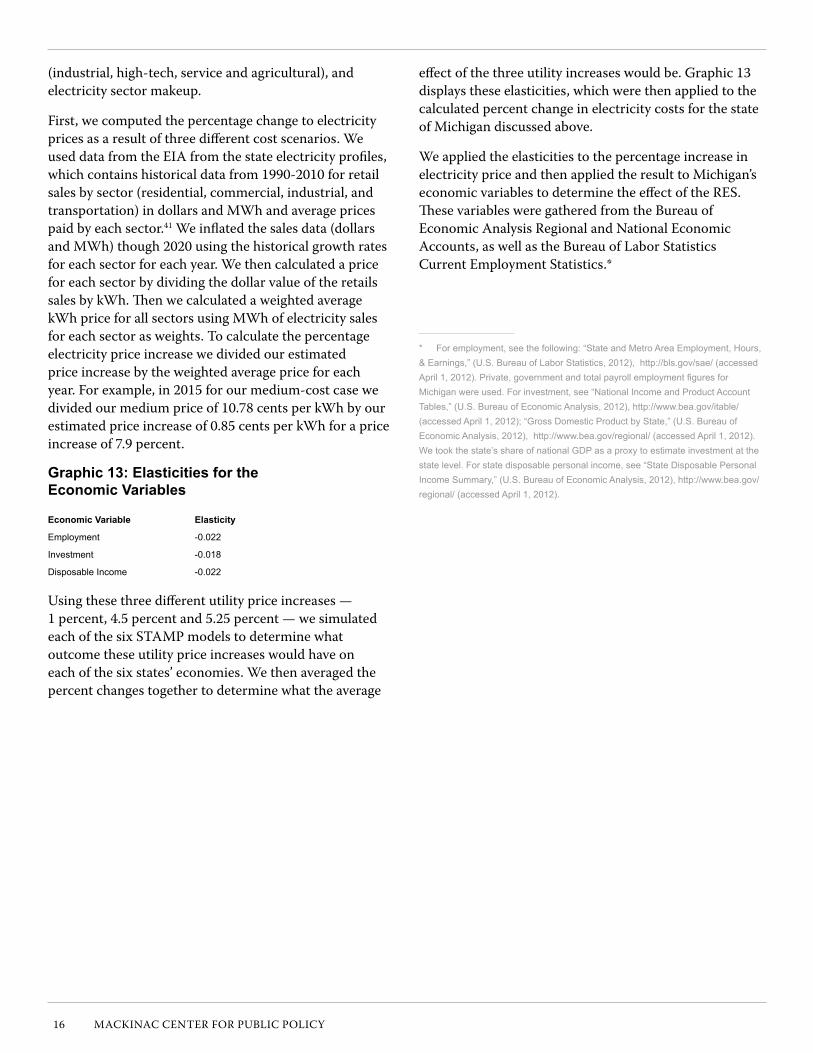
first, we computed the percentage change to electricity prices as a result of three different cost scenarios. We used data from the EIA from the state electricity profiles, which contains historical data from 1990-2010 for retail sales by sector (residential, commercial, industrial, and transportation) in dollars and MWh and average prices paid by each sector.41 We inflated the sales data (dollars and MWh) though 2020 using the historical growth rates for each sector for each year. We then calculated a price for each sector by dividing the dollar value of the retails sales by kWh. Then we calculated a weighted average kWh price for all sectors using MWh of electricity sales for each sector as weights. To calculate the percentage electricity price increase we divided our estimated price increase by the weighted average price for each year. for example, in 2015 for our medium-cost case we divided our medium price of 10.78 cents per kWh by our estimated price increase of 0.85 cents per kWh for a price increase of 7.9 percent.
Graphic 13: Elasticities for the Economic Variables
Economic Variable Elasticity
employment -0.022
Investment -0.018
Disposable Income -0.022
using these three different utility price increases — 1 percent, 4.5 percent and 5.25 percent — we simulated each of the six STAMP models to determine what outcome these utility price increases would have on each of the six states’ economies. We then averaged the percent changes together to determine what the average
effect of the three utility increases would be. Graphic 13 displays these elasticities, which were then applied to the calculated percent change in electricity costs for the state of Michigan discussed above.
We applied the elasticities to the percentage increase in electricity price and then applied the result to Michigan’s economic variables to determine the effect of the RES. These variables were gathered from the Bureau of Economic Analysis Regional and national Economic Accounts, as well as the Bureau of Labor Statistics Current Employment Statistics.*
* For employment, see the following: “State and Metro Area employment, Hours, &Earnings,”(U.S.BureauofLaborStatistics,2012),http://bls.gov/sae/(accessedApril1,2012).Private,governmentandtotalpayrollemploymentfiguresforMichigan were used. For investment, see “National Income and product Account tables,” (u.S. Bureau of economic Analysis, 2012), http://www.bea.gov/itable/ (accessed April 1, 2012); “Gross Domestic product by State,” (u.S. Bureau of economic Analysis, 2012), http://www.bea.gov/regional/ (accessed April 1, 2012). We took the state’s share of national GDp as a proxy to estimate investment at the state level. For state disposable personal income, see “State Disposable personal Income Summary,” (u.S. Bureau of economic Analysis, 2012), http://www.bea.gov/regional/ (accessed April 1, 2012).
MACkInAC CEnTER fOR PuBLIC POLICy 17
Endnotes1 “TheClean,Renewable,andEfficientEnergyAct,”(MichiganLeg-islature, 2008), public Act 295 of 2008, http://goo.gl/xq0rs (accessed June 13, 2012).
2 MCL § 460.1011(j).
3 MCL § 460.1005(5)(a); MCL § 460.1027(3).
4 MCL § 460.1011(i).
5 MCL § 460.1011(i); MCL § 460.1011(k).
6 MCL § 460.1027(3)(a)(i)-(iii).
7 MCL § 460.1027(3)(b).
8 MCL § 460.1045(2)(a)-(c).
9 MCL § 460.1045(3).
10 MCL § 460.1039(1); MCL § 460.1039(2)(a).
11 MCL § 460.1039(2)(d)-(e).
12 “Annual energy outlook 2011: renewable energy Generation by Fuel, reliability First Corporation/Michigan, reference case,” (u.S. energy Information Administration, 2011), http://goo.gl/ytK2u (accessed July 26, 2012).
13 “Cloudiness — Mean Number of Days,” (National Climatic Data Center, 2008), http://goo.gl/zfSpp (accessed June 15, 2012).
14 MCL § 460.1039(3)(a)-(c).
15 MCL § 460.1027(1)-(2).
16 “petition to add Michigan’s Clean renewable electric energy Standard to the Michigan Constitution,” (Michigan energy Michigan Jobs, 2012), http://goo.gl/utNuo (accessed Sept. 3, 2012).
17 Ibid.
18 Ibid.
19 Abby Grimmett, “Group Wants to Increase renewable energy requirement,” WLNS Lansing 2012, http://goo.gl/NHW0I (accessed Aug. 29, 2012).
20 “How Less Became More: Wind, power and unintended Conse-quences in the Colorado energy Market,” (Bentek energy LLC, 2010), http://goo.gl/kr6qN (accessed Aug. 29, 2012).
21 John D. Quackenbush, orjiakor N. Isiogu and Greg r. White, “report on the Implementation of the p.A. 295 renewable energy Standard and the Cost-effectiveness of the energy Standards,” (Michi-gan public Service Commission, 2012), http://goo.gl/uALWp (accessed Sept. 12, 2012).
22 See, for instance, MCL § 460.1047(3).
23 orjiakor N. Isiogu, Monica Martinez, and Greg r. White, “report on the Implementation of the p.A. 295 renewable energy Standard and the Cost-effectiveness of the energy Standards,” (Michigan public Service Commission, 2011), 23-24, http://goo.gl/fqHax (accessed Aug. 29, 2012).
24 “Levelized Cost of New Generation resources in the Annual energy outlook 2011,” (u.S. energy Information Administration, 2011), http://goo.gl/DG6Qk (accessed June 13, 2012).
25 “Wind power: Capacity Factor, Intermittency, and what happens
when the wind doesn’t blow?,” (renewable energy research Labora-tory, university of Massachusetts at Amherst), http://goo.gl/24r2u (accessed Aug. 29, 2012).
26 tom Hewson and Dave pressman, “Waxman-Markey reS creates land-use dilemmas,” public utilities Fortnightly (2009): 61, www.fortnightly.com/fortnightly/2009/08/renewable-overload (accessed
Sept. 3, 2012).
27 philip Bratby, “Memorandum on the economics of renewable energy,”(British parliament, 2008), http://goo.gl/oyh1Y (accessed
Aug. 29, 2012).
28 Nicolas Boccard, “Capacity factor of wind power realized values vs. estimates,” energy policy 37, no. 7 (2009) http://goo.gl/IpDrc (accessed Aug. 29, 2012).
29 tom Hewson, “testimony re. east Haven,”(Industrial Wind Action Group, 2005), http://goo.gl/CMZVD (accessed Aug. 29, 2012).
30 Boccard, “Capacity factor of wind power realized values vs. esti-mates,” energy policy 37, no. 7 (2009) http://goo.gl/IpDrc (accessed Aug. 29, 2012).
31 See “the Capacity Factor of Wind, Lightbucket,” http://lightbucket.wordpress.com/2008/03/13/the-capacity-factor-of-wind-power/ (accessed December 2011); “FAQ - output,” (National Wind Watch), http://www.wind-watch.org/faq-output.php (accessed Aug. 30, 2012).
32 “Biomass energy Basics,” (National renewable energy Labora-tory), http://www.nrel.gov/learning/re_biomass.html (accessed Aug. 30, 2012).
33 Hewson, “testimony re. east Haven,”(Industrial Wind Action Group, 2005), 61, http://goo.gl/CMZVD (accessed Aug. 29, 2012).
34HeatherStewart,“Highcostsofbasicsfuelsglobalfoodfights,”the observer, Feb. 17, 2007, http://goo.gl/7tL9a (accessed Aug. 30, 2012).
35 Celia W. Dugger, “As prices Soar, u.S. Food Aid Buys Less,” New York times, Sept. 29, 2007, http://goo.gl/SYFCA (accessed Aug. 30, 2012).
36 MCL § 1027(3)(a)-(b).
37 “petition to add Michigan’s Clean renewable electric energy Standard to the Michigan Constitution,” (Michigan energy Michigan Jobs, 2012), http://goo.gl/utNuo (accessed Sept. 3, 2012).
38 “State renewable electricity 2007,” (u.S. energy Information Administration, 2009), 68, ftp://ftp.eia.doe.gov/renewables/srp2007.pdf (accessed Sept. 10, 2012); “table 62. electric power projections for eMM region east Central Area reliability Coordination Agreement - 01,” (u.S. energy Information Administration, 2007), http://goo.gl/2B2rK (accessed Sept. 9, 2012).
39 “Levelized Cost of New Generation resources in the Annual energy outlook 2011,” (u.S. energy Information Administration, 2011), http://goo.gl/DG6Qk (accessed June 13, 2012).
40 “table 5A. residential Average Monthly Bill by Census Division, and State 2010,” (u.S. energy Information Administration, 2011), http://www.eia.gov/electricity/sales_revenue_price/xls/table5_a.xls (accessed Sept. 18, 2012); “table 5B. Commercial Average Monthly Bill by Census Division, and State 2010,” (u.S. energy Information Administration, 2011), http://www.eia.gov/electricity/sales_rev-

18 MACkInAC CEnTER fOR PuBLIC POLICy
enue_price/xls/table5_b.xls (accessed Sept. 18, 2012); “table 5C. Industrial Average Monthly Bill by Census Division, and State 2010,” (u.S. energy Information Administration, 2011), http://www.eia.gov/electricity/sales_revenue_price/xls/table5_c.xls (accessed Sept. 18, 2012).
41 “electric power Monthly: table 8. retail Sales, revenue, and Average retail price by Sector, 1990 through 2010,” (u.S. energy Information Administration, 2012), http://www.eia.gov/electricity/state/michigan/xls/sept08mi.xls (accessed Sept. 4, 2012).


Dr. Howard SchwartzOakland University
Dr. Martha SegerFederal Reserve Board (ret.)
James SheehanDeutsche Bank Securities
Rev. Robert SiricoActon Institute for the Study of Religion and Liberty
Dr. Bradley SmithCapital University Law School
Dr. John TaylorWayne State University
Dr. Richard k. VedderOhio University
Prof. Harry Veryser Jr.University of Detroit Mercy
John Walter Jr.Dow Corning Corporation (ret.)
Dr. William WilsonEconomic Consultant
Mike WintherInstitute for Principle Studies
Dr. Gary WolframHillsdale College
Board of DirectorsD. Joseph Olson, Chairman
Retired Senior Vice President and General Counsel, Amerisure Companies
Joseph G. Lehman, PresidentMackinac Center for Public Policy
Joseph J. fitzsimmons Retired President, University Microfilms
Dulce M. fuller Owner, Woodward and Maple
Richard G. Haworth Chairman Emeritus, Haworth, Inc.
kent B. HerrickPresident and CEO, Thermogy
J.C. HuizengaPresident, Westwater Group
Phil f. Jenkins Chairman, Sweepster Inc.
R. Douglas kinnan Senior Vice President and CFO, Amerisure Insurance
Edward C. Levy Jr. President, Edw. C. Levy Co.
Rodney M. Lockwood Jr.President, Lockwood Construction Company, Inc.
Joseph P. Maguire President, Wolverine Development Corporation
Richard D. McLellan Attorney, McLellan Law Offices
Hon. Clifford W. TaylorRetired Chief Justice, Michigan Supreme Court
Board of ScholarsDr. Donald Alexander
Western Michigan UniversityDr. William Allen
Michigan State UniversityDr. Thomas Bertonneau
Writer and Independent ScholarDr. Brad Birzer
Hillsdale CollegeDr. Peter Boettke
George Mason UniversityDr. Theodore Bolema
South University - NoviDr. Stephen Colarelli
Central Michigan UniversityAndrew Coulson
Cato InstituteRobert Crowner
Eastern Michigan University (ret.)Dr. Richard Cutler
University of Michigan (ret.)Dr. Jefferson Edgens
Morehead State UniversityDr. David felbeck
University of Michigan (ret.)Dr. Burton folsom
Hillsdale CollegeDr. Wayland Gardner
Western Michigan University (ret.)John Grether
Northwood UniversityDr. Michael Heberling
Baker CollegeDr. Ormand Hook
Mecosta-Osceola Intermediate School District
Robert HunterMackinac Center for Public Policy
Prof. Harry HutchisonMason School of Law
Dr. David JandaInstitute for Preventative Sports Medicine
Annette kirkRussell Kirk Center for Cultural Renewal
David LittmannMackinac Center for Public Policy
Dr. Dale MatcheckNorthwood University
Dr. Paul McCrackenUniversity of Michigan (ret.)
Charles MeiserLake Superior State University (ret.)
Glenn MootsNorthwood University
Dr. George nastas IIIMarketing Consultants
Dr. John PaffordNorthwood University
Dr. Mark PerryUniversity of Michigan - Flint
Lawrence W. ReedFoundation for Economic Education
Gregory RehmkeEconomic Thinking/ E Pluribus Unum Films
Dr. Steve SafranekAve Maria School of Law
Guarantee of Quality ScholarshipThe Mackinac Center for Public Policy is committed to delivering the highest quality and most reliable research on Michigan issues. The Center guarantees that all original factual data are true and correct and that information attributed to other sources is accurately represented.The Center encourages rigorous critique of its research. If the accuracy of any material fact or reference to an independent source is questioned and brought to the Center’s attention with supporting evidence, the Center will respond in writing. If an error exists, it will be noted in an errata sheet that will accompany all subsequent distribution of the publication, which constitutes the complete and final remedy under this guarantee.
© 2012 by the Mackinac Center for public policy. All rights reserved.Permission to reprint in whole or in part is hereby granted, provided that the Mackinac Center for Public Policy is properly cited.
ISBN: 978-0-9883921-0-6 S2012-07
Beacon Hill Institute at Suffolk university, 8 Ashburton place, Boston, Massachusetts 02108 617-573-8750 Fax: 617-994-4279 beaconhill.org
Mackinac Center for public policy, 140 West Main Street, p.o. Box 568 Midland, Michigan 48640 989-631-0900 Fax: 989-631-0964www.mackinac.org [email protected]