Embed Size (px)
Citation preview
THE REGULATION OF HEPATIC CHOLINE TRANSPORT
by
Rebecca Yaworski
The University of Ottawa
A THESIS SUBMITTED IN PARTIAL FULFILLMENT OF THE REQUIREMENTS FOR THE DEGREE OF MASTER OF SCIENCE
in
The Faculty of Graduate and Postdoctoral Studies In Biochemistry
November 2017
© Rebecca Yaworski, Ottawa, Canada, 2017
TABLE OF CONTENTS 1 ACKNOWLEDGEMENTS .......................................................................................................... v 2 LIST OF FIGURES ........................................................................................................................ vi 3 LIST OF ACRONYMS ................................................................................................................vii 4 ABSTRACT .................................................................................................................................... viii 5 INTRODUCTION .......................................................................................................................... 1
5.1 The History of Choline ......................................................................................... 1 5.2 Choline Transport ................................................................................................. 3 5.3 Choline Transporter Like Protein family ............................................................. 5
5.3.1 CTL1 ............................................................................................................. 5 5.3.2 CTL2-5 .......................................................................................................... 6
5.4 CTL1 and Choline Metabolic Pathways .............................................................. 8 5.5 Phosphatidylcholine and the Liver ..................................................................... 12 5.6 Choline and Metabolic Disease .......................................................................... 13 5.7 The Circadian Rhythm and Liver Metabolism ................................................... 15
5.7.1 The Circadian Rhythm ................................................................................ 16 5.7.2 Circadian disruption and liver metabolism ................................................. 17
5.8 Rationale and Objectives .................................................................................... 21 6 EXPERIMENTAL PROCEDURES ....................................................................................... 22
6.1 Animals .............................................................................................................. 22 6.2 Tissue Harvest and RNA Isolation ..................................................................... 22 6.3 cDNA synthesis .................................................................................................. 23 6.4 Real-time qPCR.................................................................................................. 24 6.5 Murine Primary Hepatocyte Isolation ................................................................ 25 6.6 Rate of Hepatic Choline Uptake......................................................................... 27 6.7 CTL1-5 Uptake Inhibition Assay ....................................................................... 28 6.8 Saturation Kinetics of the CTL1-5 Choline Transporter System ....................... 29 6.9 Compound Preparation and Treatment of Primary Hepatocytes ....................... 30 6.10 Circadian Time Trials ..................................................................................... 31 6.11 Bligh & Dyer Lipid Extraction ....................................................................... 31 6.12 Blood Serum Choline Quantification Assay .................................................. 32 6.13 Tissue based Chromatin Immunoprecipitation ............................................... 33
6.13.1 Cross-linking and Chromatin Preparation .................................................. 33
ii

iii
6.13.2 Chromatin Preclearing and Immunoprecipitation ....................................... 34 6.13.3 Washing and Elution ................................................................................... 35 6.13.4 DNA Purification ........................................................................................ 36
6.14 BCA Protein Quantification Assay ................................................................. 36 6.15 Western blots .................................................................................................. 37 6.16 In Vivo Choline Uptake .................................................................................. 39 6.17 Adeno Virus Treatment of Primary Hepatocytes ........................................... 39 6.18 Procedure for the Removal of Obese and Time Dependent Mouse Livers .... 40 6.19 Bioinformatics specification ........................................................................... 41 6.20 Statistical Analyses ......................................................................................... 41
7 RESULTS ....................................................................................................................................... 42 7.1 Kinetics of Choline Transporters in Primary Hepatocytes................................. 42 7.2 A Comparison of Choline Transporters and Metabolizing Enzymes between Primary Hepatocytes and Liver Homogenate ............................................................... 44 7.3 Treatment Effect on Hepatic Choline Uptake and Incorporation into Phosphatidycholine ....................................................................................................... 45 7.4 Effects of Oleate Treatment on Hepatic Choline Metabolism ........................... 47 7.5 Obesity Affects CTL1 mRNA Expression and Choline Incorporation.............. 48 7.6 CTL1 Expression and Liver Choline Uptake are Influenced by the Circadian Rhythm. ......................................................................................................................... 50 7.7 CHKα and CTL1 mRNA Expression show 24 hour Rhythmicity. .................... 51 7.8 Bioinformatics analysis indicates 4 potential RORE consensus sequences for REV-ERBα/RORα binding upstream of the SLC44A1 gene ....................................... 53 7.9 Disrupting the Circadian Rhythm Affects Liver Choline Incorporation and SLC44A1 Expression.................................................................................................... 56 7.10 Both Obesity and the Circadian Rhythm Affect Choline Uptake and CTL1 Expression. .................................................................................................................... 57 7.11 The Effect of Obesity and Circadian Rhythm on the Transcription of Choline Metabolizing Enzymes and the OCT1 Transporter. ..................................................... 58
8 DISCUSSION ............................................................................................................................... 60 8.1 CTL1-5 is an intermediate choline transport system responsible for 80% of hepatic uptake. .............................................................................................................. 60 8.2 Choline incorporation is increased following treatment with oleate.................. 62 8.3 Oleate stimulates PC synthesis in hepatocytes but does not affect CTL1 expression. .................................................................................................................... 64 8.4 Obesity Decreases CTL1 mRNA Expression and Choline Incorporation ......... 66 8.5 CTL1 expression and function are regulated by the circadian rhythm. ............. 68

iv
8.6 Bioinformatics indicates that the CTL1 promoter contains REV-ERBα/RORα binding sites. ................................................................................................................. 69 8.7 BMAL knockout affects both CTL1 expression and hepatic choline uptake. ... 71 8.8 Obesity decreases the overall uptake and incorporation of choline in the morning. ........................................................................................................................ 72 8.9 Obesity suppresses CHKα and PEMT expression in the morning. .................... 73
9 CONCLUDING REMARKS .................................................................................................... 74 10 REFERENCES ............................................................................................................................. 76 11 APPENDIX 1 ................................................................................................................................ 86
11.1 Breeding Scheme Towards the Generation of a CTL1-/- Mouse ..................... 86 11.2 Preliminary Study Evaluating the Effect of Obesity on Hepatic CTL1 Expression. .................................................................................................................... 90
v
ACKNOWLEDGEMENTS
Morgan I am truly grateful for your guidance and patience over the past couple
years, I have not only advanced my abilities as a scientist but have gained a greater
understanding of what it means to be a scholar and professional. Thank you for always
leaving your door open, encouraging me to ask questions and also making me find the
answers on my own. I wish you and your family all the best in the future.
To my friends in the lab and in the office, thank you for all the laughs, good times
and interesting conversations! Thank you Nick, Kaitlyn and Conor for waking up at all
hours of the night to help me complete my circadian studies. Thank you Clayton, Pat and
Andrew for your scientific input but most of all for your friendship and comradery.
Thank you to my thesis committee, Dr. Harper and Dr. Legacy for your advice
and guidance throughout my degree.
To my family and friends, thank you for your support! Thank you especially to
my grandparents for your love and encouragement not only during my master’s degree
but also undergraduate years. Thank you for providing me with a home and making an
effort to understand what I’m working on in the lab. Thank you mom for encouraging me
to pursue my interests and never stop reaching for my dreams no matter how difficult
they might be to achieve. Thank you to my aunts and uncles for keeping me laughing,
bringing me along on family vacations and for yummy home cooked meals!

vi
LIST OF FIGURES
Figure 1. Transport kinetics of the ctl transport family in primary murine hepatocytes
43
Figure 2. Relative mRNA expression assessed by quantitative real time PCR 44 Figure 3. Treatment effect on choline uptake and incorporation in primary hepatocytes
46
Figure 4. Effect of 24 hour oleate treatment on choline metabolism in primary murine hepatocytes
48
Figure 5. Comparison between choline incorporation and mRNA expression in lean and fatty livers
49
Figure 6. Liver mRNA expression of CHKα, CTL1 and OCT1 over 24 hours and liver choline uptake at 7:00 am and 7:00 pm time points
51
Figure 7. CTL1 liver protein expression over a 24 hour period 53 Figure 8. Liver CHKα and CTL1 mRNA expression over 46 hours 53 Figure 9. The CTL1 promoter contains RORE consensus sequences capable of REV-ERBα/RORα binding
55
Figure 10. Chromatin immunoprecipitation probing REV-ERBα binding to the CTL1 promoter
56
Figure 11. Liver choline incorporation and SLC44A1 expression in BMAL1 knockout mice at the 7:00 am and 7:00 pm time points
57
Figure 12. Effect of obesity and circadian regulation on hepatic CTL1 expression and function
58
Figure 13. Effect of obesity and the circadian rhythm on liver CHKα, PCTY1/CCT, PEMT and OCT1 mRNA expression
59
Figure A1. Generation of a CTL1-/- mouse 87 Figure A2. CTL1 expression following treatment with Cre-containing adenovirus 88 Figure A3. Effect of obesity on hepatic CTL1 expression 89
vii
LIST OF ACRONYMS
Attention deficit hyperactivity disorder ADHD Brain and muscle ARNT-like 1 BMAL Cytidine diphosphate choline pathway CDP-choline
pathway Cholesterol 7 alpha-hydroxylase CYP7A1 Choline kinase alpha CHKα Cholinephosphotransferase CPT Choline transporter 1 CHT1 Choline transporter like protein 1-5 CTL1-5 Chromatin Immunoprecipitation CHIP CTP:phosphocholine cytidylytransferase CCT or
PCTY1 Cryptochrome CRY Diacylglycerol DAG High density lipoprotein HDL Low density lipoprotein LDL Low density lipoprotein receptor LDLr Nonalcoholic fatty liver disease NAFLD Organic cation transporter 1-3 OCT1-3 Organic cation transporter novel type 1/2 OCTN1-2 Period PER
Phosphatidylcholine PC Phosphatidylethanolamine N-methyltransferase PEMT RAR-related orphan receptor alpha RORα Rapamycin-insensitive companion of mammalian target of rapamycin RICTOR S-adenomethionine SAM
Sterol regulatory element-binding protein SREBP Suprachiasmatic nucleus SCN Thiamine pyrophosphate TPP Total parental nutrition formulae TPN Trimethylamine N-oxide TMAO Very low density lipoprotein VLDL Zeitgeber time ZT

viii
ABSTRACT
Rebecca A. Yaworski Advisor: University of Ottawa, 2017 Dr. Morgan Fullerton
Choline is an essential nutrient, in the liver it is a precursor necessary for the
synthesis of phosphatidylcholine (PC) and is also required as a methyl donor towards the
synthesis of betaine and later regeneration of S-adenomethionine (SAM). Choline
deficiency is known to trigger the development of non-alcoholic fatty liver disease and
affect mitochondrial homeostasis along with a myriad of methylation related regulatory
mechanisms. Because of its importance in maintaining liver lipid and mitochondrial
homeostasis, choline metabolism has been well characterized with the exception of its
transport. The identification of choline transporters has only been recently discovered and
because of this, relatively little is known about their expression and regulation.
This study has established that choline transporter like proteins 1-5 (CTL1-5) is
an intermediate affinity transport system responsible for ~80% of hepatic choline uptake
with a smaller percentage accomplished through the low affinity organic cation
transporter 1-3/N1-2 (OCT1-3/N1-2) transporters. SLC44A1 expression and choline
incorporation have been shown to follow a 24 hour rhythmic trend suggesting the
presence of a circadian regulatory mechanism. This finding is supported by the
significant decrease in choline expression and aberrant pattern of choline incorporation
discovered among rhythmic deficient BMAL-/- mice and through a bioinformatics analysis
which revealed the existence of four REV-ERBα consensus sequences. Hepatic SLC44A1
expression and choline incorporation have also been shown to decrease with the onset of
obesity. Choline uptake was also shown to decrease following treatment with the free
fatty acid oleate. This work increases our knowledge of hepatic choline transport and

ix
demonstrates a link between the circadian rhythm and obesity with the hepatic CTL1
transporter.

1
INTRODUCTION
1.1 The History of Choline
Opening his publication on the chemical components of carp fish egg published in
1850, the chemist Theodore Gobley posed a rhetorical question; suggesting that the
chemical components which make up living animals are not simply deposited by a
creator, but are synthesized from nature. He also believed that these chemical compounds
changed throughout the development of an animal and if he could uncover the chemicals
present at each stage then he could then understand their role in physiology. Inspired by
the isolated environment within bird and fish eggs, Gobley set out to isolate their
chemical components and locations within the animal. Described as a viscous substance
within the yolk, Gobley uncovered an organic compound which dissolved well in water
and oils and could be separated into two bodies one of which was made up of phosphorus
and the other nitrogen. Gobley gave this substance the name, lécithine from the greek
word for egg yolk since it was a major constituent of the yolk. Today we know lécithine
as phosphatidylcholine (PC) and the nitrogen containing chemical that Gobley described
as choline 1.
In 1862 the German chemist Adolph Strecker isolated a strongly alkaline
nitrogen-containing base from pig and ox bile and gave it the name of choline 2. The
identification of choline in bile linked its functioning with the gall bladder and liver. At
the time, choline found in nervous tissue was given the name neurine and Stecker
correctly identified it as a component of lécithine, unknowingly making the connection of
choline as a constituent of PC and present in the brain. In March 1867, the chemist Mr. W.
Dybkowsky made the connection identifying choline as the decomposed product of the
2
salt neurine (neurine presented as a salt due to the isolation method) and the two became
known as the single molecule choline 3.
By 1980 the importance of dietary choline was gaining attention, doctors at the
US National Cancer Institute noticed that oncology patients on nutritional support who
were administered a total parenteral nutrition formulae (TPN) developed “liver function
abnormalities” despite receiving what they believed to be a complete nutritional recipe.
The TPN formula, as pointed out by the doctors, lacked free choline and blood samples
from the patients demonstrated a significant decrease in plasma choline levels 4. The
effects of choline supplementation in TPN was continued in 1992 when it was
demonstrated that the low plasma choline and hepatic steatosis could be prevented as
well as reversed with the supplementation of lecithin or PC to the diet 5. During this same
time a collaborative effort between the University of North Carolina, Boston University
and the University of Massachusetts demonstrated this same cause and effect in healthy
adults 6. Prior to their study several lines of evidence culminating from work in rats and
monkeys suggested that choline is an essential nutrient in mammals and plays an
indispensable role in maintaining proper liver and renal function 7. However, at the time
some argued that the de novo synthesis of PC via the phosphatidylethanolamine N-
methyltransferase (PEMT) pathway provided adequate levels of PC and so choline was
considered a dispensable nutrient. PEMT catalyzes a three step methylation reaction
which converts phosphatidylethanolamine (PE) to PC 7. As well, due to choline’s
prevalence in a variety of foods, symptoms of choline deficiency among the general
population were few and far between. Nonetheless the group argued in support of
choline’s importance and following a 5 week study conducted in healthy men placed on a
3
choline sufficient or choline deficient diet it was found that in humans, choline deficiency
resulted in decreased plasma PC and triggered the onset of liver dysfunction which could
be later rescued through choline supplementation 6. These studies provided the evidence
which would be later used by the Food and Nutrition Board in their classification of
choline as an essential nutrient in 1998.
1.2 Choline Transport
Choline or trimethyl-β-hydroxy-ethylammonium, is a positively charged
quaternary amine and requires a transporter to pass through the membrane barrier. There
are three choline transporter families and due to the important role for choline in PC
synthesis, all cells express at least one of the three families of proteins (with the
exception of red blood cells and the blood brain barrier which transport choline through
facilitated diffusion) 8,9,10. Studies evaluating the radiolabeled uptake of choline coupled
with information provided from transporter inhibition assays have uncovered the
existence of the high-affinity choline transporter 1 (CHT1), intermediate affinity choline
transporter-like proteins (CTL), and the low affinity polyspecific organic cation
transporter family (OCT) 9, 11, 12.
1.2.1 Choline Transporter 1 (CHT1)
CHT1 is a high-affinity Na+-dependent choline transporter encoded by the
SLC5A7 gene and is sensitive to hemicholinium (HC-3) inhibition. CHT1 transporters are
primarily expressed in neuronal cells, particularly in the axon terminal region of
cholinergic neurons and are essential for the uptake of choline require for acetylcholine
synthesis 13. Acetylcholine is a neurotransmitter required in both neural transmission as
well as peripheral processes such as smooth and skeletal muscle contraction. Mutations to
4
the CHT1 gene such as the Ile89Val variant have been associated with major depression,
attention deficit hyperactivity disorder (ADHD) and anxiety, all of which behaviours
unsurprisingly, originate from cholinergic dense areas of the brain. In the periphery
CHT1 gene mutations are known to cause the neuromuscular disorders; hereditary motor
neuronopathy type 7 and congenital myasthenic syndrome, both of which are affected by
a loss of cholinergic neurotransmission at the neuromuscular junction 14, 15.
1.2.2 Organic cation transporter 1-3 (OCT1-3)
The OCT family of transporters encoded by the SLC22A1-3 genes share broad
substrate specificity and function in the uptake of organic cations, xenobiotic compounds,
various pharmaceutical drugs and toxins, and are not sensitive to hemicholinium
inhibition. In humans, OCT tissue distribution includes the liver, kidney, spleen, lung,
heart, stomach and intestines, brain, placenta, mammary tissue and a number of
cancerous tissues 11,16,17,18. Due to their substrate library, the main role of OCT uptake is
thought to be in the detoxification and removal of endogenous compounds and toxins
from the body 19. The SLC22A family also includes the organic cation transporter novel
type 1 and 2 (OCTN1/2) which have been found to transport carnitine,
tetraethylammonium, metformin and ergothioneine and have been associated with
autoimmuno disease 20,21,22,23. Both OCTN1/2 mRNA have been detected in a number of
tissues but information on the transporters physiological roles, transport kinetics and
regulation remain limited at this time 20.
5
1.3 Choline Transporter Like Protein family
1.3.1 CTL1
In the year 2000, the CTL1 transporter was discovered through a
complementation experiment in yeast. The gene clone taken from the cDNA library of
Torpedo marmorata, contained transmembrane domains with a transporter-like motif and
was capable of restoring choline uptake in the mutant suppressed yeast. The transporter
was Na+-independent yet sensitive to hemicholinium categorizing it as a novel choline
transporter. In the same article the homologous gene in rat (69% identity with torpedo)
was isolated in the spinal cord, brain and colon along with 3 other transporter variants
(CTL2-4). Since the CHT1 transporters had been so well linked to acetylcholine
production, the function of CTL1 in brain and motor neurons was assumed to be
necessary for supplying choline to the Kennedy pathway 24. The human CTL1
homologue (96% identity with rat) was identified the following year through a sequence
comparison analysis which determined that the previously identified CDw92 surface
protein found on leukocytes, monocytes and endothelial cells was actually the newly
discovered CTL1 transporter 25. Of the five CTL transporters, CTL1 has been most
thoroughly studied and is known to play a vital role in the uptake of choline along the
plasma membrane as well as the outer mitochondrial membrane 26,27. Results from
microarray, RNAseq and SAGE studies have indicated the presence of CTL1 in all tissue
groups including; muscle, nervous, epithelial, connective, immune and secretory tissues.
In the cell, CTL1 is localized to the plasma membrane, lipid droplet membranes and to
the outer mitochondrial membrane in liver, kidney and muscle with some evidence
suggesting mitochondria in the brain as well 8,27. CTL1-5 are members of the larger
solute carrier family 44, the human CTL1 or SLC44A1 gene is located on chromosome
6
9q31.1, mouse on chromosome 4B2 and rat on chromosome 5q24. CTL1 is 656 amino
acids in length, has a molecular weight of 73.3 kDa, contains 9 trans-membrane domains
and 4 phosphoserine modification residues which regulate its localization 28,29.
Alternative splicing of the 17 exon gene has resulted in three transcript variants;
SLC44A1a (loss of exon 17, contains exon 16), SLC44A1b (loss of exon 16, contains
exon 17) and SLC44A1c (loss of exon 17, modification of exon 16). Interestingly
transcript b contains a retinoid X receptor motif which has been identified in G protein-
coupled receptors and ion channels as an endoplasmic reticulum retention/retrieval motif
which controls surface trafficking 30. Also interesting is that transcripts b and c lack all
four phosphoserine sites (position 644, 652, 655, 656) which may affect the proteins
localization in the cell however neither of these modifications have yet to be tested.
1.3.2 CTL2-5
CTL2 is found in the majority of tissues and mediates the uptake of choline across
the plasma and outer mitochondrial membrane 26,31. Interestingly both CTL1 and CTL2
have been associated with functions outside of choline transport. In 2003, a large scale
collaboration sought to identify all genes which activate nuclear factor kappa-light-chain-
enhancer of activated B cells (NF-κB) and mitogen-activated protein kinase signalling
pathways, using a luciferase reporter gene assay it was shown that CTL2 activated NF-
κb with a 5 fold induction 32. In 2006, a gel shift assay indicated the presence of both
single and double NF-κB binding sites within the SLC44A1 promoter region. The
relationship between CTL1/2 and NF-κB has yet to be further examined.
The human SLC44A2 gene is located on chromosome 19p13.2, mouse
chromosome 9A3 and rat chromosome 8q13. CTL2 is 706 amino acids in length, has a
molecular weight of 80.1 kDa, contains 10 trans-membrane domains, one
7
phosphothreonine modification residue and three glycosylation sites. Three splice
variants exist for CTL2, isoform a (canonical sequence), isoform b (modification of exon
17), isoform c (modification of exon 1), there has been suggestion that the CTL2a
isoform may not be capable of transporting choline however no further research has been
conducted in this area 33. Choline transport polymorphisms have been associated with
hearing loss, transfusion-related lung injury and Meniere’s disease 33,34.
CTL3 is present in the plasma membrane of most tissues in low concentration but
more highly expressed in the kidneys and along the digestive tract including the stomach,
intestines and colon 8. At this time little research has been conducted on CTL3 function
or its contribution to choline uptake in tissue. The increased expression of CTL3 protein
along the digestive tract could suggest that it plays more of a role in choline absorption
from food rather than mediating its entry into organs. The human SLC44A3 gene is
located on chromosome 1p21.3, mouse chromosome 3G1 and rat chromosome 2q41 35.
CTL3 is 653 amino acids in length, has a molecular weight of 73.7 kDa, contains 8 trans-
membrane domains and 5 glycosylation sites 8,35. CTL3 has 5 predicted splice variants
however no experimental confirmation is available at this time.
CTL4 function constitutes choline transport in a number of tissues as well as
thiamine pyrophosphate (TPP) transport in the colon. Knockdown and overexpression
studies have demonstrated a connection between CTL4 expression and acetylcholine
production in non-neuronal cell lines 36. The 156 M V mutation of the SLC44A4 gene
has been associated with changes in acetylcholine production in a Chinese family with
postlingual non-syndromic mid-frequency sensorineural hearing loss. Using a zebrafish
model, downregulation of the SLC44A4 gene resulted in significant abnormalities to the

8
inner ear which affected the fishs’ ability to hear and balance 37. For the first time a
member of the CTL family has been shown to transport an essential nutrient other than
choline. In a 2014 study, the SLC44A4 gene from isolated colonocytes was cloned into
retinal pigment epithelial cells. Labeled thiamine pyrophosphate (3H-TPP) was used to
evaluate uptake into the cells and it was found that SLC44A4 containing epithelial cells
transported significantly more 3H-TPP than their counterpart controls 38. The human
SLC44A4 gene is located on chromosome 6p21.33, mouse chromosome 17B1 and rat
chromosome 20p12 8,24,38. CTL4 is 710 amino acids in length, has a molecular weight of
79.2 kDa, contains 10 trans-membrane domains and 7 glycosylation sites. SLC44A4 has 4
predicted splice variants however no experimental confirmation is available at this time.
Little research has been conducted on the role of CTL5 and its contribution to
choline uptake in the cell. What little is known has linked CTL5 to various cancer models
such as small cell lung carcinoma, neuroblastoma, prostate, colon and hepatocarcinoma 39.
The human SLC44A5 gene is located on chromosome 1p31.1, mouse chromosome 3H3-
H4 and rat chromosome 2q45 8. CTL5 is 719 amino acids in length, has a molecular
weight of 81.6 kDa, contains 10 trans-membrane domains and 3 glycosylation sites.
CTL5 has 3 splice variants, isoform a (canonical sequence), isoform b (modification to
exon 23), isoform c (loss of exon 1-3 and modification to exon 4) 8.
1.4 CTL1 and Choline Metabolic Pathways
Depending on the type of cell, choline may be directed along one of three
metabolic pathways. In the majority of cells, it is thought that choline taken up by CTL1
is shuttled along the CDP-choline pathway towards the synthesis of PC. Through this
method, choline taken into the cell is rapidly phosphorylated by choline kinase α to
9
produce phosphocholine and an ADP by-product 40. In a rate limiting step,
CTP:phosphocholine cytidylyltransferase (CCT) then converts phosphocholine into the
CDP-choline molecule through the attachment of pyrophosphate to the phosphate group.
In the final step CDP-choline must travel to the endoplasmic reticulum or golgi where
choline phosphotransferase (CPT) utilizes the high energy pyrophosphate-phosphate
bond to catalyze the transfer of phosphocholine to diacylglycerol (DAG), creating PC 40.
Although the conversion of phosphocholine to CDP-choline is the rate limiting step in
this pathway, DAG availability may also influence the rate of PC synthesis 41,42.
Choline metabolism has a direct impact on PC synthesis and availability, which
plays an important role in numerous pathways. PC availability impacts the membrane
dynamics and fluidity of all cells, particularly so in hepatocytes, where it is a crucial
component of very low-density lipoprotein (VLDL) particle assembly and controls lipid
droplet membrane formation 43. In the liver, PC is also required in the formation of bile
and is a necessary component used to protect epithelium of the gastrointestinal tract from
the detergent nature of bile salts. Importantly, both VLDL, lipid droplets and bile contain
a high level of cholesterol and are important factors controlling proper cholesterol
circulation and elimination 44. Choline deficiency in humans has been shown to affect PC
content in bile and decrease hepatic VLDL secretion which decreases serum cholesterol
levels, in addition to this enzymes of the CDP-choline pathway are capable of influencing
the size and number of lipid droplets which affect the livers ability to store cholesterol 6,45,
46,47.
PC availability is also critical for malignant cell replication and perhaps in
accordance with this, CTL1 expression is commonly over-expressed in cancerous cells 48.
10
Studies conducted in small cell lung carcinoma presenting with increased CTL1
expression have shown that the inhibition of CTL1 uptake using the choline analog
hemicholinium as well as siRNA knockdown significantly decreases cancer cell
viability 49,50. Similar results have been found in colon carcinoma where CTL1 inhibition
with hemicholinium resulted in decreased cell proliferation in a concentration dependent
manner 51. The inhibition of choline uptake and/or metabolism as a possible cancer
treatment is currently under investigation.
Another case where choline requirements increase is during pregnancy and
lactation. Choline serum concentrations in the fetus and in neonates are roughly
sevenfold higher than what is typically found in adults. This is thought to be in response
to increased membrane formation requirements as the child grows 52. It has been shown
that CTL1 is the main choline transporter shuttling choline from maternal blood across
the placental barrier 53. Animal studies have shown that choline deficiency during
pregnancy reduces the proliferation and migration of neuronal precursor cells in the
hippocampus and decreases DNA methylation, which has a negative effect on memory
formation in the pups 54,55. As expected, choline supplementation during pregnancy
improved the rats memory performance when placed in a 12-arm radial maze and this
effect continued even as the rats aged 55,56.
Aside from the utilization of choline in PC synthesis, choline may also participate
in the one carbon cycle towards the regeneration of S-adenosylmethionine (SAM). It has
been shown in the liver and kidney, that choline passed through CTL1 transporters on the
outer mitochondrial membrane and oxidized to betaine through interaction with choline
dehydrogenase and betaine aldehyde dehydrogenase 57. Betaine then exits the
11
mitochondria and is used as a methyl donor in the one-carbon cycle where it catalyzes the
conversion of homocysteine to methionine, an important step towards the regeneration of
SAM and the methylation capability of the cell. Through this regeneration cycle, methyl
groups donated by choline have wide-ranging effects on gene expression and global DNA
methylation. It has been shown that animals placed on a choline deficient diet have lower
hepatic SAM concentrations and show hypomethylation in the brain and liver during
embryonic development 58,59. The presence of CTL1 along the outer mitochondrial
membrane has also been observed in muscle and has been shown to decrease in
expression following choline deficiency resulting in muscle damage and muscle cell
triglyceride accumulation 60,61,62. Speculations as to the role of CTL1 along the outer
mitochondrial membrane of muscle range from providing transport towards an immediate
sink for choline, to directing choline towards the synthesis of phosphatidylserine;
however the true role remains to be established 60.
In the third pathway, choline may be directed towards the synthesis of
acetylcholine in both neural and non-neural tissues. Acetylcholine is synthesized by
choline acetyltransferase using the precursors choline and acetyl-CoA 63. Once released
into the synaptic cleft acetylcholine is hydrolyzed by acetylcholinesterase producing
choline and acetate where choline is taken back up into the neuron via CHT1 transport. In
cholinergic neurons the CHT1 transporters are believed to provide the majority of choline
used in acetylcholine synthesis where as CTL1 transport is thought to feed into the CDP-
choline pathway 64. This isn’t the case in non-neuronal tissue such as in the
neuromuscular junction, where CTL1 is abundant and provides choline transport for both
12
PC synthesis and acts as a reuptake mechanism for choline recycling following
acetylcholine release 65.
1.5 Phosphatidylcholine and the Liver
PC is an essential membrane constituent making up the greater part of the outer
membrane leaflet. As the most abundant glycerophospholipid, PC is composed of two
unsaturated fatty acids bound to a glycerol backbone and a third bond connecting the
polar phosphorylcholine head group 66. PC may be synthesized by three distinct methods,
the great majority is synthesized through the CDP-choline pathway, also known as the
Kennedy pathway named after Eugene Kennedy the scientist who discovered it in 1956 40.
Since mammals are unable to synthesize choline de novo it must be supplied in the diet
and because of this choline is considered an essential nutrient. However, if dietary
choline is limited, the phosphoethanolamine N-methyltransferase (PEMT) pathway is a
critical secondary method for PC synthesis. The PEMT pathway occurs in the kidney but
is mainly active in liver tissue where the demand for PC is higher due to the secretory
nature of the organ and its role in the production of biliary lipids 67. In this pathway,
PEMT catalyzes a sequential three-step methylation of phosphatidylethanolamine using
SAM to produce PC 68. In a reverse reaction choline may be generated from PC through a
hydrolysis reaction with phospholipase A & D or during the base exchange reaction with
phosphatidylserine synthase 1; however PC derived through the PEMT pathway and
choline generated through the base-exchange reactions do not produce PC or choline in
sufficient concentrations to maintain liver homeostasis 70.
The importance of PC availability becomes very apparent when the body is
lacking as shown by knockout studies targeting choline kinase alpha (CHKα) and CCTα
13
of the CDP-choline pathway which are embryonically lethal. Liver specific CCTα-/- in
mice resulted in decreased PC synthesis and the accumulation of liver triacylglycerol in
spite of a 2 fold increase in PEMT activity 70. PEMT-/- in mice diminishes
phosphatidylcholine concentrations and these mice also demonstrate an up-regulation of
the CDP-choline pathway which partially compensates for PC synthesis. If these mice are
fed a choline deficient diet, neither the PEMT or CDP-choline pathway are available to
produce PC and in this case the PEMT mutation becomes lethal 71,72,73,74. These mice also
show a 50% reduction in VLDL and LDL triglyceride content, likely due to a decrease in
PC availability and the onset of fatty liver disease 75.
Together these studies show the importance of choline availability and PC
synthesis in the maintenance of hepatic lipid homeostasis. A lack of dietary choline or an
inability to metabolize PC has been linked with the development of metabolic disease
which is outlined in the following section.
1.6 Choline and Metabolic Disease
One of the first associations linking choline or lecithin with metabolic disease
occurred in 1930 through the work of C.H Best, J.M. Hershey and E. Hunstman. While
investigating the effects of insulin on depancreatized (diabetic) animals it was found that
the animals could not be kept in “good condition” through insulin injection alone and that
the animals would eventually die unless fed fresh pancreas. Upon autopsy it was noted
that a “fatty degeneration of the liver [was] responsible for the condition”. In an attempt
to alleviate the condition, lecithin was administered in the diet and quickly the liver
returned to normal appearance and the animals survived. In a single sentence Best
expressed the possibility that something within the lecithin extract may be the active
14
component responsible for the restoration of the liver 76. In 1932, Best and Huntsman
identified this active component as choline. In their work it was discovered that choline
deficiency was the root cause for the development of fatty liver in rodents placed on an
insufficient diet 77. Today the “fatty degeneration of the liver” is known as non-alcoholic
fatty liver disease (NAFLD) and can be triggered by a lack of dietary choline, but is most
commonly found in individuals suffering from metabolic disease and obesity. NAFLD is
characterized by the accumulation of triglycerides in the liver, at the moment there is
debate behind the primary mechanism responsible for this accumulation. A number of
possibilities such as increased lipid uptake/delivery to the liver, increased de novo
lipogenesis, decreased β-oxidation and decreased VLDL secretion have been postulated
as the instigator behind fat deposition. In support of the latter argument, recent studies
have found that mice lacking in dietary choline have lower PC content which effectively
decreases VLDL secretion and results in the accumulation of hepatic triglycerides
causing NAFLD 46,47.
It is well established that the majority of people who develop NAFLD also
present with other metabolic symptoms such as obesity, insulin resistance, diabetes,
dyslipidemia, hypertension and cardiovascular disease 78. The role of choline in the
mitochondria, specifically its oxidation to betaine and downstream methylation of
homocysteine coupled with its ability to affect VLDL secretion has stimulated interested
towards the function of choline in atherosclerosis and vascular plaque formation. A study
investigating if betaine supplementation would attenuate the development of
atherosclerosis in apolipoprotein E-/- null mice found that betaine supplementation
significantly inhibited the formation of atherosclerosis in the aortic sinus as well as

15
decreased levels of tumor necrosis factor-α in a dose dependent manner 79. Strangely this
occurred despite a rise in serum cholesterol and LDL-cholesterol levels. In this same year
the link between PC, low density lipoprotein receptor (LDLr) and atherosclerosis was
further explored and it was found that by eliminating PC synthesis through the PEMT
pathway, atherosclerotic plaque formation could be reduced by ~80% in ldlr-/- mice 43.
Alterations in VLDL phospholipid composition as well as decreased VLDL secretion are
known to occur in rats when dietary choline is restricted 80, 81,82. In a more recent study
the effect of choline supplementation on ldlr-/- mice fed a high fat, high cholesterol diet
found that increasing dietary choline resulted in a step-wise increase in atherosclerotic
plaque formation along the aortic root as well as increased liver PC and plasma
triglycerides 83. In an independent clinical study, it was found that dietary
supplementation with choline and trimethylamine N-oxide (TMAO) both promoted the
development of atherosclerosis and also triggered the appearance of macrophage
scavenger receptors associated with cardiovascular disease and foam cell formation.
Interestingly this effect could be inhibited through the suppression of intestinal
microflora, specifically flavin monooxygenases known to naturally produce TMAO 84.
These results establish a firm relationship between choline availability and hepatic
choline metabolism with various aspects of metabolic disease. In addition, choline
metabolism and metabolic disease both share a relationship with the circadian rhythmic
which will be explored in the following section.
1.7 The Circadian Rhythm and Liver Metabolism
Disruption of the circadian rhythm has a negative effect on metabolic homeostasis.
It has been known for some time that night-shift workers and individuals suffering from
16
sleep related disorders have a higher incidence of obesity, diabetes and metabolic
disease 85,86,87,88,89. The mechanisms underlying these connections have not been fully
understood but are slowly emerging with the help of knock out animal models.
1.7.1 The Circadian Rhythm
The majority of light-sensing organisms are equipped with a circadian mechanism
that allows the body to anticipate daily physiological needs and behavioural patterns.
These mechanisms operate over a rough 24 hour schedule and require environmental cues
such as the light/dark cycle, feeding and fasting cues as well as behavioural inputs to
remain properly synchronized. In mammals, the dominant circadian marker or Zeitgeber
(time giver) is the light/dark cycle which translates photic cues into neural and endocrine
signals 90. The system functions when light enters the eye and hits the retina, exciting
photosensitive retinal ganglion cells that transmit the signal along the retinohypothalamic
tract toward the suprachiasmatic nucleus (SCN), the body’s main pacemaker 91.
Stimulation of the SCN triggers the activation of signaling pathways related to chromatin
remodeling and the rhythmic transcription of clock genes. The SCN is also influenced by
the intergeniculate leaflet, raphe nuclei, the basal forebrain, pons, medulla and posterior
hypothalamus, which provide non-photic cues from feeding, body temperature and
exercise 90.
The rhythmic transcription of clock genes creates a self-sustaining transcription-
translation negative feedback loop. Photic cues trigger the transcription of brain and
muscle ARNT-like 1 (BMAL), a main clock protein which complexes with the CLOCK
protein creating a heterodimer. Once together BMAL/CLOCK bind to the E-box
promoters of period (PER) and cryptochrome (CRY) (negative regulators) stimulating
their transcription 92,93. PER and CRY exit the nucleus and are phosphorylated by casein
17
kinase 1. The activated PER and CRY proteins re-enter the nucleus where they inhibit
BMAL and CLOCK binding to target promoters 94, 95. During the night where there are
no photic cues, BMAL transcription comes to a halt and cytoplasmic PER and CRY are
tagged for degradation allowing for the cycle to begin anew 96. This process occurs over
24 hours and is where the body acquires its main rhythm. The BMAL/CLOCK
heterodimer also bind to the promoter regions of the nuclear receptors REV-ERBα and
RAR-related orphan receptor alpha (RORα). BMAL/CLOCK binding stimulates REV-
ERBα transcription in the morning and inhibits RORα transcription. REV-ERBα acts as a
negative regulator and binds to RORE motifs within the BMAL promoter, suppressing
BMAL transcription later in the day 97,98. As BMAL transcription decreases, the RORα
promoter is cleared allowing for its transcription. As the levels of RORα rise overnight,
towards the early morning they stimulate BMAL transcription along with photic cue
activation of the SCN 99. The actions of REV-ERBα and RORα create what is known as
the secondary feedback loop.
1.7.2 Circadian disruption and liver metabolism
The two-loop circadian system is present in the majority of peripheral tissues,
including the liver. Using information from microarray and Nascent-seq studies coupled
with bioinformatics analysis it has been determined that roughly 10% of hepatic gene
expression is either rhythmically transcribed or undergoes post transcriptional
modification by circadian factors 98,100,101. The maintenance of liver homeostasis requires
the proper functioning of circadian factors, disruption of any major circadian protein has
been shown to provoke a negative outcome in the liver. For example, genome-wide
transcriptome profiling in the livers of wild-type and REV-ERBα-/- mice concluded that
REV-ERBα regulates sterol regulatory element-binding protein (SREBP) activation and
18
in turn affects target genes involved in cholesterol and lipid metabolism 102. In addition it
was found that REV-ERBα regulates cholesterol 7 alpha-hydroxylase (CYP7A1) and
through this, influences bile acid metabolism. In these mice, knockout of REV-ERBα
resulted in elevated levels of circulating low density lipoprotein (LDL) and high density
lipoprotein (HDL) and decreased bile acid production as a result of SREBP and CYP7A1
disruption. Although the mechanisms were not pursued REV-ERBα was also shown to
regulate elongation of very long chain fatty acids proteins 3 and 5, Lipoprotein
lipase, Fatty acid binding protein 5, Acyl-CoA thioesterase 3, and phosphatidylcholine
transfer protein as well as the transcription of miR-122, a partially characterized miRNA
known to function in lipid and cholesterol metabolism 103,104. In terms of larger scale gene
control, chromatin immunoprecipitation has provided evidence of REV-ERBα mediating
the rhythmic recruitment of histone deacetylase 3 (HDAC3), an epigenetic repressor, to
the liver and corresponding changes in lipid synthesis. A direct correlation was found to
occur between REV-ERBα and hepatic HDAC3 levels which also demonstrated 24 hour
periodicity 105. Other circadian nuclear factors such as RORα have also been shown to
play a role in liver lipid metabolism. RORα -/- mice present with decreased hepatic and
serum triglycerides, and elevated HDL cholesterol. In a 2008 study, candidate based
expression profiling suggested that the changes in lipid metabolism seen in RORα-/- mice
are associated with decreased expression of hepatic SREBP-1c, ATP-binding cassette
transporter 1 and subfamily G member 1 genes 106. Decreased adiposity despite increase
food intake is another characteristic of RORα null mice which in the same study was
thought to be generated through increased expression of PPARγ coactivator 1 and lipin1
in liver and adipose tissue. Interestingly change in adiposity and body mass index can be
19
accomplished by simply changing the feeding time of mice 106. Restricting mice to light
cycle feeding has been shown to result in significant weight gain in comparison to mice
fed during the dark cycle, despite having consumed equal proportions 107. Changes in
weight and the development of obesity have also been reported in CLOCK-/- mice. In
addition to a profound disruption in circadian rhythmicity, CLOCK-/- mice develop
numerous metabolic complications. Alterations in feeding time are an obvious behaviour
change observed in clock deficient mice who consume food in equal proportions
throughout the light and dark cycles, which goes against the typical dark cycle feeding
pattern. The mice develop on average 20-25% more visceral adipose than wild-type mice
and have been shown to acquire a myriad of metabolic issues including fatty liver,
hypercholesterolemia, hyperglycemia and hypoinsulinemia 108. Circadian links to insulin
secretion and lipid metabolism have also been associated with loss of BMAL. In both
global BMAL deficiency as well as in acute hepatic depletion, loss of BMAL function
has been shown to decrease protein kinase B activation and lower rapamycin-insensitive
companion of mammalian target of rapamycin (RICTOR) expression in the liver, two
factors required for the initiation of insulin induced lipogenesis 109. Hepatic insulin
resistance has also been shown to occur in BMAL-/- mice along with mitochondrial
dysfunction resulting in mitochondrial swelling, decreased respiration and oxidative
stress 110.
There are a multitude of additional papers demonstrating the influence of the
circadian rhythm on liver metabolism and the reciprocal influence liver metabolism and
nutrient status has on circadian output. Perhaps the most relevant study examining
circadian regulation of choline metabolism was conducted in 2015 111. Researchers noted
20
that the rhythmic accumulation of hepatic PC typically seen to occur from ZT 22-0 in
wild-type mice was ablated in BMAL-/- mice. Loss of the circadian rhythm resulted in
perpetually elevated levels of hepatic PC, in addition these mice also demonstrated higher
levels of serum cholesterol, LDL and VLDL as compared to wild-type controls. Both
real-time PCR and a western blot analysis of Kennedy pathway enzyme expression,
revealed a clear 24 hour rhythmic pattern in CHKα expression with an acrophase
occurring at ZT1. This periodicity was ablated in BMAL-/- mice who unsurprisingly,
demonstrated perpetually elevated levels of CHKα expression 111. Interestingly, the
expression pattern of CHKα mimicked that of the REV-ERBα/RORα cycles and
following a bioinformatics analysis, two RORE binding sites were revealed within the
CHKα promoter which were confirmed by a transient co-transfection assay. Using REV-
ERBα-/- mice, analysis of CHKα expression revealed a perpetual 2-fold increase in
expression mimicking the results seen in the BMAL-/- mice and supporting the finding that
CHKα expression and ultimately PC synthesis is regulated by the REV-ERBα and RORα
circadian nuclear factors 111. Hepatic PEMT has shown a similar pattern with the height
of its expression occurring at night (ZT20) and slowly decreasing throughout the day,
unfortunately the mechanism underlying this regulation has yet to be confirmed 111,112.
Taken together these studies emphasize choline’s role in liver lipid metabolism
and demonstrate the importance of choline availability in maintaining metabolic
homeostasis by highlighting the physiological outcomes of choline deficiency. As well, a
connection between choline metabolism, metabolic disease and the circadian rhythm are
outlined however, a clear understanding of their connection remains to be determined.
21
RATIONALE AND OBJECTIVES
The essential role choline plays in maintaining metabolic homeostasis necessitates
our need to better understand its metabolism as a whole, as such the transport and
regulation of hepatic choline uptake merits characterization and insight. My first
objective revolved around the characterization of hepatic choline uptake with a particular
emphasis on understanding the CTL1-5 transport system and its contribution towards
choline uptake in the liver. Once I gained an understanding of choline transport, my
second objective was to understand how CTL1 expression and function are regulated.
Following a literature search I became interested in determining how CTL1 is affected
during obesity and if it may be regulated by the circadian rhythm. Finally for my third
objective I looked to determine if obesity affects the circadian regulation of CTL1
expression and function. The aim of my thesis was to provide data characterizing hepatic
choline transport and to evaluate possible regulatory mechanisms influencing CTL1
expression and function. I hypothesize that the CTL transport system mediates the
majority of hepatic choline transport and that its expression will follow a similar
rhythmic trend to that of CHKα. I also hypothesize that obesity will have an inhibitory-
like effect on either SLC44A1 expression and/or choline metabolism in the liver.
22
EXPERIMENTAL PROCEDURES
1.8 Animals
The mice used were C57Bl/6J (Jackson Laboratories) and were a minimum of 8
weeks of age, they were exposed to a 12-h light/dark cycle (7:00am/7:00pm) and were
fed ad libitum an 18% protein rodent diet (Envigo Teklad, 2018). Mice used in the
obesity studies were placed on a “Western” 60% high fat rodent diet (Open Source
Cedarlane, D12492) at 8 week of age for a 2-10 week period. The mice used in the
circadian rhythm studies were placed under 48 hour total darkness prior to organ
harvesting. Mice were anesthetized by intraperitoneal (IP) injection of ketamine/xylazine
(150 mg/kg ketamine/10 mg/kg xylazine), 10μl were injected per gram of weight and a
toe pinch was used to assess their level of consciousness. All of the experiments were
performed in accordance with animal care regulations.
1.9 Tissue Harvest and RNA Isolation
The mice were given an IP injection and allowed to rest, once they reached a
sufficient level of anesthesia (as determined by a toe pinch) they were cervically
dislocated and the left lobe of the livers surgically removed. The liver tissues were placed
in a clean 1.5 mL tube and flash frozen in liquid nitrogen.
The working surface as well as all the required tools and gloves were sprayed
with RNase Away (MβP, 7002) to ensure that the space was free of RNases. Before RNA
isolation could begin the liver tissues required homogenizing. This was accomplished by
sectioning a small piece of the lobe (typically between 25-35 mg in weight) over dry ice
and placing it into reinforced 2 mL homogenizer tubes (VWR, 10158-556) containing 1
mL of cold Tripure reagent (Roche Life Sciences) and three 2.8 mm ceramic beads

23
(VWR, 10158-554). The tubes were then placed into the Roche MagNa Lyser
homogenizer and rotated at 6,000 rpm for 30 seconds. The tubes were placed on ice and
brought into the fume hood where the homogenate was pipetted using 1 mL filter tips
into clean 1.5 mL tubes and 200 μl of 99.8% chloroform added. The sample were briefly
vortexed then allowed to incubate on ice for 5 minutes before being spun for 15 minutes
at 12,000 x g. In the fume hood, the upper aqueous phases was separated into a new tubes
and combined with 500 μl of 99% isopropanol. The samples were vortexed briefly and
spun again at 12,000 x g for 10 minutes. The supernatants were discarded and the
pelleted RNA was washed with 75% ethanol and spun at 12,000 x g for 10 minutes. The
supernatant was discarded and the tubes were carefully dried using a folded microscope
wipe, the pelleted RNA was resuspended in 200 μl of RNAse/DNase free water and
dissolved at 55°C for 10 minutes. The RNA was mixed well by pipetting up and down,
and the RNA concentration and purity were determined using a Take3 plate (BioTek)
blanked with water and the BioTek Synery H1 microplate reader measuring the
absorbance at 260/280 nm. The purities from each sample were always 2.0 +/- 0.1 and
equalized with water to the lowest sample RNA concentration.
1.10 cDNA synthesis
cDNA synthesis was accomplished using kits from Qiagen and BioRad. The first
kit (Qiagen) was the QuantiNovaTM reverse transcription kit. For this 6.5 μl of equalized
RNA was pipetted into a 200 μl 8-strip PCR tube (Diamed, 17062) and combined with 1
μl of the kits gDnase wipeout buffer used to eliminate genomic DNA contaminants. The
samples were incubated on a thermo cycler (BioRad T100 Thermal Cycler) for 2 minutes
at 45°C. During this time a master mix containing 0.5 μl reverse transcription (RT)
24
enzyme and 2 μl of the RT buffer mix were prepared. 2.5 μl of the master mix was added
to each sample and briefly spun on a bench top microcentrifuge (Mandel). The samples
were run on the thermal cycler under the following conditions; 3 minutes at 25°C, 10
minutes at 45°C and 5 minutes at 85°C, the resulting cDNA was diluted 1:20 with
RNAse/DNase free water. The second cDNA synthesis kit was the ABM AccuRT
Genomic DNA Removal Kit in combination with the 5X All-In-One RT Master Mix kit.
The gDNA removal kit was used according to the manufacturer’s instructions, where 1 μl
of sample was combined with 1 μl accuRT reaction mix and 2 μl RNAse/DNase free
water and was incubated at room temperature for 5 minutes. The 4 μl of sample was then
combined with 1.25 μl of the All-In-One RT Mastermix and placed under the following
cycling conditions; 25°C for 10 minutes, 42°C for 20 minutes and 85°C for 5 minutes.
The samples were diluted 1:20 with the addition of 118.75 μl of RNAse/DNase free water.
1.11 Real-time qPCR
Real-time qPCR was accomplished with the QuantiNovaTMProbe PCR kit. Here, 5
μl of the kits’ master mix was combined with 0.25 μl of a desired TaqMan primer. This
master mix, was then aliquoted to 0.1 ml tubes before the addition of 4.75μl of diluted
cDNA sample. The qPCR samples were run on the Rotor-Gene Q series (Qiagen) and
cycled 40 times (5 seconds at 95°C, 5 seconds at 65°C, fluorescence was measured from
470-510nm, gain 5). Relative expression was measured using the delta-delta critical
threshold method and standardized to the house keepers βactin and the ribosomal protein
rplo 114.
25
1.12 Murine Primary Hepatocyte Isolation
Primary hepatocytes were isolated via a collagenase perfusion technique 115. This
procedure began with an IP injection of anesthetic, once the mouse had reached a
sufficient level of anesthesia (as determined by a toe pinch) the arms and legs of the
animal were pinned to the underlying cardboard and the mouse was wiped down with
70% ethanol. A ventral midline incision beginning from the top of the hind legs and
extending over the ribcage was used to separate the skin into two flaps. The flaps were
further extended by cutting the skin along the inside of the appendages being careful not
to sever the femoral or subclavian veins. Using a set of forceps the skin flap was pulled
up and reflected laterally, carefully the fascia connecting the skin to the peritoneum was
cut and the was skin excised. The peritoneum was opened in the shape of a U extending
from the ribcage to the pelvis and the intestines moved to the left of the animal using a
Kim Wipe. Carefully, any accessory ligaments connecting to left lateral lobe of the liver
or extending transversally across the inferior vena cava were cut to prevent tearing of the
organ during the procedure. A fine pain of forceps was used to tunnel underneath the
inferior vena cava, superior to the renal arteries. Through this opening a wet suture was
slipped underneath the vein and a loose knot tied around the vasculature. Using the
locking forceps a 25 gauge needle bit was broken from the plastic mold and the base
inserted into the polyethylene tubing (1.09 mm) connecting the perfusion pumps. At a
shallow angle and with the bevel facing up, the needle was carefully inserted upward into
the inferior vena cava using the needle groove forceps, the suture knot was gently yet
firmly fastened and knotted a second time to secure the position of the needle. Quickly
the diaphragm was cut open and the superior vena cava was clamped just superior to its
entrance into the liver. The portal vein was located and cut proximate to the pancreas and

26
the pump was initiated. First the liver was perfused with an EGTA-HEPES buffer (142
mM/L NaCl, 6.7 mmol/L KCL, 10 mmol/L HEPES and 50 μmol/L EGTA, pH 7.4) to
clear the liver of blood cells, followed by a collagenase-HEPES buffer (66.7 mmol/L
NaCl, 6.7 mmol/L KCL, 5mmol/L CaCl2-2H2O and 100.7 mmol/L HEPES, 0.5%
collagenase pH 7.6) to digest collagen connections, at a rate of 7 ml/min for both
solutions.
Post perfusion the connecting ligaments were cut and the liver was extracted and
placed in a petri dish with media and in a laminar flow hood hepatocytes were teased
from the liver using a sharp set of forceps and dispersed into the 5 mL of Williams E
complete media (Williams medium E (Wisent, 301-018-Cl) with 10% fetal bovine serum
(Wisent, 080150) and 1% penicillin-streptomycin (Hyclone, SV30010) and 1% L-
glutamine (Wisent, 609-065-EL)). The cells were strained through a 100 micron cell
strainer and using a serological pipette the cells were transferred evenly into two 15 mL
tubes and spun at 600 rpm for 5 minutes. The supernatant was removed and the pellet
washed with Williams media and spun for a second time.
Once the supernatants were removed the hepatocytes were resuspended in 10 mL
of warm media, their viability was assessed using a trypan blue stain and counted with a
hemacytometer. This was accomplished by combining 80 μl of media with 10 μl of
sample and 10 μl of trypan blue stain. The solution was mixed by pipetting up and down
and 15 μl loaded onto both wells of the hemacytometer and the apparatus placed under
the microscope. While counting the cells, the tubes were placed in the incubator at 37°C.
Using the 10X objective the cells were counted on each of the 5, 1 mm2 squares which
make up the larger square of the grid. Cells which touched the bottom and left sides of
27
the individual square were not counted, cells which touched the top and right sides of the
squares were included in the total. The mean number from each 1 mm2 square were
averaged. To determine the number of hepatocytes per mL the following equation was
used:
# Cells/mL = Average # of cells/mm2 x dilution factor (10) x 104 (mL/100 nL).
An appropriate volume of hepatocytes was diluted to 200,000 cells/mL for a 24-
well plate, 400,000 cells/mL for a 12-well plate or 600,000 cells/mL for a 6-well plate.
The day before the hepatocyte isolation, the plates were coated with 1 mL of rat tail
collagen (Fisher, a1048301) in 0.1% acetic acid and incubated for 30 minutes. The
collagen was removed using a serological pipette, the wells were washed with PBS and
the plates were left to dry in the laminar flow hood overnight. The hepatocytes were
plated onto the collagen coated plates in Williams E complete media and allowed to
adhere for 4 hours before washing with 1X PBS (137 mM NaCl, 2.7 mM KCl, 4.3 mM
Na2HPO4, 1.47 mM KH2PO4, pH 7.4).
1.13 Rate of Hepatic Choline Uptake
Primary hepatocytes were plated onto 24-well plates (200,000/well) and incubated
in media for one day. The cells were then incubated in Krebs-Ringer-HEPES buffer
(KRH) (130 mM NaCl, 1.3 mM KCl, 2.2 mM CaCl2, 1.2 mM MgSO4, 1.2 mM KH2PO4,
10 mM HEPES, 10mM glucose, pH 7.4) for one hour prior to commencement of the
assay which allowed for the clearance of exogenous choline. The cells were washed once
with 300 μL of KRH buffer and a treatment containing 1 μCi/mL of 3H-choline in KRH
buffer was applied to the wells at each respective time point. The treatments were
removed at the same time and each well washed twice with 300 μl of KRH buffer, lysed

28
in 150 μl of 0.1M NaOH and freeze-thawed at -80°C. Once the plates had thawed on ice,
the wells were scrapped and the samples spun at 14,000 rpm for 10 minutes. A 50 μl
aliquot of supernatant was added to 5 mL of scintillation fluid (Ultima GoldTM
Scintillation Cocktail, Perkin Elmer) and the radioactivity (1 minute/vial, DPM) was
measured by the Tri-Carb beta-scintillation counter (2910TR, Perkin Elmer). For each
sample 12.5 μl of supernatant was used with the Pierce BCA Protein Assay Kit (Thermo
Fisher Scientific) to measure protein concentration.
1.14 CTL Uptake Inhibition Assay
For all inhibition assays primary hepatocytes were plated in collagen coated 24-
well plates at 200,000 cells/well and assays completed within 48 hours. An hour prior to
uptake, the hepatocytes were incubated in KRH buffer to clear exogenous choline and
free transporters for uptake. Following the hour of incubation, the cells were washed once
with 300 μl of KRH buffer. The choline analog hemicholinium (Sigma, H108-500MG)
dissolved in DMSO, was used to inhibit choline transport via high and intermediate
affinity transporters. Inhibition of OCT transporters was accomplished with the use of
quinine hydrochloride (Tocris, 130-89-2) in substitution for hemicholinium. 500 μl of
treatment containing 1 μCi/mL of 3H- choline chloride in KRH and increasing amounts of
hemicholinium (0-200 μM) were applied to each well in triplicate and incubated at 37°C
for 10 minutes. Following incubation the cells were washed twice with 300 μl of KRH
buffer, lysed in 150 μl of 0.1M NaOH and immediately frozen at -80°C. Once the plates
thawed, the cells were scraped from the wells and spun down at 14,000 rpm for 10
minutes at 4°C. From the supernatant 50 μl were added to 5 mL of scintillation fluid and
the radioactivity counted using the Tri-Carb beta-scintillation counter. For each sample

29
12.5 μl of supernatant was used with the Pierce BCA Protein Assay Kit to measure
protein concentration.
1.15 Saturation Kinetics of the CTL Choline Transporter System
Primary hepatocytes were plated onto 24-well plates (200,000/well) and incubated
in Williams E complete media for one day. One hour prior to the commencement of the
assay the cells were then incubated in KRH buffer and then washed once with 300 μl of
KRH buffer. Treatments containing 1 μCi/mL of 3H-choline chloride and increasing
amount of unlabeled choline chloride (0-400 μM) in KRH buffer, were applied in
triplicate to their respective wells and incubate for 10 minutes at 37°C. Following
incubation the cells were washed twice with 300 μl of KRH buffer, lysed in 150 μl of
0.1M NaOH and immediately frozen at -80°C. Once the plates thawed, the cells were
scraped from the wells and spun down at 14,000 rpm for 10 minutes at 4°C. From the
supernatant 50 μl were added to 5 mL of scintillation fluid and the radioactivity counted
using the Tri-Carb beta-scintillation counter. For each sample 12.5 μl of supernatant was
used with the Pierce BCA Protein Assay Kit to measure protein concentration. The
following equation was used to calculate the uptake.
Rate of choline (nmol/mg/min) (B x C) / (A x T)
P
Where A represented the total radioactivity subjected to the cell (DPM), B was the
concentration of unlabeled choline chloride (μM), C was the radioactivity in the sample
(DPM), T was the uptake time (minutes) and P represents the amount of protein in the
30
sample (mg). The uptake rate of choline was plotted against the substrate concentration to
generate Michealis-Menten kinetics.
1.16 Compound Preparation and Treatment of Primary Murine Hepatocytes
Primary hepatocytes were plated onto 24-well collagen coated plates (200,000
cells/well) and incubated in Williams E Complete media. One hour prior to the
application of the treatments the cells were incubated in KRH buffer at 37°C. Following
incubation the cells were washed once with 200 μl of PBS and 500 μl of each treatment
was applied to the cells in triplicate. The cells were then incubated for either 10 minutes,
4 hours or 24 hour at 37°C with the treatments. Following incubation the treatments were
aspirated and the cells washed with 200 μl of PBS. The cells were lysed with either
Tripure, 0.1M NaOH or flash frozen in PBS as appropriate.
The treatments were made up as follows; 1) the 0.5 mM Oleate treatment; 15.2
mg of sodium oleate (Sigma, O7501-1G) was dissolved in 400 μl of ethanol and 400 μl of
water and heated to 70°C until dissolved. 1.5 g of Bovine Serum Albumin (Sigma,
A8806-5G) was added to 150 mL of media (1%). From this solution 60 mL was
combined with 600 μl of dissolved oleate and incubated for one hour at 37°C. This
incubation allowed oleate to conjugate with albumin and increase its solubility. 2) the 0.5
mM Palmitate treatment; sodium palmitate (Sigma, P9767-10G) was solubilized in 400
μl of ethanol and 400 μl of water and heated to 70°C until dissolved. 3) the 10 nm, 100
nm, 100 nm dexamethasone treatment; 5 mg of dexamethasone was solubilized in 5 mL
of ethanol (1mg/ml) before being combined with the necessary quantity of media for the
desired concentration. 4) Glucose (Sigma, G7879-500MG) was solubilized in dH2O and
filtered through a 0.22 μm Millex®GP filter (Millipore) before it was combined with
31
media to produce a 0.5 M solution. 5) Insulin (Sigma, I0516 from bovine pancrease)
treatments were prepared by combining 12 μl of insulin was 4.08 mL of media to make a
1000 nM solution, from here the solution was diluted using media to 100 nM and 10 nM
concentrations.
1.17 Circadian Time Trials
Only female C57BL/6J wild-type mice were used in this experiment and mice
were exposed to a 12 hour light-dark cycle (7:00am ZT2 /7:00pm ZT 14). At 7:00 am the
mice were injected with anesthetic, once the mice had reached a sufficient level of
anesthesia they were cervically dislocated. Immediately the mice were opened by making
a small cut into the skin and degloved, the peritoneal cavity was opened quickly and the
liver was located. The left liver lobe was removed and flash frozen in liquid nitrogen.
This same procedure was repeated every 6 hours for a 24 hour period. The organs were
stored at -80°C until processed.
Dr. Figey’s lab provided liver samples from 8-week old male C57BL/6 wild-type
mice. These mice were placed in complete darkness for 48 hours prior to organ
harvesting which removed photic regulation and allowed for the direct measurement of
the metabolic clock. Every two hours for 46 hours, two-three mice were anesthetized,
cervically dislocated, their livers removed and stored at -80°C.
1.18 Bligh & Dyer Lipid Extraction
Before the lipid extraction could begin the liver tissues required homogenizing,
this was accomplished by sectioning a small piece of the lobe (typically between 35-40
mg in weight) over dry ice and placing it into reinforced 2 mL homogenizer tubes
32
containing 500 μl of PBS and three 2.8 mm ceramic beads. The tubes were then placed
into the Roche MagNa Lyser homogenizer and rotated at 6,000 rpm for 30 seconds. The
tubes were placed on ice and brought into the fume hood where 200 μl of homogenate
was combined with 750 μl of chloroform:methanol (1:2) briefly vortexed and incubated
for 10 minutes on ice. Then, 250 μl of chloroform and 250 μl of dH2O was added, the
samples were briefly vortexed and spun for 5 minutes at 3,000 rpm. The bottom lipid
phases were separated into clean 1 mL tubes, 50 μl of the lipid sample was combined
with 5 mL of scintillation fluid and the radioactivity counted (1 minute) on the beta-
scintillation counter (Tri-Carb 2910TR, Perkin Elmer).
1.19 Blood Serum Choline Quantification Assay
Blood samples were allowed to clot on ice for 20 minutes then spun at 5,000 rpm
for 5 minutes and the serum separated. The EnzyChromTM Choline Assay Kit (BioAssay
System, ECHO-100) colormetric assay was used to quantify serum choline levels. The kit
standards were made up in dH2O according to the manufacturers’ instructions and 20 μl
of each standard was pipetted on a clean 96-well plate in duplicate. 20 μl of serum was
transferred into individual wells in duplicate. A working reagent was prepared and for
each well 85 μl of Assay Buffer, 1 μl of Enzyme Mix and 1 μl of Dye Reagent was
combined. 80 μl of Working Reagent was added to the standard and sample wells, the
plate was then incubated for 30 minutes at room temperature. After 30 minutes the
colourmetric change was detected by the Biotek synergy H1 microplate reader at on
optical density of 570nm. The blank absorbance was subtracted from the standard values
to give the optical density, these values were plotted against known concentrations of the
standards to create a standard curve. From here the slope was determined and the
33
concentration of choline from the unknown sample was determined using the following
equation:
Concentration of choline μM (A - B) x n m
Where A represents the absorbance of the sample nm, B was the absorbance of the blank
nm, m is the slope of the standard curve μM-1, and n is the sample dilution factor.
1.20 Tissue based Chromatin Immunoprecipitation
1.20.1 Cross-linking and Chromatin Preparation
The liver samples were taken from the -80°C freezer and placed onto dry ice.
Each liver was sectioned in a clean perti dish over dry ice and placed into a dounce
homogenizer containing 1 mL of cold 1.5% paraformaldehyde in PBS. The tissue was
gently homogenized until a only a unicellular suspension remained. The suspension was
pipetted into a 15 mL tube containing 10x volume to tissue weight of the liver piece, of
cold 1.5% paraformaldehyde in PBS and rocked at room temperature for 10 minutes. The
cross linkage was stopped after 10 minutes by adding 1% volume of 1.375 M glycine
solution. The cells were pelleted by spinning at 1000 rpm for 10 minutes at 4°C, the
supernatants were removed and the pellet was resuspended in 10 mL of ChIP Lysis buffer
(5 mM PIPES (pH 8.0), 85 mM KCl, 0.5% NP-40) and incubated on ice for 10 minutes.
The cell nuclei were pelleted by spinning at 1000 rpm for 10 minutes at 4°C. The
supernatant was removed and the pellet was resuspended in 1 mL of nuclei lysis buffer
(50 mM Tris-Cl (pH 8.0), 10 mM EDTA, 1% SDS) and incubated on ice for 10 minutes.
34
Sonication of the DNA was accomplish through two separate methods. The first method
required the use of the 60 sonic dismembrator probe sonicator (Fisher Scientific). Each 1
mL sample was transferred into a clean 1.5 mL tube and placed on ice. The probe
sonicator was placed on output level 2 (watts/RMS), carefully without touching the sides
of the tube, the probe was placed into the center of the liquid sample and held for 15
seconds. The sample was then removed and placed on ice for 30 seconds to prevent
heating. The sample was sonicated in this manner 5 more times for a total of 6 pulses. To
analyze the samples’ DNA for proper sonication 50 μl was transferred into a clean 1.5
mL tube and combined with 70 μl of elution buffer (50 mM Tris-Cl (pH 8.0), 10 mM
EDTA, 1% SDS) and rotated in a water bath over night at 65°C. The remaining sample
was either frozen at -80°C overnight or proceeded to the next step.
1.20.2 Chromatin Preclearing and Immunoprecipitation
The samples were thawed on ice, to pellet the SDS the samples were centrifuged
at 14,000 rpm for 15 minutes at 4°C. The supernatant was transferred to a clean 1.5 mL
tube, the concentration and purity of the chromatin was measured using a Take3 plate
(BioTek) blanked with nuclei lysis buffer and the BioTek Synery H1 microplate reader
measuring the absorbance at 260/280 nm. One hundred μg of chromatin was taken from
each sample. The 100 μg aliquot was diluted using dilution buffer (16.7 mM Tric-CL (pH
8.0), 167 mM NaCl, 1.2 mM EDTA, 0.01% SDS, 1.1% Triton X-100) to a final volume
of 300 μl. A bottle of protein A-agarose beads/salmon sperm DNA beads (Cedarlane,16-
157) was gently resuspended by pipetting up and down, 50 μl of the bead slurry was
added to preclear each sample. The tubes were rotated end over end for 1-2 hours at 4°C.
35
After the incubation, the samples were spun at 3000 rpm for 5 minutes at 4°C, the
supernatants were then transferred to fresh 1.5 mL tubes. A 20 μl sample was taken and
set aside to be used later as a no antibody control. 5 μl of the anti-REV-ERBα (Cell
signaling, 13418S) or anti-RORα (Abcam, ab60134) was added to the designated samples
and the tubes were rotated end over end overnight at 4°C.
1.20.3 Washing and Elution
The samples were removed from the rocker and placed on ice. 50 μl of protein A-
agarose beads/salmon sperm DNA beads were added to the samples and the tubes were
rotated end over end for 2 hours at 4°C. The tubes were removed and the beads pelleted
by spinning at 3000 rpm for 3 minutes at 4°C. The supernatants were carefully removed
and the beads washed with a high salt wash solution (50mM HEPES (pH 7.9), 500 mM
NaCl, 1 mM EDTA, 0.1% SDS, 1% Triton x-100, 0.1% deoxycholate) and rotated end
over end for 10 minutes at room temperature. The samples were spun at 3000 rpm for 3
minutes at room temperature and the supernatant removed. The samples were washed
three more times in high-salt wash buffer and twice with TE buffer. The beads were
pelleted by spinning at 3000 rpm for 3 minutes and the supernatants removed. The pellet
was resuspended in 300 μl of elution buffer supplemented with 1 μl of proteinase K (20
μg/ μl) and incubated at 55°C for 2 hours to activate the proteinase K. To reverse the
cross linkage the samples were incubated over night at 65°C while shaking.
36
1.20.4 DNA Purification
The samples were removed from the incubator and spun at 14,000 rpm for 5
minutes at room temperature. The supernatants were transferred to a clean 1.5 mL tube
and the DNA purified using the QIAquick PCR Purification Kit (Qiagen, 28104). For this
5 volumes Buffer PB was combined with 1 part supernatant and mixed by pipetting up
and down. 750 μl of the mix was transferred into a QIAquick spin column and spun at
13,000 rpm for 1 minute at room temperature. The flow through was discarded and the
DNA was washed with 750 μl of Buffer PE and spun under the same conditions. The
flow through was discarded and the sample spun once more to ensure all of the liquid had
passed through the filter and the flow through was discarded again. To elute the DNA 50
μl of RNase/DNase free water was added to the membrane and spun at 13,000 rpm for 1
minute at room temperature. From here 15 μl of sample was combined with 5 μl of
loading dye and run on a 1.5% gel at 110V for 45 minutes. The gel was imaged for 20-30
seconds with the BioRad Gel Doc XRT.
1.21 BCA Protein Quantification Assay
The PierceTM BCA Protein Assay Kit (Thermo Scientific, 23225) was used to
quantify protein samples. Samples were spun at 14,000 rpm for 15 minutes, the
supernatants were separated and used for quantification. The kit standards were made up
in dH2O according to the manufacturers’ instructions. In a clean 96-well dish, 25 μl of
the kit standards were loaded in duplicate, for most protein quantifications 0.1 M NaOH
or dH2O were used as the blanks. First 12.5 μl of dH2O were loaded into the sample
wells using a multichannel pipette, following this 12.5 μl of each sample was loaded in
37
duplicate. The working reagent was made up immediately prior to loading and consisted
of 50 parts of Reagent A and 1 part Reagent B. Using a multichannel pipette 25 μl of
working reagent was combined with the standards and sample wells, the plate was then
incubated at 37°C for a half hour. After incubation the plate was analyzed by the BioTek
Synery H1 microplate reader measuring at 562 nm. The absorbance of the standards and
samples were subtracted by the absorbance of the blank, then the absorbance of the
standards was plotted against their known concentration in μg/mL to create a standard
curve. The standard curve was then used to determine protein concentration of the
unknown samples.
1.22 Western blots
A combination of denaturing and non-denaturing (no detergents or reducing
agents) conditions were used for CTL1 western blots. To begin protein concentrations
were analyzed using the The PierceTM BCA Protein Assay Kit and equalized in non-
denaturing lysis buffer (50mM Tris, 1mM EDTA, 150 mM NaCl, 100 μM Sodium
Orthovanidate, 1 Pierce Mini Protease Inhibitor Tablet EDTA-free, made up to 10 mL
with dH2O). 15 μl of each sample was combined with 5 μl of non-denaturing loading dye
and loaded onto a 10% SDS-Page Gel (390 mM Tris pH 8.8, 0.01 mM SDS, 340 mM
Acrylamide, 0.01 mM APS, 0.4 μM Temed) no boiling of the samples occurred. The
denaturing gel was run in non-denaturing running buffer (250mM Tris, 1.9 M Glycine,
made up to 1L with dH2O, pH 8.3) for 90 minutes at 110V. A 6x8 cm rectangle of PVDF
membrane was methylated in 100% methanol for 2 minutes then equilibrated in 1X
Trans-Blot Turbo Buffer (47.8 μM Tris, 39 μM Glycine, 0.2mM methanol, make up to 1L

38
with dH2O) along with 14 pieces of Wypall transfer paper (Kimberly Clark, 35401) for 2
minutes.
The gel was removed from the casket, the line of dye was cut off and the gel
placed onto the PVDF membrane. The gel and PVDF membrane were sandwiched by the
equilibrated Wypall papers and the stack placed in the center of the Trans-Blot® TurboTM
Transfer System (Biorad) tray and loaded into the machine. The protein was transferred
for 16 minutes at 25V and 1.3A. Once complete the membrane was removed from the
stack and placed in a small dish containing 8 mL of a 5% BSA solution in 1X TBST (20
mM Tris, 150 mM NaCl, 0.05% Tween® 20) and rockered for 1 hour at room
temperature. After the hour of blocking, the membrane was washed four times in 1X
TBST for 5 minutes and rinsed with dH2O. The primary antibody (C-term CTL1 Rb) was
diluted 1/2000 in a 5% BSA solution in 1X TBST, applied to the membrane and rockered
over night at 4°C. The antibody was removed and the membrane was washed four times
in 1X TBST for 5 minutes and rinsed with dH2O. The secondary antibody, HRP
conjugated anti-rabbit IgG (Cell Signaling) was diluted 1/5000 with a 5% BSA solution
in 1X TBST, applied to the membrane and rocked for 1 hour at room temperature. The
secondary antibody was removed and the membrane washed four times in 1X TBST for 5
minutes and rinsed with dH2O. To visualized the membrane 1 mL of ClarityTM Western
ECL solution (BioRad) was applied to the membrane and incubated for 30 seconds, the
membrane was imaged using the LAS 4000 ImageQuant Imaging System (General
Electric) under the auto-image option for ~10 seconds.
39
1.23 In Vivo Choline Uptake
Wild type C57BL/6J chow fed or 60% high fat diet fed mice were given an IP
injection with 5 μCi of 3H-choline in saline and allowed to rest for one hour. At 50
minutes the mice were given an IP injection of anesthetic, at 60 minutes the mice had
reached a sufficient level of anesthesia and were cervically dislocated. The abdomen of
the mice were quickly sprayed with 70% ethanol and wiped down with a microscope
wipe. A small cut was made into the abdominal skin and the animal was degloved.
Quickly the abdominal cavity was opened and the left lobe of the liver surgically
removed. The tissue was placed in a clean 1.5 mL tube, flash frozen in liquid nitrogen
and stored at -80°C.
In some instances a 15 μl sample of blood was drawn from the tail vein after 30
minutes post 3H-choline injection and followed up by an IP injection of anesthetic. After
55 minutes a cardiac puncture was performed and 400 μl of blood drawn from the heart
before the animal was cervically dislocated and the liver removed.
1.24 Adeno Virus Treatment of Primary Hepatocytes
A vial of Adeno-mCherry virus (1.5 x 10¹⁰ pfu/mL) was obtained from Dr. Parks’
lab. In a laminar flow hood the virus was aliquoted and unused sample stored at - 80°C.
The virus was diluted in Williams E complete media to an MOI of 20, 10 and 5 using the
following calculation:
MOI (A x B) C

40
Where A is the number of cells per well multiplied by the desired MOI, B is the volume
needed for treatment and C is the number of plaque forming units per mL in the viral
sample.
Each well of primary hepatocytes was treated with 400 μl of virus in Williams E
complete media and incubated for 24, 48 and 72 hours at 37°C. The cells were visualized
using the Leica DMI 6000B Microscope (AF 6000 system) and imaged from 561/594 nm
(Texas Red) using the Leica Application Suite version 2.5.1 Build 869.
1.25 Procedure for the Removal of Obese and Time Dependent Mouse Livers
Male C57BL/6J mice were placed on a 10 week 60% high fat diet. Half of the
chow diet and half of the high fat diet cohorts were placed under 48 hours complete
darkness at 7:00 am and the other half at 7:00 pm. The procedure began the following
two days, under a red light the mice were given an IP injection with 5 μCi of 3H-choline
in saline and allowed to rest. After 30 minutes the mice were given an IP injection of
anesthetic, before being brought into the mouse room the cages were placed in a garbage
bag to minimize light exposure. One at a time the mice were removed from the bagged
cage and 400 μl of blood withdrawn via a cardiac puncture. A cervical dislocation was
performed immediately, the abdomen of the mouse was sprayed with 70% ethanol and
wiped with a microscope wipe. A cut was made in the abdominal skin, the animal was
degloved and the abdominal cavity was quickly opened. The left lobe of the liver was
removed and placed in a clean 1.5 mL tube, flash frozen in liquid nitrogen and stored at -
80°C.
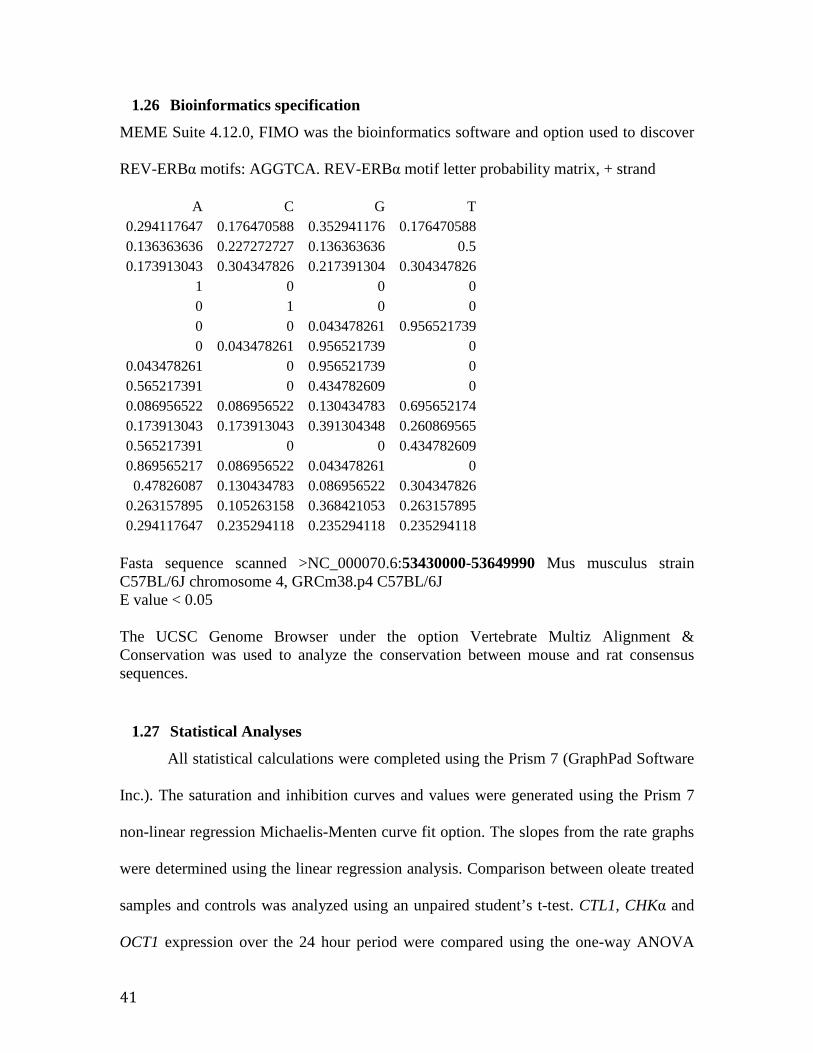
41
1.26 Bioinformatics specification
MEME Suite 4.12.0, FIMO was the bioinformatics software and option used to discover
REV-ERBα motifs: AGGTCA. REV-ERBα motif letter probability matrix, + strand
A C G T 0.294117647 0.176470588 0.352941176 0.176470588 0.136363636 0.227272727 0.136363636 0.5 0.173913043 0.304347826 0.217391304 0.304347826
1 0 0 0 0 1 0 0 0 0 0.043478261 0.956521739 0 0.043478261 0.956521739 0
0.043478261 0 0.956521739 0 0.565217391 0 0.434782609 0 0.086956522 0.086956522 0.130434783 0.695652174 0.173913043 0.173913043 0.391304348 0.260869565 0.565217391 0 0 0.434782609 0.869565217 0.086956522 0.043478261 0 0.47826087 0.130434783 0.086956522 0.304347826
0.263157895 0.105263158 0.368421053 0.263157895 0.294117647 0.235294118 0.235294118 0.235294118
Fasta sequence scanned >NC_000070.6:53430000-53649990 Mus musculus strain C57BL/6J chromosome 4, GRCm38.p4 C57BL/6J E value < 0.05
The UCSC Genome Browser under the option Vertebrate Multiz Alignment & Conservation was used to analyze the conservation between mouse and rat consensus sequences.
1.27 Statistical Analyses
All statistical calculations were completed using the Prism 7 (GraphPad Software
Inc.). The saturation and inhibition curves and values were generated using the Prism 7
non-linear regression Michaelis-Menten curve fit option. The slopes from the rate graphs
were determined using the linear regression analysis. Comparison between oleate treated
samples and controls was analyzed using an unpaired student’s t-test. CTL1, CHKα and
OCT1 expression over the 24 hour period were compared using the one-way ANOVA

42
analysis. CTL1 expression and choline incorporation in both obese and circadian
experiments were compared using a two-way ANOVA analysis, Sidak’s multiple
comparison. Statistical significance was assigned as follows: * p< 0.05, ** p< 0.01, ***
p< 0.001, **** p< 0.0001.
RESULTS
1.28 Choline Transport in Primary Hepatocytes
Liver choline transport has yet to be fully characterized. Studies have suggested
the existence of two choline transport systems and have detected both CTL and OCT
mRNA expression in liver, however a proper study of choline transport or an evaluation
of its contribution to the liver choline pool has yet to be completed 31,113. To begin
characterizing choline transport, primary hepatocytes were treated with 1 μCi/mL of 3H-
choline and incubated for increasing periods of time as described in the materials and
methods section (Figure 1 A). The initial rate of 3H-choline uptake was plotted against
the period of incubation which provided a linear plot (Figure 1 B). Since the slope of the
line remained linear or the uptake of choline remained constant over the 10 minute period,
this time frame was selected as the incubation period which would be used to evaluate the
kinetics of choline transporters. To investigate the kinetics of the choline transport system
and provide a base model for comparison, a choline saturation assay and inhibition assay
were performed. The saturation assay indicated a Vmax of 4.152 pmol/mg/min and a KM
of 75.76 μM, indicative of an intermediate affinity transport system. A choline inhibition
assay was accomplished using the choline analog hemicholinium, which gave an IC50 of
3.31 μM and inhibited roughly 80% of hepatic choline uptake. The CTL family is one of
two choline transporter families in the liver, the organic cation transporters are also
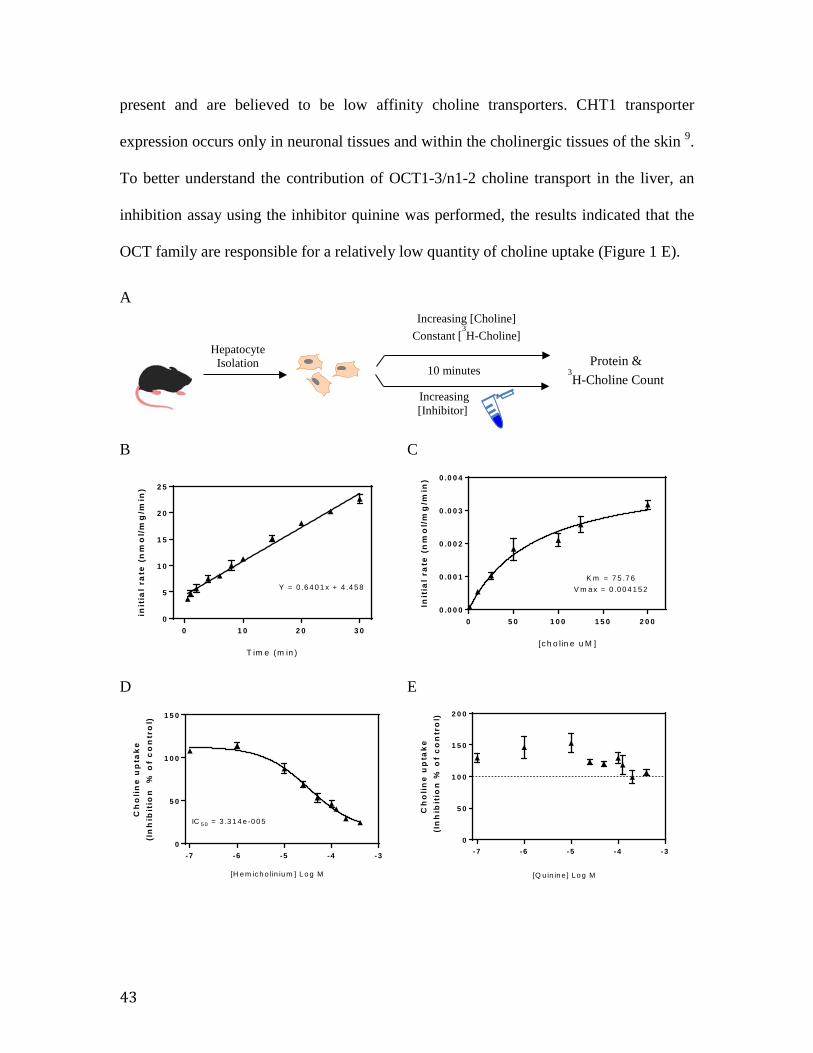
43
present and are believed to be low affinity choline transporters. CHT1 transporter
expression occurs only in neuronal tissues and within the cholinergic tissues of the skin 9.
To better understand the contribution of OCT1-3/n1-2 choline transport in the liver, an
inhibition assay using the inhibitor quinine was performed, the results indicated that the
OCT family are responsible for a relatively low quantity of choline uptake (Figure 1 E).
A
B C
0 1 0 2 0 3 00
5
1 0
1 5
2 0
2 5
T im e (m in )
init
ial
rate
(n
mo
l/m
g/m
in)
Y = 0 .6 4 0 1 x + 4 .4 58
0 5 0 1 0 0 1 5 0 2 0 00 .0 0 0
0 .0 0 1
0 .0 0 2
0 .0 0 3
0 .0 0 4
[c h o lin e u M ]
Init
ial
rate
(n
mo
l/m
g/m
in)
K m = 7 5 .7 6V m a x = 0 .0 0 4 1 5 2
D E
-7 -6 -5 -4 -30
5 0
1 0 0
1 5 0
Ch
oli
ne
up
tak
e(I
nh
ibit
ion
%
of
co
ntr
ol)
[H e m ich o lin ium ] L o g M
IC 5 0 = 3 .3 1 4 e -0 0 5
-7 -6 -5 -4 -30
5 0
1 0 0
1 5 0
2 0 0
Ch
oli
ne
up
tak
e
(In
hib
itio
n %
of
co
ntr
ol)
[Q u in in e ] Lo g M
Hepatocyte Isolation
Increasing [Inhibitor]
10 minutes Protein &
3H-Choline Count
Increasing [Choline] Constant [
3H-Choline]

44
Figure 1. Choline transport in primary murine hepatocytes. (A) Schematic of the experimental procedures, primary hepatocytes were isolated and plated. The following day the cells were incubated in the appropriate treatment for 10 minutes, washed twice and lysed. (B) Time course of 3H-choline uptake in hepatocytes following treatment with 1 μCi/mL of 3H-choline. (C) Choline saturation assay, hepatocytes were treated with 1 μCi/mL of 3H-choline and increasing concentrations of unlabeled choline chloride for 10 minutes. (D) CTL1-5 inhibition assay, hepatocytes were treated with 1 μCi/mL of 3H-choline and increasing concentrations of the inhibitor hemicholinium for 10 minutes. (E) OCT1-3/n1-2 inhibition assay where hepatocytes were treated with 1 μCi/mL of 3H-choline and increasing concentrations of the inhibitor quinine for 10 minutes. All data mean ± SEM from at least three livers, each performed in triplicate.
1.29 A Comparison of Choline Transporters and Metabolizing Enzymes between
Primary Hepatocytes and Liver Homogenate
Real time qPCR analysis was used to compare the transcript expression of choline
transporters and choline metabolizing enzymes between liver homogenates and primary
hepatocytes, and also to gain perspective on the overall expression profile. The results
show a significant decrease in SLC44A4 and PEMT transcript expression and a very
significant increase in CHKα transcript expression within primary hepatocytes.
S L C 4 4A 1
S L C 4 4A 2
S L C 4 4A 3
S L C 4 4A 4
S L C 2 2A 1
S L C 2 2A 2
C H K A
P C Y T 1
P E MT
0 .5
1 .5
2 .5
3 .5
Re
lati
ve
ex
pre
ss
ion
H o m o ge n a teP r im a ry
*
* * * *
* *
Figure 2. Relative mRNA expression assessed by quantitative real time qPCR. Relative expression of the SLC44A1-5 and SLC22A1-2 transporters and the CHKα, PCTY1/CCT and PEMT choline metabolizing enzymes from primary murine hepatocyte cell lysate and liver homogenate. All genes were standardized to βactin, all data mean ±
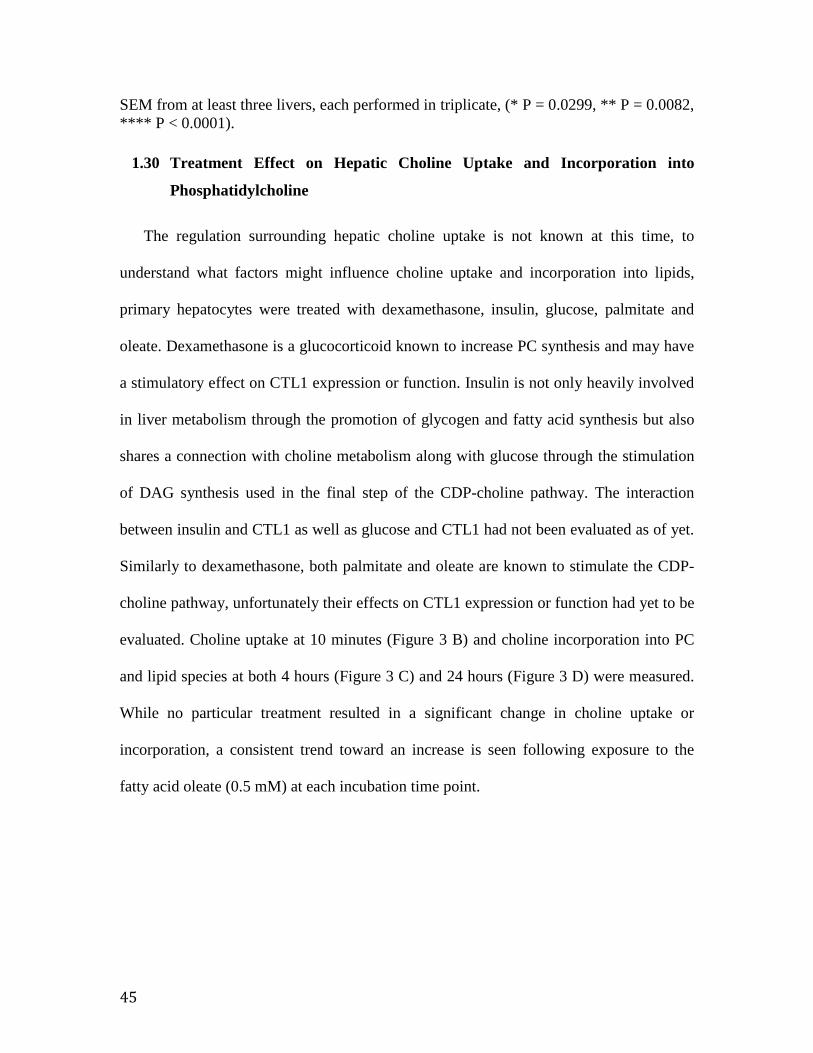
45
SEM from at least three livers, each performed in triplicate, (* P = 0.0299, ** P = 0.0082, **** P < 0.0001).
1.30 Treatment Effect on Hepatic Choline Uptake and Incorporation into
Phosphatidylcholine
The regulation surrounding hepatic choline uptake is not known at this time, to
understand what factors might influence choline uptake and incorporation into lipids,
primary hepatocytes were treated with dexamethasone, insulin, glucose, palmitate and
oleate. Dexamethasone is a glucocorticoid known to increase PC synthesis and may have
a stimulatory effect on CTL1 expression or function. Insulin is not only heavily involved
in liver metabolism through the promotion of glycogen and fatty acid synthesis but also
shares a connection with choline metabolism along with glucose through the stimulation
of DAG synthesis used in the final step of the CDP-choline pathway. The interaction
between insulin and CTL1 as well as glucose and CTL1 had not been evaluated as of yet.
Similarly to dexamethasone, both palmitate and oleate are known to stimulate the CDP-
choline pathway, unfortunately their effects on CTL1 expression or function had yet to be
evaluated. Choline uptake at 10 minutes (Figure 3 B) and choline incorporation into PC
and lipid species at both 4 hours (Figure 3 C) and 24 hours (Figure 3 D) were measured.
While no particular treatment resulted in a significant change in choline uptake or
incorporation, a consistent trend toward an increase is seen following exposure to the
fatty acid oleate (0.5 mM) at each incubation time point.
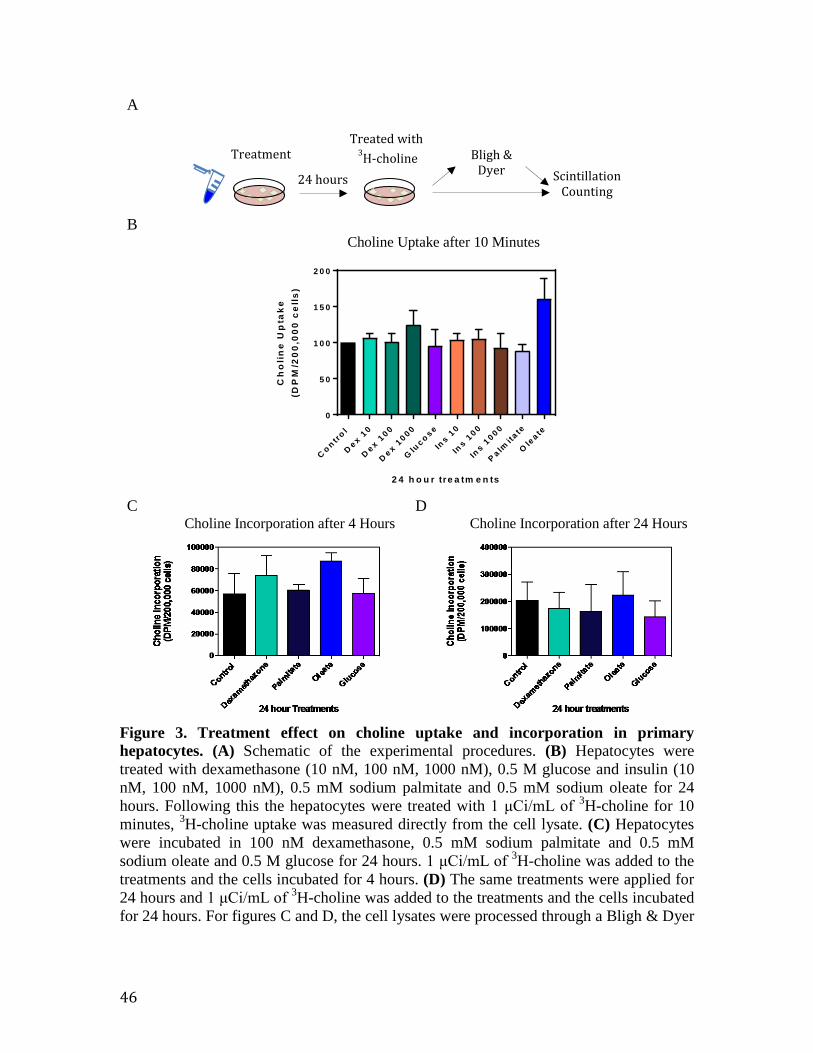
46
A
B
Choline Uptake after 10 Minutes
C o n trol
D e x 10
D e x 10 0
D e x 10 0 0
Glu
c o s e
Ins 1
0
Ins 1
0 0
Ins 1
0 0 0
P a lmita
te
Ole
a te
0
5 0
1 0 0
1 5 0
2 0 0
2 4 h o u r tre a tm e n ts
Ch
oli
ne
Up
tak
e(D
PM
/20
0,0
00
ce
lls
)
C D Choline Incorporation after 4 Hours
Choline Incorporation after 24 Hours
Figure 3. Treatment effect on choline uptake and incorporation in primary hepatocytes. (A) Schematic of the experimental procedures. (B) Hepatocytes were treated with dexamethasone (10 nM, 100 nM, 1000 nM), 0.5 M glucose and insulin (10 nM, 100 nM, 1000 nM), 0.5 mM sodium palmitate and 0.5 mM sodium oleate for 24 hours. Following this the hepatocytes were treated with 1 μCi/mL of 3H-choline for 10 minutes, 3H-choline uptake was measured directly from the cell lysate. (C) Hepatocytes were incubated in 100 nM dexamethasone, 0.5 mM sodium palmitate and 0.5 mM sodium oleate and 0.5 M glucose for 24 hours. 1 μCi/mL of 3H-choline was added to the treatments and the cells incubated for 4 hours. (D) The same treatments were applied for 24 hours and 1 μCi/mL of 3H-choline was added to the treatments and the cells incubated for 24 hours. For figures C and D, the cell lysates were processed through a Bligh & Dyer
24 hours
Treated with 3H-choline Bligh &
Dyer Treatment
Scintillation Counting
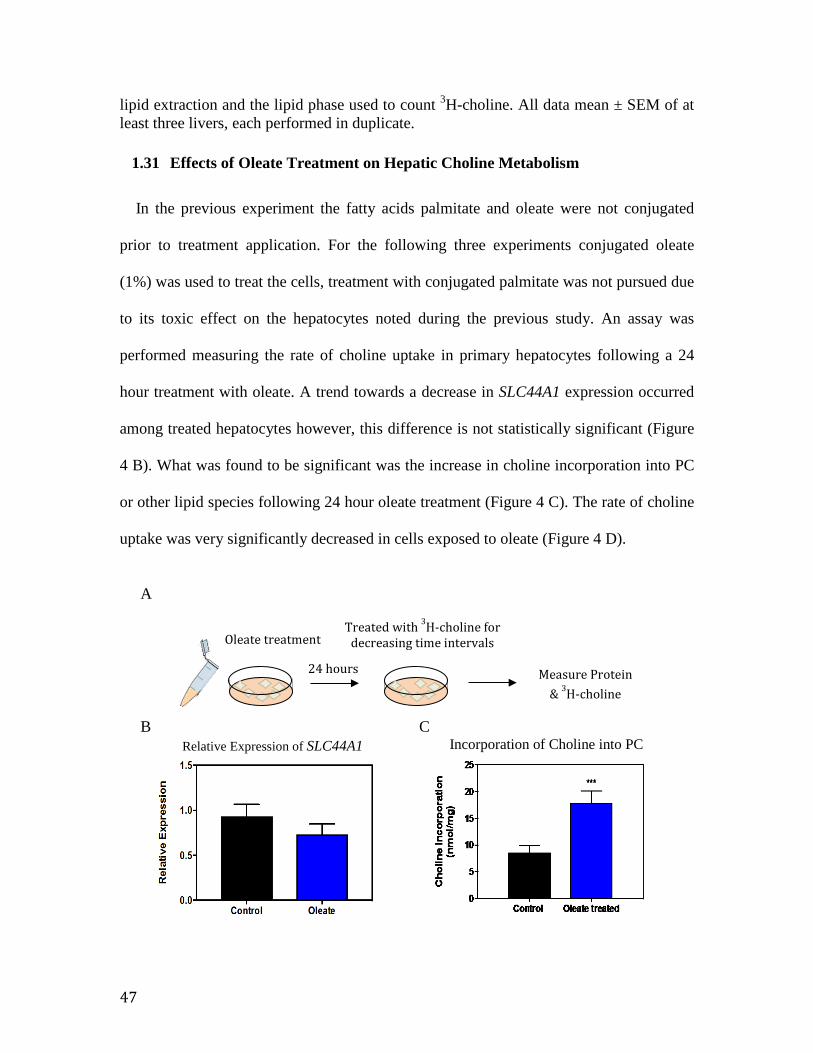
47
lipid extraction and the lipid phase used to count 3H-choline. All data mean ± SEM of at least three livers, each performed in duplicate.
1.31 Effects of Oleate Treatment on Hepatic Choline Metabolism
In the previous experiment the fatty acids palmitate and oleate were not conjugated
prior to treatment application. For the following three experiments conjugated oleate
(1%) was used to treat the cells, treatment with conjugated palmitate was not pursued due
to its toxic effect on the hepatocytes noted during the previous study. An assay was
performed measuring the rate of choline uptake in primary hepatocytes following a 24
hour treatment with oleate. A trend towards a decrease in SLC44A1 expression occurred
among treated hepatocytes however, this difference is not statistically significant (Figure
4 B). What was found to be significant was the increase in choline incorporation into PC
or other lipid species following 24 hour oleate treatment (Figure 4 C). The rate of choline
uptake was very significantly decreased in cells exposed to oleate (Figure 4 D).
A
B C
Relative Expression of SLC44A1
Incorporation of Choline into PC
24 hours
Treated with 3H-choline for decreasing time intervals
Measure Protein & 3H-choline
Oleate treatment

48
D Rate of Choline Uptake following treatment with Oleate
0 1 0 2 0 3 00
1 0
2 0
3 0
T im e (m in )
3H
-Ch
oli
ne
up
tak
e(n
mo
l/m
g)
C o n tro l O lea te
* * * *
Figure 4. Effect of 24 hour oleate treatment on choline metabolism in primary hepatocytes. All treatments were performed on primary hepatocytes using 0.5 mM conjugated oleate for a treatment time of 24 hours. (A) Schematic of experimental procedures (B) Relative expression of SLC44A1 following treatment with oleate. (C) Incorporation of 3H-choline into PC or other lipid species following treatment with oleate (P=0.0003). (D) Rate of 3H-choline uptake after 30 minutes among oleate treated cells in comparison to non-treated controls (P<0.0001). All data mean ± SEM of at least four livers, each performed in duplicate.
1.32 Obesity Affects CTL1 mRNA Expression and Choline Incorporation in
Liver
Having seen the decrease in the rate of choline uptake following treatment with the
free fatty acid oleate, I became interested in evaluating the effect of obesity, a disease
characterized by increased circulating free fatty acids, on SLC44A1 expression and
function. A preliminary study was conducted using high fat diet induced obese mice and
non-littermate chow fed controls, the liver were taken and the relative expression of
SLC44A1 was measured. The results from this preliminary experiment demonstrated a
significant decrease in SLC44A1 expression within the obese mouse livers (Appendix
Figure A3). This experiment was conducted a second time using a female wild-type and
aged matched cohort. Half of the mouse cohort was placed on a 60% high fat diet while

49
the other half remained on a chow rodent diet (Figure 5 B). Obese mouse livers were
found to have a decrease in 3H-choline incorporation into PC and lipid species in
comparison to their lean counter parts (Figure 5 C). Following qPCR analysis, a decrease
in SLC44A1 expression was measured in the obese mice after being fed the high fat diet
for 6 weeks, a decrease which became significant at the 8 week mark (Figure 5 D). To
determine if the reduction in choline incorporation may have been caused in part by other
genes affected during obesity, an mRNA expression profile was completed at the 8 week
mark. No significant change in the expression of Kennedy pathway enzymes was found
to occur, as well there were no significant differences in PEMT, OCT1, SREBP1 or
BMAL expression between obese and lean mouse livers however a notable decrease in
CHKα and PEMT expression among obese mice can be seen (Figure 5 E).
A B
Body Weights of Lean and Obese Mice
C D
Effect of Obesity on Choline Incorporation
Relative Expression of SLC44A1

50
E Relative Expression of Hepatic Genes from Lean and Obese Mice
Figure 5. Comparison between choline incorporation and mRNA expression in lean and fatty livers from C57BL/6J mice. (A) Average representation of an obese mouse and fatty liver following 8 weeks on a 60% high fat diet. (B) Average body weight from both lean and obese cohorts at 2,4,6 and 8 weeks. (C) In vivo 3H-choline incorporation from lean and obese mouse livers after 8 weeks. (D) Relative expression of SLC44A1 from lean and obese mouse livers at 2,4,6 and 8 weeks. (E) Relative expression of metabolic genes from lean and obese mouse livers after 8 weeks. All data mean ± SEM of at least five mice, each performed in duplicate.
1.33 CTL1 Expression and Liver Choline Uptake are Influenced by the Circadian
Rhythm.
Choline metabolism is regulated by the circadian rhythm through its control over
CHKα expression 111. To explore the possibility of circadian regulation of CTL1
expression and liver choline uptake, I performed a time trial experiment which harvested
mouse livers every 6 hours for a 24 hour period. Both CHKα and CTL1 mRNA
expression demonstrated a 24 hour rhythmic pattern with an acrophase peaking around
7:00 am and reaching lowest expression 12 hours later at 7:00 pm (Figure 6 A,B).
Choline uptake also varied between the 12 hour time points with more than twice the
amount of uptake occurring at 7:00 am than at 7:00 pm (Figure 6 D). No rhythmic
expression was found to occur in OCT1 expression.
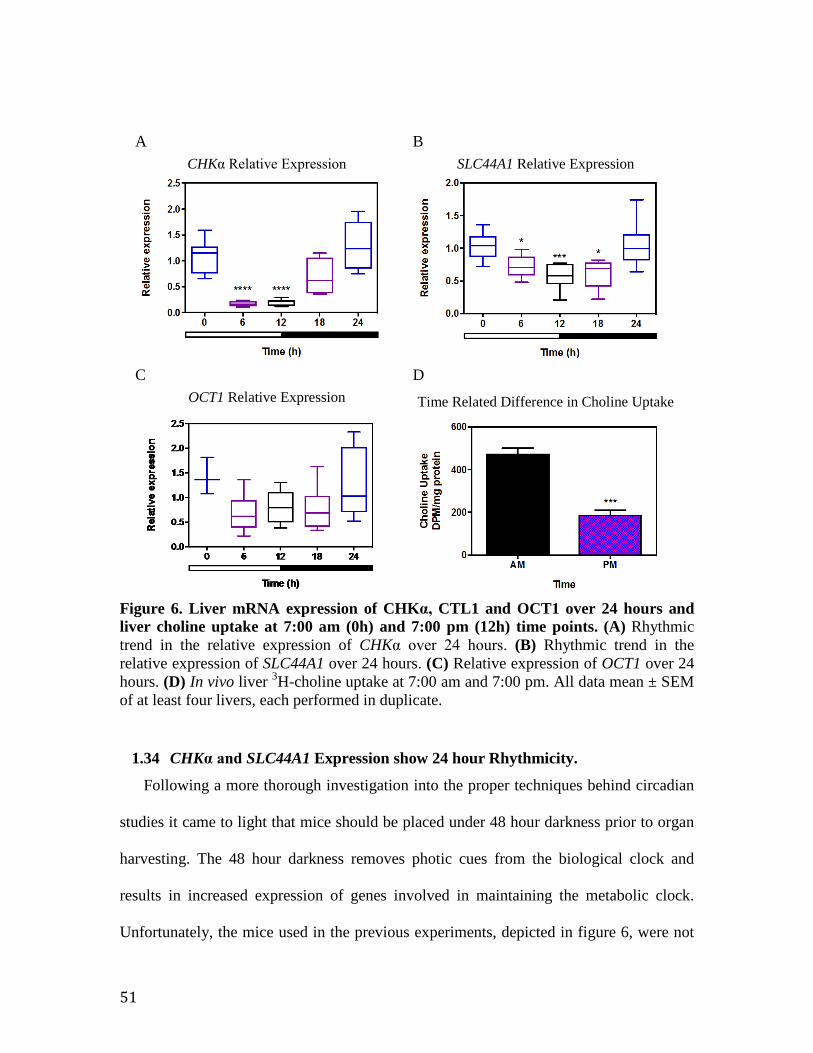
51
Figure 6. Liver mRNA expression of CHKα, CTL1 and OCT1 over 24 hours and liver choline uptake at 7:00 am (0h) and 7:00 pm (12h) time points. (A) Rhythmic trend in the relative expression of CHKα over 24 hours. (B) Rhythmic trend in the relative expression of SLC44A1 over 24 hours. (C) Relative expression of OCT1 over 24 hours. (D) In vivo liver 3H-choline uptake at 7:00 am and 7:00 pm. All data mean ± SEM of at least four livers, each performed in duplicate.
1.34 CHKα and SLC44A1 Expression show 24 hour Rhythmicity.
Following a more thorough investigation into the proper techniques behind circadian
studies it came to light that mice should be placed under 48 hour darkness prior to organ
harvesting. The 48 hour darkness removes photic cues from the biological clock and
results in increased expression of genes involved in maintaining the metabolic clock.
Unfortunately, the mice used in the previous experiments, depicted in figure 6, were not
A B CHKα Relative Expression
SLC44A1 Relative Expression
C D
OCT1 Relative Expression
Time Related Difference in Choline Uptake
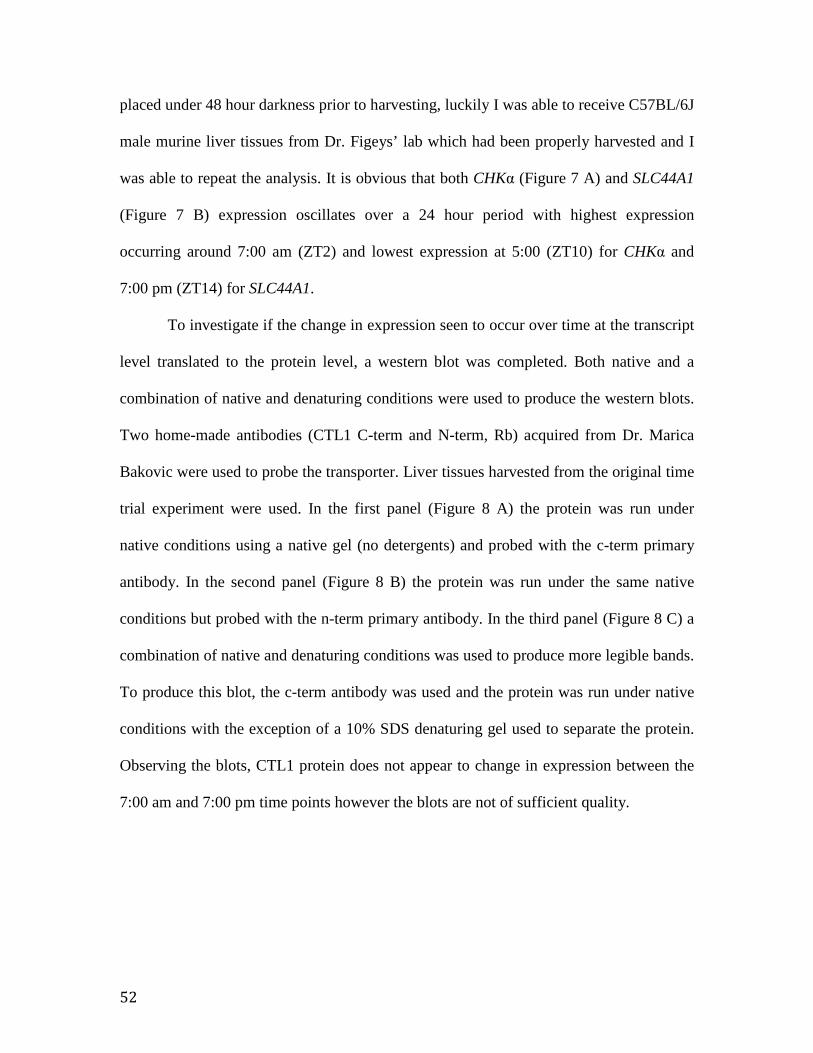
52
placed under 48 hour darkness prior to harvesting, luckily I was able to receive C57BL/6J
male murine liver tissues from Dr. Figeys’ lab which had been properly harvested and I
was able to repeat the analysis. It is obvious that both CHKα (Figure 7 A) and SLC44A1
(Figure 7 B) expression oscillates over a 24 hour period with highest expression
occurring around 7:00 am (ZT2) and lowest expression at 5:00 (ZT10) for CHKα and
7:00 pm (ZT14) for SLC44A1.
To investigate if the change in expression seen to occur over time at the transcript
level translated to the protein level, a western blot was completed. Both native and a
combination of native and denaturing conditions were used to produce the western blots.
Two home-made antibodies (CTL1 C-term and N-term, Rb) acquired from Dr. Marica
Bakovic were used to probe the transporter. Liver tissues harvested from the original time
trial experiment were used. In the first panel (Figure 8 A) the protein was run under
native conditions using a native gel (no detergents) and probed with the c-term primary
antibody. In the second panel (Figure 8 B) the protein was run under the same native
conditions but probed with the n-term primary antibody. In the third panel (Figure 8 C) a
combination of native and denaturing conditions was used to produce more legible bands.
To produce this blot, the c-term antibody was used and the protein was run under native
conditions with the exception of a 10% SDS denaturing gel used to separate the protein.
Observing the blots, CTL1 protein does not appear to change in expression between the
7:00 am and 7:00 pm time points however the blots are not of sufficient quality.
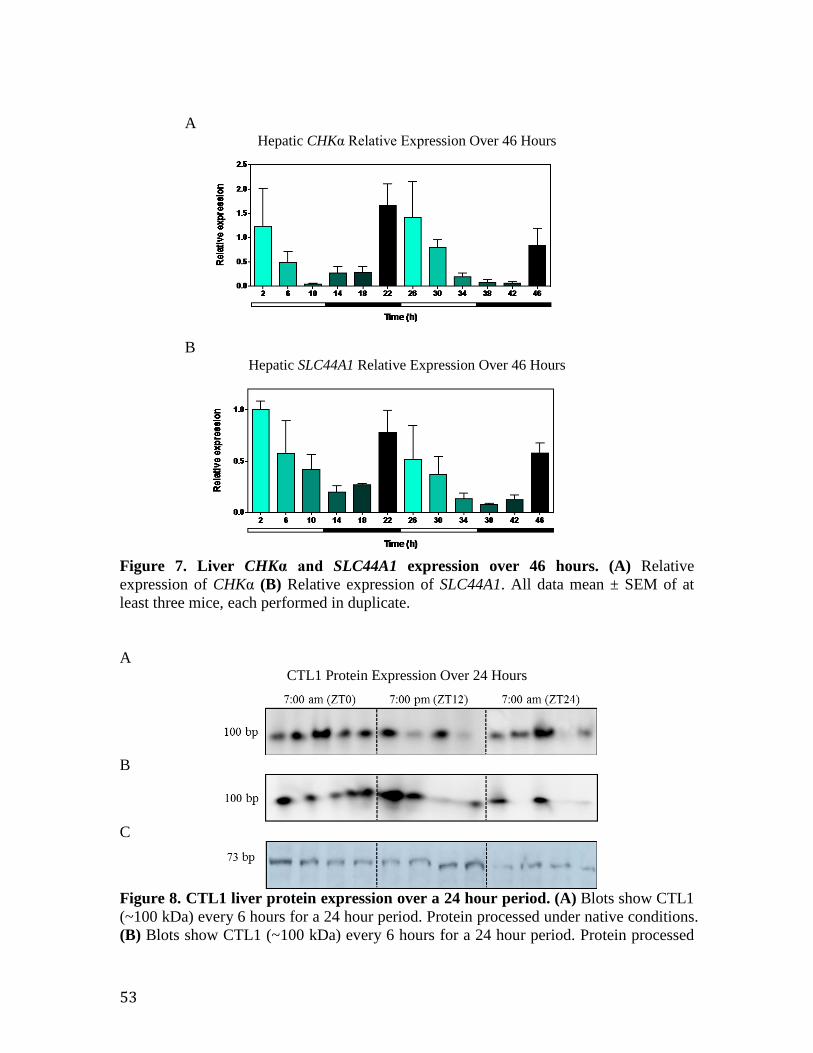
53
A
Hepatic CHKα Relative Expression Over 46 Hours
B Hepatic SLC44A1 Relative Expression Over 46 Hours
Figure 7. Liver CHKα and SLC44A1 expression over 46 hours. (A) Relative expression of CHKα (B) Relative expression of SLC44A1. All data mean ± SEM of at least three mice, each performed in duplicate. A
CTL1 Protein Expression Over 24 Hours
B
C
Figure 8. CTL1 liver protein expression over a 24 hour period. (A) Blots show CTL1 (~100 kDa) every 6 hours for a 24 hour period. Protein processed under native conditions. (B) Blots show CTL1 (~100 kDa) every 6 hours for a 24 hour period. Protein processed
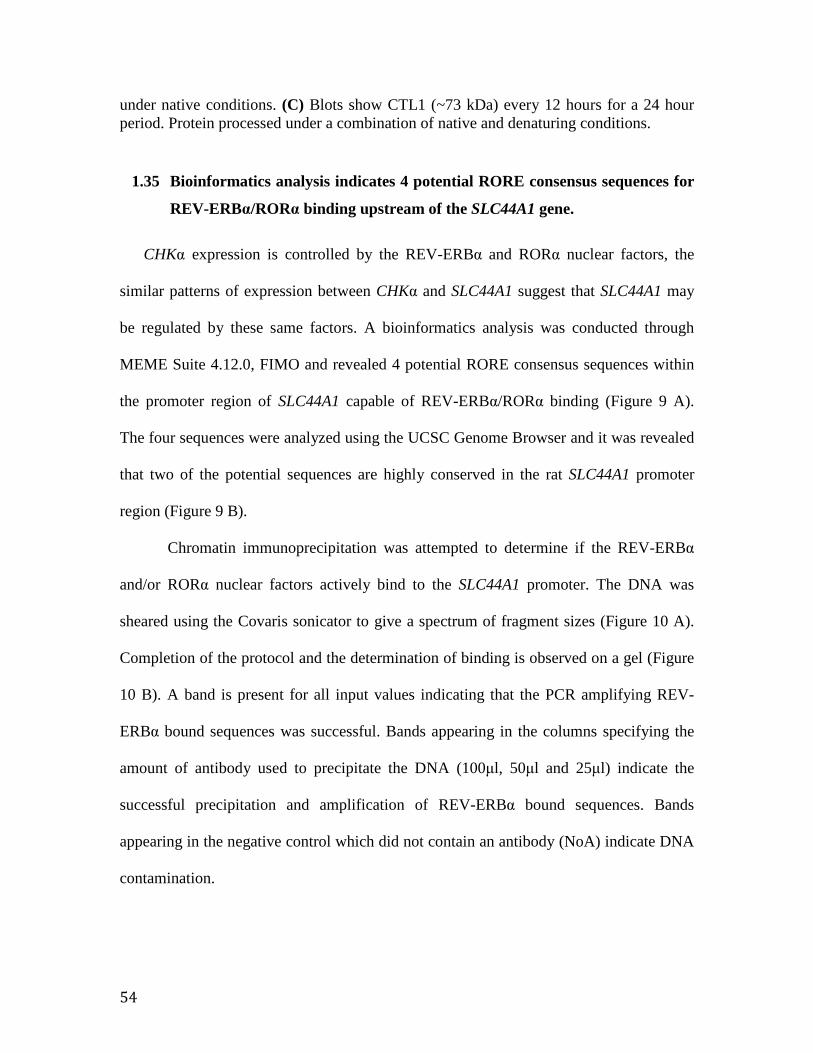
54
under native conditions. (C) Blots show CTL1 (~73 kDa) every 12 hours for a 24 hour period. Protein processed under a combination of native and denaturing conditions.
1.35 Bioinformatics analysis indicates 4 potential RORE consensus sequences for
REV-ERBα/RORα binding upstream of the SLC44A1 gene.
CHKα expression is controlled by the REV-ERBα and RORα nuclear factors, the
similar patterns of expression between CHKα and SLC44A1 suggest that SLC44A1 may
be regulated by these same factors. A bioinformatics analysis was conducted through
MEME Suite 4.12.0, FIMO and revealed 4 potential RORE consensus sequences within
the promoter region of SLC44A1 capable of REV-ERBα/RORα binding (Figure 9 A).
The four sequences were analyzed using the UCSC Genome Browser and it was revealed
that two of the potential sequences are highly conserved in the rat SLC44A1 promoter
region (Figure 9 B).
Chromatin immunoprecipitation was attempted to determine if the REV-ERBα
and/or RORα nuclear factors actively bind to the SLC44A1 promoter. The DNA was
sheared using the Covaris sonicator to give a spectrum of fragment sizes (Figure 10 A).
Completion of the protocol and the determination of binding is observed on a gel (Figure
10 B). A band is present for all input values indicating that the PCR amplifying REV-
ERBα bound sequences was successful. Bands appearing in the columns specifying the
amount of antibody used to precipitate the DNA (100μl, 50μl and 25μl) indicate the
successful precipitation and amplification of REV-ERBα bound sequences. Bands
appearing in the negative control which did not contain an antibody (NoA) indicate DNA
contamination.
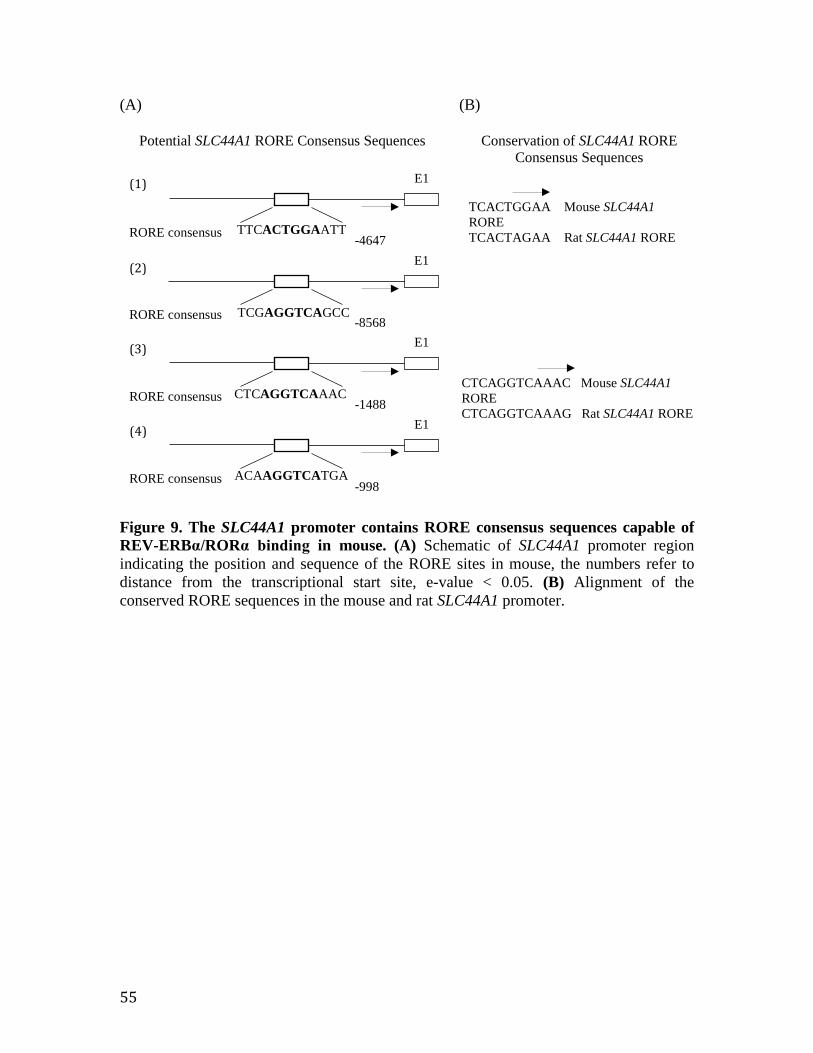
55
(A)
Potential SLC44A1 RORE Consensus Sequences
(B)
Conservation of SLC44A1 RORE Consensus Sequences
Figure 9. The SLC44A1 promoter contains RORE consensus sequences capable of REV-ERBα/RORα binding in mouse. (A) Schematic of SLC44A1 promoter region indicating the position and sequence of the RORE sites in mouse, the numbers refer to distance from the transcriptional start site, e-value < 0.05. (B) Alignment of the conserved RORE sequences in the mouse and rat SLC44A1 promoter.
ACAAGGTCATGA
RORE consensus -4647
E1
CTCAGGTCAAAC RORE consensus -1488
E1
TTCACTGGAATT
RORE consensus -8568
E1
TCGAGGTCAGCC
RORE consensus -998
E1
(1)
(2)
(3)
(4)
CTCAGGTCAAAC Mouse SLC44A1 RORE CTCAGGTCAAAG Rat SLC44A1 RORE
TCACTGGAA Mouse SLC44A1 RORE TCACTAGAA Rat SLC44A1 RORE
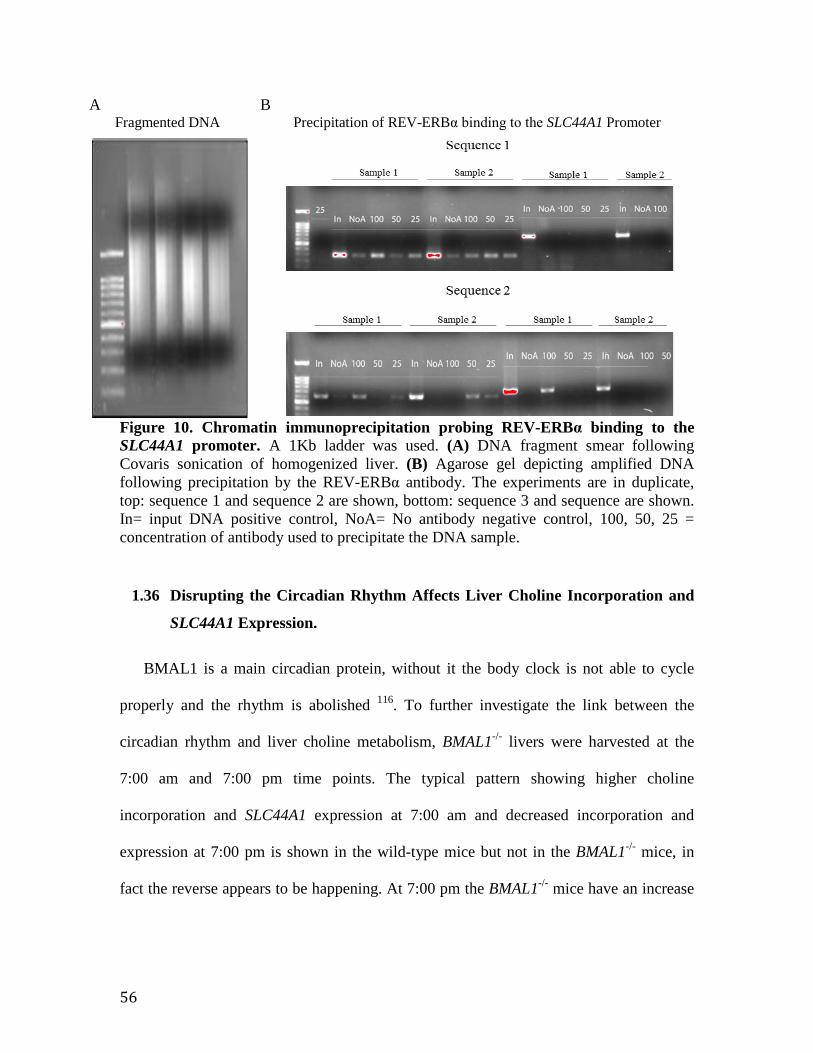
56
A B Fragmented DNA Precipitation of REV-ERBα binding to the SLC44A1 Promoter
Figure 10. Chromatin immunoprecipitation probing REV-ERBα binding to the SLC44A1 promoter. A 1Kb ladder was used. (A) DNA fragment smear following Covaris sonication of homogenized liver. (B) Agarose gel depicting amplified DNA following precipitation by the REV-ERBα antibody. The experiments are in duplicate, top: sequence 1 and sequence 2 are shown, bottom: sequence 3 and sequence are shown. In= input DNA positive control, NoA= No antibody negative control, 100, 50, 25 = concentration of antibody used to precipitate the DNA sample.
1.36 Disrupting the Circadian Rhythm Affects Liver Choline Incorporation and
SLC44A1 Expression.
BMAL1 is a main circadian protein, without it the body clock is not able to cycle
properly and the rhythm is abolished 116. To further investigate the link between the
circadian rhythm and liver choline metabolism, BMAL1-/- livers were harvested at the
7:00 am and 7:00 pm time points. The typical pattern showing higher choline
incorporation and SLC44A1 expression at 7:00 am and decreased incorporation and
expression at 7:00 pm is shown in the wild-type mice but not in the BMAL1-/- mice, in
fact the reverse appears to be happening. At 7:00 pm the BMAL1-/- mice have an increase
57
in choline incorporation and SLC44A1 expression in comparison to the 7:00 am time
point.
A
B C
Choline Incorporation in wt and BMAL1-
/-
ZT 0 ZT 1 20 .0
0 .5
1 .0
1 .5
2 .0
2 .5
3H
-Ch
oli
ne
In
co
rpo
rati
on
(nm
ol/
mg
)
* *W ild T y p e B M A L K O
SLC44A1 expression in wt and BMAL1-
/-
ZT 0 ZT 1 20 .0
0 .5
1 .0
1 .5
2 .0
2 .5
Re
lati
ve
ex
pre
ss
ion
*
*
Figure 11. Liver choline incorporation and SLC44A1 expression in BMAL1-/- mice at the 7:00 am and 7:00 pm time points. (A) Schematic of experimental procedures (B) Comparison of 3H-choline incorporation into PC or lipid species between non-littermate wildtype and BMAL1-/- mice. (B) Relative expression of SLC44A1 in the liver of wildtype and BMAL1-/- mice. All data mean ± SEM of at least four livers, each performed in duplicate.
1.37 Both Obesity and the Circadian Rhythm Affect Choline Incorporation and
CTL1 Expression.
As previously shown in figure 5 C and D, obesity decreases the incorporation of
choline into PC or other lipid species as well as decreases SLC44A1 transcription.
Interestingly, the decrease in choline incorporation seen to occur in the obese livers is
only significant in the morning at 7:00 am but not so in the evening at 7:00 pm (Figure 12
Organ Harvest 1 hour
3H-Choline Cardiac Puncture Choline Assay
Scintillation Count
Bligh & Dyer
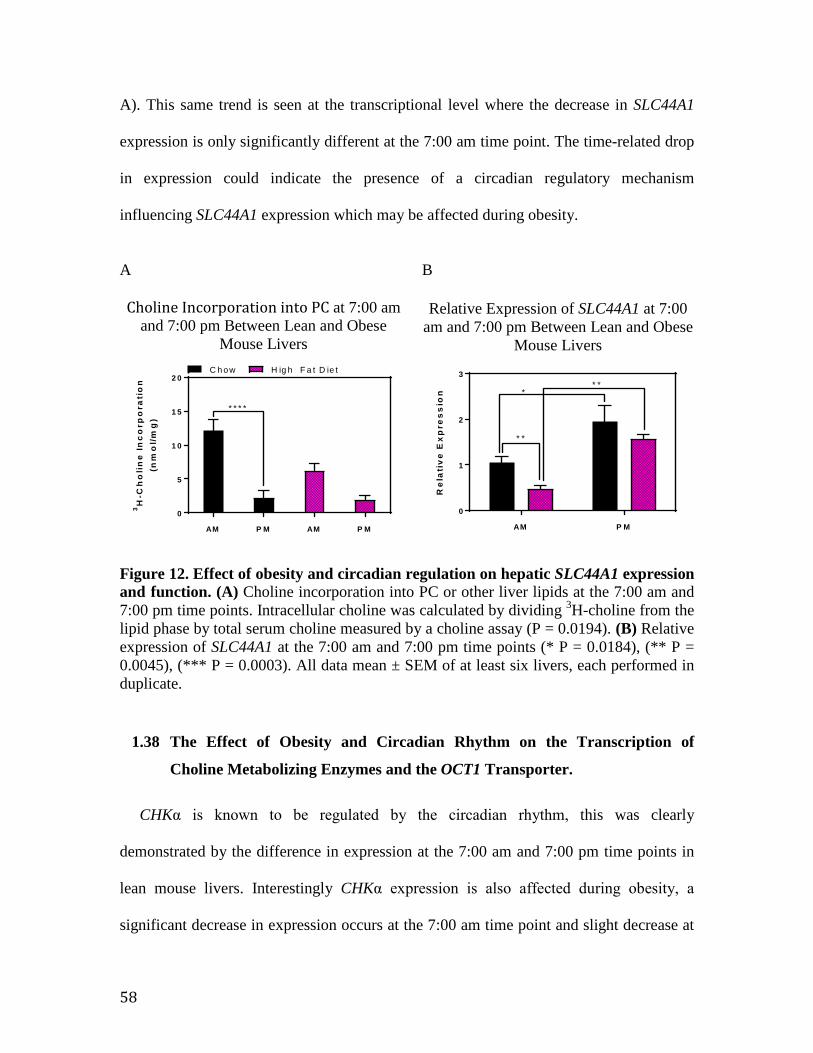
58
A). This same trend is seen at the transcriptional level where the decrease in SLC44A1
expression is only significantly different at the 7:00 am time point. The time-related drop
in expression could indicate the presence of a circadian regulatory mechanism
influencing SLC44A1 expression which may be affected during obesity.
A B
Choline Incorporation into PC at 7:00 am and 7:00 pm Between Lean and Obese
Mouse Livers
AM P M AM P M
0
5
1 0
1 5
2 0
3H
-Ch
oli
ne
In
co
rpo
rati
on
(nm
ol/
mg
)
C h ow
* * * *
H ig h F a t D ie t
Relative Expression of SLC44A1 at 7:00 am and 7:00 pm Between Lean and Obese
Mouse Livers
Figure 12. Effect of obesity and circadian regulation on hepatic SLC44A1 expression and function. (A) Choline incorporation into PC or other liver lipids at the 7:00 am and 7:00 pm time points. Intracellular choline was calculated by dividing 3H-choline from the lipid phase by total serum choline measured by a choline assay (P = 0.0194). (B) Relative expression of SLC44A1 at the 7:00 am and 7:00 pm time points (* P = 0.0184), (** P = 0.0045), (*** P = 0.0003). All data mean ± SEM of at least six livers, each performed in duplicate.
1.38 The Effect of Obesity and Circadian Rhythm on the Transcription of
Choline Metabolizing Enzymes and the OCT1 Transporter.
CHKα is known to be regulated by the circadian rhythm, this was clearly
demonstrated by the difference in expression at the 7:00 am and 7:00 pm time points in
lean mouse livers. Interestingly CHKα expression is also affected during obesity, a
significant decrease in expression occurs at the 7:00 am time point and slight decrease at
AM P M
0
1
2
3
Re
lati
ve
Ex
pre
ss
ion *
* *
* *

59
the 7:00 pm time point. A similar pattern is seen in PEMT expression with a significant
decrease in expression among obese mouse livers at 7:00 am and a very slight decrease at
7:00 pm in comparison to their lean counterparts. No significant changes in expression
were measured for either PCTY1/CCT or OCT1.
A B
AM P M
0 .0
0 .5
1 .0
1 .5
2 .0
Re
lati
ve
Ex
pre
ss
ion
C o n tro l H ig h F a t D ie t
* *
* * *
C H K a
AM P M
0 .0
0 .5
1 .0
1 .5
2 .0
2 .5
Re
lati
ve
Ex
pre
ss
ion
P C Y T 1
C D
AM P M
0 .0
0 .5
1 .0
1 .5
Re
lati
ve
Ex
pre
ss
ion
*
P E M T
AM P M
0
1
2
3
4
Re
lati
ve
Ex
pre
ss
ion
O C T1
Figure 13. Effect of obesity and the circadian rhythm on C57Bl/6J mouse liver CHKα, PCTY1/CCT, PEMT and OCT1 expression. Hepatic gene expression from 16 week old lean chow fed and 16 week old, 10-week 60% high fat diet fed obese mouse livers isolated at 7:00 am and 7:00 pm. (A) CHKα (** P = 0.0059, *** P = 0.0002), (B) PCTY1/CCT, (C) PEMT (* P < 0.05) (D) OCT1. Data represents mean ± SEM of at least six livers, each performed in duplicate.
60
DISCUSSION
Choline is an essential nutrient, in the liver it acts as a precursor for PC synthesis
and functions as a methyl donor towards the regeneration of SAM. Choline deficiency
decreases PC synthesis, which affects VLDL formation and in turn decreases triglyceride
export causing fatty liver 81. Low PC also decreases mitochondrial membrane potential
and stimulates the production of reactive oxygen species, while a lack of methyl group
donors disrupts the cell’s methylation ability resulting in changes to gene expression 27.
Because of its importance in maintaining liver homeostasis, choline metabolism has been
well characterized; however, hepatic choline transporters have not received that same
attention and little is known about the kinetics of choline uptake or the regulation
surrounding it. Thus, my work has been directed towards the characterization of hepatic
choline transport, specifically the choline transporter-like protein and its regulation.
1.39 An intermediate affinity transport system is responsible for hepatic uptake.
My first objective was to characterize hepatic choline transport and determine the
specific contribution of CTL transport to the choline pool. Presently, CTL1 mRNA
expression has been detected in the liver and there has been evidence demonstrating the
existence of two transport systems with different affinities for choline 31,113. No further
studies have been conducted to characterize hepatic choline transport or to functionally
verify the uptake of choline through CTL transporters. To begin this characterization, a
saturation assay was performed which indicated a KM of 75.75 µM and VMax of 0.004152
µM/mg/min, values that are representative of an intermediate affinity transport system
(Figure 1, C). An inhibition assay was performed using hemicholinium, a choline analog
which blocks ctl transport but not oct transport. The results indicated an IC50 of 3.314e-005
61
µM and at full inhibition, hemicholinium was able to impede ~80% of choline uptake
indicating that the ctl transport system is responsible for the majority of hepatic choline
uptake (Figure 1, D). A second inhibition assay was performed using quinine, an oct
inhibitor which indicated that relatively little choline is taken up via oct transport (Figure
1, E). These results establish that the ctl transport system is responsible for the majority
of hepatic choline uptake in mice and that, although oct transport does uptake choline
into the liver its contribution is negligible. In order to gain an overview of the relative
expression between choline transporters and choline metabolizing enzymes real-time
qPCR was performed and demonstrated a significant decrease in expression of SLC44A1
and PEMT as well as a very significant increase in CHKα expression among primary
hepatocytes in comparison to liver homogenate samples (Figure 2). The differences seen
in primary hepatocyte gene expression could be due to the removal of regulatory factors,
for example circadian factors, following isolation and the time taken to isolate, plate and
treat the cells could allow for changes in expression to occur which are not representative
of the natural state.
To better study the role and importance of CTL1 in liver choline metabolism,
CTL1-/- mice were requested. Upon arrival the mice were genotyped and the expression
of CTL1 was evaluated at the mRNA and protein levels and was unfortunately detected.
Since these mice contained a backup loxp system surrounding exon 3 of SLC44A1, we
proceeded to breed them with Cre-containing mice in an attempt to disrupt SLC44A1
transcription in their progeny (figure A1). Genotyping results revealed the generation of
knockout mice, but in an attempt to remove a LacZ/neomycin cassette inserted during the
creation of these mice, the reappearance of CTL1 expression occurred in successive
62
generations. Our lab continues towards the generation of a SLC44A1-/- line, unfortunately
I was not able to make use of SLC44A1-/- mice for any experiment. Since the mice
contained a loxp system, a second attempt was made towards knocking out the gene in
primary hepatocytes with the use of a Cre-containing adenovirus. A decrease in SLC44A1
expression occurred when the primary cells were treated with the virus but its expression
could not be fully eliminated (Figure A2). Increasing the concentration or time of
incubation in the virus resulted in toxic effects and because of this the decision was made
not to continue with this experiment.
1.40 Choline incorporation is increased following treatment with oleate.
In pursuit of my second objective looking to understand the regulation of CTL1, I
was interested in the treatment effects of dexamethasone, glucose, insulin, palmitate and
oleate on hepatic choline metabolism. Dexamethasone is an anti-inflammatory
glucocorticoid which has been shown to exacerbate the development of fatty liver
through miR-17-5p stimulation and trigger the accumulation of liver triglycerides and
sphingolipids through increasing the expression of fatty acid transporters 117,118.
Dexamethasone has also been utilized to promote fetal lung maturation by boosting CCT
activity and thus increasing the synthesis of PC required for the production of
surfactant 119. Dexamethasone has been shown to influence the expression of transporters,
its actions affect liver lipid accumulation and are known to have a direct impact on liver
choline metabolism and PC synthesis through increasing the activity of CCT yet, its
effect on choline transport prior to CCT remain unknown. Dexamethasone is also known
to induce insulin resistance in the liver and inhibit insulin release from the pancreas 120, 121.

63
In the liver, the development of insulin resistance and its relationship with choline
metabolism has been studied, but at this time remains unclear 122. Insulin resistance is a
common symptom of metabolic disease and has been shown to improve following
betaine supplementation, the product of choline oxidation 122. Although treatment with
insulin has been shown to increase PC synthesis in adipose tissue, the effect of insulin on
liver PC and choline metabolism has not been well established 123. In the liver, palmitate
and oleate are free fatty acids which undergo oxidation to produce acetyl-CoA and are
also used in the synthesis of phospholipids, ketones and signalling molecules 124. Both
palmitate and oleate are known to stimulate the activity of CTT and through this increase
the synthesis of PC in liver, but their effect on hepatic choline uptake has yet to be
thoroughly understood 125. To evaluate the effects of these metabolic factors on CTL1
function, I applied the treatments to hepatocytes for 24 hours and measured their ability
to metabolize 3H-choline and incorporate it into PC. Neither treatment produced a
significant change in choline incorporation into PC with the exception of oleate which
produced a consistent increase throughout all incubation times (Figure 3 B,C,D). The
effect of palmitate, glucose, insulin and dexamethasone treatment on choline uptake and
incorporation are lackluster. Treatment with palmitate produced a toxic effect leading to
cell death, also the fatty acid was not conjugated prior to treatment application, the
induction of apoptosis and the lack of BSA conjugation could explain the lack of change
in choline incorporation observed. The lack of change in choline uptake and
incorporation following treatment with glucose and insulin might be because the two
factors were used separately where as in the body, to produce a measurable effect in lipid
metabolism both factors are required to work together. Unlike other tissues in the body,
64
the liver contains GLUT-2 transporters which are continuously taking up glucose
independent of insulin signalling. Although insulin is known to increase lipogenic
metabolism it did not produce a measurable effect in terms of choline metabolism. A
possible explanation as to why treatment with dexamethasone did not produce a
significant change in choline metabolism might be due to the decrease in CCT or PCTY1
expression among primary hepatocytes (Figure 2). Dexamethasone stimulates PC
synthesis through increasing the activity of CCT, a decrease in enzyme quantity could
have hindered dexamethasones’ effect on choline metabolism.
1.41 Oleate stimulates PC synthesis in hepatocytes but does not affect CTL1
expression.
Oleate has been previously shown to increase CCT activity, increase the production of
DAG and stimulate PC synthesis in rat liver 125,127. A recent paper by Schenkel and
Bakovic demonstrated that oleate treatment increases PC synthesis and accelerates
phosphocholine turnover in muscle cells as well as stimulates mitochondrial fatty acid
oxidation 128. This increase in PC synthesis was suggested to act as a protective
mechanism against the buildup of toxic lipid intermediates. Interestingly, oleate was also
shown to decrease trafficking of CTL1 to the mitochondrial membrane which decreased
choline uptake in muscle. It was suggested that this outcome functioned towards
maintaining cytoplasmic choline intended for PC synthesis 128. While oleate treatment is
known to stimulate CCT activity by localizing it to the membrane, its effect on the uptake
of hepatic choline have not been explored.

65
To better understand the effect of oleate on hepatic choline uptake and
incorporation, I conducted three sets of experiments each in primary hepatocytes
following 24 hours of treatment in oleate. These sets of experiments were conducted
following the conjugation of oleate to 1% BSA prior to treatment which facilitates the
uptake of fatty acids into hepatocytes. As expected, treatment with oleate significantly
increased 3H-choline incorporation into PC (Figure 4 C). I followed this up by measuring
the rate of choline uptake and it was found that oleate treatment significantly decreased
the rate of choline uptake without significantly affecting its mRNA expression (Figure 4
B,D).
Perhaps as has been shown in muscle, CTL1 translocation to the mitochondria
could have been reduced allowing for cytosolic choline to be directed towards PC
synthesis. This would allow for PC synthesis to continue despite a decrease in choline
uptake. Although it might be a stretch, it could be possible that the variants of CTL1 are
distributed unequally to the plasma membrane and mitochondrial membrane. In the
mouse there exist two splice variants of SLC44A1, unfortunately not much is known
about their localization or expression. In humans three splice variants exist, two of which
contain a different number of serine residues available for phosphorylation and one of
which possesses an RXR motif. Both of these modifications are associated with the
localization of proteins, perhaps one isoform localizes to the mitochondria and the other
to the plasma membrane. Given the findings by Schenkel and Bakovic where oleate
decreased mitochondrial CTL1 expression but not plasma membrane expression, it could
be that the treatment of oleate in hepatocytes decreased the expression of the
mitochondrial isoform but not the plasma membrane isoform. In this case, CTL1

66
expression along the plasma membrane would not decrease greatly and the entire pool of
cytosolic choline would be directed along the CDP-choline pathway, as suggested by
Schenkel and Bakovic. This redirection of choline towards the CDP-choline pathway
would allow for PC synthesis to continue or even increase despite a decrease in choline
uptake. As for why a decrease in choline uptake occurs following treatment with oleate,
further testing is required before I can provide a possible explanation. Further
examination into the state of the mitochondria (membrane potential and oxidative stress)
as well as measurement of betaine before and after treatment could provide clarity
towards the effect of oleate on CTL1 functioning and choline metabolism as a whole.
An alternative explanation could be that the activation of CCT following oleate
treatment created a choline sink which directed all intracellular free choline towards the
CDP-choline pathway and that the 14-15 nM/mg concentration of choline entering the
cell was capable of sustaining this pathway. For a future study it would be interesting to
measure the quantity of betaine produced following treatment with oleate, this could
provide more information on the shutting of intracellular choline between the two
pathways.
1.42 Obesity is Associated with a Decrease in CTL1 mRNA Expression and
Choline Incorporation
Since the fatty acid oleate is capable of stimulating choline metabolism in
hepatocytes, my interest turned to obesity, a disorder characterized by increased
circulating fatty acids, and how it may affect choline uptake and metabolism in the liver.
Obesity is also associated with the development of fatty liver, a disorder which can be
brought about through choline deficiency. To explore the relationship between obesity

67
and hepatic choline metabolism, I placed a cohort of mice on an 8-week 60% high fat diet
measured CTL1 mRNA expression and choline incorporation into PC. What I found was
as obesity persisted and the mice increased in body weight, SLC44A1 expression
decreased. At the 8 week point both CTL1 expression and choline incorporation
decreased significantly in the obese mice (Figure 5 B,C,D). The expression of the OCT1
transporter as well as choline metabolizing enzymes were measured and no significant
differences can be observed between lean and obese mice however a decrease in CHKα
and PEMT expression in the obese mice is noted (Figure 5 E). This provides further
support of an association between the decrease SLC44A1 expression observed and the
decrease in choline incorporation into PC. The onset of NAFLD as well as decreased
DNA methylation have been demonstrated to occur in obesity 131,129. Choline deficiency
is known to cause fatty liver disease and in the mitochondria, choline is a key metabolite
involved in the regeneration of SAM required for maintaining the methylation capability
of the cell. If I may speculate, the decrease in SLC44A1 expression observed among the
obese mice is likely to decrease choline uptake and in turn cause the decrease in choline
incorporation demonstrated in figure 5C. This decrease in PC could result in decreased
VLDL formation and secretion of triglycerides81. This decrease in VLDL triglyceride
export could result in liver lipid accumulation as seen to occur in NAFLD. In the obese
state, fatty liver disease is also characterized by a change in methylation status 129.
Decreased choline availability for betaine synthesis could decrease SAM regeneration
and alter the methylation ability of cells 130. In support of this is the fact that betaine
supplementation is known to increase homocysteine to SAM conversion and ameliorate
NAFLD 122. Both of cholines’ metabolic pathways are known to be affected during
68
obesity and fatty liver disease. Both pathways require CTL choline transport which I have
shown to decrease in expression at the mRNA level during obesity. It could be that
obesity inhibits SLC44A1 expression which lowers choline uptake and decreases PC
synthesis as well as SAM production and triggering the development of fatty liver disease.
1.43 CTL1 expression and function are regulated by the circadian rhythm.
To achieve my second objective towards understanding the regulation of CTL1, I
would like to establish if the circadian rhythm influences CTL1 expression and function.
It has been well documented that the expression of CHKα, the first enzyme in the CDP-
choline pathway, is regulated by the interplay of the REV-ERBα/RORα circadian
factors 111. To gain a better understanding of CTL1 expression over time I harvested the
livers of wild-type mice over 24 hours and measured the uptake of hepatic choline in vivo
between the 7:00 am and 7:00 pm cohorts. As a comparative measurement, CHKα
relative expression was analyzed and unsurprisingly, followed a 24 hour rhythmic trend
(Figure 6 A). Excitingly, CTL1 expression was also found to follow a similar 24 hour
rhythmic trend with an acrophase occurring over night until ~7:00 am followed by a slow
decrease in expression until ~7:00 pm (Figure 6 B). In accordance with this, hepatic
choline uptake was highest at 7:00 am and demonstrated a very significant decrease at
7:00 pm (Figure 6 D). The relative expression of OCT1 was examined to verify that it
was not influencing the circadian uptake of choline, and OCT1 expression was found not
to demonstrate a 24 hour rhythm. A western blot was attempted in order to observe CTL1
protein expression overtime, unfortunately commercial antibodies for CTL1 are limited
and have yet to be optimized. Several combinations of native and denaturing conditions

69
were experimented with but regrettably a clear picture of CTL1 protein expression could
not be attained (Figure 7 A,B,C).
When this experiment was conducted, I was not aware that a common practice for
circadian studies is to place the mice into 48 hour darkness prior to testing 132. Placing the
mice in darkness triggers an amplification of circadian signals as well as allows for direct
measurement of the metabolic rhythm without adjustment by photic cues. Luckily I was
able to obtain male C57Bl/6J murine liver tissue from Dr. Figey’s lab which were
harvested following a 48 hours period in darkness. Real-time qPCR analysis of these
tissues revealed a similar rhythmic trend for both CHKα and SLC44A1 expression
normalized using βactin , with an acrophase occurring overnight from ZT22 - ZT2 and a
bathyphase occurring from ZT10 - ZT14 for CHKα and at ZT14 for SLC44A1 (Figure 18
A,B). These results clearly demonstrate a circadian trend in hepatic SLC44A1 expression
and perhaps the likeness in pattern shared between SLC44A1 and CHKα indicates that the
same circadian mechanism might be at play.
1.44 Bioinformatics indicates that the SLC44A1 promoter contains REV-
ERBα/RORα binding sites.
A bioinformatics analysis aiming to identify REV-ERBα/RORα consensus
sequences within the SLC44A1 promoter region was conducted and revealed 4 possible
binding sites (Figure 9 A). Using the UCSC Genome Browser, the conservation between
the mouse consensus sequences were compared to rat and two of the four sequences were
found to be highly conserved (Figure 9 B). The identification of conserved REV-
ERBα/RORα sequences within the SLC44A1 promoter region provides stronger evidence
towards a possible circadian-linked regulatory mechanism. This finding coupled with the
70
similarity in expression pattern shared between CHKα, a pattern known to be regulated
by the REV-ERBα/RORα system, and SLC44A1 further supports this idea. In an attempt
to verify REV-ERBα/RORα binding to the SLC44A1 promoter, I began troubleshooting
tissue-based chromatin immunoprecipitation (ChIP). I was successful in optimizing both
probe and Covaris based DNA sonication (Figure 10 A). In control liver tissue I was
successful in precipitating the REV-ERBα/RORα transcription factor and amplifying the
sequence by qPCR using the primers for sequence 1, 2 and 3 (Figure 10 B). The
experiments were performed in duplicate and are shown side by side. Sequence 1
contains bands for all three samples however they were not reproducible between the
separate rounds. Sequence 2 shows one sample band which was not reproduced in the
second round. Sequence 3 showed bands at all sample locations which were reproduced
in the second round, unfortunately bands also appeared within the negative control
column (NoA) indicating DNA contamination. No sample bands or negative control
bands appeared for sequence four, bands did appear for the positive control indicating
that the DNA precipitation and PCR amplification occurred successfully, it is unlikely
that sequence four is a binding location for REV-ERBα/RORα. For a number of months I
worked towards optimizing washing conditions, precipitation conditions and PCR cycling
conditions but was not successful in producing a clean and reproducible ChIP product. At
the moment, REV-ERBα/RORα binding to the SLC44A1 promoter remains to be shown.

71
1.45 BMAL knockout affects both SLC44A1 expression and hepatic choline
uptake.
If SLC44A1 expression and choline uptake are regulated by the circadian rhythm
then, disruption to the circadian rhythm should have a measurable effect on these
processes. BMAL-/- mice are rhythm deficient, in the liver altered REV-ERBα/RORα
regulation has been shown to increase CHKα expression and in turn elevate PC
synthesis 111. To test the relationship between BMAL and SLC44A1 expression and CTL
function, hepatic SLC44A1 expression and choline incorporation was measured in BMAL-
/- mice and wild-type controls at 7:00 am and 7:00 pm. As was observed by Grechez et al.,
an increase in choline incorporation occurred in BMAL-/- mice and is even seen to
increase at 7:00 pm (figure 11 B). Surprisingly, despite an increase in choline
incorporation, a decrease in SLC44A1 expression was measured at both time points which
was significant at 7:00 am (Figure 11 C). In addition, the rhythmic decrease in SLC44A1
expression seen to occur from 7:00 am to 7:00 pm in the control mice was ablated in the
BMAL-/- mice. The significant change in SLC44A1 expression among rhythm deficient,
BMAL-/- mice provides evidence supporting the idea of a circadian mechanism controlling
the rhythmic expression of SLC44A1. The opposite effect of BMAL-/- out on CHKα and
SLC44A1 expression was unexpected but could still be explained through the different
actions of REV-ERBα and RORα. Loss of REV-ERBα suppression instigated the
increase in CHKα expression. However, REV-ERBα expression is low in the early
morning and rises throughout the day where as RORα expression rises throughout the
night and peaks in the very early morning when SLC44A1 expression is typically highest.
RORα is known to function as a transcriptional stimulator, it could be that the loss of

72
RORα binding results in a loss of SLC44A1 transcription during the night and early
morning which would be demonstrated by low expression of SLC44A1 in the morning
and typical expression later in the day.
1.46 Obesity decreases the overall uptake and incorporation of choline in the
morning.
The goal of my third objective is to evaluate if obesity affects the circadian
regulation of SLC44A1. Numerous papers have identified connections between circadian
deregulation and the onset of metabolic disease, specifically obesity and NAFLD 88,89. To
begin answering this question a cohort of mice were selected, half were placed on a
rodent chow diet and half placed on a 60% high fat diet for 8 weeks. After processing the
tissues I found that the incorporation of 3H-choline in lean mice does not differ between
7:00 am and 7:00 pm. This is not the case among obese mice who demonstrate an
increase in 3H-choline incorporation at the 7:00 pm time point (Figure 12 A). The lack of
change over time among lean mice and the presence of a change in obese mice provide
contradicting evidence towards the circadian regulation of choline metabolism. In
comparison to the lean mice, the obese mice demonstrated a decrease in 3H-choline
incorporation at both time points but most significantly during the morning. This
indicates that obesity suppresses hepatic choline metabolism and may do so through the
disruption of a circadian mechanism (Figure 12 A). Stronger evidence of circadian
regulation is demonstrated at the transcript level where a significant increase in SLC44A1
expression can be measure in both groups at the 7:00 pm time point (Figure 12 B).
Notable is the decrease in mRNA seen among obese mice at both time points and most
significantly during the morning. This suggests that obesity suppresses hepatic choline

73
metabolism at the level of the transporter and for a second time demonstrates this
suppression more significantly in the morning.
Strangely, the results from figure 12A show an opposite trend to the results shown
in figure 6 B which demonstrate a decrease in SLC44A1 expression at 7:00 pm. For all
other experiments the results agree with figure 6 B, however I do not have an explanation
as to why a difference occurred between the two experiments.
1.47 Obesity suppresses CHKα and PEMT expression in the morning.
I have demonstrated that SLC44A1 expression differs between 7:00 am and 7:00 pm
which suggests a circadian regulatory mechanism might be at play. I have also
demonstrated that in obesity, SLC44A1 expression and choline incorporation are
decreased and that this decrease is significant during the morning. It is well known that
CHKα expression is regulated through the interplay of REV-ERBα and RORα
binding 112,111. To gain a better understanding of the influence obesity has on choline
metabolism as a whole, I measured the relative expression of choline metabolizing
enzymes and PEMT. Unsurprisingly, CHKα demonstrated an obvious change in
expression between 7:00 am and 7:00 pm, with a significant decrease occurring at 7:00
pm (Figure 12 A). Neither PCTY1/CCT or OCT1 demonstrated a significant difference in
expression (Figure 13 B,D). Interesting to note is the same inhibitory-like effect of
obesity on CHKα and PEMT at the 7:00 am time point which has been seen to occur with
SLC44A1 (Figure A,C). More interesting still is that this inhibition only affected genes
which are associated with the circadian rhythm and not PCTY1/CCT or OCT1. These
findings provide support towards the idea that obesity may influence choline metabolism
through a circadian regulatory mechanism.
74
CONCLUDING REMARKS
Following the characterization of hepatic choline transport, the CTL family of
transporters is an intermediate affinity transport system responsible for ~80% of choline
uptake. In completion of my second objective focused on understanding the regulatory
components of the CTL1 gene, obesity was found to significantly decrease hepatic
SLC44A1 expression and choline incorporation into PC. Although not to a significant
degree, CHKα and PEMT expression were both consistently decreased in the obese state.
In addition to obesity, the circadian rhythm was found to regulate SLC44A1 expression
and through this influence hepatic choline uptake. The similar rhythmic pattern seen to
occur between SLC44A1 and CHKα expression lead to the completion of a bioinformatics
analysis which revealed four potential REV-ERBα/RORα consensus sequences within
the SLC44A1 promoter. REV-ERBα binding activity was attempted to be measured
through chromatin immunoprecipitation however this experiment was not successfully
carried out. Further evidence of a circadian regulatory mechanism controlling SLC44A1
expression and in turn choline uptake was provided through the examination of
arrhythmic BMAL-/- mice who demonstrated a significant decrease in SLC44A1
expression and aberrant choline incorporation. In completion of my third objective the
effect of obesity on the circadian regulation of SLC44A1 was examined and it was
discovered that obesity decreases SLC44A1 expression and choline incorporation into PC.
A common pattern in SLC44A1, CHKα and PEMT expression was observed in obese
mice where by a significant decrease in expression occurred in the morning and a lesser
decrease in expression occurred at night. This same pattern was observed in SLC44A1
expression among BMAL-/- mice. In the obese state, the appearance of this pattern among
circadian linked genes and its appearance in the BMAL-/- mice suggests that obesity might

75
affect SLC44A1 expression through the disruption of a circadian regulatory mechanism,
although further evidence is required. This work increases our knowledge of hepatic
choline transport and demonstrates for the first time a link between the circadian rhythm
and obesity with the hepatic SLC44A1 transporter.
Future work towards uncovering the mechanism underlying SLC44A1 circadian
regulation could provide an additional link connecting the circadian rhythm and liver
metabolism. Additional work is needed to uncover the method underlying the inhibitory
effect of obesity on SLC44A1 expression. The time related decrease in SLC44A1
expression during obesity may provide a clue towards the underlying mechanism which
may or may not involve circadian factors. Along a slightly different avenue, the
relationship between CTL1 and its localization and functioning in the mitochondria also
merit further study. The development and characterization of a SLC44A1-/- mouse will
ultimately provide the information needed towards uncovering the full role and
contribution of CTL1 in maintaining liver and mitochondrial homeostasis as well as aid
in our understanding of the circadian and obesity regulatory components influencing
CTL1 gene expression and function.
76
REFERENCES
1. Gobley, Theodore. “Recherches chimiques sur les œufs de carpe” 17 (January 8, 1850): 401.
2. Strecker, Adolph, and Johannes Wislicenus. Adolph Strecker’s Short Text-book of Organic Chemistry. New York: D. Appleton and Company, 1882.
3. Bradley, W.H., B.N. Cooper, and J. Rodgers. The American Journal of Science. Publication (Carnegie Institution of Washington. Geophysical Laboratory). J.D. & E.S. Dana, 1868. https://books.google.ca/books?id=CvcQAAAAIAAJ.
4. Burt, ME, I Hanin, and MF Brennan. “Choline Deficiency Associated with Parenteral Nutrition (Letter).” Lancet 316, no. 8195 (September 20, 1980): 638–39.
5. Buchman, Al, M Dubin, D Jenden, A Moukarzel, Mh Roch, K Rice, J Gornbein, Me Ament, and Cd Eckhert. “Lecithin Increases Plasma Free Choline and Decreases Hepatic Steatosis in Long-Term Total Parenteral Nutrition Patients.” Gastroenterology 102, no. 4 (April 1992): 1363–70. doi:10.1016/0016-5085(92)70034-9.
6. Zeisel, S. H., K. A. Da Costa, P. D. Franklin, E. A. Alexander, J. T. Lamont, N. F. Sheard, and A. Beiser. “Choline, an Essential Nutrient for Humans.” FASEB Journal: Official Publication of the Federation of American Societies for Experimental Biology 5, no. 7 (April 1991): 2093–98.
7. Zeisel, S H. Vitamin-like Molecules: Choline. Philadelphia: Lea & Febiger, 1988. 8. Traiffort, E., M. Ruat, S. O’Regan, and F. M. Meunier. “Molecular Characterization of
the Family of Choline Transporter-like Proteins and Their Splice Variants: The Choline Transporter-like Proteins.” Journal of Neurochemistry 92, no. 5 (February 4, 2005): 1116–25. doi:10.1111/j.1471-4159.2004.02962.x.
9. Okuda, Takashi, and Tatsuya Haga. “Functional Characterization of the Human High-Affinity Choline Transporter 1.” FEBS Letters 484, no. 2 (November 3, 2000): 92–97. doi:10.1016/S0014-5793(00)02134-7.
10. Koepsell, H., B. M. Schmitt, and V. Gorboulev. “Organic Cation Transporters.” In Reviews of Physiology, Biochemistry and Pharmacology, 150:36–90. Berlin, Heidelberg: Springer Berlin Heidelberg, 2004. doi:10.1007/s10254-003-0017-x.
11. Gorboulev, Valentin, Jochen C. Ulzheimer, Aida Akhoundova, Isabel Ulzheimer-Teuber, Ulrich Karbach, Sven Quester, Carmen Baumann, Florian Lang, Andreas E. Busch, and Hermann Koepsell. “Cloning and Characterization of Two Human Polyspecific Organic Cation Transporters.” DNA and Cell Biology 16, no. 7 (July 1997): 871–81. doi:10.1089/dna.1997.16.871.
12. Michel, Vera, and Marica Bakovic. “The Ubiquitous Choline Transporter SLC44A1.” Central Nervous System Agents in Medicinal Chemistry 12, no. 2 (June 1, 2012): 70–81. doi:10.2174/187152412800792733.
13. Lips, Katrin S., Uwe Pfeil, Katja Reiners, Christoph Rimasch, Klaus Kuchelmeister, Ruediger C. Braun-Dullaeus, Rainer V. Haberberger, Rupert Schmidt, and Wolfgang Kummer. “Expression of the High-Affinity Choline Transporter CHT1 in Rat and Human Arteries.” Journal of Histochemistry & Cytochemistry 51, no. 12 (December 2003): 1645–54. doi:10.1177/002215540305101208.
14. Ribeiro, Fabiola M., Stefanie A. G. Black, Vania F. Prado, R. Jane Rylett, Stephen S. G. Ferguson, and Marco A. M. Prado. “The ‘Ins’ and ‘Outs’ of the High-Affinity Choline Transporter CHT1.” Journal of Neurochemistry 97, no. 1 (April 2006): 1–12. doi:10.1111/j.1471-4159.2006.03695.x.
77
15. Bauché, Stéphanie, Seana O’Regan, Yoshiteru Azuma, Fanny Laffargue, GraceMcMacken, Damien Sternberg, Guy Brochier, et al. “Impaired Presynaptic High-AffinityCholine Transporter Causes a Congenital Myasthenic Syndrome with Episodic Apnea.”American Journal of Human Genetics 99, no. 3 (September 1, 2016): 753–61.doi:10.1016/j.ajhg.2016.06.033.
16. Lips, Katrin Susanne, Christopher Volk, Bernhard Matthias Schmitt, Uwe Pfeil, PetraArndt, Dagmar Miska, Leander Ermert, Wolfgang Kummer, and Hermann Koepsell.“Polyspecific Cation Transporters Mediate Luminal Release of Acetylcholine fromBronchial Epithelium.” American Journal of Respiratory Cell and Molecular Biology 33,no. 1 (July 2005): 79–88. doi:10.1165/rcmb.2004-0363OC.
17. Müller, Johanna, Katrin S. Lips, Linda Metzner, Reinhard H.H. Neubert, HermannKoepsell, and Matthias Brandsch. “Drug Specificity and Intestinal MembraneLocalization of Human Organic Cation Transporters (OCT).” Biochemical Pharmacology70, no. 12 (December 2005): 1851–60. doi:10.1016/j.bcp.2005.09.011.
18. Koepsell, H., B. M. Schmitt, and V. Gorboulev. “Organic Cation Transporters.” InReviews of Physiology, Biochemistry and Pharmacology, 150:36–90. Berlin, Heidelberg:Springer Berlin Heidelberg, 2004. doi:10.1007/s10254-003-0017-x.
19. Lozano, Elisa, Elisa Herraez, Oscar Briz, Virginia S. Robledo, Jorge Hernandez-Iglesias,Ana Gonzalez-Hernandez, and Jose J. G. Marin. “Role of the Plasma MembraneTransporter of Organic Cations OCT1 and Its Genetic Variants in Modern LiverPharmacology.” BioMed Research International 2013 (2013): 1–13.doi:10.1155/2013/692071.
20. Roth, Megan, Amanda Obaidat, and Bruno Hagenbuch. “OATPs, OATs and OCTs: TheOrganic Anion and Cation Transporters of the SLCO and SLC22A Gene Superfamilies:OATPs, OATs and OCTs.” British Journal of Pharmacology 165, no. 5 (March 2012):1260–87. doi:10.1111/j.1476-5381.2011.01724.x.
21. Lin, Zhenwu, Laurie Nelson, Andre Franke, Lisa Poritz, Tong-Yi Li, Rongling Wu,Yunhua Wang, et al. “OCTN1 Variant L503F Is Associated with Familial and SporadicInflammatory Bowel Disease.” Journal of Crohn’s and Colitis 4, no. 2 (June 2010): 132–38. doi:10.1016/j.crohns.2009.09.003.
22. Yabuuchi, H., I. Tamai, J. Nezu, K. Sakamoto, A. Oku, M. Shimane, Y. Sai, and A. Tsuji.“Novel Membrane Transporter OCTN1 Mediates Multispecific, Bidirectional, and PH-Dependent Transport of Organic Cations.” The Journal of Pharmacology andExperimental Therapeutics 289, no. 2 (May 1999): 768–73.
23. Nakamura, Toshimichi, Kenji Yoshida, Hikaru Yabuuchi, Tomoji Maeda, and IkumiTamai. “Functional Characterization of Ergothioneine Transport by Rat OrganicCation/Carnitine Transporter Octn1 (Slc22a4).” Biological & Pharmaceutical Bulletin 31,no. 8 (August 2008): 1580–84.
24. O’Regan, Seana, Elisabeth Traiffort, Martial Ruat, Nathalie Cha, Désiré Compaoré, andFrançois-Marie Meunier. “An Electric Iobe Suppressor for a Yeast Choline TransportMutation Belongs to a New Family of Transporter-Like Proteins.” Proceedings of theNational Academy of Sciences of the United States of America 97, no. 4 (2000): 1835–40.
25. Wille, S., A. Szekeres, O. Majdic, E. Prager, G. Staffler, J. Stockl, D. Kunthalert, et al.“Characterization of CDw92 as a Member of the Choline Transporter-Like ProteinFamily Regulated Specifically on Dendritic Cells.” The Journal of Immunology 167, no.10 (November 15, 2001): 5795–5804. doi:10.4049/jimmunol.167.10.5795.

78
26. Nishiyama, Ryohta, Fumiaki Nagashima, Beniko Iwao, Yuiko Kawai, Kana Inoue, Arisa Midori, Tsuyoshi Yamanaka, Hiroyuki Uchino, and Masato Inazu. “Identification and Functional Analysis of Choline Transporter in Tongue Cancer: A Novel Molecular Target for Tongue Cancer Therapy.” Journal of Pharmacological Sciences 131, no. 2 (June 2016): 101–9. doi:10.1016/j.jphs.2016.04.022.
27. Zhu, Jie, Yang Wu, Qingya Tang, Yan Leng, and Wei Cai. “The Effects of Choline on Hepatic Lipid Metabolism, Mitochondrial Function and Antioxidative Status in Human Hepatic C3A Cells Exposed to Excessive Energy Substrates.” Nutrients 6, no. 7 (July 9, 2014): 2552–71. doi:10.3390/nu6072552.
28. Shiromizu, Takashi, Jun Adachi, Shio Watanabe, Tatsuo Murakami, Takahisa Kuga, Satoshi Muraoka, and Takeshi Tomonaga. “Identification of Missing Proteins in the NeXtProt Database and Unregistered Phosphopeptides in the PhosphoSitePlus Database As Part of the Chromosome-Centric Human Proteome Project.” Journal of Proteome Research 12, no. 6 (June 7, 2013): 2414–21. doi:10.1021/pr300825v.
29. Fullerton, M. D. “Impaired Trafficking of Choline Transporter-like Protein-1 at Plasma Membrane and Inhibition of Choline Transport in THP-1 Monocyte-Derived Macrophages.” AJP: Cell Physiology 290, no. 4 (November 23, 2005): C1230–38. doi:10.1152/ajpcell.00255.2005.
30. Pagano, A., G. Rovelli, J. Mosbacher, T. Lohmann, B. Duthey, D. Stauffer, D. Ristig, et al. “C-Terminal Interaction Is Essential for Surface Trafficking but Not for Heteromeric Assembly of GABA(b) Receptors.” The Journal of Neuroscience: The Official Journal of the Society for Neuroscience 21, no. 4 (February 15, 2001): 1189–1202.
31. Fagerberg, Linn, Björn M. Hallström, Per Oksvold, Caroline Kampf, Dijana Djureinovic, Jacob Odeberg, Masato Habuka, et al. “Analysis of the Human Tissue-Specific Expression by Genome-Wide Integration of Transcriptomics and Antibody-Based Proteomics.” Molecular & Cellular Proteomics 13, no. 2 (February 2014): 397–406. doi:10.1074/mcp.M113.035600.
32. Matsuda, Akio, Yutaka Suzuki, Goichi Honda, Shuji Muramatsu, Osamu Matsuzaki, Yukiko Nagano, Takahiro Doi, et al. “Large-Scale Identification and Characterization of Human Genes That Activate NF-ΚB and MAPK Signaling Pathways.” Oncogene 22, no. 21 (May 22, 2003): 3307–18. doi:10.1038/sj.onc.1206406.
33. Kommareddi, P. K., T. S. Nair, L. V. Thang, M. M. Galano, E. Babu, V. Ganapathy, T. Kanazawa, J. B. McHugh, and T. E. Carey. “Isoforms, Expression, Glycosylation, and Tissue Distribution of CTL2/SLC44A2.” The Protein Journal 29, no. 6 (August 2010): 417–26. doi:10.1007/s10930-010-9268-y.
34. Bayat, Behnaz, Yudy Tjahjono, Heike Berghöfer, Silke Werth, Hans Deckmyn, Simon F. De Meyer, Ulrich J. Sachs, and Sentot Santoso. “Choline Transporter-Like Protein-2Significance: New von Willebrand Factor–Binding Partner Involved in Antibody-Mediated Neutrophil Activation and Transfusion-Related Acute Lung Injury.” Arteriosclerosis, Thrombosis, and Vascular Biology 35, no. 7 (July 2015): 1616–22. doi:10.1161/ATVBAHA.115.305259.
35. Clark, Hilary F., Austin L. Gurney, Evangeline Abaya, Kevin Baker, Daryl Baldwin, Jennifer Brush, Jian Chen, et al. “The Secreted Protein Discovery Initiative (SPDI), a Large-Scale Effort to Identify Novel Human Secreted and Transmembrane Proteins: A Bioinformatics Assessment.” Genome Research 13, no. 10 (October 2003): 2265–70. doi:10.1101/gr.1293003.
79
36. Song, Pingfang, Stephen S. Rekow, Corey-Ayne Singleton, Harmanjatinder S. Sekhon, Gregory A. Dissen, Minerva Zhou, Barbara Campling, Jon Lindstrom, and Eliot R. Spindel. “Choline Transporter-like Protein 4 (CTL4) Links to Non-Neuronal Acetylcholine Synthesis.” Journal of Neurochemistry 126, no. 4 (August 2013): 451–61. doi:10.1111/jnc.12298.
37. Ma, Zhaoxin, Wenjun Xia, Fei Liu, Jing Ma, Shaoyang Sun, Jin Zhang, Nan Jiang, Xu Wang, Jiongjiong Hu, and Duan Ma. “SLC44A4 Mutation Causes Autosomal Dominant Hereditary Postlingual Non-Syndromic Mid-Frequency Hearing Loss.” Human Molecular Genetics 26, no. 2 (January 15, 2017): 383–94. doi:10.1093/hmg/ddw394.
38. Nabokina, Svetlana M., Katsuhisa Inoue, Veedamali S. Subramanian, Judith E. Valle, Hiroaki Yuasa, and Hamid M. Said. “Molecular Identification and Functional Characterization of the Human Colonic Thiamine Pyrophosphate Transporter.” The Journal of Biological Chemistry 289, no. 7 (February 14, 2014): 4405–16. doi:10.1074/jbc.M113.528257.
39. Peng, Gui-Zhu, Qi-Fa Ye, Ren Wang, Ming-Xia Li, and Zi-Xuan Yang. “Knockdown by ShRNA Identifies SLC44A5 as a Potential Therapeutic Target in Hepatocellular Carcinoma.” Molecular Medicine Reports 13, no. 6 (June 2016): 4845–52. doi:10.3892/mmr.2016.5136.
40. Kennedy, Eugene. “The Synthesis of Cytidine Diphosphoate Choline, Cytidine Diphosphate Ethanolamine, and Related Compounds,” January 23, 1956.
41. Vance, Jean E, and Dennis E Vance. “Phospholipid Biosynthesis in Mammalian Cells.” Biochemistry and Cell Biology 82, no. 1 (February 2004): 113–28. doi:10.1139/o03-073.
42. Gibellini, Federica, and Terry K. Smith. “The Kennedy Pathway-De Novo Synthesis of Phosphatidylethanolamine and Phosphatidylcholine.” IUBMB Life, 2010, n/a-n/a. doi:10.1002/iub.337.
43. Zhao, Y., B. Su, R. L. Jacobs, B. Kennedy, G. A. Francis, E. Waddington, J. T. Brosnan, J. E. Vance, and D. E. Vance. “Lack of Phosphatidylethanolamine N-Methyltransferase Alters Plasma VLDL Phospholipids and Attenuates Atherosclerosis in Mice.” Arteriosclerosis, Thrombosis, and Vascular Biology 29, no. 9 (September 1, 2009): 1349–55. doi:10.1161/ATVBAHA.109.188672.
44. Portal, I., T. Clerc, V. Sbarra, H. Portugal, A. M. Pauli, H. Lafont, B. Tuchweber, I. Yousef, and F. Chanussot. “Importance of High-Density Lipoprotein-Phosphatidylcholine in Secretion of Phospholipid and Cholesterol in Bile.” The American Journal of Physiology 264, no. 6 Pt 1 (June 1993): G1052-1056.
45. Robins, Sanders, and Marcia Armstrong. “Biliary Lechithin Secretion. II. Effects of Dietary Choline and Biliary Lecithin Synthesis” 70, no. 3 (1976): 397–402.
46. Rinella, Mary E., and Richard M. Green. “The Methionine-Choline Deficient Dietary Model of Steatohepatitis Does Not Exhibit Insulin Resistance.” Journal of Hepatology 40, no. 1 (January 2004): 47–51.
47. Rinella, Mary E., Marc S. Elias, Robin R. Smolak, Tao Fu, Jayme Borensztajn, and Richard M. Green. “Mechanisms of Hepatic Steatosis in Mice Fed a Lipogenic Methionine Choline-Deficient Diet.” Journal of Lipid Research 49, no. 5 (May 2008): 1068–76. doi:10.1194/jlr.M800042-JLR200.
48. Glunde, Kristine, Zaver M. Bhujwalla, and Sabrina M. Ronen. “Choline Metabolism in Malignant Transformation.” Nature Reviews Cancer, November 17, 2011. doi:10.1038/nrc3162.
80
49. Song, P, GP Mark, and Eliot R. Spindel. “Novel Choline Transporter-Like Proteins (CTLs) Mediate Choline Transport in Small Cell Lung Carcinoma,” 2009.
50. Inazu, Masato, Tomoko Yamada, Nobuo Kubota, and Tsuyoshi Yamanaka. “Functional Expression of Choline Transporter-like Protein 1 (CTL1) in Small Cell Lung Carcinoma Cells: A Target Molecule for Lung Cancer Therapy.” Pharmacological Research 76 (October 2013): 119–31. doi:10.1016/j.phrs.2013.07.011.
51. Kouji, Hironobu, Masato Inazu, Tomoko Yamada, Hirohisa Tajima, Tatsuya Aoki, and Teruhiko Matsumiya. “Molecular and Functional Characterization of Choline Transporter in Human Colon Carcinoma HT-29 Cells.” Archives of Biochemistry and Biophysics 483, no. 1 (March 2009): 90–98. doi:10.1016/j.abb.2008.12.008.
52. Zeisel, S H, and R J Wurtman. “Developmental Changes in Rat Blood Choline Concentration.” Biochemical Journal 198, no. 3 (September 15, 1981): 565–70. doi:10.1042/bj1980565.
53. Baumgartner, Heidi K., Kinsey M. Trinder, Carly E. Galimanis, Annalisa Post, Tzu Phang, Randal G. Ross, and Virginia D. Winn. “Characterization of Choline Transporters in the Human Placenta over Gestation.” Placenta 36, no. 12 (December 2015): 1362–69. doi:10.1016/j.placenta.2015.10.001.
54. Niculescu, M. D. “Dietary Choline Deficiency Alters Global and Gene-Specific DNA Methylation in the Developing Hippocampus of Mouse Fetal Brains.” The FASEB Journal 20, no. 1 (January 1, 2006): 43–49. doi:10.1096/fj.05-4707com.
55. Meck, Warren H, and Christina L Williams. “Choline Supplementation during Prenatal Development Reduces Proactive Interference in Spatial Memory.” Developmental Brain Research 118, no. 1–2 (December 1999): 51–59. doi:10.1016/S0165-3806(99)00105-4.
56. Cermak, Jennifer, Thomas Holler, Darrell Jackson, and Jan Blusztajn. “Prenatal Availability of Choline Modifies Development of the Hippocampal Cholinergic System” 12, no. 3 (March 1998): 349–57.
57. Rothschild, H.A., and ES Guzman Barron. “The Oxidation of Betain Aldehyde by Betain Aldehyde Dehydrogenase” 209 (January 18, 1954): 511–23.
58. Zeisel, S. H., T Zola, K. A. Da Costa, and E. A. Pomfret. “Effect of Choline Deficiency on S-Adenosylmethionine and Methionine Concentrations in Rat Liver.” 259, no. 3 (May 1, 1989): 725–29.
59. Anderson, Olivia S., Karilyn E. Sant, and Dana C. Dolinoy. “Nutrition and Epigenetics: An Interplay of Dietary Methyl Donors, One-Carbon Metabolism and DNA Methylation.” The Journal of Nutritional Biochemistry 23, no. 8 (August 2012): 853–59. doi:10.1016/j.jnutbio.2012.03.003.
60. Michel, Vera, Ratnesh Kumar Singh, and Marica Bakovic. “The Impact of Choline Availability on Muscle Lipid Metabolism.” Food Funct. 2, no. 1 (2011): 53–62. doi:10.1039/C0FO00069H.
61. Costa, Kerry-Ann da, Mihaela Badea, Leslie M. Fischer, and Steven H. Zeisel. “Elevated Serum Creatine Phosphokinase in Choline-Deficient Humans: Mechanistic Studies in C2C12 Mouse Myoblasts.” The American Journal of Clinical Nutrition 80, no. 1 (July 2004): 163–70.
62. Fischer, Leslie M., Kerry Ann daCosta, Lester Kwock, Paul W. Stewart, Tsui-Shan Lu, Sally P. Stabler, Robert H. Allen, and Steven H. Zeisel. “Sex and Menopausal Status Influence Human Dietary Requirements for the Nutrient Choline.” The American Journal of Clinical Nutrition 85, no. 5 (May 2007): 1275–85.
81
63. Jope, Richard S. “High Affinity Choline Transport and AcetylCoA Production in Brain and Their Roles in the Regulation of Acetylcholine Synthesis.” Brain Research Reviews 1, no. 3 (December 1979): 313–44. doi:10.1016/0165-0173(79)90009-2.
64. Mullen, G. P., E. A. Mathews, M. H. Vu, J. W. Hunter, D. L. Frisby, A. Duke, K. Grundahl, J. D. Osborne, J. A. Crowell, and J. B. Rand. “Choline Transport and de Novo Choline Synthesis Support Acetylcholine Biosynthesis in Caenorhabditis Elegans Cholinergic Neurons.” Genetics 177, no. 1 (July 29, 2007): 195–204. doi:10.1534/genetics.107.074120.
65. Michel, Vera, Zongfei Yuan, Shobha Ramsubir, and Marica Bakovic. “Choline Transport for Phospholipid Synthesis.” Experimental Biology and Medicine 231, no. 5 (May 2006): 490–504. doi:10.1177/153537020623100503.
66. Kanno, Keishi, Michele K. Wu, Erez F. Scapa, Steven L. Roderick, and David E. Cohen. “Structure and Function of Phosphatidylcholine Transfer Protein (PC-TP)/StarD2.” Biochimica et Biophysica Acta (BBA) - Molecular and Cell Biology of Lipids 1771, no. 6 (June 2007): 654–62. doi:10.1016/j.bbalip.2007.04.003.
67. Payne, F., K. Lim, A. Girousse, R. J. Brown, N. Kory, A. Robbins, Y. Xue, et al. “Mutations Disrupting the Kennedy Phosphatidylcholine Pathway in Humans with Congenital Lipodystrophy and Fatty Liver Disease.” Proceedings of the National Academy of Sciences 111, no. 24 (June 17, 2014): 8901–6. doi:10.1073/pnas.1408523111.
68. Cui, ZHENG, JE Vance, MH Chen, DR Voelker, and DE Vance. “Cloning and Expression of a Novel Phosphatidylethanolamine N-Methyltransferase. A Specific Biochemical and Cytological Marker for a Unique Membrane Fraction in Rat Liver.” Journal of Biological Chemistry 268, no. 22 (1993): 16655–63.
69. Arikketh, Devi, Randy Nelson, and Jean E. Vance. “Defining the Importance of Phosphatidylserine Synthase-1 (PSS1): Unexpected Viability of PSS1-Deficient Mice.” Journal of Biological Chemistry 283, no. 19 (May 9, 2008): 12888–97. doi:10.1074/jbc.M800714200.
70. Vance, Li, and Jacobs, “Hepatic Phosphatidylethanolamine N -Methyltransferase, Unexpected Roles in Animal Biochemistry and Physiology.”
71. Wu, Gengshu, Liyan Zhang, Tete Li, Azeret Zuniga, Gary D. Lopaschuk, Liang Li, René L. Jacobs, and Dennis E. Vance. “Choline Supplementation Promotes Hepatic Insulin Resistance in Phosphatidylethanolamine N- Methyltransferase-Deficient Mice via Increased Glucagon Action.” Journal of Biological Chemistry 288, no. 2 (January 11, 2013): 837–47. doi:10.1074/jbc.M112.415117.
72. Wang, L., S. Magdaleno, I. Tabas, and S. Jackowski. “Early Embryonic Lethality in Mice with Targeted Deletion of the CTP:Phosphocholine Cytidylyltransferase Gene (PCTY1a).” Molecular and Cellular Biology 25, no. 8 (April 15, 2005): 3357–63. doi:10.1128/MCB.25.8.3357-3363.2005.
73. Zhu, Xiaonan, Jiannan Song, Mei-Heng Mar, Lloyd J. Edwards, and Steven H. Zeisel. “Phosphatidylethanolamine N-Methyltransferase (PEMT) Knockout Mice Have Hepatic Steatosis and Abnormal Hepatic Choline Metabolite Concentrations despite Ingesting a Recommended Dietary Intake of Choline.” Biochemical Journal 370, no. 3 (March 15, 2003): 987–93. doi:10.1042/bj20021523.
74. Vance, Dennis E., and Jean E. Vance. “Physiological Consequences of Disruption of Mammalian Phospholipid Biosynthetic Genes.” Journal of Lipid Research 50, no. Supplement (April 2009): S132–37. doi:10.1194/jlr.R800048-JLR200.
82
75. Noga, Anna A., Yang Zhao, and Dennis E. Vance. “An Unexpected Requirement for Phosphatidylethanolamine N -Methyltransferase in the Secretion of Very Low Density Lipoproteins.” Journal of Biological Chemistry 277, no. 44 (November 1, 2002): 42358–65. doi:10.1074/jbc.M204542200.
76. Best, C.H. “A BRIEF REVIEW OF CERTAIN PHYSIOLOGICAL PROPERTIES OF INSULIN.” Can Med Assoc J. 2 (August 23, 1930): 141–45.
77. Best, C. H., and M. Elinor Huntsman. “The Effects of the Components of Lecithine upon Deposition of Fat in the Liver.” The Journal of Physiology 75, no. 4 (August 10, 1932): 405–12. doi:10.1113/jphysiol.1932.sp002899.
78. Vanni, Ester, Elisabetta Bugianesi, Anna Kotronen, Samuele De Minicis, Hannele Yki-Järvinen, and Gianluca Svegliati-Baroni. “From the Metabolic Syndrome to NAFLD or Vice Versa?” Digestive and Liver Disease 42, no. 5 (May 2010): 320–30. doi:10.1016/j.dld.2010.01.016.
79. Lv, Shiwei, Ruixin Fan, Yanping Du, Mengjun Hou, Zhihong Tang, Wenhua Ling, and Huilian Zhu. “Betaine Supplementation Attenuates Atherosclerotic Lesion in Apolipoprotein E-Deficient Mice.” European Journal of Nutrition 48, no. 4 (June 2009): 205–12. doi:10.1007/s00394-009-0003-4.
80. Fast, Darren G., and Dennis E. Vance. “Nascent VLDL Phospholipid Composition Is Altered When Phosphatidylcholine Biosynthesis Is Inhibited: Evidence for a Novel Mechanism That Regulates VLDL Secretion.” Biochimica et Biophysica Acta (BBA) - Lipids and Lipid Metabolism 1258, no. 2 (September 1995): 159–68. doi:10.1016/0005-2760(95)00116-T.
81. Yao, Zemin, and Dennis E. Vance. “Reduction in VLDL, but Not HDL, in Plasma of Rats Deficient in Choline.” Biochemistry and Cell Biology 68, no. 2 (February 1990): 552–58. doi:10.1139/o90-079.
82. Yao, Zemin, and D. E. Vance. “The Active Synthesis of Phosphatidylcholine Is Required for VLDL Secretion from Rat Hepatocyte” 263, no. 6 (February 25, 1988): 2998–3004.
83. Rajabi, Ala, Kelly-An Leonard, Donna Vine, Spencer Proctor, and René L. Jacobs. “Choline Status Modulates the Development of Atherosclerosis in LDL Receptor Knockout Mice” 28, no. 1 (April 2014).
84. Wang, Zeneng, Elizabeth Klipfell, Brian J. Bennett, Robert Koeth, Bruce S. Levison, Brandon DuGar, Ariel E. Feldstein, et al. “Gut Flora Metabolism of Phosphatidylcholine Promotes Cardiovascular Disease.” Nature 472, no. 7341 (April 7, 2011): 57–63. doi:10.1038/nature09922.
85. De Bacquer, D, M Van Risseghem, E Clays, F Kittel, G De Backer, and L Braeckman. “Rotating Shift Work and the Metabolic Syndrome: A Prospective Study.” International Journal of Epidemiology 38, no. 3 (June 1, 2009): 848–54. doi:10.1093/ije/dyn360.
86. Pietroiusti, A, A Neri, G Somma, L Coppeta, I Iavicoli, A Bergamaschi, and A Magrini. “Incidence of Metabolic Syndrome among Night-Shift Healthcare Workers.” Occupational and Environmental Medicine 67, no. 1 (January 1, 2010): 54–57. doi:10.1136/oem.2009.046797.
87. Vgontzas, A. N., D. Liao, S. Pejovic, S. Calhoun, M. Karataraki, and E. O. Bixler. “Insomnia With Objective Short Sleep Duration Is Associated With Type 2 Diabetes: A Population-Based Study.” Diabetes Care 32, no. 11 (November 1, 2009): 1980–85. doi:10.2337/dc09-0284.
83
88. Lorenzo, Di, De Pergola, C Zocchetti, N L’Abbate, A Basso, N Pannacciulli, M Cignarelli, R Giorgino, and L Soleo. “Effect of Shift Work on Body Mass Index: Results of a Study Performed in 319 Glucose Tolerant Men Working in Sounthern Italian Industry.” 27 (2003): 1353–58.
89. Kim, Chan-Won, Kyung Eun Yun, Hyun-Suk Jung, Yoosoo Chang, Eun-Suk Choi, Min-Jung Kwon, Eun-Hyun Lee, et al. “Sleep Duration and Quality in Relation to Non-Alcoholic Fatty Liver Disease in Middle-Aged Workers and Their Spouses.” Journal of Hepatology 59, no. 2 (August 2013): 351–57. doi:10.1016/j.jhep.2013.03.035.
90. Dibner, Charna, Ueli Schibler, and Urs Albrecht. “The Mammalian Circadian Timing System: Organization and Coordination of Central and Peripheral CLOCKs.” Annual Review of Physiology 72, no. 1 (March 17, 2010): 517–49. doi:10.1146/annurev-physiol-021909-135821.
91. Nishino, Hitoo, Kiyomi Koizumi, and Chandler McC. Brooks. “The Role of Suprachiasmatic Nuclei of the Hypothalamus in the Production of Circadian Rhythm.” Brain Research 112, no. 1 (August 1976): 45–59. doi:10.1016/0006-8993(76)90333-4.
92. Gekakis, N., D. Staknis, H. B. Nguyen, F. C. Davis, L. D. Wilsbacher, D. P. King, J. S. Takahashi, and C. J. Weitz. “Role of the CLOCK Protein in the Mammalian Circadian Mechanism.” Science (New York, N.Y.) 280, no. 5369 (June 5, 1998): 1564–69.
93. Yoo, S.-H., C. H. Ko, P. L. Lowrey, E. D. Buhr, E.-j. Song, S. Chang, O. J. Yoo, S. Yamazaki, C. Lee, and J. S. Takahashi. “A Noncanonical E-Box Enhancer Drives Mouse Period2 Circadian Oscillations in Vivo.” Proceedings of the National Academy of Sciences 102, no. 7 (February 15, 2005): 2608–13. doi:10.1073/pnas.0409763102.
94. Griffin, E. A., D. Staknis, and C. J. Weitz. “Light-Independent Role of CRY1 and CRY2 in the Mammalian Circadian CLOCK.” Science (New York, N.Y.) 286, no. 5440 (October 22, 1999): 768–71.
95. Shearman, L. P., S. Sriram, D. R. Weaver, E. S. Maywood, I. Chaves, B. Zheng, K. Kume, et al. “Interacting Molecular Loops in the Mammalian Circadian CLOCK.” Science (New York, N.Y.) 288, no. 5468 (May 12, 2000): 1013–19.
96. Ye, Rui, Cristopher P. Selby, Yi-Ying Chiou, Irem Ozkan-Dagliyan, Shobhan Gaddameedhi, and Aziz Sancar. “Dual Modes of CLOCK:BMAL1 Inhibition Mediated by Cryptochrome and Period Proteins in the Mammalian Circadian CLOCK.” Genes & Development 28, no. 18 (September 15, 2014): 1989–98. doi:10.1101/gad.249417.114.
97. Preitner, Nicolas, Francesca Damiola, Luis Lopez-Molina, Joszef Zakany, Denis Duboule, Urs Albrecht, and Ueli Schibler. “The Orphan Nuclear Receptor REV-ERBalpha Controls Circadian Transcription within the Positive Limb of the Mammalian Circadian Oscillator.” Cell 110, no. 2 (July 26, 2002): 251–60.
98. Ueda, Hiroki R., Wenbin Chen, Akihito Adachi, Hisanori Wakamatsu, Satoko Hayashi, Tomohiro Takasugi, Mamoru Nagano, et al. “A Transcription Factor Response Element for Gene Expression during Circadian Night.” Nature 418, no. 6897 (August 1, 2002): 534–39. doi:10.1038/nature00906.
99. Guillaumond, Fabienne, Hugues Dardente, Vincent Giguère, and Nicolas Cermakian. “Differential Control of BMAL1 Circadian Transcription by REV-ERB and ROR Nuclear Receptors.” Journal of Biological Rhythms 20, no. 5 (October 2005): 391–403. doi:10.1177/0748730405277232.
100. Panda, Satchidananda, Marina P. Antoch, Brooke H. Miller, Andrew I. Su, Andrew B. Schook, Marty Straume, Peter G. Schultz, Steve A. Kay, Joseph S. Takahashi, and John
84
B. Hogenesch. “Coordinated Transcription of Key Pathways in the Mouse by the Circadian CLOCK.” Cell 109, no. 3 (May 3, 2002): 307–20.
101. Fustin, Jean-Michel, Masao Doi, Yoshiaki Yamaguchi, Hayashi Hida, Shinichi Nishimura, Minoru Yoshida, Takayuki Isagawa, et al. “RNA-Methylation-Dependent RNA Processing Controls the Speed of the Circadian CLOCK.” Cell 155, no. 4 (November 2013): 793–806. doi:10.1016/j.cell.2013.10.026.
102. Le Martelot, Gwendal, Thierry Claudel, David Gatfield, Olivier Schaad, Benoît Kornmann, Giuseppe Lo Sasso, Antonio Moschetta, and Ueli Schibler. “REV-ERBα Participates in Circadian SREBP Signaling and Bile Acid Homeostasis.” Edited by Antonio J. Vidal-Puig. PLoS Biology 7, no. 9 (September 1, 2009): e1000181. doi:10.1371/journal.pbio.1000181.
103. Esau, Christine, Scott Davis, Susan F. Murray, Xing Xian Yu, Sanjay K. Pandey, Michael Pear, Lynnetta Watts, et al. “MiR-122 Regulation of Lipid Metabolism Revealed by in Vivo Antisense Targeting.” Cell Metabolism 3, no. 2 (February 2006): 87–98. doi:10.1016/j.cmet.2006.01.005.
104. Krützfeldt, Jan, Nikolaus Rajewsky, Ravi Braich, Kallanthottathil G. Rajeev, Thomas Tuschl, Muthiah Manoharan, and Markus Stoffel. “Silencing of MicRORNAs in Vivo with ‘Antagomirs.’” Nature 438, no. 7068 (December 1, 2005): 685–89. doi:10.1038/nature04303.
105. Feng, D., T. Liu, Z. Sun, A. Bugge, S. E. Mullican, T. Alenghat, X. S. Liu, and M. A. Lazar. “A Circadian Rhythm Orchestrated by Histone Deacetylase 3 Controls Hepatic Lipid Metabolism.” Science 331, no. 6022 (March 11, 2011): 1315–19. doi:10.1126/science.1198125.
106. Lau, Patrick, Rebecca L. Fitzsimmons, Suryaprakash Raichur, Shu-Ching M. Wang, Adriane Lechtken, and George E. O. Muscat. “The Orphan Nuclear Receptor, RORα, Regulates Gene Expression That Controls Lipid Metabolism: STAGGERER (SG/SG) MICE ARE RESISTANT TO DIET-INDUCED OBESITY.” Journal of Biological Chemistry 283, no. 26 (June 27, 2008): 18411–21. doi:10.1074/jbc.M710526200.
107. Arble, Deanna M., Joseph Bass, Aaron D. Laposky, Martha H. Vitaterna, and Fred W. Turek. “Circadian Timing of Food Intake Contributes to Weight Gain.” Obesity 17, no. 11 (November 2009): 2100–2102. doi:10.1038/oby.2009.264.
108. Turek, F. W. “Obesity and Metabolic Syndrome in Circadian CLOCK Mutant Mice.” Science 308, no. 5724 (May 13, 2005): 1043–45. doi:10.1126/science.1108750.
109. Zhang, Deqiang, Xin Tong, Blake Arthurs, Anirvan Guha, Liangyou Rui, Avani Kamath, Ken Inoki, and Lei Yin. “Liver CLOCK Protein BMAL1 Promotes de Novo Lipogenesis through Insulin-MTORC2-AKT Signaling.” Journal of Biological Chemistry 289, no. 37 (September 12, 2014): 25925–35. doi:10.1074/jbc.M114.567628.
110.Jacobi, David, Sihao Liu, Kristopher Burkewitz, Nora Kory, Nelson H. Knudsen, Ryan K. Alexander, Ugur Unluturk, et al. “Hepatic BMAL1 Regulates Rhythmic Mitochondrial Dynamics and Promotes Metabolic Fitness.” Cell Metabolism 22, no. 4 (October 2015): 709–20. doi:10.1016/j.cmet.2015.08.006.
111. Gréchez-Cassiau, Aline, Céline Feillet, Sophie Guérin, and Franck Delaunay. “The Hepatic Circadian CLOCK Regulates the α Gene through the BMAL1-REV-ERBα Axis.” Chronobiology International 32, no. 6 (July 3, 2015): 774–84. doi:10.3109/07420528.2015.1046601.
85
112. Gorné, Lucas D., Victoria A. Acosta-Rodríguez, Susana J. Pasquaré, Gabriela A. Salvador, Norma M. Giusto, and Mario Eduardo Guido. “The Mouse Liver Displays Daily Rhythms in the Metabolism of Phospholipids and in the Activity of Lipid Synthesizing Enzymes.” Chronobiology International 32, no. 1 (January 2, 2015): 11–26. doi:10.3109/07420528.2014.949734.
113. Sinclair, C. J., K. D. Chi, V. Subramanian, K. L. Ward, and R. M. Green. “Functional Expression of a High Affinity Mammalian Hepatic Choline/Organic Cation Transporter.” Journal of Lipid Research 41, no. 11 (November 2000): 1841–48.
114. Livak, K. J., and T. D. Schmittgen. “Analysis of Relative Gene Expression Data Using Real-Time Quantitative PCR and the 2(-Delta Delta C(T)) Method.” Methods (San Diego, Calif.) 25, no. 4 (December 2001): 402–8. doi:10.1006/meth.2001.1262.
115. Fullerton MD, Hakimuddin F, Bonen A, Bakovic M. The Development of a Metabolic Disease Phenotype in CTP:Phosphoethanolamine Cytidylyltransferase-deficient Mice. J Biol Chem. 2009 Sep 18; 284(38):25704-13.
116. Bunger, M. K., L. D. Wilsbacher, S. M. Moran, C. Clendenin, L. A. Radcliffe, J. B. Hogenesch, M. C. Simon, J. S. Takahashi, and C. A. Bradfield. “Mop3 Is an Essential Component of the Master Circadian Pacemaker in Mammals.” Cell103, no. 7 (December 22, 2000): 1009–17.
117. Du, William W, Fengqiong Liu, Sze Wan Shan, Xindi Cindy Ma, Shaan Gupta, Tianru Jin, David Spaner, et al. “Inhibition of Dexamethasone-Induced Fatty Liver Development by Reducing MiR-17-5p Levels.” Molecular Therapy 23, no. 7 (July 2015): 1222–33. doi:10.1038/mt.2015.64.
118. Harasim-Symbor, Ewa, Karolina Konstantynowicz-Nowicka, and Adrian Chabowski. “Additive Effects of Dexamethasone and Palmitate on Hepatic Lipid Accumulation and Secretion.” Journal of Molecular Endocrinology 57, no. 4 (November 2016): 261–73. doi:10.1530/JME-16-0108.
119. Rooney, S. A., D. A. Smart, P. A. Weinhold, and D. A. Feldman. “Dexamethasone Increases the Activity but Not the Amount of Choline-Phosphate Cytidylyltransferase in Fetal Rat Lung.” Biochimica Et Biophysica Acta 1044, no. 3 (June 14, 1990): 385–89.
120. Tappy, L, D Randin, P Vollenweider, L Vollenweider, N Paquot, U Scherrer, P Schneiter, P Nicod, and E Jéquier. “Mechanisms of Dexamethasone-Induced Insulin Resistance in Healthy Humans.” The Journal of Clinical Endocrinology & Metabolism 79, no. 4 (October 1994): 1063–69. doi:10.1210/jcem.79.4.7962275.
121. Jeong, I. K., S. H. Oh, B. J. Kim, J. H. Chung, Y. K. Min, M. S. Lee, M. K. Lee, and K. W. Kim. “The Effects of Dexamethasone on Insulin Release and Biosynthesis Are Dependent on the Dose and Duration of Treatment.” Diabetes Research and Clinical Practice 51, no. 3 (March 2001): 163–71.
122. Kathirvel, E., K. Morgan, G. Nandgiri, B. C. Sandoval, M. A. Caudill, T. Bottiglieri, S. W. French, and T. R. Morgan. “Betaine Improves Nonalcoholic Fatty Liver and Associated Hepatic Insulin Resistance: A Potential Mechanism for Hepatoprotection by Betaine.” AJP: Gastrointestinal and Liver Physiology 299, no. 5 (November 1, 2010): G1068–77. doi:10.1152/ajpgi.00249.2010.
123. Kiechle, F. L., H. Malinski, D. R. Strandbergh, and J. D. Artiss. “Stimulation of Phosphatidylcholine Synthesis by Insulin and ATP in Isolated Rat Adipocyte Plasma Membranes.” Biochemical and Biophysical Research Communications137, no. 1 (May 29, 1986): 1–7.
86
124. McGarry, J D, and D W Foster. “Regulation of Hepatic Fatty Acid Oxidation and Ketone Body Production.” Annual Review of Biochemistry 49, no. 1 (June 1980): 395–420. doi:10.1146/annurev.bi.49.070180.002143.
125. Pelech, SL, PH Pritchard, DN Brindley, and D. E. Vance. “Fatty Acids Promote Translocation of CTP:Phosphocholine Cytidylytransferase to the Endoplasmic Reticulum and Stimulate Rat Hepatic Phosphatidylcholine Synthesis.” 258 (June 10, 1983): 6782–88.
126. Smith, Tim A. D., and Su M. Phyu. “Metformin Decouples Phospholipid Metabolism in Breast Cancer Cells.” Edited by Viji Shridhar. PLOS ONE 11, no. 3 (March 9, 2016): e0151179. doi:10.1371/journal.pone.0151179.
127. Meikle, Peter J., and Scott A. Summers. “Sphingolipids and Phospholipids in Insulin Resistance and Related Metabolic Disorders.” Nature Reviews Endocrinology 13, no. 2 (October 21, 2016): 79–91. doi:10.1038/nrendo.2016.169.
128. Schenkel, Laila Cigana, and Marica Bakovic. “Palmitic Acid and Oleic Acid Differentially Regulate Choline Transporter-Like 1 Levels and Glycerolipid Metabolism in Skeletal Muscle Cells.” Lipids 49, no. 8 (August 2014): 731–44. doi:10.1007/s11745-014-3925-4.
129. Kirchner, Henriette, Indranil Sinha, Hui Gao, Maxwell A. Ruby, Milena Schönke, Jessica M. Lindvall, Romain Barrès, et al. “Altered DNA Methylation of Glycolytic and Lipogenic Genes in Liver from Obese and Type 2 Diabetic Patients.” Molecular Metabolism 5, no. 3 (March 2016): 171–83. doi:10.1016/j.molmet.2015.12.004.
130. Obeid, Rima. “The Metabolic Burden of Methyl Donor Deficiency with Focus on the Betaine Homocysteine Methyltransferase Pathway.” Nutrients 5, no. 9 (September 9, 2013): 3481–95. doi:10.3390/nu5093481.
131. Fabbrini, Elisa, Shelby Sullivan, and Samuel Klein. “Obesity and Nonalcoholic Fatty Liver Disease: Biochemical, Metabolic, and Clinical Implications.” Hepatology 51, no. 2 (February 2010): 679–89. doi:10.1002/hep.23280.
132. Eckel-Mahan, Kristin, and Paolo Sassone-Corsi. “Phenotyping Circadian Rhythms in Mice: Phenotyping Circadian Rhythms in Mice.” In Current Protocols in Mouse Biology, edited by Johan Auwerx, Susan L. Ackerman, Stephen D. Brown, Monica J. Justice, and Joseph Nadeau, 271–81. Hoboken, NJ, USA: John Wiley & Sons, Inc., 2015. doi:10.1002/9780470942390.mo140229
APPENDIX 1
1.48 Breeding Scheme Towards the Generation of a SLC44A1-/- Mouse
The generation of a SLC44A1-/- mouse line was developed by ingenious Targeting
Laboratories. A KOMP target vector (Project ID: CSD29103) containing a Cre-lox
system and lacZ/neomycin cassette was electroporated into C57BL/6 embryonic stem
87
cells and delivered into Balb/c blastocysts. Homozygous floxed mice were produced and
bread to mice containing whole body Cre recombinase (B6.C-Tg(CMV- cre)1Cgn/J-
stock number 006054). Unfortunately these mice still expressed the CTL1 protein, our
lab bred these mice with homozygous Cre-containing mice in a second attempt to remove
the CTL1 gene (Figure 3 A). Genotyping indicated that knockout mice had been
produced and so steps were taken towards the removal of the LacZ/neomycin cassette
(Figure 3 B). Unfortunately qPCR and western blot results indicated the presence of
CTL1 following our attempts to remove the cassette. Presently the lab is working towards
re-establishing a SLC44A1-/- mouse.
In a second attempt towards removing SLC44A1 expression, primary hepatocytes were
taken from the SLC44A1-cre-lox mice and were treated with a Cre-containing adenovirus
obtained from Dr. Parks’ Lab. The cells were incubated in an MOI of 5, 10 and 20 for 24,
48 and 72 hours. The cells experienced toxicity at an MOI of 20 and at any MOI
incubated for 72 hours. The uptake of adenovirus was evaluated through imaging using
the Leica imaging system under the Texas Red filter, CTL1 expression was evaluated by
western blot. There’s a notable decrease in CTL1 expression with increasing adenovirus
concentration but unfortunately CTL1 expression is not completely inhibited at 20 MOI
and increasing the concentration further would lead to greater toxicity, for these reasons
this experiment was not continued.

88
A B
Figure A1. Generation of a SLC44A1/- mouse. (A) Breeding scheme between the original CTL1 floxed mouse and homozygous cre-recombinase mouse and the F1 cross of their progeny. (B) Genotyping results of the F1 and F2 generation of CTL1 heterozygous, CTL1 knockout and wildtype progeny. The disappearance of the 900 bp band in the top gel of the F2 generation indicates the removal of SLC44A1 exon 3. The presence of a 900 bp band in the bottom gel of the F2 generation indicates the knockout of CTL1.
XCRE
XCRE
, +/+ XY, fl/+
XXCRE
, -/+
XCRE
Y, -/+
XY, fl/fl
XX, fl/fl
X
Original Cross:
F1 Cross:
X
X
wt 700bp fl 900bp
CTL1 KO 900bp wt no bands
F2 generation
KO fl/KO KO fl/KO fl/KO WT
fl 900bp wt 700bp
Cre +
CTL1 KO 900bp
F1 generation
Het 1 2 3 4

89
1.49 Removal of SLC44A1 Exon 3 lox-p sites with a Cre-containing Adenovirus
Figure A2. CTL1 expression following treatment with Cre-containing adenovirus. (A) Microscope image of primary hepatocytes treated with an MOI of 10 for 24 hours, mCherry fluorophore was imaged using the Texas Red filter at 561/594 nm and overlaid onto a white light image. (B) Western blot of CTL1 expression following 24 hour of adenoviral treatment at an MOI of 5, 10 and 20, c-term antibody.
A
B
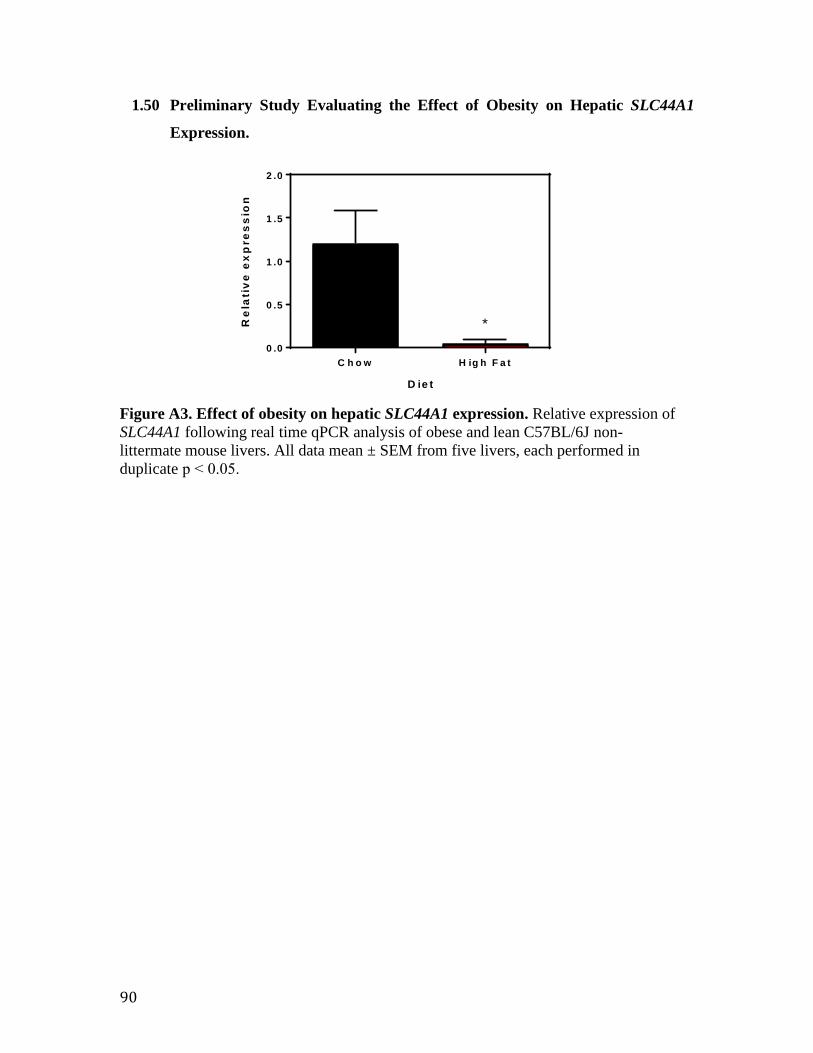
90
1.50 Preliminary Study Evaluating the Effect of Obesity on Hepatic SLC44A1
Expression.
C h o w H ig h F a t0 .0
0 .5
1 .0
1 .5
2 .0
D ie t
Re
lati
ve
ex
pre
ss
ion
*
Figure A3. Effect of obesity on hepatic SLC44A1 expression. Relative expression of SLC44A1 following real time qPCR analysis of obese and lean C57BL/6J non-littermate mouse livers. All data mean ± SEM from five livers, each performed in duplicate p < 0.05.
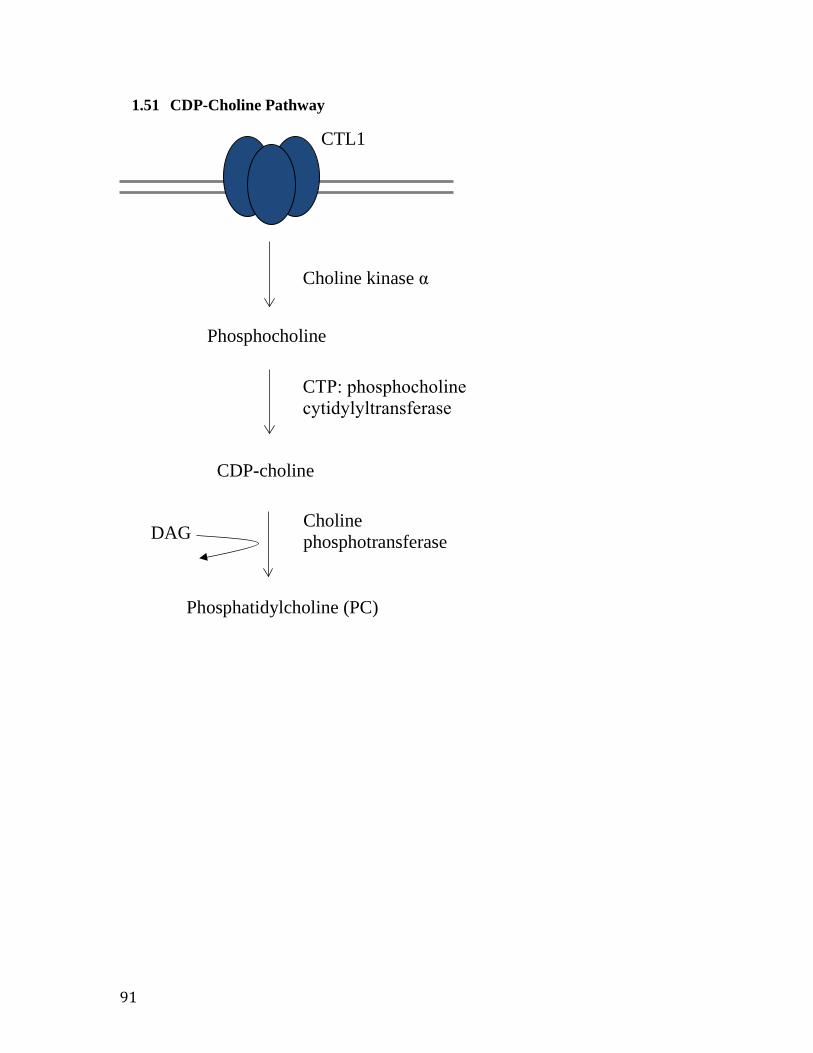
91
1.51 CDP-Choline Pathway
Choline kinase α
Phosphocholine
CTP: phosphocholine cytidylyltransferase
CDP-choline
Phosphatidylcholine (PC)
Choline phosphotransferaseDAG
CTL1