Embed Size (px)
Citation preview
Ecological Engineering 19 (2002) 97–117 www.elsevier.com/locate/ecoleng
The relationship between ecosystem services and purchasedinput in Swedish wastewater treatment systems — a case
study�
Ulrika Geber *, Johanna BjorklundDepartment of Ecology and Crop Production Science, Swedish Uni�ersity of Agricultural Sciences, Box 7043,
750 07 Uppsala, Sweden
Received 10 November 1999; received in revised form 28 November 2000; accepted 18 December 2000
Abstract
There is an increasing awareness of ecosystem services and use of ecological engineering in today’s search for moresustainable wastewater treatment systems, but there is still great uncertainty about how to compare and evaluate theecological sustainability of different systems. The aim of this study was to analyze the use of resources in threedifferent wastewater treatment systems: (i) conventional three-step treatment (WWTP), (ii) conventional mechanicaland chemical treatment complemented with a constructed wetland (TP+CW), and (iii) treatment in a naturalwetland (NW), and to investigate to what extent increased space, time, and dependence of ecosystem services couldsubstitute for purchased input in wastewater treatment. In order to compare resources of different quality we usedemergy analysis, assessing the amount of solar energy required, directly and indirectly, for a certain production.Emergy use due to purchased inputs and to local renewable inputs differed substantially between the three treatmentsystem studies, with emergy ratios of purchased to local renewable inputs of 9:1, 141:1, and 3056:1 for NW,TP+CW, and WWTP, respectively. Total use of emergy per person equivalent (p.e.) and kg phosphorus was similarin all three systems, strengthening our hypothesis of unchanged total emergy use in systems of different purchasedinput and land use. However, in the present study, purchased input was not fully substituted, while the naturalwetland, apart from requiring a large land area, also needed a lot of purchased resources to fulfil the strict rules forwastewater treatment prescribed by society. © 2002 Elsevier Science B.V. All rights reserved.
Keywords: Wastewater treatment; Resource use; Emergy analysis; Ecosystem services; Area demand; Wetlands
1. Introduction
During the past four decades, alternative sys-tems for wastewater treatment have been continu-ally developed. A major focus is on reduction ofthe use of non-renewable resources and to whatextent environmental inputs that are renewable
� PII of original article: S0925 -8574 (01 )00064 -7.* Corresponding author. Tel.: +46-1867-1419; fax: +46-
1867-2906.E-mail address: [email protected] (U. Geber).1 Calculation based on emergy in rain.
0925-8574/02/$ - see front matter © 2002 Elsevier Science B.V. All rights reserved.
PII: S0 925 -8574 (02 )00079 -4
Erratum98
and free can substitute for non-renewable re-sources. One common characteristic of thesestrategies is the acknowledgement of ecosystemservices by the use of ecological engineering (Witt-gren and Hasselgren, 1993; Mitsch, 1998).
Ecosystem services could be defined as ‘thebenefits human populations derive, directly orindirectly, from ecosystem functions’ (Costanza etal., 1997). Examples of ecosystem services areregulation of local and global climate, pollination,soil formation, biotic regulation, bacterial deni-trification, photosynthesis and support ofbiodiversity.
The differences between wastewater treatmentstrategies often constitute the degree of manage-ment. Using ecosystem services (see Table 1), werely on time and on space of interaction fordifferent purposes, be they biological, e.g. nitrifi-cation and denitrification; chemical, e.g. adsorp-tion and fixation; or physical, e.g. sedimentationand evaporation. Increased energy input forforced aeration, increasing nitrification of ammo-nium, in a wastewater treatment plant (WWTP),can substitute for the requirement of time andspace for the same process in a wetland (Knight,1995; Ødegaard, 1995). A process that takes daysin a wetland is accomplished within hours in aWWTP.
A large amount of experience and knowledgehas been gained in the design and function ofalternative wastewater treatment strategies(Crites, 1984; Reed et al., 1988; Cooper and Find-later, 1990; Wittgren and Hasselgren, 1993; Witt-gren, 1994; Knight, 1995; Kadlec and Knight,1996), but there is still great uncertainty abouthow to compare and evaluate the resource use of
different systems. This is especially true when onewishes to include comparisons of such disparatematters as the use of ecosystem service, space, andtime.
Life cycle assessment, environmental impactanalysis, energy analysis, exergy analysis and massflow analysis have been applied in evaluating re-source use in Swedish wastewater treatment sys-tems (Nilsson and Bergstrom, 1995; Ødegaard,1995; Dalemo, 1996; Tillman et al., 1996;Bengtsson et al., 1997; Hellstrom, 1997; Lundin etal., 1999).
Finnveden and O� stlund (1997) propose the useof exergy in life-cycle analysis as a measure ofresource use or resource depletion to overcomethe problem with comparison of resources of dif-ferent quality.
The aim of this study was to analyze the re-source use and illustrate the relationship betweenthe demand for space, time and purchased inputin different wastewater treatment systems. Wewished to investigate the extent to which increasedspace and dependence on ecosystem services cansubstitute for purchased input. Since it is possibleto measure these resources on a common basis inemergy analysis, this method was chosen. Anemergy analysis considers environmental work(e.g. ecosystem services) as well as direct andindirect resource use to sustain human inputs.Moreover, the method of analysis is built on anecosystem perspective, acknowledging ecosystemstructure and functions, which is appropriatewhen working with wastewater treatment partlyin wetlands.
It would have been inappropriate to use energyanalysis, since it does not consider resource useother than auxiliary energy (e.g. the energy usedfor exploitation or construction), nor any qualitydifferences between different kinds of energies orinclude free environmental work. Furthermore, itdoes not properly account for the environmentalwork supporting human society. Nor is the prob-lem of accounting, for environmental work sup-porting human society solved in exergy analysis.Another drawback of exergy analysis is that qual-ity differences in different kinds of resources onlyare considered in respect of their ability to beconverted to geobiochemical energy or mechani-
Table 1Ecosystem services used in wastewater treatment
PhysicalBiological Chemicalprocesses
AmmonificationDenitrification SedimentationAdsorption EvaporationNitrificationFixationFermentation Transpiration
Plant uptakeOxidization of
organic matter

Erratum 99
Table 2Comparison of aspects relevant to this study of some environmental assessment methods
Life cycle assessment Emergy analysis Exergy analysisCost benefit analysis
Assess resource use andGoal Assess direct and Assess resource use andService optimizationenvironmental impact indirect resource use production efficiency
Theoretical foundation Engineering sciencesNeoclassical economics Systems ecology ThermodynamicsAbility to handle Cost of treatment Chemical pollutantsYes In an ‘end-use’ emergy
analysisversus no treatmentpollutantsGibbs free energyMarket decides the Transformities are usedAbility to handle Subjective weighing
difference in energy factors used as weighing factorsvaluequality
Market interpretationAbility to handle other Subjective weighing To the extent that theyTransformation ratiosare used as weighing can be converted toresources factors usedfactors available energy
AnthropocentricPerspective Anthropocentric Ecocentric Not relevantIf internalizedAbility to handle Yes-partly Yes, conceptually but No
needs to be developedecosystem servicesLarge to small Large to smallScale in focus Process scaleProcess scale
cal work (Szargut, 1998). Nor would it be appro-priate to use LCA as it does not provide anyconversion between different effect categories, e.g.employment of land, time and ecosystem serviceversus purchased inputs. Cost benefit analysis istoo blunt while dealing with ecosystems and in-volves human preferences, e.g. willingness to pay,which was considered inappropriate in the presentstudy. To further clarify the reasons of our choiceof method, differences in scope and perspective ofthe considered environmental assessment methodsare aggregated in Table 2.
The present analysis was limited to resourceuse. Three wastewater treatment systems (twocase studies and one theoretical example); conven-tional three-step treatment (WWTP-wastewatertreatment plant), conventional mechanical andchemical treatment complemented with biologicalN treatment in a constructed wetland (TP+CW-treatment plant+constructed wetland) and treat-ment in a natural wetland (NW-natural wetland)were analyzed to exemplify and discuss ecosystemservice use and the use of time, space and energy.The hypothesis was that the amount of totalemergy use would not differ between treatmentsystems, but only in the partitioning between theuse of free environmental emergy and purchasedemergy. It implies that there are fixed relation-ships between the substitutions which form the
physical, biological and technological boundariesof all human activities. In order to compare natu-ral and technological systems and test our hy-pothesis we must assume that our man-madetreatment systems, as well as the natural ecosys-tems, are efficient in what they are designed for,namely the treatment of wastewater. Otherwisethe substitutability will fail in terms of emergy usein the different systems.
To test our hypothesis we also analyzed therelationship between the use of free renewable topurchased non-renewable resources of the differ-ent treatments and the extent to which there wasa trade-off in the use of purchased goods andecosystems service. The latter is also the reasonwe chose the example with treatment of rawwastewater in a natural wetland — to comparetwo extremes with respect to purchased input useand time and land use.
The emergy analysis has previously been usedin analysis of wastewater treatment in wetlands(Odum et al., 1987; Flanagan and Mitsch, 1997)and to our knowledge in one evaluation of aconventional treatment system (Nelson, 1998).The method is founded on principles for organiza-tion and optimization of self-organizing systems,developed from theories in ecosystem ecology(Odum, 1994). An advantage with the emergyanalysis is the possibility to compare resources
Erratum100
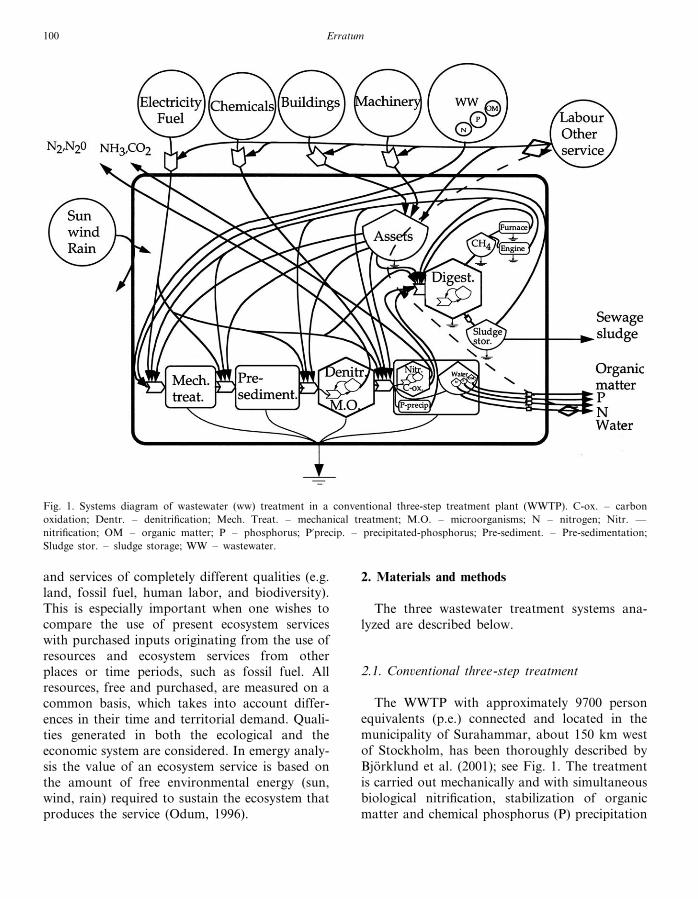
Fig. 1. Systems diagram of wastewater (ww) treatment in a conventional three-step treatment plant (WWTP). C-ox. – carbonoxidation; Dentr. – denitrification; Mech. Treat. – mechanical treatment; M.O. – microorganisms; N – nitrogen; Nitr. —nitrification; OM – organic matter; P – phosphorus; P�precip. – precipitated-phosphorus; Pre-sediment. – Pre-sedimentation;Sludge stor. – sludge storage; WW – wastewater.
and services of completely different qualities (e.g.land, fossil fuel, human labor, and biodiversity).This is especially important when one wishes tocompare the use of present ecosystem serviceswith purchased inputs originating from the use ofresources and ecosystem services from otherplaces or time periods, such as fossil fuel. Allresources, free and purchased, are measured on acommon basis, which takes into account differ-ences in their time and territorial demand. Quali-ties generated in both the ecological and theeconomic system are considered. In emergy analy-sis the value of an ecosystem service is based onthe amount of free environmental energy (sun,wind, rain) required to sustain the ecosystem thatproduces the service (Odum, 1996).
2. Materials and methods
The three wastewater treatment systems ana-lyzed are described below.
2.1. Con�entional three-step treatment
The WWTP with approximately 9700 personequivalents (p.e.) connected and located in themunicipality of Surahammar, about 150 km westof Stockholm, has been thoroughly described byBjorklund et al. (2001); see Fig. 1. The treatmentis carried out mechanically and with simultaneousbiological nitrification, stabilization of organicmatter and chemical phosphorus (P) precipitation
Erratum 101
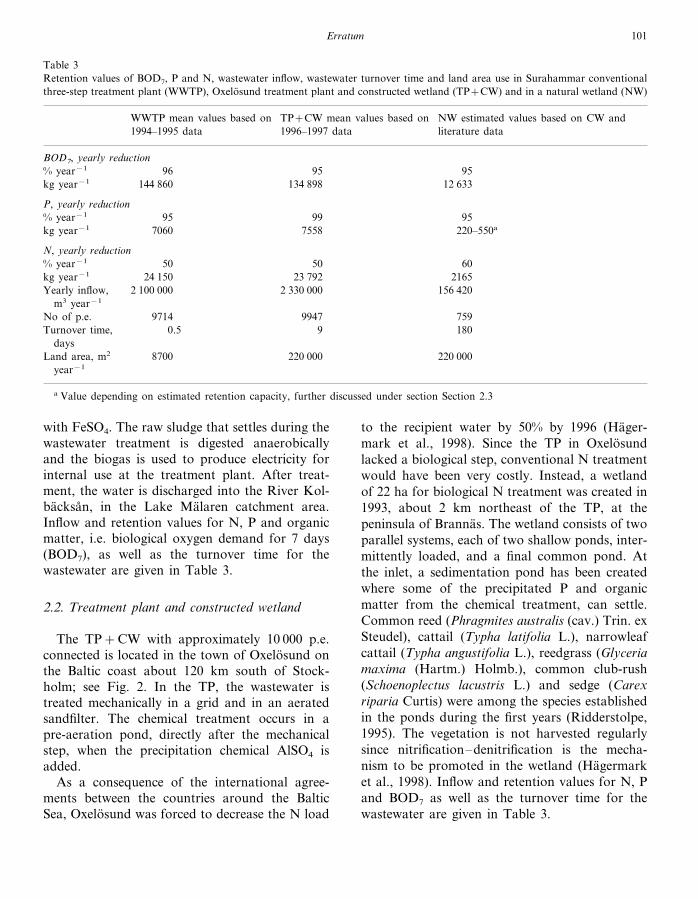
Table 3Retention values of BOD7, P and N, wastewater inflow, wastewater turnover time and land area use in Surahammar conventionalthree-step treatment plant (WWTP), Oxelosund treatment plant and constructed wetland (TP+CW) and in a natural wetland (NW)
WWTP mean values based on TP+CW mean values based on NW estimated values based on CW and1994–1995 data literature data1996–1997 data
BOD7, yearly reduction% year−1 9596 95
134 898 12 633kg year−1 144 860
P, yearly reduction% year−1 9995 95
7060kg year−1 7558 220–550a
N, yearly reduction50% year−1 50 60
23 792 2165kg year−1 24 1502 100 000Yearly inflow, 2 330 000 156 420
m3 year−1
9947No of p.e. 75997140.5 9 180Turnover time,
days8700 220 000Land area, m2 220 000
year−1
a Value depending on estimated retention capacity, further discussed under section Section 2.3
with FeSO4. The raw sludge that settles during thewastewater treatment is digested anaerobicallyand the biogas is used to produce electricity forinternal use at the treatment plant. After treat-ment, the water is discharged into the River Kol-backsan, in the Lake Malaren catchment area.Inflow and retention values for N, P and organicmatter, i.e. biological oxygen demand for 7 days(BOD7), as well as the turnover time for thewastewater are given in Table 3.
2.2. Treatment plant and constructed wetland
The TP+CW with approximately 10 000 p.e.connected is located in the town of Oxelosund onthe Baltic coast about 120 km south of Stock-holm; see Fig. 2. In the TP, the wastewater istreated mechanically in a grid and in an aeratedsandfilter. The chemical treatment occurs in apre-aeration pond, directly after the mechanicalstep, when the precipitation chemical AlSO4 isadded.
As a consequence of the international agree-ments between the countries around the BalticSea, Oxelosund was forced to decrease the N load
to the recipient water by 50% by 1996 (Hager-mark et al., 1998). Since the TP in Oxelosundlacked a biological step, conventional N treatmentwould have been very costly. Instead, a wetlandof 22 ha for biological N treatment was created in1993, about 2 km northeast of the TP, at thepeninsula of Brannas. The wetland consists of twoparallel systems, each of two shallow ponds, inter-mittently loaded, and a final common pond. Atthe inlet, a sedimentation pond has been createdwhere some of the precipitated P and organicmatter from the chemical treatment, can settle.Common reed (Phragmites australis (cav.) Trin. exSteudel), cattail (Typha latifolia L.), narrowleafcattail (Typha angustifolia L.), reedgrass (Glyceriamaxima (Hartm.) Holmb.), common club-rush(Schoenoplectus lacustris L.) and sedge (Carexriparia Curtis) were among the species establishedin the ponds during the first years (Ridderstolpe,1995). The vegetation is not harvested regularlysince nitrification–denitrification is the mecha-nism to be promoted in the wetland (Hagermarket al., 1998). Inflow and retention values for N, Pand BOD7 as well as the turnover time for thewastewater are given in Table 3.

Erratum102
Fig. 2. Systems diagram of wastewater (ww) treatment in a conventional mechanical and chemical treatment plant with a constructedwetland (TP+CW). (i) Aggregation of processes explicitly drawn in Fig. 3. CW − constructed wetland; Digest. − digester; Furn.− furnace; Mech. treat. − Mechanical treatment; M.O. − microorganisms; N − nitrogen; OM − organic matter; P −phosphorus; Sludge stor. − sludge storage; WW − wastewater.
2.3. Natural wetland
The use of natural wetlands for wastewatertreatment is controversial, especially under tem-perate climatic conditions, and the wastewaterrequires extensive pretreatment if wetland treat-ment efficiency is to be sufficient (Wittgren, 1994;Knight, 1995). When using a natural wetland asan example of wastewater treatment we have fo-cused on long-term retention functions, i.e. peataccumulation and adsorption of P to soil alu-minium (Al) (Richardson, 1985). N and BOD7
can be effectively treated in wetlands since theyhave a significant atmospheric flux (i.e. nitrifica-tion–denitrification and oxidation) (Johnston,1991; White et al., 2000) while P treatment will
depend on long-term retention in sediments andin organic and inorganic inactive pools. In surfaceflow wetland treatment without chemical P pre-treatment, retention of P will be the most criticalprocess (Kadlec and Knight, 1996). No majorsubsurface flow was assumed to occur but some Pwill become adsorbed to soil Al and to someextent to iron (Fe) due to the movement ofwastewater and due to the sediment fauna in theupper soil layer.
To make a good quality comparison of thedifferent treatment systems we chose to use theCW in Oxelosund, mentioned above, as a modelto calculate the load of raw wastewater treated ina hypothetical NW of the same size (22 ha). TheP adsorption capacity of a wetland is correlated

Erratum 103
Fig. 3. Systems diagram of wastewater (ww) treatment in a natural wetland (NW). N − nitrogen; P − phosphorus; OM − organicmatter; MO − microorganisms
to its content of extractable amorphous Al(Richardson, 1985). In terrestrial soils the riskof P leaching has been correlated to the concen-tration of Fe and Al suggesting that the risk ofP leaching increases when the P concentrationto Fe and Al concentration exceeds 30% (Look-man et al., 1995). There is, however, a problemwith using Fe for P retention capacity in wet-lands due to increased solubility of P adsorbedto Fe hydrous oxides when redox potential fluc-tuates. We assumed that the P concentration(mmol kg−1 soil) to (a) Al concentration (mmolkg−1 soil) in the upper 10 cm soil profile or to(b) the mean concentration of both Fe and Alcould reach 30% without risk of leaching (Look-man et al., 1995). Data on extractable amor-phous Fe and Al content in a Swedish clay soilunder similar climatic conditions to Oxelosundwas used (O� born, 1994). We also set the restric-tion that only 50% of the upper 10 cm soilwould actually come in contact with the wastew-ater. This resulted in a P retention capacity ofthe wetland between 1.5 ([Al] only) and 2.5 g P
m−2 year−1 (0.5× [Fe+Al]) with a life lengthof 20 years. We assumed that Fe would actuallyretain some P even in a long-term perspectiveand estimated the retention capacity, due tomineral adsorption, to 2.0 g P m−2 year−1. Tothis was added 0.5 g m−2 year−1 retained inpeat accumulation (Richardson and Craft, 1993).With a total retention capacity of 2.5 g m−2
year−1, 759 p.e. could be connected. Theamount is in accordance with P retention capac-ities on a wide range of surface flow wetlands(Richardson, 1985; Kadlec and Knight, 1996).In order to test the sensitivity of the analysis tothe estimated P retention capacity, an analysiswas conducted for a retention capacity of 1.0 gP m−2 year−1 with 302 p.e. connected. Thedriving forces and functions of the NW are seenin Fig. 3.
The wastewater was pumped intermittently tothe parallel pond systems after pre-sedimenta-tion, for further transport to the common finaldenitrification pond. Inflow and estimated reten-

Erratum104
tion values for N, P and BOD7 as well as theturnover time for the wastewater are given inTable 3.
2.4. System boundaries and sources of data
The analysis of the treatment systems com-prised the wastewater from its entry into theWWTP and TP+CW to the return of the treatedwater and likely residues (e.g. sludge) to sur-rounding ecosystems; see Figs. 1 and 2. The sys-tem boundary of the NW comprised the entryinto a sewer system leading to the NW to thereturn of the treated water and likely residues (e.g.sludge) to surrounding ecosystems; see Fig. 3.System boundaries are based on the treatmentfunction of the three systems.
The results of the WWTP emergy analysis byBjorklund et al., (2001) and the analysis of theTP+CW and NW from this study were used tocalculate resource use indices for the three treat-ment systems. The TP treatment data were mainlybased on environmental and economic account-ings from 1995, and on personal communicationswith staff at the wastewater treatment plants, seeAppendix B. Treatment efficiency for the CWsystem was based on mean figures of 1996–1997control programs of the Oxelosund CW since theefficiency of the wetland increased after its estab-lishment in 1994.
Lifetimes of buildings were estimated to 50years and of machinery and wetlands to 20 years.
The WWTP and TP+CW treatment systemswere adjusted to the same level of nitrogen reduc-tion (50%). Critical to the comparison of theresource use for treatment in the different systemswould otherwise be that the first kilogram ofreduction requires less resource use than the last.Kilogram reduction of BOD7 and P differedslightly (Table 3).
Purchased input data in the NW example werepartly taken from the CW case. Constructioncosts, i.e. cleaning, digging, leveling and planting,were omitted in the NW example. For mainte-nance, operational costs and planning administra-tion, costs were added according to the amount ofP treated in the NW, see Appendix C.
2.5. The emergy analysis
Emergy analysis is a quantitative analysis tech-nique that determines the amount of direct andindirect energy of one kind that has been used togenerate resources, services and products of dif-ferent quality. Solar emergy is measured in unitsof solar emjoules (sej) and is the product of thesolar transformity (from now on only referred toas emergy and transformity) and the availableenergy in the resource. The transformity is thesolar energy used to make one joule of a resource(Odum, 1996). The method has been comprehen-sively described by several authors (Odum, 1994;Brown and Herendeen, 1996; Brown and Mc-Clanahan, 1996; Odum, 1996).
Transformities from other studies have mainlybeen used, but when no appropriate data wereavailable, new values were calculated (Bjorklundet al., 2001). The context in which transformitiesfrom other analyses were calculated may havediffered from that of which they were used in ourstudy. In a few cases it was impossible to avoiddouble counting with regard to service in thetransformity. As far as we are able to predict, thisdoes not affect the conclusions of the study.
Corrections were made to avoid double count-ing of emergy when different flows originatedfrom the same source. As regards sun, wind andrain all originating from the annual emergy inputto earth, only rain, which gives the greatestemergy contribution, has been included in thetotal (Footnote 3, Appendices A, B and C).
To account for emergy in purchased goods,both the emergy input from the environment togenerate the raw material and the emergy in hu-man service to make the raw material useful in theeconomic system were calculated. Emergy in ser-vice was calculated from the average emergy flowper unit money flow for Sweden (Lagerberg et al.,1999).
2.6. Emergy use expressed as indirect and directland area
It is possible to convert resource use evaluatedin the currency of emergy to an area demand. Todo so we used the annual emergy input originat-
Erratum 105
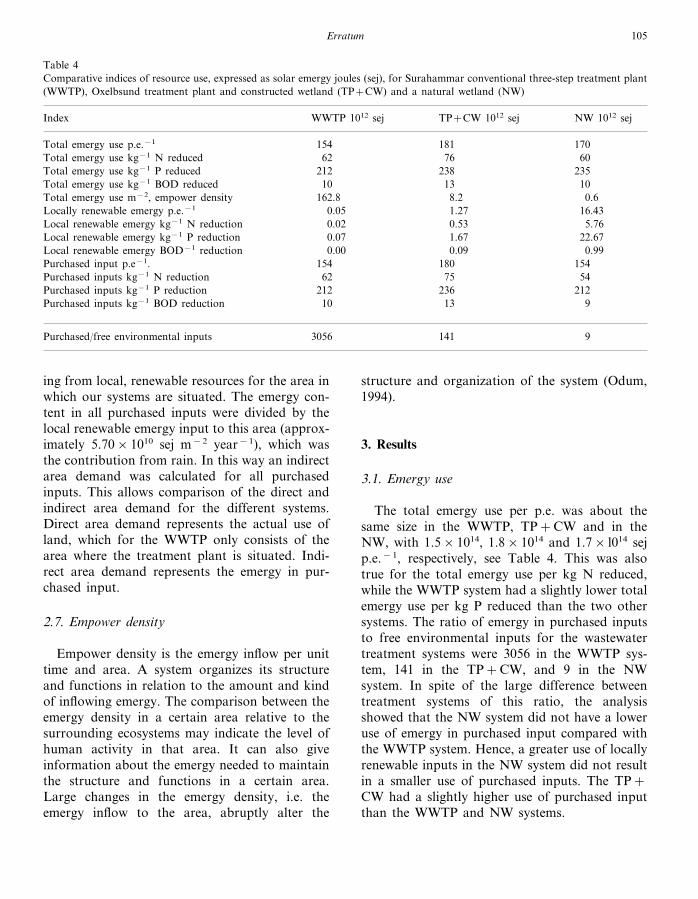
Table 4Comparative indices of resource use, expressed as solar emergy joules (sej), for Surahammar conventional three-step treatment plant(WWTP), Oxelbsund treatment plant and constructed wetland (TP+CW) and a natural wetland (NW)
TP+CW 1012 sej NW 1012 sejIndex WWTP 1012 sej
181Total emergy use p.e.−1 17015476Total emergy use kg−1 N reduced 6062
238212 235Total emergy use kg−1 P reduced13Total emergy use kg−1 BOD reduced 1010
8.2162.8 0.6Total emergy use m−2, empower density1.27Locally renewable emergy p.e.−1 16.430.050.530.02 5.76Local renewable emergy kg−1 N reduction1.67Local renewable emergy kg−1 P reduction 22.670.070.090.00 0.99Local renewable emergy BOD−1 reduction
180Purchased input p.e−1. 1541547562 54Purchased inputs kg−1 N reduction
Purchased inputs kg−1 P reduction 212 236 21213 910Purchased inputs kg−1 BOD reduction
141Purchased/free environmental inputs 93056
ing from local, renewable resources for the area inwhich our systems are situated. The emergy con-tent in all purchased inputs were divided by thelocal renewable emergy input to this area (approx-imately 5.70×10¹⁰ sej m−2 year−1), which wasthe contribution from rain. In this way an indirectarea demand was calculated for all purchasedinputs. This allows comparison of the direct andindirect area demand for the different systems.Direct area demand represents the actual use ofland, which for the WWTP only consists of thearea where the treatment plant is situated. Indi-rect area demand represents the emergy in pur-chased input.
2.7. Empower density
Empower density is the emergy inflow per unittime and area. A system organizes its structureand functions in relation to the amount and kindof inflowing emergy. The comparison between theemergy density in a certain area relative to thesurrounding ecosystems may indicate the level ofhuman activity in that area. It can also giveinformation about the emergy needed to maintainthe structure and functions in a certain area.Large changes in the emergy density, i.e. theemergy inflow to the area, abruptly alter the
structure and organization of the system (Odum,1994).
3. Results
3.1. Emergy use
The total emergy use per p.e. was about thesame size in the WWTP, TP+CW and in theNW, with 1.5×10¹⁴, 1.8×10¹⁴ and 1.7× l014 sejp.e.−1, respectively, see Table 4. This was alsotrue for the total emergy use per kg N reduced,while the WWTP system had a slightly lower totalemergy use per kg P reduced than the two othersystems. The ratio of emergy in purchased inputsto free environmental inputs for the wastewatertreatment systems were 3056 in the WWTP sys-tem, 141 in the TP+CW, and 9 in the NWsystem. In spite of the large difference betweentreatment systems of this ratio, the analysisshowed that the NW system did not have a loweruse of emergy in purchased input compared withthe WWTP system. Hence, a greater use of locallyrenewable inputs in the NW system did not resultin a smaller use of purchased inputs. The TP+CW had a slightly higher use of purchased inputthan the WWTP and NW systems.
Erratum106
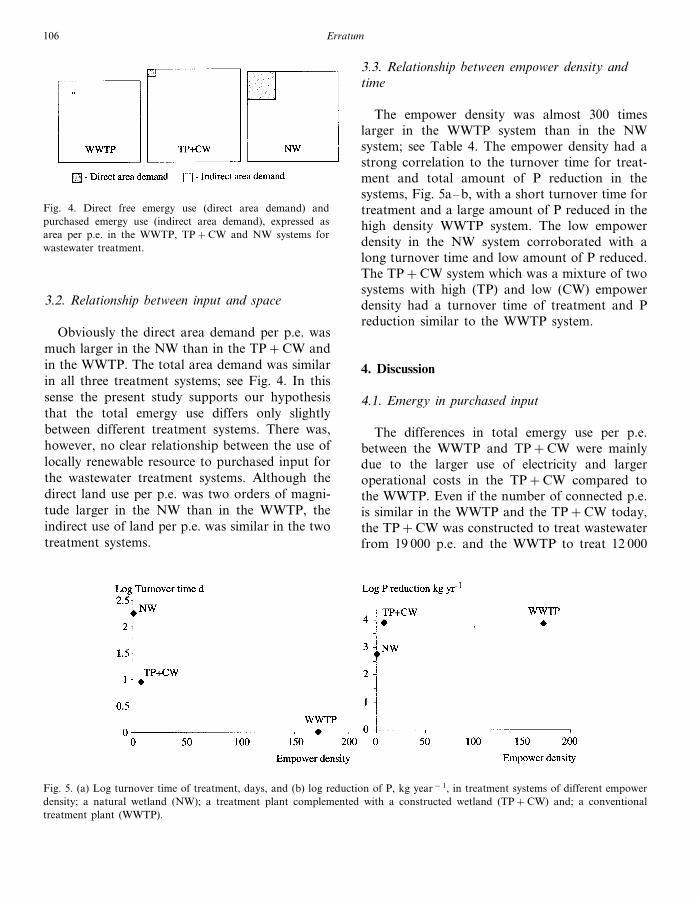
Fig. 4. Direct free emergy use (direct area demand) andpurchased emergy use (indirect area demand), expressed asarea per p.e. in the WWTP, TP+CW and NW systems forwastewater treatment.
3.3. Relationship between empower density andtime
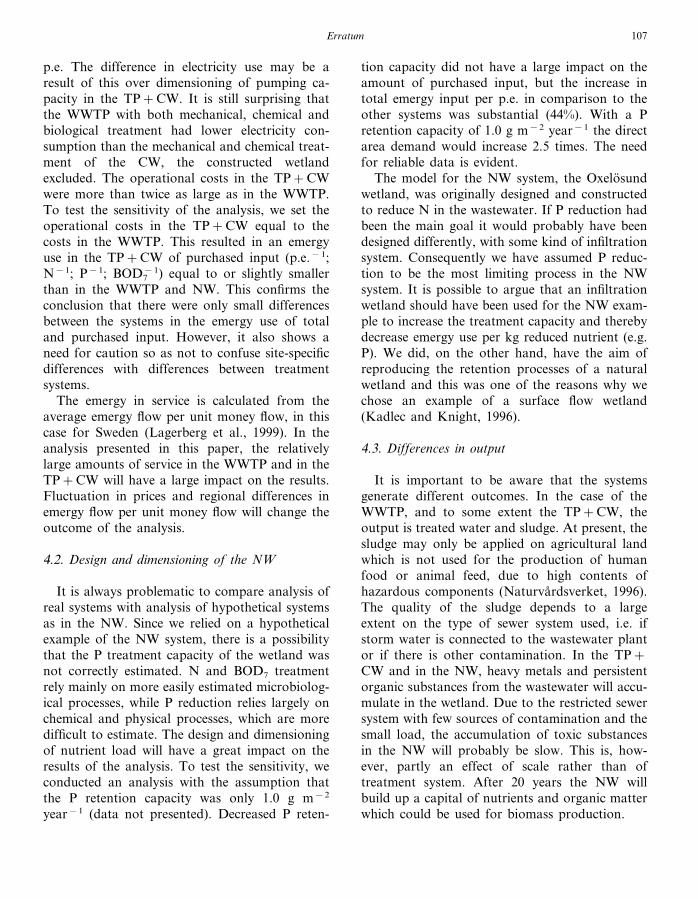
The empower density was almost 300 timeslarger in the WWTP system than in the NWsystem; see Table 4. The empower density had astrong correlation to the turnover time for treat-ment and total amount of P reduction in thesystems, Fig. 5a–b, with a short turnover time fortreatment and a large amount of P reduced in thehigh density WWTP system. The low empowerdensity in the NW system corroborated with along turnover time and low amount of P reduced.The TP+CW system which was a mixture of twosystems with high (TP) and low (CW) empowerdensity had a turnover time of treatment and Preduction similar to the WWTP system.
4. Discussion
4.1. Emergy in purchased input
The differences in total emergy use per p.e.between the WWTP and TP+CW were mainlydue to the larger use of electricity and largeroperational costs in the TP+CW compared tothe WWTP. Even if the number of connected p.e.is similar in the WWTP and the TP+CW today,the TP+CW was constructed to treat wastewaterfrom 19 000 p.e. and the WWTP to treat 12 000
3.2. Relationship between input and space
Obviously the direct area demand per p.e. wasmuch larger in the NW than in the TP+CW andin the WWTP. The total area demand was similarin all three treatment systems; see Fig. 4. In thissense the present study supports our hypothesisthat the total emergy use differs only slightlybetween different treatment systems. There was,however, no clear relationship between the use oflocally renewable resource to purchased input forthe wastewater treatment systems. Although thedirect land use per p.e. was two orders of magni-tude larger in the NW than in the WWTP, theindirect use of land per p.e. was similar in the twotreatment systems.
Fig. 5. (a) Log turnover time of treatment, days, and (b) log reduction of P, kg year−1, in treatment systems of different empowerdensity; a natural wetland (NW); a treatment plant complemented with a constructed wetland (TP+CW) and; a conventionaltreatment plant (WWTP).
Erratum 107
p.e. The difference in electricity use may be aresult of this over dimensioning of pumping ca-pacity in the TP+CW. It is still surprising thatthe WWTP with both mechanical, chemical andbiological treatment had lower electricity con-sumption than the mechanical and chemical treat-ment of the CW, the constructed wetlandexcluded. The operational costs in the TP+CWwere more than twice as large as in the WWTP.To test the sensitivity of the analysis, we set theoperational costs in the TP+CW equal to thecosts in the WWTP. This resulted in an emergyuse in the TP+CW of purchased input (p.e.−1;N−1; P−1; BOD7
−1) equal to or slightly smallerthan in the WWTP and NW. This confirms theconclusion that there were only small differencesbetween the systems in the emergy use of totaland purchased input. However, it also shows aneed for caution so as not to confuse site-specificdifferences with differences between treatmentsystems.
The emergy in service is calculated from theaverage emergy flow per unit money flow, in thiscase for Sweden (Lagerberg et al., 1999). In theanalysis presented in this paper, the relativelylarge amounts of service in the WWTP and in theTP+CW will have a large impact on the results.Fluctuation in prices and regional differences inemergy flow per unit money flow will change theoutcome of the analysis.
4.2. Design and dimensioning of the NW
It is always problematic to compare analysis ofreal systems with analysis of hypothetical systemsas in the NW. Since we relied on a hypotheticalexample of the NW system, there is a possibilitythat the P treatment capacity of the wetland wasnot correctly estimated. N and BOD7 treatmentrely mainly on more easily estimated microbiolog-ical processes, while P reduction relies largely onchemical and physical processes, which are moredifficult to estimate. The design and dimensioningof nutrient load will have a great impact on theresults of the analysis. To test the sensitivity, weconducted an analysis with the assumption thatthe P retention capacity was only 1.0 g m−2
year−1 (data not presented). Decreased P reten-
tion capacity did not have a large impact on theamount of purchased input, but the increase intotal emergy input per p.e. in comparison to theother systems was substantial (44%). With a Pretention capacity of 1.0 g m−2 year−1 the directarea demand would increase 2.5 times. The needfor reliable data is evident.
The model for the NW system, the Oxelosundwetland, was originally designed and constructedto reduce N in the wastewater. If P reduction hadbeen the main goal it would probably have beendesigned differently, with some kind of infiltrationsystem. Consequently we have assumed P reduc-tion to be the most limiting process in the NWsystem. It is possible to argue that an infiltrationwetland should have been used for the NW exam-ple to increase the treatment capacity and therebydecrease emergy use per kg reduced nutrient (e.g.P). We did, on the other hand, have the aim ofreproducing the retention processes of a naturalwetland and this was one of the reasons why wechose an example of a surface flow wetland(Kadlec and Knight, 1996).
4.3. Differences in output
It is important to be aware that the systemsgenerate different outcomes. In the case of theWWTP, and to some extent the TP+CW, theoutput is treated water and sludge. At present, thesludge may only be applied on agricultural landwhich is not used for the production of humanfood or animal feed, due to high contents ofhazardous components (Naturvardsverket, 1996).The quality of the sludge depends to a largeextent on the type of sewer system used, i.e. ifstorm water is connected to the wastewater plantor if there is other contamination. In the TP+CW and in the NW, heavy metals and persistentorganic substances from the wastewater will accu-mulate in the wetland. Due to the restricted sewersystem with few sources of contamination and thesmall load, the accumulation of toxic substancesin the NW will probably be slow. This is, how-ever, partly an effect of scale rather than oftreatment system. After 20 years the NW willbuild up a capital of nutrients and organic matterwhich could be used for biomass production.
Erratum108
In the TP+CW and the NW, increased biodiver-sity is essential as the biodiversity is a basis for manyecosystem services in the wetland and the surround-ing landscape (e.g. biotic regulation, hunting, aes-thetic values, pollination, etc.). The maincontribution of biodiversity from the CW is theincrease in habitat biodiversity in the total land-scape. In the Brannas peninsula in Oxelosund, withagricultural and forest areas as the former land use,very distinct environments were created by theestablishment of the CW. The peninsula as a wholehas been enriched by the CW biotope. Changes inbiodiversity are hard to predict in the NW receivinguntreated wastewater. On one hand, systems thatreceive large energy and nutrient inputs are com-monly considered as becoming low in biodiversity(Janssens et al., 1998). On the other hand, this isof course critical to the initial energy and nutrientlevel of the system, as an increase in the amount ofenergy and nutrient available can support newniches for new organisms (MacArthur and Wilson,1967; Odum, 1994; Qian, 1998). Furthermore,wetlands positively and negatively affect the atmo-spheric content of greenhouse gases as they seques-trate CO2 but emit methane (Laine et al., 1996;Milich, 1999).
4.4. Area demand
The direct and indirect land use based on emergyis similar to the concept of ‘ecological footprint’developed by Rees and Wackernagel (Rees andWackernagel, 1994; Fricker, 1998; Wackernagel etal., 1999) in that it relates resource use to an area.The difference is that when the land use is basedon emergy, resources that are not directly tied toan area demand can be included and consistentlyconverted to the amount of solar energy needed togenerate them. This means that an area demandbased on emergy use will give a more far-reachingcomparison of the actual area needed for differentactivities.
Although we have chosen treatment systems,which are the opposite of each other in terms of landversus purchased input use, there was no largedifference in purchased input use per p.e. betweenthe WWTP and the NW; see Table 4. In the NWsystem we increase the land area and rely on
ecosystem services and renewable emergy input forwastewater treatment. A secure and highly reliablewastewater treatment system including health as-pects still require a high degree of isolation of thewastewater from the population. Therefore, theemergy in purchased inputs for transportation ofthe wastewater will be maintained at a high level.As a result of this, the substitutability betweenpurchased inputs and ecosystem services is lost. Ifsubstitution of purchased inputs for renewableinputs are to be obtained, there might be no roomfor expenditures such as electricity use in pumpingor for pipe and pump materials when treatment isbased on processes occurring in natural wetlands.Purchased inputs could be exchanged for ecosystemservices only if these services also guaranteed thetransport of our waste.
In natural ecosystems, recycling of waste iscarried out with small emergy costs but over longperiods of time, with low and uneven concentrationsof nutrient and less extreme non-equilibrium states.In human systems we demand high and non-fluctu-ating efficiency in treatment. Under those circum-stances wastewater treatment in NW systems wouldonly be possible in decentralized systems with verylow population densities.
4.5. Empower density and time demand
The empower density in the WWTP is ex-tremely high (Fig. 5). Compared with the em-power density of for example Taiwan (60 sej m−2
year−1 (Huang, 1998)) the WWTP empower den-sity is nearly 30 times larger. This is what could beexpected in a highly technological system. Theempower density in the NW, al contrary, is com-mensurate with an average empower density ofthe Swedish agricultural landscape (Johansson etal., 2000). Still the NW empower density is about10 times larger than the average empower densityin the surrounding ecosystem which we estimatedto about 0.61sej m−2 year−1. If ecological engi-neered systems are to be ecologically sustainableand self-maintaining they should be mainly drivenby local renewable resources with a low degree ofhuman control (Mitsch, 1998), resulting in an
1 Calculation based on emergy in rain.
Erratum 109
empower density commensurate with surroundingecosystems.
The relations between turnover time and reduc-tion capacity in wastewater treatment and em-power density of the systems show importantdifferences between the systems. In the WWTPwith high empower density the incoming wastewa-ter, concentrated from a large number of p.e. istreated in a small area in a short time. The degreeof human control is high. In the NW system witha low empower density and a small number of p.e.connected, the time and area demands are manytimes larger than in the WWTP.
4.6. The choice of method
A major advantage with emergy analysis is thepossibility to measure resource use of ecosystems.It has to be acknowledged, however, that thecomplexity of ecosystems, will always make calcu-lations of transformities difficult and uncertain.This will affect the reliability of conclusions athigh levels of detail.
The emergy analysis is developed out of theo-ries in ecosystem ecology (Odum, 1994). Some ofthese theories are hypothesis that are new andcontroversial, e.g. the maximum empower princi-ple. Only extensive research involving emergyanalysis and system principles will verify the solid-ity of this approach. The circumstance thatemergy analysis relies on a scientific basis which isnot fully developed and which in some parts arenot consistent with the present dominating scien-tific paradigm, complicates the communication ofresults of the analysis.
In the future, it would be useful to continue thepresent study by assessing the environmental im-pact of the resource use at different scales. Thatmight be considered by complementing theemergy analysis with an LCA or including anemergy end-use assessment proposed by Ulgiati etal. (1995).
Eventually this study may, to further illuminatedifferences in output, be complemented with an
assessment of the exergy in the different treatmentsystems. The ratio of exergy to emergy in eachsystem would relate the level of organization tothe resource use in respective system. A high ratioindicates a high efficiency of the system. Bas-tianoni and Marchettini (1997) have done suchcalculations for different kinds of ponds receivingwastewater. Their results indicate efficiency andaspects of quality in outputs of the differentponds. Ayres (1998) also argues that chemicalexergy may predict some aspect of potential harmto the environment of a substance, while Genoni(1997), Genoni and Montague (1995) have pro-posed that transformities and emergy analysismay do the same. However, we argue that thiswas not an issue of this study.
5. Conclusions
The total use of emergy per p.e. and kg P wassimilar in all three treatment systems studied,strengthening our hypothesis of unchanged totalemergy use in treatment systems of different en-ergy to land use. On the other hand, we did notfind any trade-off in emergy between the use oflocally renewable resources to purchased inputs.An increased use of locally renewable resourcesdid not result in a decrease in purchased input interms of emergy per p.e.
Acknowledgements
We would like to thank Inger Hagermark, PeterRidderstolpe and Hans Wallin at Water RevivalSystems, WRS, for all the data and informationon the Oxelosund treatment plant and constructedwetland so readily given to us. Special thanks toInger Hagermark for the time and interest she hastaken in our work. We would also like to thankthe referees, for valuable comments on earlierversions of this paper.

Erratum110
Appendix A. Emergy analysis of conventional Swedish wastewater treatment complemented with advancedtertiary treatment to reduce nitrogen discharge (50%) (WWTP)�
Solar trans- Solar emergyNote Item Raw unit year−1
sej year−1,formity sej1015unit−1
Free en�ironmental inputs1.00 E+00 0.01 Sun l.81 E+l0 J
4.47 E+10 J 1.50 E+032 Wind 0.12.69 E+10 J 0.51.82 E+04Rain3
0.5Total emergy in free environmental resourcesRaw material in purchased inputs
2.51 E+12 J 1.19 E+054 Electricityi) 298.31.02 E+11 J 6.60 E+04 67.6Oil5
2.65 E+09 38.56 Buildings; sheet-iron, beams, reinf. 1.45 E+07 g0.61.84 E+093.25 E+05 gInsulating material7
7.34 E+08 61.68 Concretei) 8.40 E+07 g2.52 E+09 4.29 Bricks 1.67 E+06 g
7.63 E+06 g 7.34 E+0810 Pipes; concrete 5.64.38 E+05 g 1.22.65 E+09Iron121.25 E+05 g 6.80 E+1013 8.5Copper cables
4.74 E+08 6.514 Hard made surface 1.38 E+07 g2.00 E+04 g 5.87 E+0915 Plastic in scrapers 0.11.14 E+06 g 4.10 E+09 4.7Machineryi)162.40 E+07 g 2.65 E+0917 Chemicals 63.6
15.72.65 E+095.92 E+06 gMaintenance iron/sheet-iron182.07 E+07 g 4.74 E+0820 Asphalt 9.89.57 E+05 SEK 2.15 E+1123 Service in depreciation of buildingsi) 205.8
2.15 E+112.38 E+05 SEK 51.2Service in maintenancei)24316.12.15 E+1126 Operation costsi) 1.47 E+06 SEK289.02.15 E+111.34 E+06 SEKInterestsi)27
1498.9Total emergy in puchased goods and service1500.0Total emergy use for WW treatment
�Pipesystem has been excluded from original analysis.i)Complementation with advanced tertiary treatment.
3.38 E+09 J l.19 E+05A 0.4Additional electricity for pumping29.92.65+091.13 E+07 gIron in additional concrete, N treatmentB12.07.34 E+08C Additional concrete for N treatment 1.64 E+07 g
0.12.15 E+11D Service in additional electricity use 4.70 E+02 SEK

Erratum 111
Appendix B. Emergy analysis of conventional mechanical and chemical wastewater treatment andbiological treatment in a constructed wetland (TP+CW)
Raw unit year−1 Solar emergySolar transfor-Note Referencesi)Itemmity sej unit−1 sej year−1,1015
Free en�ironmental resources0.5Odum (1996)l.00 E+004.60 E+14 J1 Sun
l.50 E+03 Odum (1996)2 Wind 3.00 E+12 J 4.51.82 E+04 Odum (1996)3 Water 6.85 E+11 J 12.5
ii)2.11 E+03 0.01.34 E+09 J4 Collected seedlings1.06 E+04 iii)5 Collected seed 0.06.09 E+07 J
Odum (1996) 0.16 Loss of top soil 1.70 E+09 J 7.40 E+0412.6Total emergy in free
environmental re-sources
Purchased goods and ser�icesBjorklund et al., (2001) 471.27 Electricty 3.96 E+12 J 1.19 E+05
3.2Odum (1996)6.60 E+048 4.78 E+10 JOil in transport ofsludge
7.34 E+08 Bjorklund et al. (2001)9 Concrete 86.61.18 E+08 g2.65 E+09 Buranakarn (1998)10 Iron 1.81 E+05 g 0.5
4.5Bjorklund et al. (2001)2.52 E+091.78 E+06 g11 Bricks4.74 E+08 Bjorklund et al. (2001)12 Hard made surface 5.80 E+06 g 2.7
Bjorklund et al. (2001) 0.113 Insulation 7.13 E+04 g 1.84 E+096.80 E+10 Buranakarn (1998)14 Copper 1.25 E+04 g 0.95.87 E+09 Odum (1996) 0.91.47 E+05 g15 Plastic in pipes
4.00 E+04 g 4.10 E+09 Brown et al. (1995) 0.316 Machinery1.50 E+07 Odum, (1996) 1.917 Chemical precipitate; 1.29 E+08 g
bauxite1.19 E+05 Bjorklund et al. (2001)Electricity 7.26.03 E+10 g
1.9l.19 E+05 Bjorklund et al. (2001)1.57 E+10 J18 Polymer; electricityOdum (1996) 0.8Gas 1.70 E+10 J 4.80 E+04
0.3Odum, (1996)6.60 E+044.09 E+09 JOil87.54.07 E+05 SEK 2.15 E+11 Lagerberg et al. (1999)19 Service in depr. of
buildings121.9Lagerberg et al. (1999)2.15E+115.67 E+05 SEK20 Service in maintenance6.5Lagerberg et al. (1999)21 Price of land 3.00 E+04 SEK 2.15 E+11872.9Lagerberg et al. (1999)2.15 E+114.06 E+06 SEK22 Operation costs
Lagerberg et al. (1999) 114.023 Interests 5.30 E+05 SEK 2.15 E+111785.5Total emergy in purchased goods and services
Total emergy input 1798.1
i)References to transformities.ii)Transformity see footnote 4.iii)Transformity see footnote 5.

Erratum112
Footnotes to Appendix B
1. Sunlight Mean daily global radiation (Eriksson, 1981) (insolation corrected forsun hours or amount of clouds) in Stockholm, measured values. TheCW is divided into vegetated and non-vegetated area. 40% of the finalcommon pond is vegetated and 65% of other ponds are vegetated (I.Hagermark, WRS personal communication, 1998) resulting in 130 000m2 vegetated and 90 000 m2 non-vegetated area. Albedo is set to 0.12in vegetated areas and to 0.20 in open water areas, according toEriksson (1981). (74 499) (4.1868 J cal−1) (1 E+4 cm2 m−2) (130 000m2)+(67 726) (4.1868 J cal−1) (1 E+4 cm2 m−2) (90 000 m2))=4.60E+14 J year−1
Mean monthly wind values from Stockholm and Norrkoping. For2. Wind energydivision in vegetated and open water areas, see note 1. Equations usedfor calculations of energy in wind as in Bjorklund et al. (2001) (Oke,1978). (1.05 E+07 J m−2)(130 000 m2)+(1.83 E+07 J m2)(90 000m2)=3.0 E+12 J year
3. Chemical potential energy Water used in the system defined as evapotranspired water. A mix ofNykoping maximum evapotranspiration values and values from overallin water used in the systemnational Swedish evapotranspiration was used, adding up to 630 mm(Eriksson, 1981). Chemical potential energy in used water: (annualevapotranspiration) (CW area) (water density) (Gibbs free energy inrain water (Odum, 1996). (0.63 m) (220 000 m2) (1 E+6 g m−3) (4.94J g−1)=6.85E+11 J year−1
Seedlings, 860 specimen. Estimated weight of seedlings: (860 specimen)4. Collected seedlings(0.250 kg specimen−1)=215 kg. Estimated weight of root felt: (10m3)(0.1 Mg m3) (Leyshon, 1991)=1000 kg. Total amount of organicmatter:1215 kg. Heat content of grass: 4.7 KWh kg−1 dm (Axenbomet al., 1992). Energy in collected seeds: (1215 kg) (4.7 kWh−1 kg−1)(3.6 E+6 J kWh−1)=2.06E+10 J. Energy year−1: (2.06E+10 J)/(20year life length of CW)=1.03E+09 J. Transformity for emergy inseedlings: Net primary production above ground in wetlands: 1.6 kgm−2 (Andersson, 1976; Kvet and Husak, 1978). Emergy inflow m−2;5.70 E+10 sej (contribution from rain). (Emergy inflow m−2)/((NPPm−2) (Heat content of grass) (J kcal−1)). (5.70 E+10 sej)/((1.6 kgm−2) (4.7 kWh kg−1) (3.6E+6 J kWh−1))=2.11 E+03 sej J−1
Amount of seed collected: 72 kg (including panicles and ears). Heat5. Collected seedcontent of grass: 4.7 kWh kg−1 dm (Axenbom et al., 1992). Energy incollected seeds: (72 kg) (4.7 kWh kg−1) (3.6 E+6 J kWh−1)=1.22E+09 J. Energy year−1: (1.22 E+09 J)/(20 year life length ofCW)=6.09 E+07 J. Transformity for emergy in collected seed; Netprimary production above ground in wetlands; 1.6 kg m−2 (Andersson,1976; Kvet and Husak, 1978). Straw and root to seed ratio; 80:20(Cook and Evans, 1983; Evans, 1993). Emergy inflow m−2; 5.70 E+10sej (contribution from rain). (Emergy inflow m−2)/((NPP m−2) (0.20)(Heat content of grass) (J kcal−1)). (5.70 E+10 sej)/((1.6 kg m−2)(0.2)(4.7 kWh kg−1) (3.6 E+6 J kWh−1))=1.06E+04 sej J−1

Erratum 113
6. Loss of topsoil Loss of old sea bottom (considered as organic matter) in neighboringarea caused by extraction of soil with sedge (Carex riparia Curtis)vegetation. Amount=65 m3, bulk density (well decomposed organicsoil (Brady, 1974)=0.25 Mg m−3. Total amount of soil organic matter(SOM): (65 m3) (0.25 Mg m−3) (1E+06 g Mg−1)=1.62+07 g.(amount of SOM) (kcal g−1 dry SOM (Brady, 1974)) (Jkcal−1)/(estimated generation time). (1.62+07 g)(5 kcal g−1) (4186 Jkcal−1)/(200 year)=1.70+09 JThe electricity use in TP is 900 MWh year−1 and 200 MWh to pump7. Electricitythe wastewater to the CW (which is equivalent to the electricity useused to pump the ww from the plant to the recipient) (Hagermark etal., 1998). Oxelosund TP: 900 MWh×3.6E+9 J MWh−1=3.24 E+12J. Pumping to CW 200 MWh×3.6 E+9 JMWh−1=7.20 E+11 J.Total electricity use: (3.24 E+12 J)+(7.20 E+11 J)=3.96 E+12 J
8. Oil in transport of sludge Amount of transported sludge: 308 ton of 24% dm (1283 m3). Thesludge is transported to the landfill of Bjorshult for incineration, 7 kmaway from the TP. Mean distance return is approx. 14 km, maximumload is 10 m3. Number of trips: 1283 m3/10 m3=129 trips. Km: l29trips×14 km=1806 km. Fuel consumption: light work, tractor�100hk, 45% of max. pulling capacity (Grant, 1989): 71 h−1. Mean speed:10 km h−1. Total fuel consumption: (1806 km/(10 kmh−1)×71h−1=1264 1 diesel. Density of diesel: 37.8 MJ dm−3
(Mortstedt and Hellsten, 1994)=3.78 E+07×1264=4.78 E+10 J9. Concrete (m3 concrete at TP)(density) (estimated life length). (1.04 E+03 m3)
(mechanical+chemical (2.26 E+06 gm−3)/(50 year)=4.70 E+07 g. Maintenance: 3% of (totalamount of concrete). 3%(l.04 E+03 m3) (2.26 E+06 g m−3)=7.05treatment)E+07 g. Total amount of concrete in buildings and pipes (yearlyamount of concrete)+(maintenance). (4.70 E+07 g)+(7.05 E+07g)=1.18 E+08 g((total wall area) (iron density)+(total roof area) (iron density))/5010. Iron sheet in buildingsyear ((4.30 E+02 m2) (6.10 E+03 g m−2)+(6.65 E+02 m2) (9.70E+03 g m−2))/50 year=1.81 E+05 g(wall area) (wall thickness) (brick density)/(estimated life length). (5.8711. Bricks in buildingsE+02 m2) (0.12 m) (l.26 E+06 g m−3)/(50 year)= l.78 E+06 gAsphalt approximately: 2900 m2. (paved area) (weight m−2)/(estimated12. Hard madelife length). (2900 m2) (1.00 E+05 g m−2)/(50 year)=5.80 E+06 g
13. Insulation in buildings (wall area) (thickness) (density)/(estimated life length). (2.91 E+02 m2)(3.5 E−01 m) (3.5 E+04 g m−3)/(50 year)=7.13 E+04 g
14. Copper sheet in digester (total roof area) (sheet thickness) (copper density)/(estimated liferoof 70 m2 length). (70 m2) (1.00 E−03 m) (8.96 E+06 g m−3)/(50 year)= l.25
E+04 gA plastic pipe (Wittgren et al., 1994) transports the treated wastewater15. Plastic in pipesto the CW. (length of pipe system to CW) (weight of plastic pipeline)/(life length). (2100 m)(3.5 E+03 g m−1)/(50 year)= l.47 E+05 g
16. Machinery 6 pumps at the treatment plant a 100 kg. 1 pump from plant to CW a200 kg. ((6) (100 kg)+(200 kg) (l000 g kg−1))/(20 year)=4.00 E+04 g

Erratum114
17. Chemical precipitation Used amount: 429 650 kg (H. Wallin, WRS, personal communication,1998). Electricity use in the process of mixing Bauxite and H25O4 is 39kWh ton−1 ALG (L. Wingren, Kemira AB, personal communication,1999). For each ton of AlSO4 produced, 300 kg of bauxite is converted(P. Andersson, Kemira AB, personal communication, 1999). Electricity:(429.6 ton)(39 kWh ton−1)(3.6 MJ kW h−1)=6.03 E+10 J. Bauxite:(429.6 E+08)/(1 E+06)(3.00 E+05 g)=1.29 E+08 gUsed amount: 1994 kg, (H. Wallin, WRS, personal communication,18. Polymer1998). Energy use per kg polymer: (Bengtsson et al., 1997). Electricity:(2.19 kWh)(3.6 E+06 J kW h−1)1994 kg=1.57 E+10 J year−1. Gas:(2.37 kWh)(3.6 E+06 J kWh−1)1994 kg=1.70 E+10 J year−1. Oil:(0.57 kWh) (3.6 E+06 J kWh−1)1994 kg=4.09 E+9 J year−1
19. Service in depreciation (H. Wallin, WRS, personal communication, 1998) CW: 8.53 E+04SEK. TP: 3.22 E+05 SEK=4.07 E+05 SEKof buildings(H. Wallin, WRS, personal communication, 1998): 5.41 E+04 SEK20. Service in maintenanceCW: TP: 5.13 E+05 SEK=5.67 E+05 SEK
21. Price of land Land rent CW: 3.00 E+04 SEK(H. Wallin, WRS, personal communication, 1998) CW: 2.15 E+0522. Operation costsSEK. TP: 3.85 E+06 SEK=4.06 E+06 SEKInterest TP: (rate) (rest value of TP). (10% interest rate) (2.8 E+0623. InterestSEK)=2.8 E+05 SEK. Real interest CW: (interest rate) (constructioncost/2) only half of the construction cost is included as a mean valueover time of the CW. (10%) (5.0 E+06/2)=2.5 E+05 SEK. Totalinterest: (2.8 E+05 SEK)+(2.5 E+05 SEK)=5.3 E+05 SEK
Appendix C. Emergy analysis of wastewater treatment in a natural wetland (NW)
Raw unit year−1 Solar trans-Notes Solar emergy sejItem Referencesi
year−1, 1015formity sejunit−1
Free en�ironmental resources4.60 E+141 l.00 E+00 Odum (1996) 0.51 Sun3.00 E+121 1.50 E+03Wind Odum (1996)2 4.56.85 E+11 J3 1.82 E+04Rain Odum (1996) 12.5EnvironmentalTotal emergy in free 12.5resources
Purchased goods and ser�ices1.68 E+11 J4 l.19 E+05Electricty Bjorklund et al. (2001) 20.01.70 E+05 g 5.87 E+08Plastic Odum (1996)5 1.0
6 Pumps 5.25 E+03 g 4.10 E+09 Buranakarn (1998) 0.03.66 E+04 SEK 2.15 E+11Service in depr. Lagerberg et al. (1999)7 7.9
buildingsService in mainte-8 5.07 E+04 SEK 2.15 E+11 Lagerberg et al. (1999) 10.9nance
3.00 E+04 SEK 2.15 E+11Price of land Lagerberg et al. (1999)9 6.5Operation costs10 2.02 E+05 SEK 2.15 E+11 Lagerberg et al. (1999) 43.4
1.26 E+05 SEK11 2.15 E+11Interest Lagerberg et al. (1999) 27.1116.8Total emergy in purchased goods and services129.2Total emergy input
iReferences to transformities

Erratum 115
Footnotes to Appendix C.
Mean daily global radiation (insolation corrected for sun hours or amount of1. Sunlightclouds) in Stockholm, measured values (Eriksson, 1981). Vegetated and openwater areas in NW based on vegetation cover in CW, Appendix B, note 1. TheNW has 130 000 m2 vegetated and 90 000 m2 non-vegetated area. Albedo is setto 0.12 in vegetated areas and to 0.20 in open water areas (Eriksson, 1981):(74 499 cal) (4.1868 J cal−1) (1 E+4 cm2 m−2) (130 000 m2)+(67 726 cal) (4.1868J cal−1) (1 E+4 cm2 m−2) (90 000 m2)=4.60 E+14 J year−1
2. Wind energy Mean monthly values from Stockholm and Norrkoping (Eriksson, 1977). Forvegetated and open water areas of NW, see Appendix B, note 1. Equations usedfor calculations of energy in wind as in Bjorklund et al. (2001). (Oke, 1978).(1.05 E+07 J m−2) (130 000 m2)+(1.83 E+07 J m−2) (90 000 m2)=3.0 E+12 Jyear−1
Water used in the system defined as evapotranspired water. Values in NW is3. Chemicalbased on estimated evapotranspiration in CW, see Appendix B, note 3, 630 mm.potential
energy in water Chemical potential energy in used water: (annual evapotranspiration) (wetlandused in the area) (water density) (Gibbs free energy in rain water) (Odum, 1996) (0.63 m)system (220 000 m2) (1 E+6 g m−3) (4.94 J g−1) (Gibbs free energy in rain
water)=6.85 E+11 J year−1
(A. Morin, ITT Flygt, personal communication, 1999). Pipe length: 2500 m4. Electricity forpumping (dimension 125 mm), (height increase approx 5 m) loss of pressure 18 m,
capacity 6.9 1 s−1 (7.4 kW (MF3127). (156 420 m3)/(24.84 m3 h−1)=6297 h(6297 h)(7.4 kW)=46 598 kWh. (46.6 MWh)(3.6 E+9 J MWh−1)=1.68 E+11 J
5. Plastic in pipes A plastic pipe (2500 m, 125 mm) transport the raw wastewater to the NW.and pump (length of pipe system to NW) (weight of plastic pipe line) (density=67.3 kgstations m−3)/(life length). (2500 m) (3.4 E+03 g m−1)(50 year)=1.70 E+05 g
One pump with 24.84 m3 h−1 capacity (1801 pe−1)(max factor of 2*2)=6.3 16. Machinery(pumps) s−1. (Weight of pump, 105 kg (A. Morin, ITT Flygt, personal communication,
1999)/(life length of pump). (1.05 E+05 g)/(20 year life length)=5.25 E+03 g7. Service in Based on expenditures for pipes in CW (Wittgren et al., 1994). Pipes: (1 400 000
SEK)/(2000 m)(2500) m=1 750 000 SEK. Pump+automatics (A. Morin, ITTdepreciation ofbuildings Flygt, personal communication, 1999): 32 250 SEK. (Expenditures for
pipes)/(estimated life length)+(Expenditures for pump)/(estimated life length).(1 750 000 SEK)/(50 year)+(32 250 SEK)/(20 year)=3.66E+04 SEK
8. Service in Based on service in maintenance per kg P treated in CW (H. Wallin, WRS,personal communication, 1999; I. Hagermark, WRS, personal communication,maintenance1998): (Cost per kg P in CW)(kg P treated in NW): (5.41 E+04 SEK)/(586 kgP)(550 kg P)=5.07 E+04 SEK
9. Price of land Based on land rent for CW: 30 000 SEK (Wittgren et al., 1994)=3.0 E+04 SEK10. Operation Based on operation cost per kg treated P in CW (H. Wallin, WRS, personal
costs communication, 1998): (Operation cost in CW kg−1 P treated in CW)(kg Ptreated in NW). (2.15 E+05 SEK)/(586 kg P)(550 kg P)=2.02 E+05 SEKInterest NW: ((interest rate) (construction cost/2) only half of the construction11. Interestcost is included as a mean value over time of the NW. Construction costs basedon capital cost for pipes and pump in CW (Wittgren et al., 1994). (10%) (Costfor larger pipes system and smaller pump in NW)+((Project administration costsper kg treated P in CW) (kg P treated in NW))/2). 10% (1.78 E+06 SEK)+(8.00E+05 SEK)/(586
Erratum116
References
Andersson, F.O., 1976. Primary production in a shallow waterlake with special reference to a reed swamp. Oikos 27,243–250.
Axenbom, A� ., Johansson, H., Johansson, V., Rosenqvist, H.,Sennblad, G., 1992. Biobransle fran jord och skog. Varder-ing i ett marknadspersperktiv. Swedish University of Agri-cultural Sciences, Uppsala.
Ayres, R.U. 1998. Wate exergy as a measure of potential harm.In: S. Ulgiati (Ed), Advances in Energy Studies. EnergyFlows in Ecology and Economy. Proceedings of the Interna-tional Workshop. Porto Venere, Italy, 26–30 May 1998,Musis, Rome, pp. 113–128.
Bastianoni, S., Marchettini, N., 1997. Emergy/exergy ratio as ameasure of the level of organization of systems. Ecol. Model.99, 33–40.
Bengtsson, M., Lundin, M., Molander, S., 1997. Life cycleassessment of wastewater systems, Case studies of Conven-tional treatment, Urine sorting and Liquid Composting onThree Municipalities. Technical Environmental Planning,Chalmers University of Technology, Goteborg, Sweden.
Bjorklund, J., Geber, U., Rydberg, T., 2001. Emergy analysisof municipal wastewater and the generation of electricityfrom digestion of sewage sludge. Resour. Conserv. Recycl.,31, 293–316.
Brady, N.C., 1974. The Nature and Properties of Soils. MacMi-lan, New York.
Brown, M.T., Herendeen, R.A., 1996. Embodied energy analy-sis and emergy analysis: a comparative view. Ecol. Econ. 19,219–235.
Brown, M.T., McClanahan, T.R., 1996. Emergy analysis per-spectives of Thailand and Mekong River dam proposals.Ecol. Model. 91, 105–130.
Brown, M.T., Odum, H.T., McGrane, G., Woithe, R.D., Lopez,S., Bastianoni, S., 1995. Emergy evaluation of energypolicies for Florida. Report to the Florida Energy OfficeCenter for Environmental Policy, Department of Environ-mental Engineering Sciences, University of Florida,Gainesville, Fl.
Buranakarn, V., 1998. Evaluation of recycling and reuse ofbuilding materials using the emergy analysis method. Disser-tation, University of Florida, Gainesville, FL.
Cook, M.G., Evans, L.T., 1983. Some physiological aspects ofthe domestication and improvement of rice (Oryza spp.).Field Crops Res. 6, 219–238.
Cooper, P.F., Findlater, 1990. Constructed Wetlands in WaterPollution Control. Pergamon Press, Oxford.
Costanza, R., d’Arge, R., de Groot, R., Farber, S., Grasso, M.,Hannon, B., Limburg, K., Naeem, S., O’Neill, R.V., Paru-elo, J., Raskin, R.G., Sutton, P., van der Belt, M., 1997. Thevalue of the world’s ecosystem services and natural capital.Nature 387, 253–260.
Crites, R.W., 1984. Land use of wastewater and sludge. Environ.Sci. Technol. 18, 141–147.
Dalemo, M., 1996. The Orware Simulation Model — AnaerobicDigestion and Sewage Plant Submodels. Swedish University
of Agricultural Sciences, Uppsala.Eriksson, B., 1977. The Daily and Annual Variation of Temper-
ature, Humidity and Wind Velocity at Some Places inSweden. SMHI, Norrkoping.
Eriksson, B., 1981. The ‘Potential’ Evapotranspiration in Swe-den. Swedish Meteorological and Hydrological Institute,Norrkoping.
Evans, L.T., 1993. Crop Evol. Adaption Yield. CambridgeUniversity Press, Cambridge.
Finnveden, G., O� stlund, P., 1997. Exergies of natural resourcesin life-cycle assessment and other applications. Energy 22,923–931.
Flanagan, N.E., Mitsch, J.W., 1997. Theoretical indices andemergy analysis for comparing function of created andnaturally occurring wetlands. In: J.W. Mitsch (Ed.), Olen-tangy River Wetland Research Park at The Ohio StateUniversity. Annual Report, 1996. The Ohio State Univer-sity, Columbus, OH.
Fricker, A., 1998. The ecological footprint of New Zealand asa step towards sustainability. Futures 30, 559–567.
Genoni, G.P., 1997. Towards a conceptual synthesis in ecotox-icology. Oikos 80, 96–106.
Genoni, G.P., Montague, C.L., 1995. Influence of the energyrelationship of trophic levels and of elements on bioaccumu-lations. Ecotoxicol. Environ. Safety 30, 203–218.
Grant, G. (Ed.), 1989. Databok For Driftsplanering. Uppsala,Sveriges lantbruksuniversitet.
Hellstrom, D., 1997. An exergy analysis for a wastewatertreatment plant-an estimation of the consumption of phys-ical resources. Water Environ. Res. 69, 44–51.
Huang, S.-L., 1998. Urban ecosystems, energetic hierarchies,and ecological economics of Taipei metropolis. J. Environ.Manage. 52, 39–51.
Hagermark, I., Andersson, J., Ridderstolpe, P., Wallin, H.,Wittgren, H.B., 1998. Ansbkan om tillstand enligt miljosky-ddslagen. WRS, Water Revival Systems, Oxelosund.
Janssens, F., Peeters, A., Tallowin, J.R.B., Bakker, J.P., Bekker,R.M., Fillat, F., Oomes, M.J.M., 1998. Relationship be-tween soil chemical factors and grassland diversity. PlantSoil 202, 69–78.
Johansson, S., Doherty, S.J., Rydberg, T., 2000. Swedishfoodshed analysis. Proceedings of The first Biennial EmergyAnalysis Research Conference — Energy Quality andTransformities, Gainesville, 2–4 September, 1999.
Johnston, C.A., 1991. Sediment and nutrient retention byfreshwater wetlands: effects on surface water quality. Crit.Rev. Environ. Control 21, 491–565.
Kadlec, R.H., Knight, R.L., 1996. Treatment Wetlands. CRCPress, Boca Raton, Florida.
Knight, R.L., 1995. Wetlands systems for wastewater manage-ment: implication. In: Hall, C.A.S. (Ed.), Maximum Power;The Ideas and Applications of H. T. Odum. University Pressof Colorado, Niwot, pp. 123–131.
Kvet, J., Husak, S., 1978. Primary data on biomass andproduction estimates in typical stand of fishpond littoralplant communities. In: Kvet, D.D.A.J. (Ed.), Pond LittoralEcosystems. Springer, Berlin, pp. 211–216.

Erratum 117
Lagerberg, C., Doherty, S., Nilsson, P.O., 1999. Evaluation ofthe resource efficiency and sustainability of the Swedisheconomy using emergy based indices. In: Lagerberg C.(Ed.), Emergy Analysis of the Resources Use in Green-house Crop Production and of the Resources Basis of theSwedish Economy. Dissertation Swedish University ofAgricultural Sciences, Alnarp.
Laine, J., Silvola, J., Tolonen, K., Alm, J., Nykanen, H.,Vasander, H., Sallantaus, T., Savolainen, I., Sinisalo, J.,Martikainen, P., 1996. Effect of water-level drawdown onglobal climatic warming: Northern peatlands. Ambio 25,179–184.
Leyshon, A.J., 1991. Effect of rate of nitrogen fertilizer on theabove- and below- ground biomass of irrigated bromegrassin southwest Saskatchewan. Can. J. Plant Sci. 71, 1057–1067.
Lookman, R., Vandeweert, N., Merckx, R., Vlassak, K., 1995.Geostatical assessment of the regional distribution of phos-phate sorption capacity parameters (Fe-ox and Al-ox) innorthern Belgium. Geoderma 66, 285–296.
Lundin, M., Molander, S., Morrsion, G.M., 1999. A set ofindicators for the assessment of temporal variations on thesustainability of sanitary systems. Wat. Sci. Tech. 39,235–242.
MacArthur, R.H., Wilson, O.E., 1967. The Theory of IslandBiogeography. Princeton University Press.
Milich, L., 1999. The role of methane in global warming:where might mitigation strategies be focused? Global Envi-ronmental Change — Human and Policy Dimensions 9,179–201.
Mitsch, J.W., 1998. Ecological engineering — the 7-year itch.Ecol. Eng. 10, 119–130.
Mortstedt, S.E., Hellsten, G., 1994. Data och diagram. Energi-och kemiska tabeller. Liber utbildning, Stockholm.
Naturvardsverket, 1996. Anvandning av avloppsslam i jord-bruket. Naturvardsverket, Lantbrukamas riksforbund,Svenska vatten- och avloppsverksforeningen, Stockholm.
Nelson, M., 1998. Limestone Wetland Mesocosm for TreatingSaline Domestic Wastewater in Coastal Yucatan, Mexico.Univeristy of Florida, Gainesville.
Nilsson, J., Bergstrom, S., 1995. Indicators for the assessmentof ecological and economic consequences of municipalpolicies for resource use. Ecol. Econ. 14, 175–184.
Odum, H.T., 1994. General and Ecological Systems. An Intro-duction to Systems Ecology. University Press of Colorado,Niwot.
Odum, H.T., 1996. Environmental Accounting. EMERGYand Environmental Decision Making. Wiley, New York.
Odum, H.T., Odum, E.C., King, R., 1987. Ecology and econ-omy: ‘Emergy’ Analysis and Public Policy in Texas. Lyn-don B. Johnson School of Public Affairs, The University ofTexas, Austin.
Oke, T.R., 1978. Boundary Layer Climates. Methuen & Co.Ltd, London.
Qian, H., 1998. Large-scale biogeographic patterns of vascularplant richness in North America: an analysis at the genericlevel. J. Biogeography 25, 829–836.
Reed, S.C., Middlebrooks, E.J., Crites, R.W., 1988. NaturalSystems for Waste Management and Treatment. McGraw-Hill, New York.
Rees, W.E., Wackernagel, M., 1994. Ecological footprints andappropriated carrying capacity: measuring the natural cap-ital requirements of the human economy. In: Jansson,A.-M., Hammer, M., Folke, C., Costanza, R. (Eds.), In-vesting in Natural Capital. Island Press, Washington, DC,pp. 362–390.
Richardson, C.J., 1985. Mechanisms controlling phosphorusretention capacity in freshwater wetlands. Science 228,1424–1426.
Richardson, C.J., Craft, C.B., 1993. Efficient phosphorus re-tention in wetlands. In: Moshiri, G.A. (Ed.), ConstructedWetlands for Water Quality Improvement. CRC Press,Boca Raton, pp. 271–282.
Ridderstolpe, P., 1995. Vatmark Oxelosund. Vaxtetableringoch preliminara resultat. Oxelosunds kommun, Oxelosund.
Szargut, J., 1998. Exergy analysis of thermal processes; ecolog-ical cost. In: S. Ulgiati (Ed), Advances in Energy Studies.Energy Flows in Ecology and Economy. Proceedings ofthe International Workshop. Porto Venere, Italy, 26–30May 1998, Musis, Rome, pp. 77–97.
Tillman, A.-M., Lundstrom, H., Svingby, M., 1996. Livscykel-analys av alternativa avloppssystem i Bergsjon och Ham-burgsund. Delrapport fran ECOGUIDE-projektet.Avdelningen for teknisk miljoplanering, ChalmersTekniska Hogskola, Goteborg.
Ulgiati, S., Brown, M.T., Bastianoni, S., Marchettini, N.,1995. Emergy-based indices and ratios to evaluate thesustainable use of resources. Ecol. Eng. 5, 519–531.
Wackernagel, M., Onisto, L., Bello, P., Linares, A.C., Falfan,I.S.L., Garcia, J.M., Guerrero, A.I.S., Guerrero, C.S.,1999. National natural capital accounting with the ecologi-cal footprint concept. Ecol. Econ. 29, 375–390.
White, J.S., Bayley, S.E., Curtis, P.J., 2000. Sediment storageof phosphorus in a northern prairie wetland receivingmunicipal and agro-industrial wastewater. Ecol. Eng. 14,127–138.
Wittgren, H.-B., 1994. Vatmarker som behandlingsmetod foravloppsvatten och dagvatten. Kunskapssyntes och utredn-ing om forskningsbehov, Naturvardsverket, Solna.
Wittgren, H.-B., Hasselgren, K., 1993. Naturliga system foravloppsrening och resursutnyttjande i tempererat klimat.Natural systems for wastewater treatment and resourcemanagement in temperate climate. VAV, Svenska vatten-och avloppsverksforeningen, Stockholm.
Wittgren, H.-B., Wallin, H., Ridderstolpe, P., Gunsell, C.,1994. Wetland Oxelosund. A full scale experiment withnitrogen removal in created wetlands. Vatten 50, 145–153.
O� born, I., 1994. Morphology, Chemistry, Mineralogy andFertility of Some Acid Sulfate Soils in Sweden. SwedishUniversity of Agricultural Sciences, Uppsala.
Ødegaard, H., 1995. An evaluation of cost efficiency andsustainability of different wastewater treatment processes.Vatten 51, 291–299.