Embed Size (px)
Citation preview

1
OSIPP Discussion Paper: DP-2014-E-001
The rise and fall of multinational enterprises in Vietnam:
survival analysis using census data during 2000-2011
March 14, 2014
Tien Manh Vu†
Ph.D Candidate, Osaka School of International Public Policy, Osaka University
Hiroyuki Yamada
Associate Professor, Osaka School of International Public Policy, Osaka University
Tsunehiro Otsuki
Professor, Osaka School of International Public Policy, Osaka University
[Key words] Foreign direct investment; Multinational enterprises; Survival; Ownership;
Government performance; Vietnam
[JEL Codes] L24, L25, O02, P27
[Abstract]
Using census data from 2000–2011, we examined the survival of multinational enterprises
(MNEs) located in Vietnam using Cox hazard models with time–variant covariates. Beside
enterprises’ characteristics and performance, we found that the firm characteristics,
structure of the ownership and nationalities of the foreign partners are associated with the
probability of exiting, which suggests that a joint–venture between a foreign partner and a
domestic non–state owned enterprise is more likely to exit than other types of MNEs. Also,
a firm with a greater capital share owned by foreign partners was found to survive longer.
Furthermore, time cost due to bureaucratic procedures and inspections, among indicators
of local government performance, was found to be associated with a greater probability of
MNEs exiting.
†Corresponding author: Tien Manh Vu.
Osaka School of International Public Policy, Osaka University,
1-31 Machikaneyama, Toyonaka, Osaka 560-0043 Japan.
Tel/Fax: +81-(0)6-6850-5656. E-mail: [email protected].
[Acknowledgments] The authors gratefully acknowledge financial support (grant numbered
22330077 and 25780163) from the Japan Society for the Promotion Science (JSPS) and Kikawada
Foundation.

2
1. Introduction
Since the first laws on foreign investment after doi moi in Vietnam were put into
force in 1997, multinational enterprises (MNEs) have become crucial stakeholders in the
Vietnamese economy. MNEs accounted for 11.52 percent of the employment in the
economy in 2000; the share increased rapidly to 22.84 percent in 2007 (GSO, 2013b).
Moreover, the amount of capital stock associated with foreign direct investment (FDI)
almost doubled from 580 billion to 1,108 billion Vietnamese dongs (GSO, 2013a1). Despite
this rapid growth in the FDI inflow in Vietnam, the census data also demonstrate a high
rate of exit of MNEs from the Vietnamese market, a finding that is consistent with Ha and
Kiyota (In press), which found a high turnover (approximately 35 percent for both entry
and exit rates in 2008) of manufacturing firms in the country including domestic firms.
This situation presents a challenge to the country’s outward-oriented growth strategy and
the continued success of MNEs in their business in Vietnam.
This indicates the need for detailed research on the behavior of MNEs in Vietnam
in terms of the performance in their survival in business as well as that in their entry. A
number of empirical studies have investigated firms’ turnover patterns using firm-level
data (see, for example, Griliches and Regev, 1995). Most of these studies focus on entry
and exit probabilities at a particular time point, but this short-run framework is not
necessarily suitable for capturing the complex nature of a firm’s survival (or exit) decisions.
Firms might take the past, present and future economic conditions into account in making
survival decisions. For example, firms might not exit immediately when they run a deficit;
they might stay in business if there are opportunities in the future (Dixit, 1989). Thus,
focusing on how long a firm survives, or in other words, the duration of its survival, may
be more suitable to account for the observed turnover patterns of firms. As discussed below
in detail, empirical studies on MNEs’ turnover focusing on duration of survival and its
determinants, especially using census data of emerging or developing countries, are
relatively scarce, however.
Previous studies on determinants of firm turnover patterns using firm-level data
have focused on a limited set of factors such as firm productivity, firm’s ownership
structures such as share of foreign capital, firm’s ownership type such as public/private
ownership, and other firm-specific characteristics such as employment size and firm age.
Also, the institutional and policy environment can be an important factor affecting FDI
flows and the effectiveness of FDI (see, for example, Globerman and Shapiro, 2002).
However, the limited availability of spatially disaggregated data on the institutional and
1 The amount of capital stock is converted to 2010 value using GDP deflator available at World Economic
Outlook Database (http://www.imf.org/external/pubs/ft/weo/2013/02/weodata/index.aspx) of International
Monetary Fund.

3
policy environment has constrained firm-level analysis incorporating those variables.
Accordingly, our paper focuses on the duration of survival of MNEs in Vietnam,
and investigates a wide range of its potential determinants while paying particular attention
to firm ownership structures, and the performance of local governments by combining the
firm-level data of Vietnam on MNEs for 12 consecutive years from 2000 to 2011 and the
annual survey on provincial competitiveness. The data period covers the period after the
first laws on foreign investment and the period before and after the country’s WTO
accession. Also, this firm-level dataset of MNEs is virtually a census dataset containing
nearly all MNEs that existed in Vietnam during the period, which allows us nearly
full-sample estimation. At the same time, this allows us to be free from any sample
selection problems and makes direct interpretation on the population of MNEs, hence, very
convincing policy discussion, possible. The use of spatially disaggregated and time-variant
indices for the performance of the local government allows us to examine the implications
of the institutional and policy environment, which we claim make an important
contribution. These indices include start–up costs, transparent business environment, and
time spent on bureaucratic procedures and inspections.
Also, the census dataset also allows us to examine the influence of ownership
structures in terms of the degree of foreign ownership and foreign partners’ nationality of
origin are expected to affect the behavior of firms from various aspects. The availability of
data on the capital share of foreign and domestic partners of joint ventures allows us to
analyze the influence of the degree of foreign ownership. Furthermore, the availability of
source country information of the foreign partners enables us to examine the potentially
differing impact of FDI by source. The ownership type, most importantly, public and
private ownership of the domestic partner, can also affect the foreign partner’s incentive
for investment and improved performance, and hence, firm turnover. We examined the
effect of the selected factors on the duration of survival of MNEs using Cox hazard models.
The Cox hazard models have the advantage of taking the time varying effect into account;
such time-varying factor includes the growth of total assets and (average) start-up costs.
This feature of the Cox hazard models allows us to incorporate the complex
path-dependent turnover decisions of firms, thereby allowing examination of the effect of
the determinants on the performance and behavior of the firms.
Our major findings are as follows: First, we found that joint–ventures of MNEs
formed with non–state owned enterprises are the most likely to exit. Second, the increment
of the capital share owned by foreign partners helps to prolong survival in joint–venture
enterprises. Third, we identified six nationalities whose MNEs are more likely to survive,
namely, Japan, Thailand, Hong Kong (China), Taiwan, Germany, and Singapore. Finally,
we show the local government performance, similar to MNEs’ performance, in association
with the survival of the firms.
4
The remainder of the paper is organized as follows. Section 2 reviews the related
literature. Section 3 introduces the data used, and Section 4 describes our empirical
methodology. Section 5 presents our findings. Section 6 reports the robustness check.
Section 7 discusses our results and presents our conclusions.
2. Related literature
Dixit’s (1989) provides a conceptual framework for a firm’s turnover decisions.
The firm enters if the product price that the firm faces is greater than the variable cost and
the interest charges on the entry cost. Similarly, the firm exits if the product price is less
than the variable cost minus the interest charges on the exit cost. Geroski’s (1995) survey
paper presents several stylized facts on firm turnover. It points out that entry and exit rates
are positively correlated because the entry of new firms typically occurs through the
displacement of old firms. It also points out that survival is more difficult than entry, and
that expected survival duration is a priority issue to be considered at the time of entry.
Industries where FDI is active are often considered as “footloose” as they are likely to be
sensitive to the wage rate. However, a wage increase does not necessarily lead to a
withdrawal of investment (Flamm, 1984). Dixit (1989) argues that the withdrawal
(shrinkage) of investment (employment) should consider the later return (expansion) when
opportunities arise.
Despite the importance of the issue, however, little attention has been given to the
influence of differing ownership structure on the performance of joint–ventures between
MNEs and domestic partners, especially in the case of state–owned firms in transition
economies. Nguyen and van Dijk (2012) indicated that, before 20002, state–owned
enterprises had been granted privileges in land acquisition by the government in Vietnam.
Previous studies have focused on various determinants of the firm’s turnover
patterns. Mata and Portugal (1994), McCloughan and Stone (1998), Audretsch et al. (1999),
and Holmes et al. (2010) are among those studies that demonstrated the importance of size
and age on firm turnover patterns. Mata and Portugal (1994) found one fifth of the
Portuguese manufacturing firms in 1983 exited during the first year after their
establishment. Also, they found that initial start-up size is positively correlated with the
survival of new entrants. Cabral and Mata (2003) indicated that the distribution of the size
of Portuguese firms was skewed upward, and that this upward skewness becomes more
prominent for firms of greater age. Geroski (1995) showed that firms in the US and Canada
may take up to ten years to reach the average necessary size after their entry.
Other important characteristics that are focused on in the literature include
2 In 2000, at the time the revised Enterprise Law became effective, state–owned enterprises owned more than
67.13 percent of total capital among all types of firms (GSO, 2013a).
5
technology and management level. McCloughan and Stone (1998) examined whether the
nationalities of source countries of FDI might have a distinct effect on the survival of
manufacturing MNEs in the UK. They found only a slight difference in the effect of FDI
among source countries of FDI (US, Japan, Germany, Sweden, Netherlands, and Canada)
possibly because those countries, due to their similarity in the stage of development, are
quite similar in managerial skills and technologies. In the case of Vietnam, however, the
effect of the nationalities of the source countries of FDI can be analyzed more
appropriately because Vietnam as an emerging economy is expected to attract investment
from countries in various stages of development.
The performance of the firm is also considered as a key determinant of firm
turnover patterns. The performance is measured in various ways including the level of the
firm’s productivity, the growth of the firm’s market share (employment expansion), the
firm’s capital stock and debt (ability to borrow), and its product derivation from existing
firms. A number of studies have examined the relationship between firm productivity and
turnover patterns (see, for example, Griliches and Regev, 1995; Pavcnik, 2002; and Ha and
Kiyota, in press).
Other studies focused on industry-, region-, or economy-level determinants of
firm turnover. Mata and Portugal (1994), using the data on the Portuguese manufacturing
sector, focused on industry-level factors such as the market share of the new entrants and
industry growth rate, and found that the probability of failure of new entrants decreases
with the industry-level growth rate. Geroski (1995) showed, however, that the differences
in entry rates between industries dissipate over time. Some studies focused on region- or
economy-level determinants such as the institutional and policy environment, and
macroeconomics factors. Investors in emerging and developing countries consider
government performance in their decision of entry (Svensson, 2003; Rand and Tarp, 2012).
This tendency appears even more prominent in emerging and developing countries than in
OECD countries due to the aim of protecting domestic industrial sectors (Tybout, 2000).
Nguyen and van Dijk (2012) found that corruption, as a measure of the (poor) performance
of local or national government, harms the growth of the private sector in Vietnam. Hansen
et al. (2009) found that tax exemptions during a firm’s start–up facilitate the growth of
Vietnamese firms. Moreover, Fisman et al. (2007) showed that the negative effect of
bribery on the growth of Ugandan firms is three times more than that of taxation.
Thus, previous empirical studies have taken only, at best, partial determinants into
account. Our study, instead, allows to examine the effect on the survival of a firm of factors
ranging from firm-level to industry- or region-level factors, or from economic to
institutional factors. The key determinants of interest include firm’s ownership structures,
ownership types, characteristics and performance, industrial features, and government
performance. To the best of our knowledge, research on the survival of MNEs using firm

6
level data is still limited as far as developing and emerging economies are concerned. Thus,
our study fills the gaps in the literature by taking advantage of a census dataset of MNEs
and provincial competitive index.
3. Data
We used two survey data in our estimations, the Vietnamese Enterprise Survey
(VES) 2000–2011 and Provincial Competitive Index (PCI) 2006–2011. The latter is
matched with the former based on the province names and codes.
3.1 VES 2000–2011
Since 2001, the General Statistics Office of Vietnam (GSO) has collected annually
information on economic activities of the preceding year of each business identity all over
the country. The survey is most commonly known as the Vietnamese Enterprise Survey.
The obtained data length is twelve consecutive years. Although the sampling methods are
different for each year for private firms, GSO has continued to collect a census of all active
multinational enterprises (MNEs).
MNEs are defined as having registered capital coming from overseas investors.
Thus MNEs can be a solely foreign–owned enterprise (FOE), a joint–venture between
overseas investors with a state–owned enterprise (𝐽𝑜𝑖𝑛𝑡 − 𝑣𝑒𝑛𝑡𝑢𝑟𝑒 𝑤𝑖𝑡ℎ 𝑆𝑂𝐸), or with
partners other than a state–owned enterprise (𝐽𝑜𝑖𝑛𝑡 − 𝑣𝑒𝑛𝑡𝑢𝑟𝑒 𝑤𝑖𝑡ℎ 𝑜𝑡ℎ𝑒𝑟 𝑡ℎ𝑎𝑛 𝑆𝑂𝐸).
VES contains two important questionnaires on MNEs. First, the questionnaires
ask general information about the MNEs including information about their business tax
code. We also have information about the firm’s performance in the year prior to the survey.
This information comes directly from the balance sheet of the firm. Following laws on the
usage of the statistics, we do not have information of the firms’ names. The first part (tax
code) is quite consistent and the same code is repeatedly used for a single firm over the
years. This allows us to create the necessary data set for the survival analysis. Second,
another part of the questionnaires specializes in collecting information on MNEs. We
obtained information about the capital share with countries and territories of origins.
However, VES only started to include this part in 2002.
We deployed multiple criteria to identify the appearance of MNEs during 2000–
2011. First, we used the tax code as key information to construct panel data of MNEs. A
unique tax code is provided to each MNE by the Provincial Department of Finance and
strictly follows the guidelines of the Ministry of Finance. We combined this useful
information with the provincial code as a primary identifier for MNEs. The combination is
unique all over the country and across years. However, we found that some MNEs are not
recorded with a tax code. These firms still appeared in subsequent years with the tax code.
7
We were able to identify this problem and recover the tax code of the missing year based
on information about the MNEs landline telephone number. We combined the last six
digits of the landline telephone and province code as a secondary identity because this
combination acts approximately as a unique telephone number in a country. Also, we
assumed that firms do not change their telephone number twice within three consecutive
years due to business cost3. However, to further increase the accuracy of matching, we
employed a third identifier from GSO. GSO includes in the data two variables to identify
each firm. These variables combined with the province code are totally unique within a
year. Thus, we only used the third identity to confirm the recovered cases but not if the first
and second identifiers both matched.
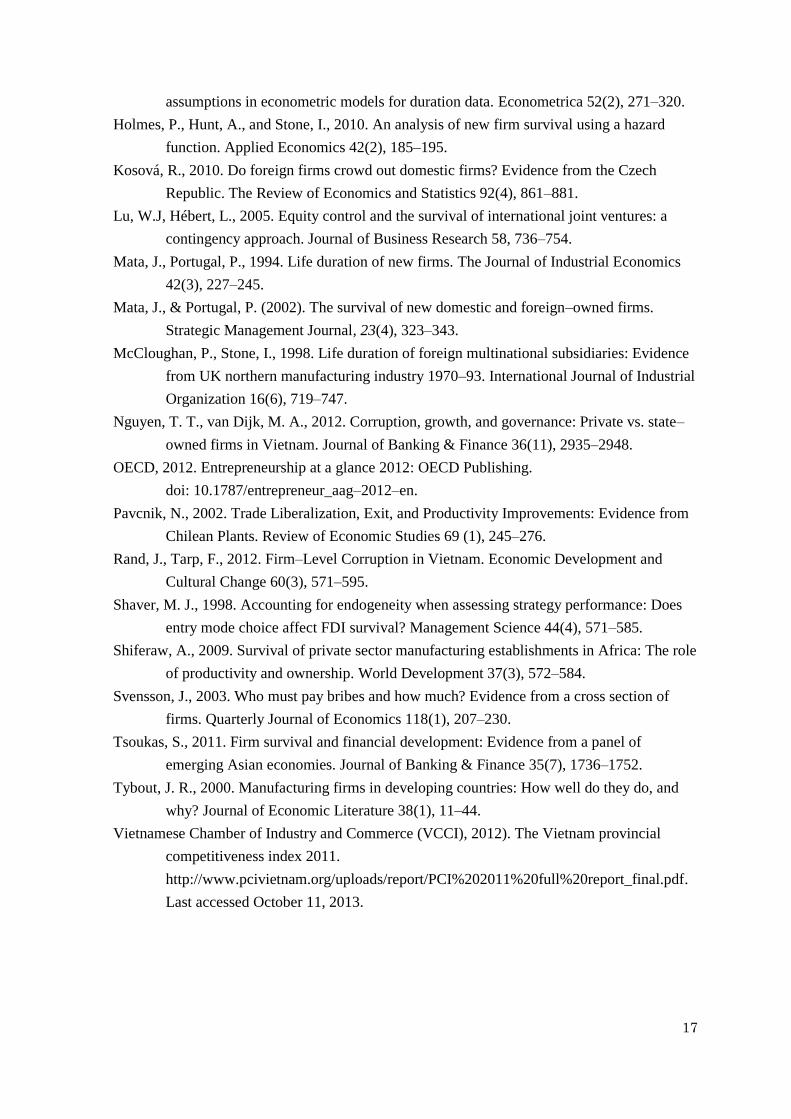
The difference between the number of MNEs in our sample and the population of
active MNEs was minor. We compared the number of identified MNEs having all the
necessary information for estimations with that in the official report of GSO. The
difference was less than four percent every year, except year 2000 (with 9.5 percent) as
shown in Table 1.
[INSERT TABLE 1]
Furthermore, the VES 2000–2011 has an advantage over other databases of firms
for examining survival. We obtained the exact time of exit of all MNEs since in–active
MNEs are not respondents of the survey. In addition, VES 2011 is a census survey
addressed to even inactive MNEs. Thus we were able to identify the exit of the firms in
2010 without waiting until VES 2012 was available.
Therefore, we were able to examine the survival of MNEs in Vietnam from 2000–
2011. The total number of MNEs during 2000–2011 (2006–2011) was 51,770 (36,891).
However, since newly established MNEs in 2011 perfectly survive, we excluded these
observations from our estimations. Thus, we actually used 49,858 (34,979) observations in
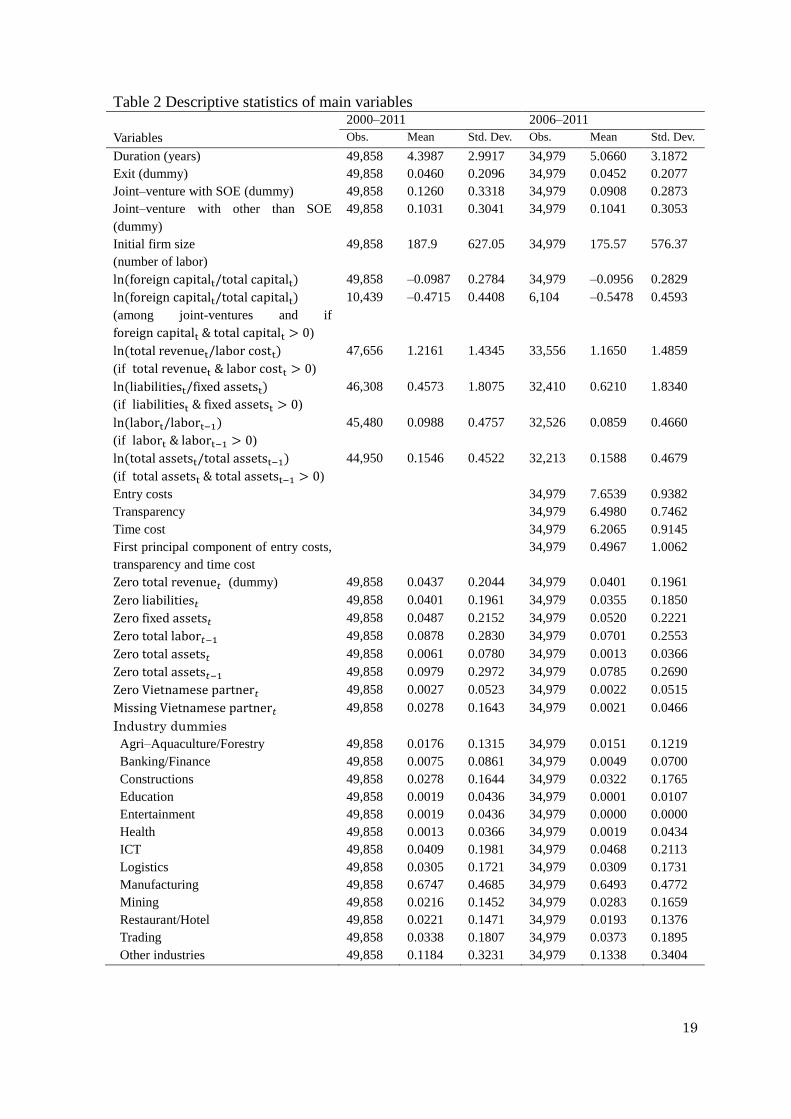
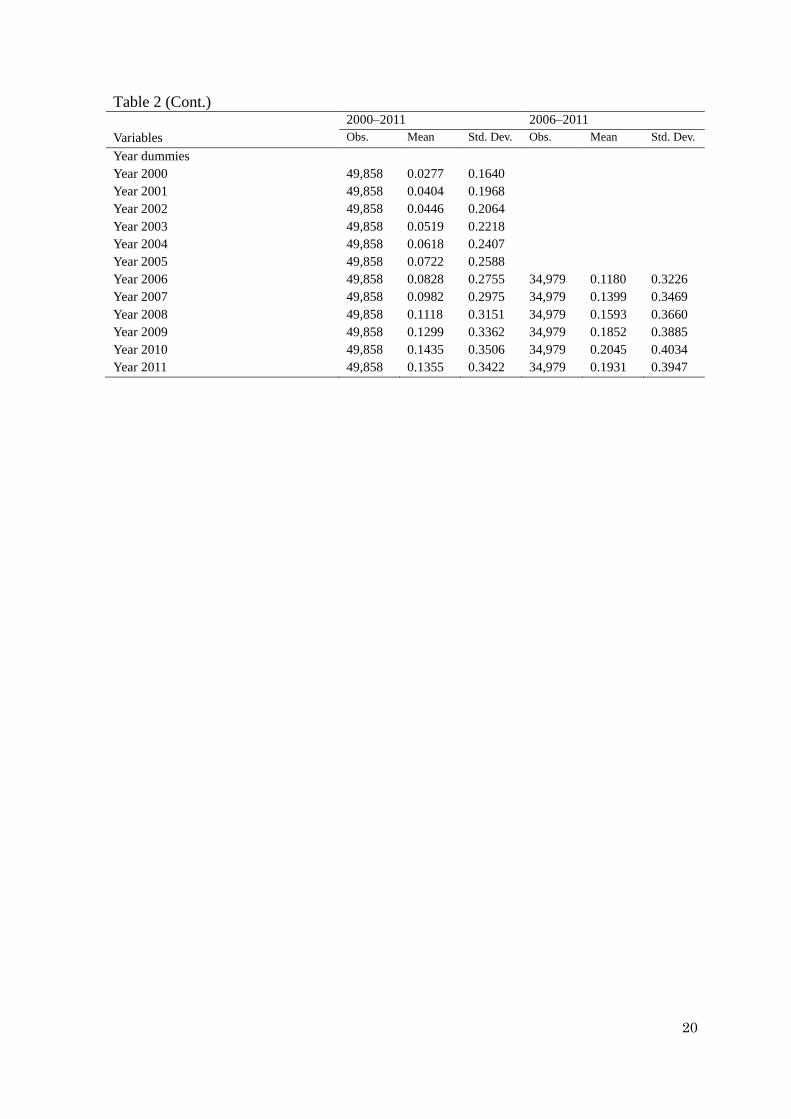
our estimations. Details are shown in Table 2 and the variables shown in the table are
discussed in the next section.
[INSERT TABLE 2]
3.2 PCI 2006–2011
PCI is an annual survey conducted by the Vietnamese Chamber of Commerce and
Industry (VCCI) with support from the U.S. Agency for International Development
(USAIDS). The survey first began in 2005 with 42 provinces but covered all provinces in
subsequent years. Firms (over 6,000 respondents per year) are randomly selected from a
list of registered private firms supplied by the National Tax Authority, stratified by
3 The cost includes not only reprinting contacts such as name card and brochures but also opportunity cost
due to their customers losing the firm’s contact information.
8
business age, sector, and legal form (page 11, VCCI, 2012) for a sample of country
representative. The indexes are built based on several questions. Each index has the same
scale 1–10 from 2005–2011. A higher index indicates a more competitive province.
The sub–indices repeated across 2006–2011 are (a) low entry costs for business
start–up, (b) easy access to land and security of business premises, (c) transparent business
environment and equitable business information, (d) minimal informal charges, (e) limited
time spent on bureaucratic procedures and inspections, and (f) proactive and creative
provincial leadership in solving problems for firms. We used (a), (c) and (e) in our
estimations4.
4. Empirical models and econometric specifications
4.1 Empirical models
We employed Cox hazard models with time–variant covariates and firm clustered
robust standard errors. For robustness check, we deployed a linear probability model with
firm clustered robust standard errors.
The study period was from 2000 to 2011. All MNEs were observed since they first
appeared in the study period. All MNEs were considered to have exited in the following
year if they did not appear in the next two consecutive years. MNEs found in 2011 were
(right) censored data because these firms might exit sometime after 2011.
We measured the duration of survival by the period from the time at which the
MNE was first observed to the time at which it was last seen within the data period
regardless of cohort selections. We followed the definition of the OECD (2013)5 on the
survival of employers. In our estimations, a surviving firm should have at least one
employee, report to GSO, keep the same tax code6 throughout its appearance in the study
period and not be inactive for two consecutive years7. We assumed that all MNEs
4 (b), (d) and (f) were overlapping and/or had a strong statistical correlation with other sub–indices. For
example, the correlations between (a) and (b), (b) and (d), (b) and (f) were 0.4394, 0.6690 and 0.5781,
respectively. Thus we excluded the three sub–indices, (b), (d) and (f). Another reason why we dropped these
three sub-indices is that after trying various empirical specifications, explained in the next section, which
includes various combinations of the sub-indices, only (a), (c), and (e) showed statistical significance. In
other words, (b), (d), and (f) were not statistically significant in all specifications.
5 There is no clear-cut definition for duration of survival, but the OECD’s (2013) definition is widely used.
The duration of survival of firms is defined as the time during which firms employ at least an employee, and
should not be inactive in two consecutive years. Active firms in just one year are also considered as survivors.
This excludes mergers and acquisitions. The survival rate is attached to the number of surviving firms of a
specific birth cohort. 6 This naturally excludes firms taken over by mergers and acquisitions since the tax code is required to
change. 7 We identified and omitted 169 firms (769 appearances) missing for more than two years, 99 of which first
appeared in 2000–2002. We were unable to verify whether they were inactive or missing due to data
collection.
9
established before 2000 were established in 2000. This assumption is not unreasonable
because the first laws of foreign investment after doi moi became effective in 1997 and,
from Table 1, there were 1,379 MNEs in year 2000 while the total number of MNEs was
approximately 51,770 for 2000–2011 with an average annual increment number of 871
newly established MNEs.
In the equations below, we denote the probability of exit of a firm as 𝐹(𝑡). The
survival function of a firm is the probability of a firm being observed in the time of study,
S(t) = 1 − F(t) = P(T > 𝑡) and S(t) = 1 at t = 0.
The hazard function, h(t), is the instantaneous rate of exit:
h(t) = lim∆t→0[(P (t + ∆t > 𝑇 > 𝑡|𝑇 > 𝑡))/∆𝑡] = (f(t))/(S(t)). (1)
The cumulative hazard function is
H(t) = ∫ h(u) dut
0= ∫ [f(u)/S(u)]. du
t
0= − ln{S(t)}. (2)
The likelihood function of survival of the firm is
ℒ = S(t). h(t), (3)
and returns to ℒ = S(t) at the point the data are censored.
We assumed baseline hazard (survival) of MNEs to be homogenous. Thus the
differences in the characteristics of MNEs link with the differences in the survival of
MNEs. The simplest conventional Cox hazard for an MNES at time 𝑡 is
h(t) = h0(t). exp(Zi. βi), (4)
where h0(t) is the baseline hazard, and Zi is a vector of constant characteristics of firm i.
However, we argue that h(t) would contain time varying covariates. For example, the
growth rate of capital would have a different effect on the survival of the firm at different
ages of the firm. Thus we modified (4) with time–covariates
h(t) = h0′ (t). exp [Zi. βi + g(t). (Xit. αi)], (5)
where g(t) is a function of time, and X𝑖𝑡 is a vector of time varying covariates8. We
assumed g(t) = t and put the results into the main analysis. However, we also eased this
assumption by hypothesizing that the nexus is loosening over time at an exponential rate.
We assumed the half-life of factor X𝑖𝑡 as 2, 3, 4, and 5 years. Thus the other replacement
forms of g(t) were exp(−0.35 × t) , exp(−0.233 × t) , exp(−0.175 × t) , and
exp(−0.14 × t). However, as the mean of survival duration is 5 years as seen in Table 2,
we only put the results using g(t) = exp(−0.14 × t) in Appendix 3 and 4 as other
8 A characteristic can be represented in both X𝑖𝑡 and 𝑍𝑖𝑡.
10
references9.
Due to the heterogeneity problem, the estimations would become unreliable if the
baseline hazard function were not chosen appropriately (Heckman and Singer, 1984).
However, we followed a flexible parametric proportional hazards model as suggested by
Han and Hausman (1990). This model assumes a nonparametric baseline hazard (constant
baseline hazard within each interval), a particular form of the covariates, and takes
advantage of large sample data.
In fact, we split the data into yearly intervals and set up a piecewise linear baseline
hazard. We used a set of dummies Ci,entry year to control for the fixed time effects of the
entry year, which could influence h0(t). We also considered the difference in the industrial
fields of the firms and the provincial government performance in each year as a set of
dummies, Di and vector of PCI, Gi,year. Thus, (5) becomes
h(t) = h0∗ (t). exp[Zi. β + g(t). (Xit. α) + Ci,entry year. β𝑐 + Di. β𝑑 + Gi,year. αyear], (6)
where h0∗ (t) is non–parametric baseline hazard. h0
∗ (t) is estimated from the data. Thus,
as displayed in our results, the hazard ratio, h(t)/h0∗ (𝑡), is the probability of exiting
compared with the baseline hazard. More specifically, if the hazard ratio is more (less) than
one, the firm is more (less) likely to exit.
Besides, to check the robustness, we applied a linear probability model for the exit
of the firm by setting a binary outcome of exit as
exitit = {1, if year < 2011 𝑎𝑛𝑑 𝑡 is the time the firm last seen
0, if otherwise , (7)
and using the ordinary least squared model to estimate:
exitit = Zi. β + Xit. α + Ct. β𝑐 + Di. β𝑑 + Gt. αyear + εi,t. (8)
The model of linear probability has some advantages over Cox hazard models.
The model is free from some assumptions necessary for specifications of Cox hazard
models that are debatable. However, the linear probability model is unable to take
advantage of the data in the year 2011 as censored data. Thus we limited the usage linear
model for the robustness check.
4.2 Specifications
We selected independent variables for the Cox hazard model as follows. Also, a
similar set of independent variables can be applied to the linear probability model. The
descriptive statistics for those variables are presented in Table 2.
9 Other results using the different functions g(t) are available upon request.

11
Three types of MNEs are 𝑗𝑜𝑖𝑛𝑡– 𝑣𝑒𝑛𝑡𝑢𝑟𝑒 𝑤𝑖𝑡ℎ 𝑆𝑂𝐸 ,
𝑗𝑜𝑖𝑛𝑡– 𝑣𝑒𝑛𝑡𝑢𝑟𝑒 𝑤𝑖𝑡ℎ 𝑜𝑡ℎ𝑒𝑟 𝑡ℎ𝑎𝑛 𝑆𝑂𝐸 , and foreign–owned enterprises (served as the
baseline).
𝐼𝑛𝑖𝑡𝑖𝑎𝑙 𝑓𝑖𝑟𝑚 𝑠𝑖𝑧𝑒 is the number of employees at the year end when first seen in
the time of study.
Indicators for the performance of the firms include a proxy for shut–down point
( 𝑙𝑛(𝑡𝑜𝑡𝑎𝑙 𝑟𝑒𝑣𝑒𝑛𝑢𝑒𝑡/𝑙𝑎𝑏𝑜𝑟 𝑐𝑜𝑠𝑡𝑡) ), ratio of liabilities to fixed assets ( 𝑙𝑛(𝑙𝑖𝑎𝑏𝑖𝑙𝑖𝑡𝑖𝑒𝑠𝑡/
𝑓𝑖𝑥𝑒𝑑 𝑎𝑠𝑠𝑒𝑡𝑠𝑡)), growth of total labor (𝑙𝑛(𝑙𝑎𝑏𝑜𝑟𝑡/𝑙𝑎𝑏𝑜𝑟𝑡−1)), and growth of total assets
(𝑙𝑛(𝑡𝑜𝑡𝑎𝑙 𝑎𝑠𝑠𝑒𝑡𝑠𝑡/𝑡𝑜𝑡𝑎𝑙 𝑎𝑠𝑠𝑒𝑡𝑠𝑡−1)). We used 𝑡 to denote the value as of the end of the
survey year and 𝑡 − 1 for the corresponding number recorded in the beginning of the
survey year. We assumed these indicators as time–variant covariates. As some observations
contain zero values in the raw variables, it is impossible to take log for some ratios. We
applied “dummy variable adjustment” (Cohen and Cohen 1983; and Cohen, Cohen, West,
and Aiken 2003). Concretely, zero was assigned for variables that cannot be converted into
log. At the same time, we constructed dummy variables to control for these special cases.
Thus, binary indicator variables (include Zero total revenue𝑡 , Zero liabilities𝑡 ,
Zero fixed assets𝑡 , Zero total labor𝑡−1 , Zero total assets𝑡−1 , and Zero total assets𝑡 ) are
created that are coded as 1 if the corresponding values are zero, and 0 otherwise.
The logarithm of the accumulated capital share owned by foreign partners
(𝑙𝑛(𝑓𝑜𝑟𝑒𝑖𝑔𝑛 𝑐𝑎𝑝𝑖𝑡𝑎𝑙𝑡/𝑡𝑜𝑡𝑎𝑙 𝑐𝑎𝑝𝑖𝑡𝑎𝑙𝑡)) is set to zero if foreign–owned enterprises and takes
other values if otherwise. This is hypothesized to be time–variant covariate. We noticed
that the information of capital share owned by foreign partners is recorded in 2002 and
later10
.
The nationalities of MNEs are the country of origin of FOE or of foreign partners
in joint–venture enterprises. We selected top 20 nationalities that have the largest number
of MNEs (over 500) during 2002–2011 and set as dummies such as 𝐽𝑎𝑝𝑎𝑛 and 𝐺𝑒𝑟𝑚𝑎𝑛𝑦.
The baseline is 𝑜𝑡ℎ𝑒𝑟 𝑐𝑜𝑢𝑛𝑡𝑟𝑖𝑒𝑠, which includes less than the 20 nationalities.
The PCIs 2006–2011 in each province were integrated to the data by converting
the table between provincial codes and names. They were indices of low entry costs for
business start–up ( 𝑙𝑜𝑤 𝑒𝑛𝑡𝑟𝑦 𝑐𝑜𝑠𝑡𝑠 ), transparent business environment and equitable
business information (𝑡𝑟𝑎𝑛𝑠𝑝𝑎𝑟𝑒𝑛𝑐𝑦), and limited time spent on bureaucratic procedures
and inspections (𝑙𝑜𝑤 𝑡 �� 𝑒 𝑐𝑜𝑠𝑡𝑠). A high index shows a competitive local government.
Also, to reduce the problem of possibly correlated variables of PCIs, we calculated the first
10
Whenever ln(foreign capital/total capital) cannot be computed due to (a) missing information or (b) zero
Vietnamese capital while the firm declares to be joint-venture, we applied “dummy variable adjustment” as
explained in the previous paragraph. The numbers of observations with each of such issues were 134 and
1,385 and dummy variables Missing Vietnamese partner𝑡 and Zero Vietnamese partner𝑡 were created.
At the same time, zero was assigned to 𝑙𝑛(𝑓𝑜𝑟𝑒𝑖𝑔𝑛 𝑐𝑎𝑝𝑖𝑡𝑎𝑙𝑡/𝑡𝑜𝑡𝑎𝑙 𝑐𝑎𝑝𝑖𝑡𝑎𝑙𝑡) for these observations.

12
principal component ( 𝑓𝑖𝑟𝑠𝑡 𝑝𝑟𝑖𝑛𝑐𝑖𝑝𝑎𝑙 𝑐𝑜𝑚𝑝𝑜𝑛𝑒𝑛𝑡 ) from the three indices as another
option11
. 𝐹𝑖𝑟𝑠𝑡 𝑝𝑟𝑖𝑛𝑐𝑖𝑝𝑎𝑙 𝑐𝑜𝑚𝑝𝑜𝑛𝑒𝑛𝑡 can be the first–order effect of governance and
interpreted as similar to PCIs. In addition, we set PCIs (𝑓𝑖𝑟𝑠𝑡 𝑝𝑟𝑖𝑛𝑐𝑖𝑝𝑎𝑙 𝑐𝑜𝑚𝑝𝑜𝑛𝑒𝑛𝑡) as both
time–variant and time–invariant covariates.
Also, we constructed several dummies for the fixed effect. Di comes from the
Vietnamese Standard Industrial Classification (VSIC) level 1 recorded in the data12
. We
used 13 dummies for the major industries in which MNEs are located. They were agri–
aquaculture/forestry, banking/finance, constructions, education, entertainment, health,
information and communication technologies (ICT), logistics, manufacturing, mining,
restaurant/hotel, trading and other industries. The baseline is “agri–aquaculture/forestry.”
Also we converted all provincial codes into the code in 2011 (the most updated
classification of provincial administrative divisions) and set up 62 dummies to control for
the differences of locations among 63 provinces in Vietnam. Dummies for financial year
(𝑌𝑒𝑎𝑟 2000–𝑌𝑒𝑎𝑟 2011) were also included.
Finally, we deployed comparable estimations among the data cohorts 2000–2011,
2002–2011, 2000–2005 and 2006–2011 using the same set of independent variables. We
dedicated 2006–2011 as the cohort for analysis with a full set of independent variables.
This is because information on the capital share owned by foreign partners (origins) and
PCI data are only available from 2002 and 2006, respectively.
5. Results
The estimation results are shown in Table 3 and 4. Note that “(tvc)” in the tables
means the variables treated as time-variant covariates.
The ownership of the foreign partner has a significant connection with the
probability of exiting. There are three important pieces of evidence.
First, there was a significant difference in the probability of exiting among
different types of MNEs during 2000–2011 as seen in Table 3. A joint–venture with a
domestic partner had an approximately 1.6 times higher probability of exiting than a FOE.
Similarly, a joint–venture with a SOE was more likely to exit than that with a FOE during
2000–2011; however, this difference was not statistically significant during 2006–2011.
[INSERT TABLE 3]
Second, the capital share owned by a foreign partner has the nexus with a
11
Such orthogonal transformation coverts the set of PCIs into a set of linearly uncorrelated principal
components. 12
GSO once changed the classification in 2007, thus we convert all codes in VSIC2007 into VSIC1993 to
make the dummies consistent across years. VSIC2007 is based on International Standard Industrial
Classification revision 4 (ISIC Revision 4) by the United Nation Statistical Division.

13
probability of exiting among types of joint–ventures. As shown in the hazard ratio of the
corresponding variables in Table 4, an increase in the share would connect with a lower
probability of exit. Besides, the probability varies positively with the duration, given the
same capital share ratio and other things being equal because the variable is time–variant
covariates. In addition, the results are consistent and robust regardless of the choices of
data cohorts, of 𝑔(𝑡) forms, and the type of joint–ventures. Table 4 and Appendix 4 show
the details. This implies that foreign partnership is associated with a longer duration of
survival. These results agree with those of Lu and Hébert (2003).
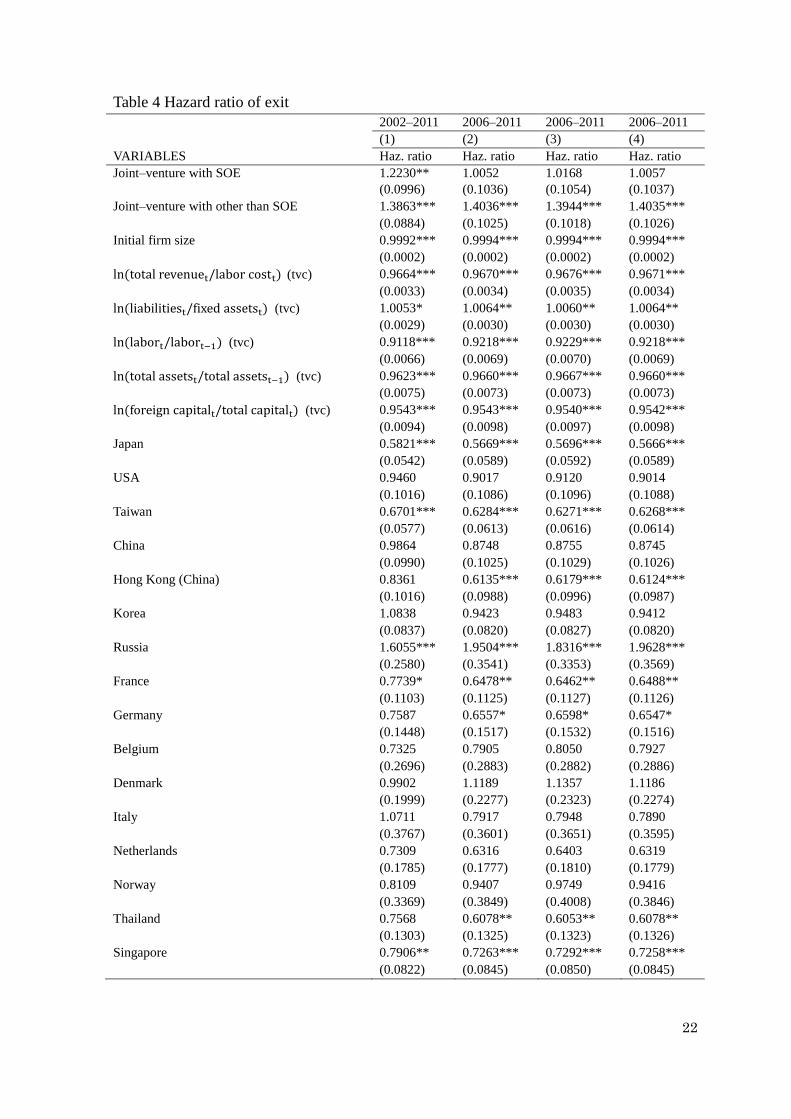
[INSERT TABLE 4]
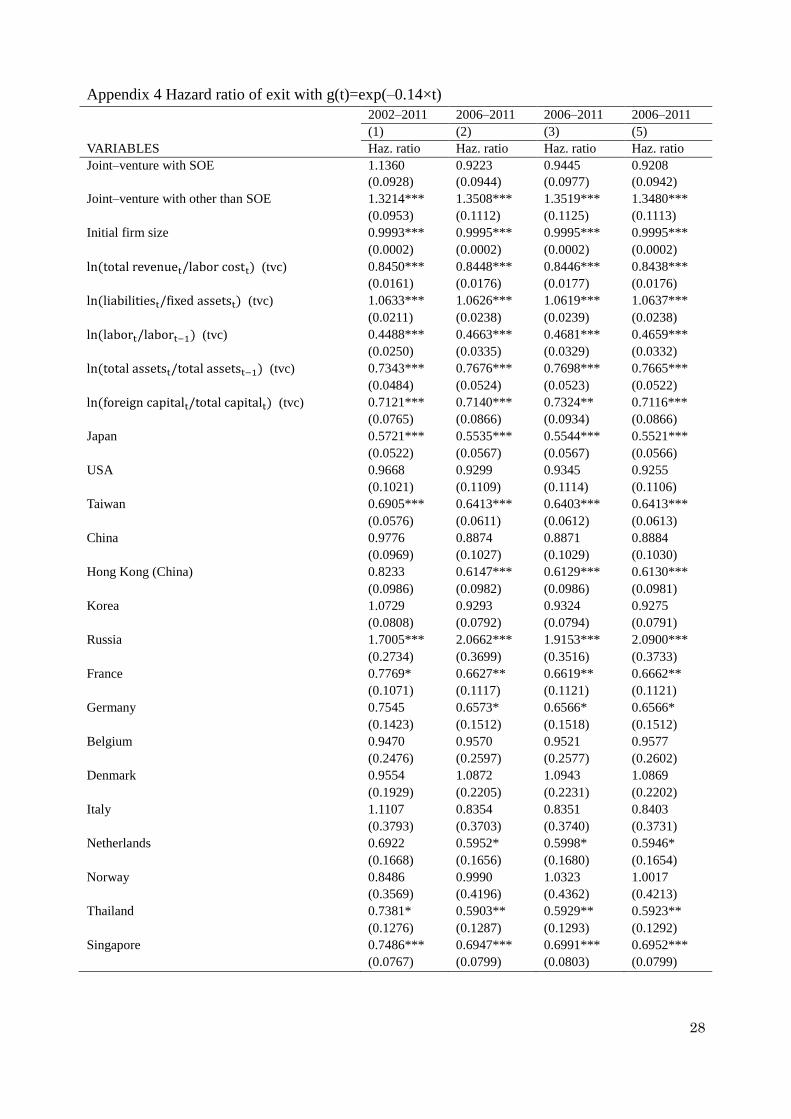
Third, we found that the nationalities of foreign partners connect with the
probability of exiting. As shown in analysis (1) and (2) in Table 4, we found that the
nationalities of MNEs having the lowest probability of exiting among top investors in
Vietnam are Japan, Thailand, Hong Kong (China), Taiwan, Germany, and Singapore. The
nationalities of MNEs can be a proxy for a difference in technology, management, culture
and support from the headquarters. It is notable that all the origin countries except
Germany are Asian countries, which could support our hypothesis that the nationalities
could be a proxy for the above-mentioned dimensions. We cannot divide the connection
into specific sub–categories. However, similar to the case of the foreign capital share, this
connection is persistent regardless of the data cohorts although the ranking among the top
countries may change with the assumption of 𝑔(𝑡) and the models in use.
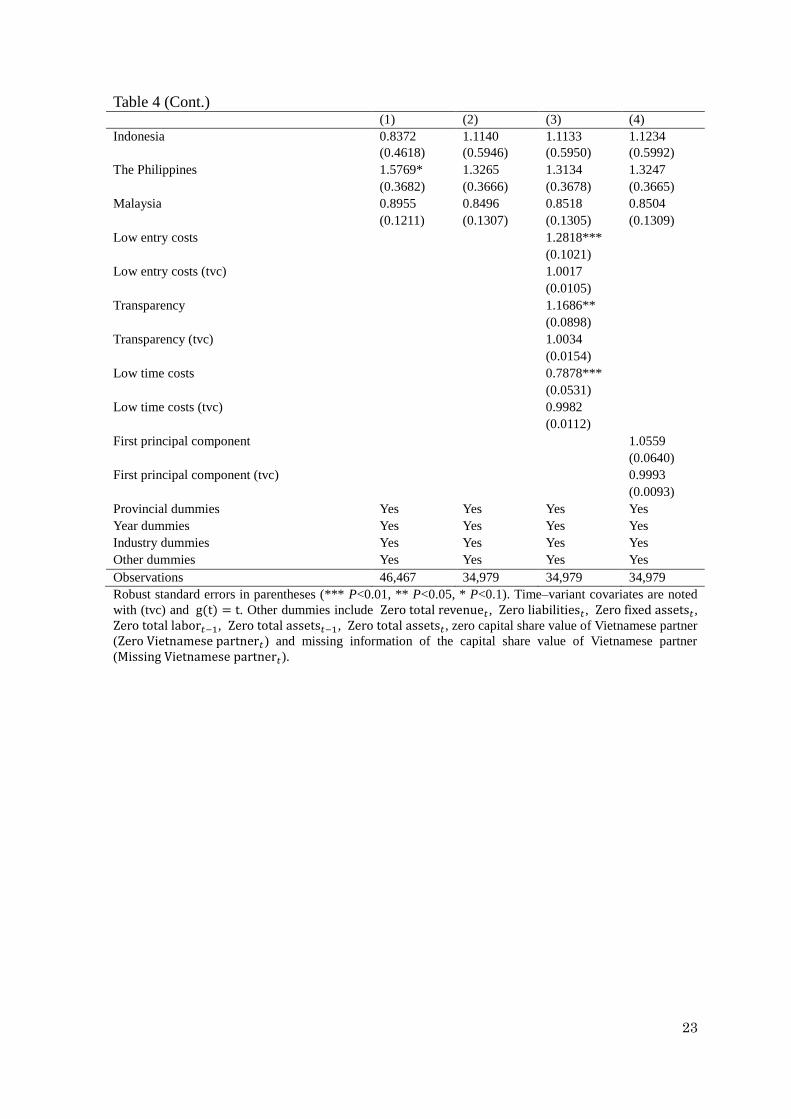
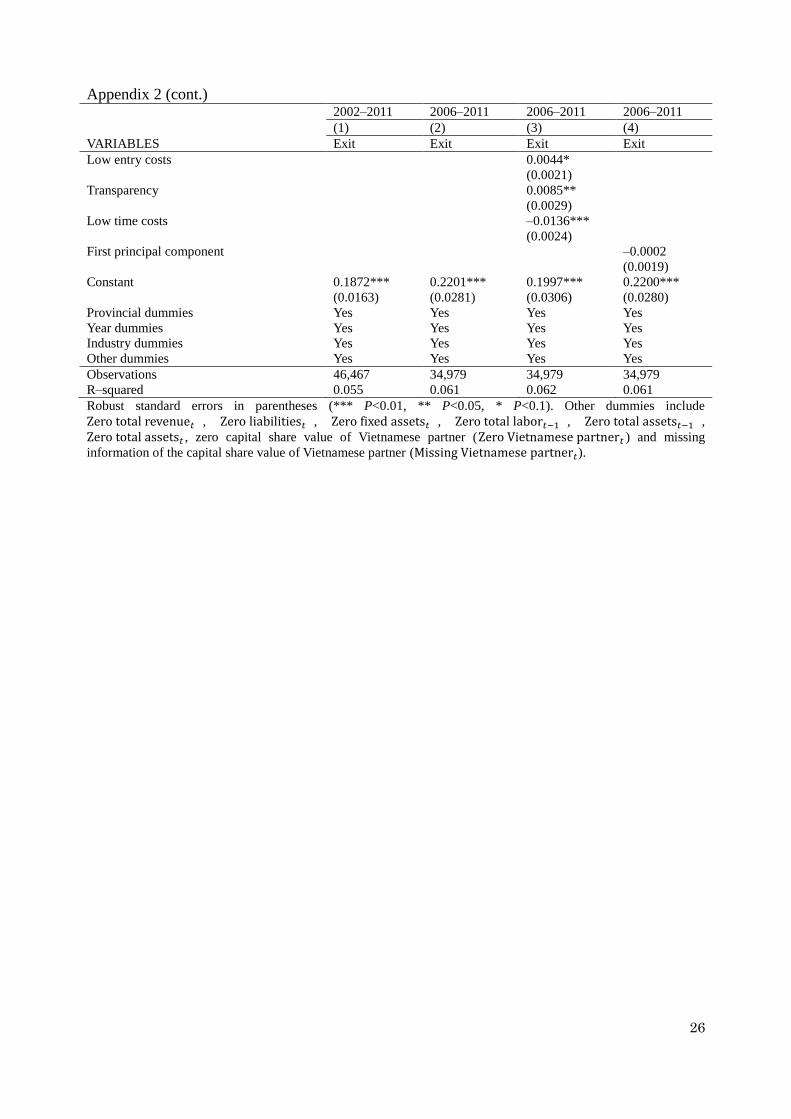
Turning to the issue of the quality of local governments, the competitiveness of
provincial government correlates with the survival of the firms in opposite directions.
While it facilitates the establishment of new firms, it also increases the probability of
failing for existing firms. In comparing Table 4, Appendix 2 and Appendix 4, the signs of
the three indices are consistent regardless of the assumptions on 𝑔(𝑡) or the models used.
As seen in analysis (3) of Table 4, a one–point increase in the index of 𝑙𝑜𝑤 𝑒𝑛𝑡𝑟𝑦 𝑐𝑜𝑠𝑡,
which means the provincial business environment has a lower cost for entrants, links with
1.2818 times higher in the probability of exiting of the existing MNEs. There are two
possible explanations. A lower cost for entrants would create more competitors for the
existing MNEs. Thus, existing MNEs are more likely to exit because of stiffer competition.
Another interpretation is that a lower cost for entrants may be attractive to firms with lower
competitiveness, which are more likely to exit. Also, if a provincial government improves
the transparency of the business environment and equitable business information, a one–
point gain in the transparency index could lead to a probability of 1.1686 times higher
probability of exiting. Since there are more MNEs enter than exit over time as shown in
Table 1, higher transparency increases the competitiveness of the business environment
and only the most competitive would survive. Thus this selection would boost economic
14
development. In contrast, a one–point improvement in the index for limited time spent on
bureaucratic procedures and inspections would help to reduce 0.7878 times lower in the
probability of exiting.
In addition, we examined specifications including the first-order principal
component constructed from three local government quality indices. This would provide a
first order effect of the quality of the local government on the survival of MNEs.
Unfortunately, since each of the indices would have opposite directions, these cancel out in
the estimation results. The first principal component would have a minimal connection
with survival as shown in analysis (4) of Table 4 or elsewhere in the corresponding
analysis in Appendix 2 and 4.
Also, our study confirmed the characteristics and performance of MNEs to the
exit. A one–labor increase in the initial size is associated with 0.9991–0.9994 times lower
probability of exiting of MNEs as indicated in Tables 3 and 4. Our results agree with those
of Audretsch and Mahmood (1995). The growth of labor and total assets, and the logarithm
of revenue over cost of labor, likewise link with a lower probability of exiting. Meanwhile,
the indicator of low ability to pay debt, 𝑙𝑛(𝑙𝑖𝑎𝑏𝑖𝑙𝑖𝑡𝑖𝑒𝑠𝑡/𝑓𝑖𝑥𝑒𝑑 𝑎𝑠𝑠𝑒𝑡𝑠𝑡) connects positively
to the probability of exiting.
6. Robustness check
Differences in data cohort are less likely to affect our estimations. The information
of foreign capital share and origins are only available in 2002 and after, while PCIs are
later than 2005. However, the sign of the main coefficients of our findings such as MNEs
types, initial size, performance and the share of capital owned by foreign partners are
consistent across data cohorts as shown in Tables 3 and 4. The only exception is the
statistical significance level of types of MNEs, in a particular joint-venture with SOE.
However, in general, our interpretation for cohort 2006–2011 can be extrapolated to that of
2000–2011.
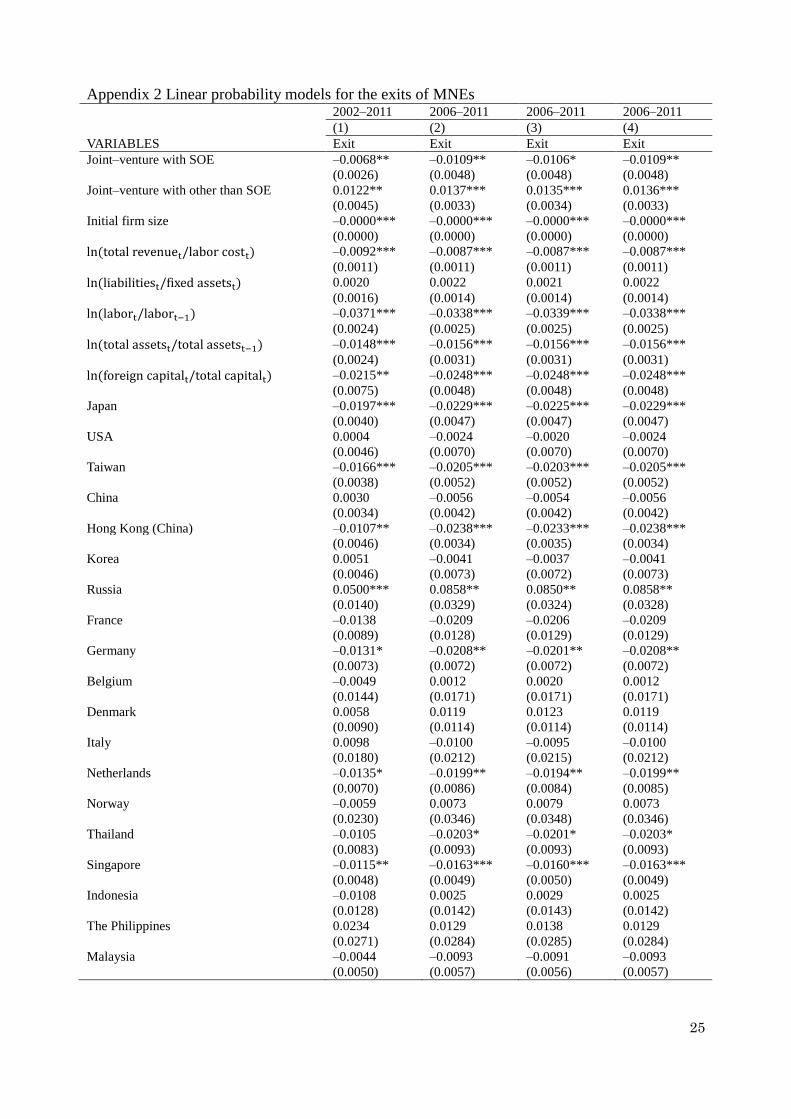
Thus, our main findings appear to be robust. We found that the sign and
significance of coefficients for our main findings are sufficiently similar between the Cox
hazard estimations and the linear probability estimations as demonstrated in Appendix 1
and 2. Similarly, the assumptions on 𝑔(𝑡) do not affect the results in regard to our main
variables as in Appendices 3 and 413
.
7. Conclusion and discussion
We examined the probability of MNEs exiting using a census survey of MNEs
13
We also examined and confirmed this with other specifications of g(t) as listed in Section 4.1 and those
results are available upon request.
15
from 2000–2011 in Vietnam using Cox hazard models and the linear probability model. We
also combined the data with annual provincial competitiveness indices. The results show a
connection between the structures and types of ownership, and the probability of exiting,
hence the duration of survival. Joint–ventures with other than SOE are more likely to exit
than the rest. In contrast, a higher proportion of capital owned by foreign partners would
link with a higher probability of survival. We hypothesized that better business decisions
empowered by sharing the capital of foreign partners would prolong the life of the MNEs.
Furthermore, the nationalities of MNEs have different influences on the probability of
exiting. We argue that the nationalities would be a proxy for differences in technology and
management and culture proximity. Local government performance can either prolong or
shorten the duration of survival. Our study also confirms the influence of MNEs’
characteristics and performance on its decision to stay or to exit.
Three main policy implications can be drawn from these findings. First, MNEs
should raise the proportion of the capital owned by the foreign partner in the total capital to
increase the likelihood of surviving. However, it should be noted that there are legal share
limits on foreign owned capital imposed by the Vietnamese government in some specific
cases14
, however. The country should consider removing or relaxing the limits against
MNEs, as was also suggested by Kosová (2010). Second, the best surviving nationalities
should be considered among Vietnamese in attracting foreign investment. Third, in the
short run, improvement in local government performance should put more weight on
reducing time costs due to bureaucratic procedures and inspections. On the other hand,
creating a more competitive business environment by lowering the entry costs, with more
transparency and equitable business information would secure better and sounder
economic development.
Our study has some limitations. First, the survival difference among the three
types of MNEs may be endogenous. For example, foreign partners might avoid SOEs
because it tends to take longer to reach the conclusion of a contract with SOEs. Thus the
duration of survival is short regardless of later decisions. Second, similarly, the capital
share among partners may also imply the duration of the contract. Third, the location
choice would be endogenous (Shaver, 1998). Fourth, there is some minor miss-matching
among different assumptions of g(t) or between the duration model and the linear
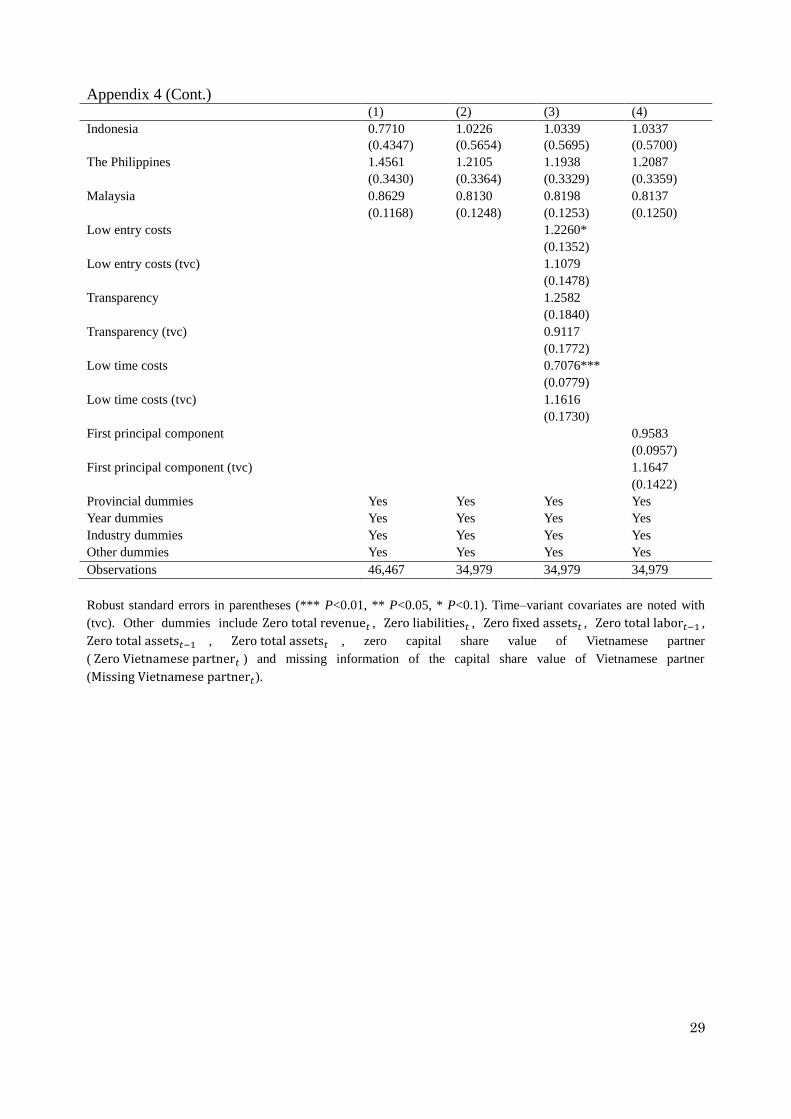
probability model, which affect the statistical significance of the coefficients. For example,
the coefficient of 𝑡𝑟𝑎𝑛𝑠𝑝𝑎𝑟𝑒𝑛𝑐𝑦 becomes statistically insignificant if
g(t) = exp(−0.14 × t) as in Appendix 4. However, 𝑡𝑟𝑎𝑛𝑠𝑝𝑎𝑟𝑒𝑛𝑐𝑦 is statistically
significant if included but the other two indicators are omitted15
.
14
An example is Article 13 of the Government Decree 102/2010/ND-CP dated 01/10/2010 entitled
“Detailing a number of articles of the law on enterprises.” 15
We estimate this case but do not show it in the main report.
16
References
Audretsch, D. B., & Mahmood, T., 1995. New firm survival: New results using a hazard
function. The Review of Economics and Statistics 77(1), 97–103.
Audretsch, D. B., Santarelli, E., and Vivarelli, M., 1999. Start–up size and industrial dynamics:
some evidence from Italian manufacturing. International Journal of Industrial
Organization 17(7), 965–983.
Cabral, L. M. B., Mata, J., 2003. On the evolution of the firm size distribution: Facts and
theory. American Economic Review 93(4), 1075–1090.
Cohen, J., Cohen, P., 1983. Applied multiple regression/correlation analysis for the behavioral
sciences (2nd ed.). Hillsdale, NJ: Erlbaum.
Cohen, J., Cohen, P., West, S., and Aiken, L., 2003. Applied multiple regression/correlation
analysis for the behavioral sciences (3rd ed.). Mahwah, NJ: Erlbaum.
Dixit, A., 1989. Entry and exit decisions under uncertainty. Journal of Political Economy 97(3),
620–638.
Fisman, R., Svensson, J., 2007. Are corruption and taxation really harmful to growth? Firm
level evidence. Journal of Development Economics 83(1), 63–75.
Flamm, K., 1984. The volatility of offshore investment. Journal of Development Economics
16(3), 231–248.
Geroski, P. A., 1995. What do we know about entry? International Journal of Industrial
Organization 13(4), 421–440.
General Statistics of Vietnam (GSO), 2013a. Annual average capital of enterprises by type of
enterprise. http://www.gso.gov.vn/Modules/Doc_Download.aspx?DocID=9777. Last
accessed October 6, 2013.
General Statistics of Vietnam (GSO), 2013b. Number of employees in enterprises as of annual
31 Dec. by type of enterprise.
http://www.gso.gov.vn/Modules/Doc_Download.aspx?DocID=9771. Last accessed
October 6, 2013.
Globerman, S., Shapiro, D., 2002. Global Foreign Direct Investment Flows: The Role of
Governance Infrastructure. World Development 30(11), 1899–1919,
Griliches, Z., Regev, H., 1995. Firm productivity in Israeli industry 1979-1988. Journal of
Econometrics 65(1), 175–203.
Ha, D. T. T, Kiyota, K., In press. Firm-Level Evidence on Productivity Differentials and
Turnover in Vietnamese Manufacturing. Japanese Economic Review. doi:
10.1111/jere.12032.
Han, A., Hausman, J. A., 1990. Flexible parametric estimation of duration and competing risk
models. Journal of Applied Econometrics 5(1), 1–28.
Hansen, H., Rand, J., and Tarp, F., 2009. Enterprise growth and survival in Vietnam: Does
government support matter? Journal of Development Studies 45(7), 1048–1069.
Heckman, J., Singer, B., 1984. A method for minimizing the impact of distributional
17
assumptions in econometric models for duration data. Econometrica 52(2), 271–320.
Holmes, P., Hunt, A., and Stone, I., 2010. An analysis of new firm survival using a hazard
function. Applied Economics 42(2), 185–195.
Kosová, R., 2010. Do foreign firms crowd out domestic firms? Evidence from the Czech
Republic. The Review of Economics and Statistics 92(4), 861–881.
Lu, W.J, Hébert, L., 2005. Equity control and the survival of international joint ventures: a
contingency approach. Journal of Business Research 58, 736–754.
Mata, J., Portugal, P., 1994. Life duration of new firms. The Journal of Industrial Economics
42(3), 227–245.
Mata, J., & Portugal, P. (2002). The survival of new domestic and foreign–owned firms.
Strategic Management Journal, 23(4), 323–343.
McCloughan, P., Stone, I., 1998. Life duration of foreign multinational subsidiaries: Evidence
from UK northern manufacturing industry 1970–93. International Journal of Industrial
Organization 16(6), 719–747.
Nguyen, T. T., van Dijk, M. A., 2012. Corruption, growth, and governance: Private vs. state–
owned firms in Vietnam. Journal of Banking & Finance 36(11), 2935–2948.
OECD, 2012. Entrepreneurship at a glance 2012: OECD Publishing.
doi: 10.1787/entrepreneur_aag–2012–en.
Pavcnik, N., 2002. Trade Liberalization, Exit, and Productivity Improvements: Evidence from
Chilean Plants. Review of Economic Studies 69 (1), 245–276.
Rand, J., Tarp, F., 2012. Firm–Level Corruption in Vietnam. Economic Development and
Cultural Change 60(3), 571–595.
Shaver, M. J., 1998. Accounting for endogeneity when assessing strategy performance: Does
entry mode choice affect FDI survival? Management Science 44(4), 571–585.
Shiferaw, A., 2009. Survival of private sector manufacturing establishments in Africa: The role
of productivity and ownership. World Development 37(3), 572–584.
Svensson, J., 2003. Who must pay bribes and how much? Evidence from a cross section of
firms. Quarterly Journal of Economics 118(1), 207–230.
Tsoukas, S., 2011. Firm survival and financial development: Evidence from a panel of
emerging Asian economies. Journal of Banking & Finance 35(7), 1736–1752.
Tybout, J. R., 2000. Manufacturing firms in developing countries: How well do they do, and
why? Journal of Economic Literature 38(1), 11–44.
Vietnamese Chamber of Industry and Commerce (VCCI), 2012). The Vietnam provincial
competitiveness index 2011.
http://www.pcivietnam.org/uploads/report/PCI%202011%20full%20report_final.pdf.
Last accessed October 11, 2013.
18
Table 1 Appearance of MNEs in 2000–2011 Start–up
year
2000 2001 2002 2003 2004 2005 2006 2007 2008 2009 2010 2011
2000 1,379 1,264 1,223 1,185 1,167 1,127 1,086 1,071 1,046 1,002 968 943
2001 748 650 640 634 592 561 542 526 508 488 463
2002 351 307 297 278 262 260 251 239 229 217
2003 454 421 385 362 360 343 338 328 320
2004 561 534 496 480 445 432 417 407
2005 682 613 582 534 514 491 473
2006 746 680 632 597 588 569
2007 919 823 765 724 701
2008 973 876 816 776
2009 1,207 1,076 1,001
2010 1,029 884
2011 1,912
Total 1,379 2,012 2,224 2,586 3,080 3,598 4,126 4,894 5,573 6,478 7,154 8,666
GSO* 1,525 2,011 2,308 2,641 3,156 3,697 4,220 4,961 5,626 – – –
(*): GSO (2013a)
19
Table 2 Descriptive statistics of main variables 2000–2011 2006–2011
Variables Obs. Mean Std. Dev. Obs. Mean Std. Dev.
Duration (years) 49,858 4.3987 2.9917 34,979 5.0660 3.1872
Exit (dummy) 49,858 0.0460 0.2096 34,979 0.0452 0.2077
Joint–venture with SOE (dummy) 49,858 0.1260 0.3318 34,979 0.0908 0.2873
Joint–venture with other than SOE
(dummy)
49,858 0.1031 0.3041 34,979 0.1041 0.3053
Initial firm size
(number of labor)
49,858 187.9 627.05 34,979 175.57 576.37
ln(foreign capitalt/total capitalt) 49,858 –0.0987 0.2784 34,979 –0.0956 0.2829
ln(foreign capitalt/total capitalt)
(among joint-ventures and if
foreign capitalt & total capitalt > 0)
10,439 –0.4715 0.4408 6,104 –0.5478 0.4593
ln(total revenuet/labor costt)
(if total revenuet & labor costt > 0)
47,656 1.2161 1.4345 33,556 1.1650 1.4859
ln(liabilitiest/fixed assetst)
(if liabilitiest & fixed assetst > 0)
46,308 0.4573 1.8075 32,410 0.6210 1.8340
ln(labort/labort−1)
(if labort & labort−1 > 0)
45,480 0.0988 0.4757 32,526 0.0859 0.4660
ln(total assetst/total assetst−1)
(if total assetst & total assetst−1 > 0)
44,950 0.1546 0.4522 32,213 0.1588 0.4679
Entry costs 34,979 7.6539 0.9382
Transparency 34,979 6.4980 0.7462
Time cost 34,979 6.2065 0.9145
First principal component of entry costs,
transparency and time cost
34,979 0.4967 1.0062
Zero total revenue𝑡 (dummy) 49,858 0.0437 0.2044 34,979 0.0401 0.1961
Zero liabilities𝑡 49,858 0.0401 0.1961 34,979 0.0355 0.1850
Zero fixed assets𝑡 49,858 0.0487 0.2152 34,979 0.0520 0.2221
Zero total labor𝑡−1 49,858 0.0878 0.2830 34,979 0.0701 0.2553
Zero total assets𝑡 49,858 0.0061 0.0780 34,979 0.0013 0.0366
Zero total assets𝑡−1 49,858 0.0979 0.2972 34,979 0.0785 0.2690
Zero Vietnamese partner𝑡 49,858 0.0027 0.0523 34,979 0.0022 0.0515
Missing Vietnamese partner𝑡 49,858 0.0278 0.1643 34,979 0.0021 0.0466
Industry dummies
Agri–Aquaculture/Forestry 49,858 0.0176 0.1315 34,979 0.0151 0.1219
Banking/Finance 49,858 0.0075 0.0861 34,979 0.0049 0.0700
Constructions 49,858 0.0278 0.1644 34,979 0.0322 0.1765
Education 49,858 0.0019 0.0436 34,979 0.0001 0.0107
Entertainment 49,858 0.0019 0.0436 34,979 0.0000 0.0000
Health 49,858 0.0013 0.0366 34,979 0.0019 0.0434
ICT 49,858 0.0409 0.1981 34,979 0.0468 0.2113
Logistics 49,858 0.0305 0.1721 34,979 0.0309 0.1731
Manufacturing 49,858 0.6747 0.4685 34,979 0.6493 0.4772
Mining 49,858 0.0216 0.1452 34,979 0.0283 0.1659
Restaurant/Hotel 49,858 0.0221 0.1471 34,979 0.0193 0.1376
Trading 49,858 0.0338 0.1807 34,979 0.0373 0.1895
Other industries 49,858 0.1184 0.3231 34,979 0.1338 0.3404
20
Table 2 (Cont.) 2000–2011 2006–2011
Variables Obs. Mean Std. Dev. Obs. Mean Std. Dev.
Year dummies
Year 2000 49,858 0.0277 0.1640
Year 2001 49,858 0.0404 0.1968
Year 2002 49,858 0.0446 0.2064
Year 2003 49,858 0.0519 0.2218
Year 2004 49,858 0.0618 0.2407
Year 2005 49,858 0.0722 0.2588
Year 2006 49,858 0.0828 0.2755 34,979 0.1180 0.3226
Year 2007 49,858 0.0982 0.2975 34,979 0.1399 0.3469
Year 2008 49,858 0.1118 0.3151 34,979 0.1593 0.3660
Year 2009 49,858 0.1299 0.3362 34,979 0.1852 0.3885
Year 2010 49,858 0.1435 0.3506 34,979 0.2045 0.4034
Year 2011 49,858 0.1355 0.3422 34,979 0.1931 0.3947

21
Table 3 Hazard ratio of exit by data cohorts 2000–2011 2002–2011 2000–2005 2006–2011
(1) (2) (3) (4)
VARIABLES Haz. ratio Haz. ratio Haz. ratio Haz. ratio
Joint–venture with SOE 1.3871*** 1.4233*** 1.2900*** 1.1656
(0.0984) (0.1107) (0.1216) (0.1166)
Joint–venture with other than SOE 1.6009*** 1.5801*** 1.4819*** 1.6022***
(0.0893) (0.0924) (0.1429) (0.1072)
Initial firm size 0.9993*** 0.9992*** 0.9991*** 0.9994***
(0.0002) (0.0002) (0.0002) (0.0002)
ln(total revenuet/labor costt) (tvc) 0.9640*** 0.9641*** 0.9078*** 0.9653***
(0.0032) (0.0033) (0.0247) (0.0034)
ln(liabilitiest/fixed assetst) (tvc) 1.0051* 1.0054* 1.0299 1.0063**
(0.0030) (0.0030) (0.0228) (0.0030)
ln(labort/labort−1) (tvc) 0.9125*** 0.9134*** 0.6429*** 0.9230***
(0.0070) (0.0070) (0.0618) (0.0071)
ln(total assetst/total assetst−1) (tvc) 0.9640*** 0.9650*** 0.7373*** 0.9682***
(0.0076) (0.0076) (0.0766) (0.0073)
Provincial dummies Yes Yes Yes Yes
Year dummies Yes Yes Yes Yes
Industry dummies Yes Yes Yes Yes
Other dummies Yes Yes Yes Yes
Observations 49,858 46,467 13,877 34,979
Robust see form in parentheses (*** P<0.01, ** P<0.05, * P<0.1). Time–variant covariates are noted with
(tvc) and g(t) = t . Other dummies include Zero total revenue𝑡 , Zero liabilities𝑡 , Zero fixed assets𝑡 ,
Zero total labor𝑡−1, Zero total assets𝑡−1, and Zero total assets𝑡.
22
Table 4 Hazard ratio of exit
2002–2011 2006–2011 2006–2011 2006–2011
(1) (2) (3) (4)
VARIABLES Haz. ratio Haz. ratio Haz. ratio Haz. ratio
Joint–venture with SOE 1.2230** 1.0052 1.0168 1.0057
(0.0996) (0.1036) (0.1054) (0.1037)
Joint–venture with other than SOE 1.3863*** 1.4036*** 1.3944*** 1.4035***
(0.0884) (0.1025) (0.1018) (0.1026)
Initial firm size 0.9992*** 0.9994*** 0.9994*** 0.9994***
(0.0002) (0.0002) (0.0002) (0.0002)
ln(total revenuet/labor costt) (tvc) 0.9664*** 0.9670*** 0.9676*** 0.9671***
(0.0033) (0.0034) (0.0035) (0.0034)
ln(liabilitiest/fixed assetst) (tvc) 1.0053* 1.0064** 1.0060** 1.0064**
(0.0029) (0.0030) (0.0030) (0.0030)
ln(labort/labort−1) (tvc) 0.9118*** 0.9218*** 0.9229*** 0.9218***
(0.0066) (0.0069) (0.0070) (0.0069)
ln(total assetst/total assetst−1) (tvc) 0.9623*** 0.9660*** 0.9667*** 0.9660***
(0.0075) (0.0073) (0.0073) (0.0073)
ln(foreign capitalt/total capitalt) (tvc) 0.9543*** 0.9543*** 0.9540*** 0.9542***
(0.0094) (0.0098) (0.0097) (0.0098)
Japan 0.5821*** 0.5669*** 0.5696*** 0.5666***
(0.0542) (0.0589) (0.0592) (0.0589)
USA 0.9460 0.9017 0.9120 0.9014
(0.1016) (0.1086) (0.1096) (0.1088)
Taiwan 0.6701*** 0.6284*** 0.6271*** 0.6268***
(0.0577) (0.0613) (0.0616) (0.0614)
China 0.9864 0.8748 0.8755 0.8745
(0.0990) (0.1025) (0.1029) (0.1026)
Hong Kong (China) 0.8361 0.6135*** 0.6179*** 0.6124***
(0.1016) (0.0988) (0.0996) (0.0987)
Korea 1.0838 0.9423 0.9483 0.9412
(0.0837) (0.0820) (0.0827) (0.0820)
Russia 1.6055*** 1.9504*** 1.8316*** 1.9628***
(0.2580) (0.3541) (0.3353) (0.3569)
France 0.7739* 0.6478** 0.6462** 0.6488**
(0.1103) (0.1125) (0.1127) (0.1126)
Germany 0.7587 0.6557* 0.6598* 0.6547*
(0.1448) (0.1517) (0.1532) (0.1516)
Belgium 0.7325 0.7905 0.8050 0.7927
(0.2696) (0.2883) (0.2882) (0.2886)
Denmark 0.9902 1.1189 1.1357 1.1186
(0.1999) (0.2277) (0.2323) (0.2274)
Italy 1.0711 0.7917 0.7948 0.7890
(0.3767) (0.3601) (0.3651) (0.3595)
Netherlands 0.7309 0.6316 0.6403 0.6319
(0.1785) (0.1777) (0.1810) (0.1779)
Norway 0.8109 0.9407 0.9749 0.9416
(0.3369) (0.3849) (0.4008) (0.3846)
Thailand 0.7568 0.6078** 0.6053** 0.6078**
(0.1303) (0.1325) (0.1323) (0.1326)
Singapore 0.7906** 0.7263*** 0.7292*** 0.7258***
(0.0822) (0.0845) (0.0850) (0.0845)
23
Table 4 (Cont.) (1) (2) (3) (4)
Indonesia 0.8372 1.1140 1.1133 1.1234
(0.4618) (0.5946) (0.5950) (0.5992)
The Philippines 1.5769* 1.3265 1.3134 1.3247
(0.3682) (0.3666) (0.3678) (0.3665)
Malaysia 0.8955 0.8496 0.8518 0.8504
(0.1211) (0.1307) (0.1305) (0.1309)
Low entry costs 1.2818***
(0.1021)
Low entry costs (tvc) 1.0017
(0.0105)
Transparency 1.1686**
(0.0898)
Transparency (tvc) 1.0034
(0.0154)
Low time costs 0.7878***
(0.0531)
Low time costs (tvc) 0.9982
(0.0112)
First principal component 1.0559
(0.0640)
First principal component (tvc) 0.9993
(0.0093)
Provincial dummies Yes Yes Yes Yes
Year dummies Yes Yes Yes Yes
Industry dummies Yes Yes Yes Yes
Other dummies Yes Yes Yes Yes
Observations 46,467 34,979 34,979 34,979
Robust standard errors in parentheses (*** P<0.01, ** P<0.05, * P<0.1). Time–variant covariates are noted
with (tvc) and g(t) = t. Other dummies include Zero total revenue𝑡 , Zero liabilities𝑡, Zero fixed assets𝑡,
Zero total labor𝑡−1, Zero total assets𝑡−1, Zero total assets𝑡, zero capital share value of Vietnamese partner
(Zero Vietnamese partner𝑡) and missing information of the capital share value of Vietnamese partner
(Missing Vietnamese partner𝑡).

24
Appendix 1 Linear probability models for the exits of MNEs by data cohort 2000–2011 2002–2011 2000–2005 2006–2011
(1) (2) (3) (4)
VARIABLES Exit Exit Exit Exit
Joint–venture with SOE 0.0047 0.0046 0.0199** 0.0018
(0.0035) (0.0046) (0.0091) (0.0057)
Joint–venture with other than SOE 0.0269*** 0.0255*** 0.0570*** 0.0285***
(0.0024) (0.0030) (0.0129) (0.0026)
Initial firm size –0.0000*** –0.0000*** –0.0000*** –0.0000***
(0.0000) (0.0000) (0.0000) (0.0000)
ln(total revenuet/labor costt) –0.0095*** –0.0097*** –0.0228*** –0.0091***
(0.0010) (0.0012) (0.0024) (0.0011)
ln(liabilitiest/fixed assetst) 0.0019 0.0022 0.0021 0.0024
(0.0017) (0.0018) (0.0060) (0.0016)
ln(labort/labort−1) –0.0373*** –0.0375*** –0.0649*** –0.0343***
(0.0026) (0.0024) (0.0064) (0.0026)
ln(total assetst/total assetst−1) –0.0139*** –0.0142*** –0.0186*** –0.0152***
(0.0026) (0.0024) (0.0050) (0.0031)
Constant 0.2253*** 0.1757*** 0.3169** 0.2036***
(0.0531) (0.0189) (0.1114) (0.0306)
Industry dummies Yes Yes Yes Yes
Year dummies Yes Yes Yes Yes
Provincial dummies Yes Yes Yes Yes
Other dummies Yes Yes Yes Yes
Observations 49,858 46,467 14,879 34,979
R–squared 0.049 0.051 0.102 0.056
Robust standard errors in parentheses (*** P<0.01, ** P<0.05, * P<0.1). Other dummies include
Zero total revenue𝑡 , Zero liabilities𝑡 , Zero fixed assets𝑡 , Zero total labor𝑡−1 , Zero total assets𝑡−1 , and
Zero total assets𝑡.
25
Appendix 2 Linear probability models for the exits of MNEs 2002–2011 2006–2011 2006–2011 2006–2011
(1) (2) (3) (4)
VARIABLES Exit Exit Exit Exit
Joint–venture with SOE –0.0068** –0.0109** –0.0106* –0.0109**
(0.0026) (0.0048) (0.0048) (0.0048)
Joint–venture with other than SOE 0.0122** 0.0137*** 0.0135*** 0.0136***
(0.0045) (0.0033) (0.0034) (0.0033)
Initial firm size –0.0000*** –0.0000*** –0.0000*** –0.0000***
(0.0000) (0.0000) (0.0000) (0.0000)
ln(total revenuet/labor costt) –0.0092*** –0.0087*** –0.0087*** –0.0087***
(0.0011) (0.0011) (0.0011) (0.0011)
ln(liabilitiest/fixed assetst) 0.0020 0.0022 0.0021 0.0022
(0.0016) (0.0014) (0.0014) (0.0014)
ln(labort/labort−1) –0.0371*** –0.0338*** –0.0339*** –0.0338***
(0.0024) (0.0025) (0.0025) (0.0025)
ln(total assetst/total assetst−1) –0.0148*** –0.0156*** –0.0156*** –0.0156***
(0.0024) (0.0031) (0.0031) (0.0031)
ln(foreign capitalt/total capitalt) –0.0215** –0.0248*** –0.0248*** –0.0248***
(0.0075) (0.0048) (0.0048) (0.0048)
Japan –0.0197*** –0.0229*** –0.0225*** –0.0229***
(0.0040) (0.0047) (0.0047) (0.0047)
USA 0.0004 –0.0024 –0.0020 –0.0024
(0.0046) (0.0070) (0.0070) (0.0070)
Taiwan –0.0166*** –0.0205*** –0.0203*** –0.0205***
(0.0038) (0.0052) (0.0052) (0.0052)
China 0.0030 –0.0056 –0.0054 –0.0056
(0.0034) (0.0042) (0.0042) (0.0042)
Hong Kong (China) –0.0107** –0.0238*** –0.0233*** –0.0238***
(0.0046) (0.0034) (0.0035) (0.0034)
Korea 0.0051 –0.0041 –0.0037 –0.0041
(0.0046) (0.0073) (0.0072) (0.0073)
Russia 0.0500*** 0.0858** 0.0850** 0.0858**
(0.0140) (0.0329) (0.0324) (0.0328)
France –0.0138 –0.0209 –0.0206 –0.0209
(0.0089) (0.0128) (0.0129) (0.0129)
Germany –0.0131* –0.0208** –0.0201** –0.0208**
(0.0073) (0.0072) (0.0072) (0.0072)
Belgium –0.0049 0.0012 0.0020 0.0012
(0.0144) (0.0171) (0.0171) (0.0171)
Denmark 0.0058 0.0119 0.0123 0.0119
(0.0090) (0.0114) (0.0114) (0.0114)
Italy 0.0098 –0.0100 –0.0095 –0.0100
(0.0180) (0.0212) (0.0215) (0.0212)
Netherlands –0.0135* –0.0199** –0.0194** –0.0199**
(0.0070) (0.0086) (0.0084) (0.0085)
Norway –0.0059 0.0073 0.0079 0.0073
(0.0230) (0.0346) (0.0348) (0.0346)
Thailand –0.0105 –0.0203* –0.0201* –0.0203*
(0.0083) (0.0093) (0.0093) (0.0093)
Singapore –0.0115** –0.0163*** –0.0160*** –0.0163***
(0.0048) (0.0049) (0.0050) (0.0049)
Indonesia –0.0108 0.0025 0.0029 0.0025
(0.0128) (0.0142) (0.0143) (0.0142)
The Philippines 0.0234 0.0129 0.0138 0.0129
(0.0271) (0.0284) (0.0285) (0.0284)
Malaysia –0.0044 –0.0093 –0.0091 –0.0093
(0.0050) (0.0057) (0.0056) (0.0057)
26
Appendix 2 (cont.) 2002–2011 2006–2011 2006–2011 2006–2011
(1) (2) (3) (4)
VARIABLES Exit Exit Exit Exit
Low entry costs 0.0044*
(0.0021)
Transparency 0.0085**
(0.0029)
Low time costs –0.0136***
(0.0024)
First principal component –0.0002
(0.0019)
Constant 0.1872*** 0.2201*** 0.1997*** 0.2200***
(0.0163) (0.0281) (0.0306) (0.0280)
Provincial dummies Yes Yes Yes Yes
Year dummies Yes Yes Yes Yes
Industry dummies Yes Yes Yes Yes
Other dummies Yes Yes Yes Yes
Observations 46,467 34,979 34,979 34,979
R–squared 0.055 0.061 0.062 0.061
Robust standard errors in parentheses (*** P<0.01, ** P<0.05, * P<0.1). Other dummies include
Zero total revenue𝑡 , Zero liabilities𝑡 , Zero fixed assets𝑡 , Zero total labor𝑡−1 , Zero total assets𝑡−1 ,
Zero total assets𝑡 , zero capital share value of Vietnamese partner (Zero Vietnamese partner𝑡 ) and missing
information of the capital share value of Vietnamese partner (Missing Vietnamese partner𝑡).

27
Appendix 3 Hazard ratio of exit by data cohorts with g(t)=exp(–0.14×t)
2000–2011 2002–2011 2000–2005 2006–2011
(1) (2) (3) (4)
VARIABLES Haz. ratio Haz. ratio Haz. ratio Haz. ratio
Joint–venture with SOE 1.2799*** 1.2967*** 1.2900*** 1.0421
(0.0882) (0.0979) (0.1216) (0.1015)
Joint–venture with other than SOE 1.5899*** 1.5641*** 1.4819*** 1.5876***
(0.0871) (0.0897) (0.1429) (0.1043)
Initial firm size 0.9994*** 0.9993*** 0.9991*** 0.9995***
(0.0002) (0.0002) (0.0002) (0.0002)
ln(total revenuet/labor costt) (tvc) 0.8494*** 0.8384*** 0.8947*** 0.8397***
(0.0158) (0.0159) (0.0280) (0.0174)
ln(liabilitiest/fixed assetst) (tvc) 1.0517*** 1.0629*** 1.0345 1.0657***
(0.0195) (0.0209) (0.0263) (0.0237)
ln(labort/labort−1) (tvc) 0.4438*** 0.4464*** 0.6016*** 0.4666***
(0.0255) (0.0251) (0.0665) (0.0333)
ln(total assetst/total assetst−1) (tvc) 0.7297*** 0.7298*** 0.7043*** 0.7666***
(0.0467) (0.0470) (0.0842) (0.0517)
Provincial dummies Yes Yes Yes Yes
Year dummies Yes Yes Yes Yes
Industry dummies Yes Yes Yes Yes
Other dummies Yes Yes Yes Yes
Observations 49,858 46,467 13,877 34,979
Robust standard errors in parentheses (*** P<0.01, ** P<0.05, * P<0.1). Time–variant covariates are noted with
(tvc). Other dummies include Zero total revenue𝑡 , Zero liabilities𝑡 , Zero fixed assets𝑡 , Zero total labor𝑡−1 ,
Zero total assets𝑡−1, and Zero total assets𝑡.
28
Appendix 4 Hazard ratio of exit with g(t)=exp(–0.14×t)
2002–2011 2006–2011 2006–2011 2006–2011
(1) (2) (3) (5)
VARIABLES Haz. ratio Haz. ratio Haz. ratio Haz. ratio
Joint–venture with SOE 1.1360 0.9223 0.9445 0.9208
(0.0928) (0.0944) (0.0977) (0.0942)
Joint–venture with other than SOE 1.3214*** 1.3508*** 1.3519*** 1.3480***
(0.0953) (0.1112) (0.1125) (0.1113)
Initial firm size 0.9993*** 0.9995*** 0.9995*** 0.9995***
(0.0002) (0.0002) (0.0002) (0.0002)
ln(total revenuet/labor costt) (tvc) 0.8450*** 0.8448*** 0.8446*** 0.8438***
(0.0161) (0.0176) (0.0177) (0.0176)
ln(liabilitiest/fixed assetst) (tvc) 1.0633*** 1.0626*** 1.0619*** 1.0637***
(0.0211) (0.0238) (0.0239) (0.0238)
ln(labort/labort−1) (tvc) 0.4488*** 0.4663*** 0.4681*** 0.4659***
(0.0250) (0.0335) (0.0329) (0.0332)
ln(total assetst/total assetst−1) (tvc) 0.7343*** 0.7676*** 0.7698*** 0.7665***
(0.0484) (0.0524) (0.0523) (0.0522)
ln(foreign capitalt/total capitalt) (tvc) 0.7121*** 0.7140*** 0.7324** 0.7116***
(0.0765) (0.0866) (0.0934) (0.0866)
Japan 0.5721*** 0.5535*** 0.5544*** 0.5521***
(0.0522) (0.0567) (0.0567) (0.0566)
USA 0.9668 0.9299 0.9345 0.9255
(0.1021) (0.1109) (0.1114) (0.1106)
Taiwan 0.6905*** 0.6413*** 0.6403*** 0.6413***
(0.0576) (0.0611) (0.0612) (0.0613)
China 0.9776 0.8874 0.8871 0.8884
(0.0969) (0.1027) (0.1029) (0.1030)
Hong Kong (China) 0.8233 0.6147*** 0.6129*** 0.6130***
(0.0986) (0.0982) (0.0986) (0.0981)
Korea 1.0729 0.9293 0.9324 0.9275
(0.0808) (0.0792) (0.0794) (0.0791)
Russia 1.7005*** 2.0662*** 1.9153*** 2.0900***
(0.2734) (0.3699) (0.3516) (0.3733)
France 0.7769* 0.6627** 0.6619** 0.6662**
(0.1071) (0.1117) (0.1121) (0.1121)
Germany 0.7545 0.6573* 0.6566* 0.6566*
(0.1423) (0.1512) (0.1518) (0.1512)
Belgium 0.9470 0.9570 0.9521 0.9577
(0.2476) (0.2597) (0.2577) (0.2602)
Denmark 0.9554 1.0872 1.0943 1.0869
(0.1929) (0.2205) (0.2231) (0.2202)
Italy 1.1107 0.8354 0.8351 0.8403
(0.3793) (0.3703) (0.3740) (0.3731)
Netherlands 0.6922 0.5952* 0.5998* 0.5946*
(0.1668) (0.1656) (0.1680) (0.1654)
Norway 0.8486 0.9990 1.0323 1.0017
(0.3569) (0.4196) (0.4362) (0.4213)
Thailand 0.7381* 0.5903** 0.5929** 0.5923**
(0.1276) (0.1287) (0.1293) (0.1292)
Singapore 0.7486*** 0.6947*** 0.6991*** 0.6952***
(0.0767) (0.0799) (0.0803) (0.0799)
29
Appendix 4 (Cont.) (1) (2) (3) (4)
Indonesia 0.7710 1.0226 1.0339 1.0337
(0.4347) (0.5654) (0.5695) (0.5700)
The Philippines 1.4561 1.2105 1.1938 1.2087
(0.3430) (0.3364) (0.3329) (0.3359)
Malaysia 0.8629 0.8130 0.8198 0.8137
(0.1168) (0.1248) (0.1253) (0.1250)
Low entry costs 1.2260*
(0.1352)
Low entry costs (tvc) 1.1079
(0.1478)
Transparency 1.2582
(0.1840)
Transparency (tvc) 0.9117
(0.1772)
Low time costs 0.7076***
(0.0779)
Low time costs (tvc) 1.1616
(0.1730)
First principal component 0.9583
(0.0957)
First principal component (tvc) 1.1647
(0.1422)
Provincial dummies Yes Yes Yes Yes
Year dummies Yes Yes Yes Yes
Industry dummies Yes Yes Yes Yes
Other dummies Yes Yes Yes Yes
Observations 46,467 34,979 34,979 34,979
Robust standard errors in parentheses (*** P<0.01, ** P<0.05, * P<0.1). Time–variant covariates are noted with
(tvc). Other dummies include Zero total revenue𝑡 , Zero liabilities𝑡 , Zero fixed assets𝑡 , Zero total labor𝑡−1 ,
Zero total assets𝑡−1 , Zero total assets𝑡 , zero capital share value of Vietnamese partner
( Zero Vietnamese partner𝑡 ) and missing information of the capital share value of Vietnamese partner
(Missing Vietnamese partner𝑡).