Embed Size (px)
Citation preview

The role of finance in environmental innovationdiffusion: an evolutionary modeling approach
Paola D’Orazio
Chair of Macroeconomics & Research Department Closed Carbon Cycle EconomyRuhr-Universität Bochum
(Germany)
OeNB Summer School 2020The Economics of Climate Change: a Central Bank Perspective
Paola D’Orazio 1 / 43

Introduction
Introduction
Paola D’Orazio 2 / 43

Introduction Aim
P. D’Orazio and M. Valente, (2019) The role of finance in environmental innovationdiffusion: An evolutionary modeling approach, Journal of Economic Behavior andOrganization, pp. 417-439, vol. 162 (Link)
Aim of the researchAddress the issue of financial constraints as a relevant barrier to eco-innovationdiffusionAddress the green finance gap and understand how it is related to (environmental)technological progressStudy the role of public-private partnership through the action of a stateinvestment bank (subsidiarity principle)
Paola D’Orazio 3 / 43

Introduction Aim
Contributions
Literature on environmental innovation-(green)finance nexusSeveral evolutionary models that study the role of demand for market dynamics;
Few ABM studies take into account the interaction among the demandside, the supply side and its innovation dynamics, and the financialside (See, e.g., Vitali et al., 2013; Caiani et al., 2014; Fagiolo et al.,2017; Lauretta, 2018);Existing literature lacks models that address the importance of climatefinance aimed at fostering green technologies for a sustainableeconomic transition.
Policy applications of ABMs: Implementation and analyses of green finance inABM
Paola D’Orazio 4 / 43

Introduction Background
Environmental concerns and policies
COP21 goalsstrengthen the global response to the threat of climate change by keeping a globaltemperature rise this century well below 2°C
What should be done to achieve the goals?According to COP21 agreement:
Gather appropriate financial flows (Art. 2, point c)Set up a new technology frameworkDevelop an enhanced capacity building at global level
Paola D’Orazio 5 / 43

Introduction Background
Barriers to eco-innovation diffusion
The implementation of adaptation and mitigation policies is based on thedevelopment of green technologies whose diffusion is constrained by a number of“barriers”, i.e., costs, markets, knowledge, finance (D’Este et al., 2012)Green innovation is inherently different from other types of innovation processes:double-externality feature (Rennings, 2000).
Paola D’Orazio 6 / 43

Introduction Background
Factors affecting financial barriers
Features of the post-crisis financial framework:Low willingness by banks to lend, especially long-term (green)→ short-termism (Haldane, 2011)→ The availability of financial capital for green investments is relevantespecially for Europe, whose economy is significantly more dependent on bankintermediation than other economies (see Beck and Demirguc-Kunt, 2006;Ayyagari et al., 2007; Hernández-Cánovas and Martínez-Solano, 2010; Namara etal., 2017, among others).Financial instability→ affects investments’ dynamics especially at the level of small and mediumfirms
The green finance gapThe resulting “green finance gap”, i.e. the lack of sufficient financial resources to bedirected towards green investments, is particularly relevant for the transition towards alow-carbon economy
Paola D’Orazio 7 / 43

The complexity approach Methodology
Methodology
Paola D’Orazio 8 / 43

The complexity approach Methodology
Our ABM model study
ABM approach allows us to:study the complex patterns emerging from the interaction of consumerpreferences and firms’ technology;incorporate heterogeneity and bounded rationality of interacting individualdecision-makers;incorporate different institutional settings and conduct scenario analyses;include interactions in the financial market;study complex technology adoption and diffusion dynamics.
Paola D’Orazio 9 / 43

The complexity approach Methodology
Definition
An agent-based model is a computerized simulation of a number ofdecision-makers (agents) and institutions, which interact through prescribedrules.The agents can be as diverse as needed - from consumers to policy-makersand Wall Street professionals - and the institutional structure can includeeverything from banks to the government.Such models do not rely on the assumption that the economy will movetowards a predetermined equilibrium state, as other models do.Instead, at any given time, each agent acts according to its current situation,the state of the world around it and the rules governing its behaviour.(Farmer and Foley, 2009, p.685)
Paola D’Orazio 10 / 43

The complexity approach Methodology
The economy as a complex system
several stationary states (“multi-stability”), and the resulting outcome maydepend on the previous history (such as the size of occurring perturbations, theinitial state��, etc., and such history-dependencies are often called ��hysteresiseffect)“out of equilibrium” and behave in non-stationary ways.“self-organization”: periodic or non-periodic oscillations, “chaotic” or “turbulent”behaviornew, “emergent” properties, which cannot be understood from the properties oftheir system elements (“the system is more than the sum of its parts”)many of the above features are results of strong interactions which can often leadto counter-intuitive (vs deterministic) behaviors.
Paola D’Orazio 11 / 43

The complexity approach Methodology
Comparison of methodologies
Equilibrium approach Agent-based approachAgents 1,2 or ∞ N large but finite
fully rational simple entitiesoptimizing sophisticated learningno history adaptive behaviors
Interactions frictions local interactionspath dependency
Time Timeless TimelyHeterogeneity Homogeneous Persistently heterogeneous:
Possibly heterogeneous, diversity mattersbut diversity does not matter
System behavior Optimizing: Adaptiveonly equilibrium states count equilibria possibly irrelevant
emergent (self-organized) properties
Paola D’Orazio 12 / 43

The complexity approach Methodology
Cross-Fertilisation of approaches
Paola D’Orazio 13 / 43
The complexity approach Methodology
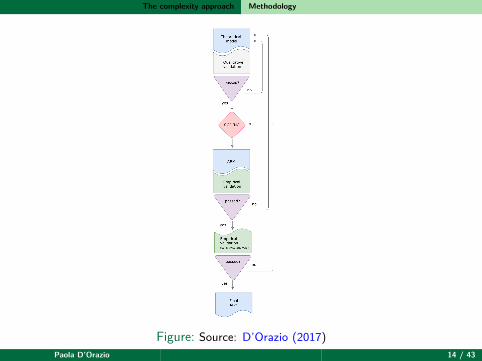
Figure: Source: D’Orazio (2017)Paola D’Orazio 14 / 43

The complexity approach Methodology
Critiques and ways out
Main critiques1 ABMs are “black boxes”2 Too many degrees of freedom: ad-hoc assumptions regarding behavioral rules3 Validation: poor link with data
Ways out1 Use of ODD protocols (Overview, Design concepts and details); promote
reproducibility; use of UML (Unified Modeling Language); counterfactual analysisand sensitivity analysis; use of “modeling principles” (see Tesfatsion, 2017)
2 Use empirical and experimental evidence (strong link with behavioral economics),important potential link with big data (D’Orazio, 2017)
3 Recent research developments: simulated minimum distance methods, machinelearning techniques, data-driven identification in VAR models (see Fagiolo et al.,2007, 2019, for a comprehensive review)
Paola D’Orazio 15 / 43

The complexity approach Features of the ABM
Features of the ABM
Paola D’Orazio 16 / 43

The complexity approach Features of the ABM
The model
The production sector is populated by heterogeneous firms that compete in themarket and receive goods’ demand from the consumption sector S1
Firms have the same cost structures, the mark-up is fixed and offer goods that aredifferentiated along three dimensions (qualities)
user quality: positively evaluated by consumers and represents theperformance of the product as used by consumers;efficiency: preference of consumers for cheaper products and iscomputed as a negative function of the price;environmental quality: positively evaluated by consumers, andnegatively related to the environmental impact caused by the product;
S2
Product innovation is the only process that allows firms to improve theircompetitive position;
Paola D’Orazio 17 / 43

The complexity approach Features of the ABM
The technological landscape is constrained: innovation is used to improve one ofthe 3 products’ characteristics S3B
Each firm determines its innovation strategy in terms of probabilities to engage inspecific R&D projects: the probabilities are the strategic profile of a company,determining which innovation pattern they are built to follow (Randomly set whenthe firm enters the market and does not change during its lifetime);Once the type of innovation project has been chosen, the firm tries to get a loanto finance it;Assumption: firms (SMEs) resort always to external credit in order to financetheir innovation strategies; we thus rule out any possibility to resort to other formsof financing or to use a detailed capital structure;
Paola D’Orazio 18 / 43
The complexity approach Features of the ABM
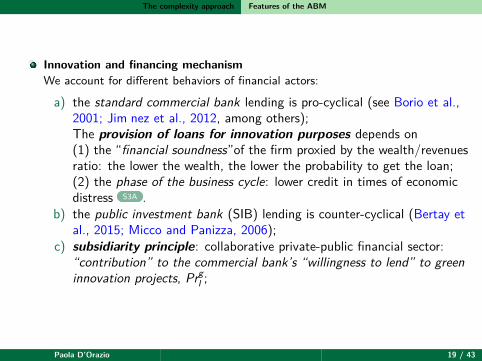
Innovation and financing mechanismWe account for different behaviors of financial actors:
a) the standard commercial bank lending is pro-cyclical (see Borio et al.,2001; Jim�nez et al., 2012, among others);The provision of loans for innovation purposes depends on(1) the “financial soundness”of the firm proxied by the wealth/revenuesratio: the lower the wealth, the lower the probability to get the loan;(2) the phase of the business cycle: lower credit in times of economicdistress S3A .
b) the public investment bank (SIB) lending is counter-cyclical (Bertay etal., 2015; Micco and Panizza, 2006);
c) subsidiarity principle: collaborative private-public financial sector:“contribution” to the commercial bank’s “willingness to lend” to greeninnovation projects, Prg
l ;
Paola D’Orazio 19 / 43

The complexity approach Features of the ABM
Figure: The financing process
Paola D’Orazio 20 / 43

The complexity approach Features of the ABM
Aggregate income levels depend on the types of innovation performed by firmsand by the “type” of finance available in the economyGrowth rate
GT(t) = [ωgΘg(t) + ωbΘb(t)− ωcΘc(t)](Gmax − Gmin)
2 + Gmin (1)
environmental innovation (ωg +)product innovation, i.e., user quality innov (ωb +)process innovation, i.e., efficiency/cost reduction innov (ωc -)
Paola D’Orazio 21 / 43

Validation
Validation
Paola D’Orazio 22 / 43
Validation
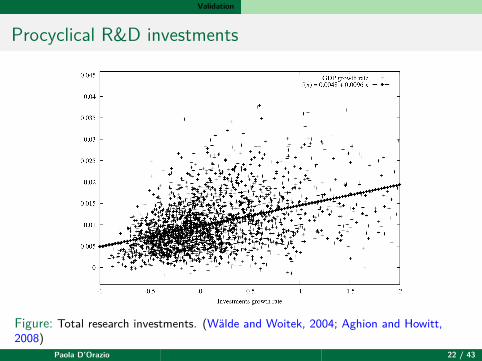
Procyclical R&D investments
Figure: Total research investments. (Wälde and Woitek, 2004; Aghion and Howitt,2008)
Paola D’Orazio 22 / 43

Validation
Firms’ size distribution: right skewed
Figure: Market shares distribution measured at the end of a simulation run and limitedto firms with a sales above a minimal threshold, comprising roughly 25% of all firmsexisting at that time. (Kwasnicki, 1998; Axtell, 2001; Gaffeo et al., 2003)
Paola D’Orazio 23 / 43

Validation
GDP growth rate distribution: fat-tailed
Figure: Frequencies of one-period GDP growth rates. (Fagiolo et al., 2008; Franke,2015; Williams et al., 2017)
Paola D’Orazio 24 / 43

Simulation
Simulation
Paola D’Orazio 25 / 43
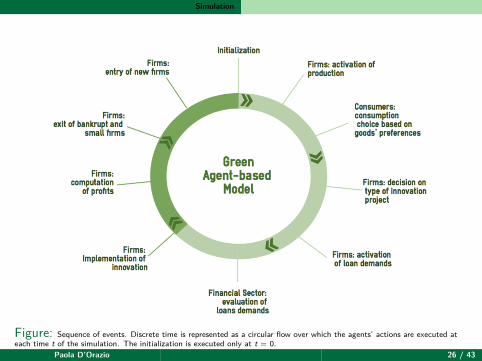
Simulation
Figure: Sequence of events. Discrete time is represented as a circular flow over which the agents’ actions are executed ateach time t of the simulation. The initialization is executed only at t = 0.
Paola D’Orazio 26 / 43

Results
Results
Paola D’Orazio 27 / 43

Results
Scenarios
Scenario Parametrization Financial sectorPrivate SIBBank
1 Constant supply No entry/exita. only user quality λb = 1, λe = 0, λg = 0 ✓b. only green quality λb = 0, λe = 0, λg = 1 ✓c. green & user quality λb = 0.5, λe = 0, λg = 0.5 ✓
2 Even Preferences λb = 0.3, λe = 0.3, λg = 0.3a. Standard financing ✓b. Extra green financing σ = 0.2 ✓ ✓
3 Low green preferences λb = 0.4, λe = 0.4, λg = 0.2a. Standard financing ✓b. Extra green financing σ = 0.2 ✓ ✓
4 Hampered green innovation Prgl = 40%
a. Standard financing ✓b. Extra green financing σ = 0.2 ✓ ✓
Table: Overview of the sensitivity analysis and policy scenarios
Paola D’Orazio 28 / 43

Results Baseline scenario
Baseline scenario
Innovation drives the success of the firm: different demand landscapes reward adifferent type of firm in each of the 3 preferences casesTo be successful, a firm has to innovate the product quality most appropriate tothe type of consumers in the market
Paola D’Orazio 29 / 43

Results Equally distributed preferences
Paola D’Orazio 30 / 43

Results Low preferences for green
Paola D’Orazio 31 / 43

Results Hampered green quality
Paola D’Orazio 32 / 43
Results GDP dynamics
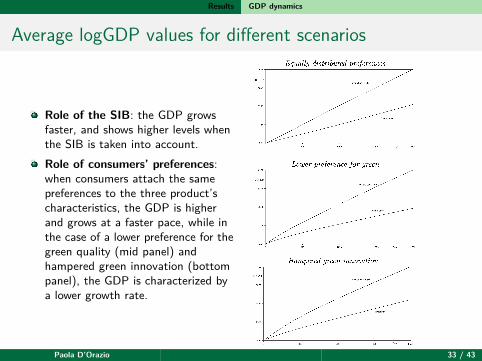
Average logGDP values for different scenarios
Role of the SIB: the GDP growsfaster, and shows higher levels whenthe SIB is taken into account.Role of consumers’ preferences:when consumers attach the samepreferences to the three product’scharacteristics, the GDP is higherand grows at a faster pace, while inthe case of a lower preference for thegreen quality (mid panel) andhampered green innovation (bottompanel), the GDP is characterized bya lower growth rate.
Paola D’Orazio 33 / 43
Final remarks & policy implications
Final remarks&
policy implications
Paola D’Orazio 34 / 43

Final remarks & policy implications
Final remarks
Positive aggregate effect of the subsidiarity principle: the level of aggregate greenquality and firms’ green propensity to innovate are higher in presence of a publicinvestment bank that explicitly supports the standard commercial bank “attitude”towards environmental projects;The highest levels of green quality are achieved when the presence of the SIB iscombined with strong consumers’ preferences oriented towards the environmentalquality;
Paola D’Orazio 35 / 43

Final remarks & policy implications
Policy implications I
At the moment, the so-called “Paris effect” on climate finance is difficult to bedetected ⇒ potential crucial role for public investments banks in improving thefunctioning of the financial system and sustain economic resilience by filling theso-called green financial gapSuccessful case studies of active SIB: Brazilian BNDES (Banco Nacional deDesenvolvimento Economico e Social) and the German KfW (Kreditanstalt fürWiederaufbau);
Paola D’Orazio 36 / 43

Final remarks & policy implications
Policy implications II
Case of green investment banks in Germany
Investment gap Main energy policies Total GHG emissionsand tot. investm.
Figure: Source: D’Orazio and Löwenstein (2020)
Despite the rapid growth of renewable energy investments in the past decades andthe progressive reduction of GHG emissions, the country is facing difficulties inmeeting the desired targets.
Paola D’Orazio 37 / 43

Final remarks & policy implications
Policy implications III
A more significant commitment to “greening” the financial sector and scale-upgreen finance is needed also from the private financial sector → to generateconsiderable financial resources for mitigation measures, thus amplifying the actionof the public investors, keeping in mind the concerns for climate-related financialinstability (D’Orazio and Popoyan, 2019)
Paola D’Orazio 38 / 43

Final remarks & policy implications
References
Paola D’Orazio 40 / 43

Final remarks & policy implications
References I
Aghion, P. and Howitt, P. W. (2008). The economics of growth. MIT press.Axtell, R. L. (2001). Zipf distribution of us firm sizes. science, 293(5536):1818–1820.D’Este, P., Iammarino, S., Savona, M., and von Tunzelmann, N. (2012). What hampers
innovation? revealed barriers versus deterring barriers. Research policy,41(2):482–488.
D’Orazio, P. (2017). Big data and complexity: Is macroeconomics heading toward anew paradigm? Journal of Economic Methodology, 24(4):410–429.
D’Orazio, P. and Löwenstein, P. (2020). Mobilising investments in renewable energy ingermany: which role for public investment banks? Journal of Sustainable Finance &Investment, pages 1–24.
D’Orazio, P. and Popoyan, L. (2019). Fostering green investments and tacklingclimate-related financial risks: Which role for macroprudential policies? EcologicalEconomics.
Fagiolo, G., Birchenhall, C., and Windrum, P. (2007). Empirical Validation inAgent-based Models: Introduction to the Special Issue. Computational Economics,30(3):189–194.
Paola D’Orazio 41 / 43

Final remarks & policy implications
References II
Fagiolo, G., Guerini, M., Lamperti, F., Moneta, A., and Roventini, A. (2019). Validationof agent-based models in economics and finance. In Computer Simulation Validation,pages 763–787. Springer.
Fagiolo, G., Napoletano, M., and Roventini, A. (2008). Are output growth-ratedistributions fat-tailed? some evidence from oecd countries. Journal of AppliedEconometrics, 23(5):639–669.
Farmer, J. D. and Foley, D. (2009). The economy needs agent-based modeling. Nature,(460):685–686.
Franke, R. (2015). How fat-tailed is us output growth? Metroeconomica,66(2):213–242.
Gaffeo, E., Gallegati, M., and Palestrini, A. (2003). On the size distribution of firms:additional evidence from the g7 countries. Physica A: Statistical Mechanics and itsApplications, 324(1):117–123.
Haldane, A. (2011). The short long, 29th société universitaire européene de recherchesfinanciéres colloquium: New paradigms in money and finance?, brussels. Technicalreport, Bank of England.
Paola D’Orazio 42 / 43

Final remarks & policy implications
References III
Kwasnicki, W. (1998). Skewed distributions of firm sizes-an evolutionary perspective.Structural Change and Economic Dynamics, 9(1):135–158.
Tesfatsion, L. (2017). Modeling economic systems as locally-constructive sequentialgames. Journal of Economic Methodology, 24(4):384–409.
Wälde, K. and Woitek, U. (2004). R&d expenditure in g7 countries and the implicationsfor endogenous fluctuations and growth. Economics Letters, 82(1):91–97.
Williams, M. A., Baek, G., Li, Y., Park, L. Y., and Zhao, W. (2017). Global evidence onthe distribution of gdp growth rates. Physica A: Statistical Mechanics and itsApplications, 468:750 – 758.
Paola D’Orazio 43 / 43

Demand-Supply interaction
Each firm is assigned an index:
If = eλef × bλb
f × gλgf (2)
where λb and λg are the parameters that describe consumers’ preference for the userquality and green quality respectively, while λe = 1 − λb − λg. The index If is then usedto compute individual firms’ market shares
msf(t) =(
If(t)∑Fj=1 Ij(t)
)α
(3)
Efficiency quality:ef(t) =
Me1 + expγe(p(t)−p̂) (4)
Revenues:rf(t) = msf(t)× GDP(t − 1) (5)
Back to main .
Paola D’Orazio 1 / 3

Prices, profits, dividends and wealth dynamics of firms
Price:pf(t) = cf(t) (1 + µ) (6)
Fixed costs:fcf(t) = ψfcf(t − 1) + (1 − ψ)Φ× rf(t) (7)
Profits:πf(t) = (pf(t)− cf(t))
rf(t)pf(t)
− fcf(t) (8)
Wealth:sf(t) = (1 − δ)sf(t − 1) + πf(t) (9)
Back to main .
Paola D’Orazio 2 / 3

Innovation outcomes: effects on the qualities
Cost-reducing User quality Environmental qualityinnovation innovation innovation
cf(t) = cf(t − 1)− K cf(t) = cf(t − 1) + k cf(t) = cf(t − 1) + kbf(t) = bf(t − 1)− k bf(t) = bf(t − 1) + K bf(t) = bf(t − 1)− kgf(t) = gf(t − 1)− k gf(t) = gf(t − 1)− k gf(t) = gf(t − 1) + K
Table: Implications of a successful innovation project on the three product’scharacteristics. The improvement obtained on the targeted characteristic is K while thereduction on the two other characteristics is k < K/2.
Back to main .
Paola D’Orazio 3 / 3