Embed Size (px)
Citation preview

The Role of the Academic Library in Promoting Student Engagement in Learning1
George D. Kuh Robert M. Gonyea
College Student Experiences Questionnaire Research Program Center for Postsecondary Research, Policy, and Planning
School of Education Indiana University Bloomington
Bloomington, IN 47405 Telephone: 812-856-5824
Fax: 812-856-5150 Internet: [email protected]
Revised for publication in College and Research Libraries
April, 2003
1
Abstract
The Role of the Academic Library in Promoting
Student Engagement in Learning
This study examines the nature and value of undergraduate students’ experiences with the
academic library. The data represents responses from more than 300,000 students between 1984
and 2002 to the College Student Experiences Questionnaire. Though library use did not appear
to make independent contributions to desirable outcomes of college, such experiences were
related to important educationally valuable activities. Because the emphasis a campus places on
information literacy is a strong predictor of students becoming information literate, librarians
should re-double their collaborative efforts to promote the value of information literacy and help
create opportunities for students to evaluate the quality of the information they obtain.
2
The Role of the Academic Library in Promoting Student Engagement in Learning
It is hard to imagine a college without a library. A required stop on campus tours, the
library is the physical manifestation of the core values and activities of academic life. The size
of the collection is used as an indicator of academic quality. Though recent years have not
necessarily been kind in terms of budget support, the library’s central role in the academic
community is unquestioned.
It is almost heretical to ask (given the library’s iconic status as a symbol of academic
values), but just what does the library contribute to student learning, broadly defined? Student
learning certainly is not the only relevant dimension on which to appraise the library’s value and
utility. Nevertheless, in the increasingly harsh light of public accountability and financial
constraints, the question has never been more important or timely, nor can it be avoided.2 Three
major trends demand an answer. They are (1) unfettered asynchronous access to an
exponentially expanding information base; (2) a shift in the focus of colleges and universities
from teaching to learning; and (3) the expectation that all university functions and programs
demonstrate their effectiveness.
Awash in Information
With unlimited access to information via the Internet, the need for and practical value of
a physical repository for printed and other material are less compelling today. On average,
college students spend as much time on the Internet as they do studying.3 At the same time, the
information highway introduces new challenges uniquely positions for librarians to meet.4 To
state the obvious, not everything available electronically is valid and reliable. In the past,
knowledge gatekeepers (e.g., journal editors, publishers) and librarians determined what was
worth reading and collecting. Today, students make more of these judgments without assistance.
3
Only about half of all students are confident in their ability to find good information and about
the same percentage admit to having difficulty in judging the quality and accuracy of what they
do find.5 For this reason, students must develop a capacity for critical discernment to judge the
quality and utility of information, during and after college. The Association of College and
Research Libraries (ACRL) refers to the ability to “find, retrieve, analyze, and use information”
as information literacy.
One cannot become information literate without first acquiring the foundational skills and
competencies traditionally associated with general education – critical thinking and reasoning
abilities, written and oral communication skills, and so forth.6 According to Shapiro and
Hughes:
Information literacy should in fact be conceived more broadly as a new liberal art
that extends from knowing how to use computers and access information to
critical reflection on the nature of information itself, its technical infrastructure,
and its social, cultural and even philosophical context and impact - as essential to
the mental framework of the educated information-age citizen as the trivium of
basic liberal arts (grammar, logic and rhetoric) was to the educated person in
medieval society.7
To prepare librarians for the task, ACRL developed five competence standards and
founded an Institute for Information Literacy (IIL) that, among other things, assists librarians in
working with others in the educational community to promote and cultivate information literacy.
One strategy suggested that librarians move out of the library into classrooms where they team-
teach courses with faculty colleagues from various disciplines. Most of this work takes place in
lower-division courses where, for better or worse, institutions emphasize general education skills
4
and competencies. At Indiana University Purdue University Indianapolis, for example, a
librarian serves on each of the four-person instructional teams (instructor, librarian, academic
advisor, student mentor) that deliver the Learning Community course designed for first-year
students.8 At Sonoma State University, a librarian teams with the instructor of the Freshman
Interest Group seminar to increase information competence.9
Embracing the Learning Paradigm
The shift from emphasizing teaching to focusing on student learning as the primary goal
of undergraduate education is gaining traction in all types of postsecondary institutions.10
Accreditors and policymakers are pushing and applauding this change in emphasis that promises
to have profound effects on many aspects of academic life. The implications for the library are
plain: students’ experiences with academic libraries should make direct or indirect contributions
to desired outcomes of college.11 In addition to information literacy, are there other outcomes
that library experiences could and should foster? The limited evidence on this point is mixed.
Powell summarized evidence that the use of the library correlated with student
persistence rates and college grades.12 However, he based his conclusions on studies that for the
most part did not control for student ability or institutional factors such as selectivity. A more
recent study, at Glendale Community College in California, showed that students who
participated in library workshops had much higher pass rates in English and ESL classes, but
again this study did not account for student ability.13 Considering factors that might influence
student performance, the relationships between the library and student performance are less
clear. For example, Ory and Braskamp reported positive relationships between using the library
and gains in critical thinking.14 Others, such as Terenzini et al., found negative relationships
between library experiences and critical thinking scores.15
5
The most probable explanation for the contradictory results related to critical thinking
and library use is that students use library resources in different ways. To illustrate, we can
divide library experiences into two types of activities.16 One is routine, but generally tentative
exploration, such as looking for information, reading assigned reference materials, and using the
facility primarily to study. The second type of use, and arguably more powerful in terms of
learning, is more focused exploration, analysis, and evaluation of information, driven by learner-
(or collaborative work group) generated questions or, perhaps, stimulated by problems
introduced by the instructor for which library resources are required to solve. Whitmire found
that the latter type of activity had a significant positive effect on student self-reported critical
thinking gains.17 These effects also appeared to be independent of key student characteristics
such as race and ethnicity.18
Demonstrating the Library’s Educational Value
The increasing interest from all quarters in information literacy and student learning
makes it difficult to ignore the heretical question posed at the outset: To what extent do libraries
today contribute to information literacy and other aspects of student learning? One way to
demonstrate the library’s contribution is to assess whether students’ experiences with the library
directly or indirectly contribute to desired outcomes of college. Using the library may also have
salutary effects, such as developing an appreciation of a wide range of literature or different
philosophies of life. To obtain and interpret this kind of information, librarians need to
understand the conditions that foster learning and how they might independently or with others
assess the outcomes associated with library experiences.
Decades of research on college student development point to two simple propositions that
account for many of the more important influences on student learning. First, the more time and
energy students invest in activities related to desired outcomes of college, the more likely they
6
are to benefit in those areas.19 Second, educationally effective institutions design experiences
that channel students’ energies toward educationally purposeful activities.20 Unfortunately, we
know relatively little about what and how students’ academic library experiences contribute to
desired outcomes of college (including information literacy) or about the nature of the
relationships between library use and college experiences that research studies show directly
affect student learning, such as student-faculty interaction, writing activities, and so forth.
Purpose
This study examines the nature and value of students’ experiences with the academic
library. Our aim is to discover the unique contributions of library experiences (including contact
with librarians) to the quality of effort students expend in other educationally purposeful
activities, the gains they report making during college, and their overall satisfaction with the
college experience. More specifically, we attempt to answer the following questions:
1. Has student use of various library resources changed between 1984 and 2002? That is,
given the availability of information via the web and other sources, are students using the
library more or less for certain reasons (for studying, for finding information)?
2. Is frequent use of the library associated with greater gains in information literacy? What
does the library contribute to other desired outcomes of college?
3. Finally, how does student use of library resources affect their engagement with effective
educational practices? That is, are students who frequent the library more likely to report
increased contact with faculty members inside and outside the classroom? Are they more
likely to talk with peers about substantive topics such as social, political and economic
issues? Serious conversations with other students may be an indicator of the extent to
which a college’s general education program animates lively discussions beyond the
7
classroom and initiates debates on new topics. Moreover, the more engaged students are
in these and other educationally purposeful activities, the more likely they are to engage
fully in productive activities after college, including civic participation and so on.
Methods
Instrument
The College Student Experiences Questionnaire (CSEQ) assesses the quality of effort
students devote to educationally purposeful activities. As mentioned earlier, quality of effort is
the single best predictor of what students gain from college;21 thus, this measure can also be used
to estimate the effectiveness of an institution or its component organizations (such as the library)
in promoting student learning.22 Overall, the CSEQ is considered to have excellent psychometric
properties.23
The fourth edition of the CSEQ is made up of 166 items divided into four sections.24 The
first section (18 items) asks for information about the student’s background (e.g., age, year in
school, major field, parents’ education), how many hours per week they study, how many hours
they work on and off campus, and how they are paying for their education. The second section
(111 items) contains the 13 College Activities scales (including experiences with the library and
computing and information technology) that measure the amount of time and energy (quality of
effort) students devote to various activities. The fourth edition of the CSEQ contains both a
revised library experiences scale and a computing and information technology scale that did not
appear on previous editions of the instrument. The response options for these items are 1=never,
2=occasionally, 3=often, and 4=very often. This section also includes two questions about the
amount of reading and writing students do. The third section (10 items) measures student
perceptions of the extent to which their institution’s environment emphasizes important
8
conditions for learning personal development, including the importance of information literacy.
Student responses are scored on a 7-point scale ranging from 7=strong emphasis to 1=weak
emphasis. Three questions gauge student opinions about the quality of relationships with faculty
members, administrative personnel, and other students on campus. Two additional questions
measure student satisfaction. In the final section, students estimate the extent to which they have
gained or made progress since starting college in 25 areas that represent desired outcomes of
higher education. Response options for the ‘Gains’ items are 1=very little, 2=some, 3=quite a
bit, and 4=very much.
Samples
To answer the three guiding research questions we draw on two overlapping samples of
students from the CSEQ Research Program at Indiana University Bloomington. The first sample
consists of more than 300,000 students from about 300 different four-year colleges and
universities who completed the second, third, and fourth editions of the CSEQ over a 19-year
period (1984 through 2002). The second sample is composed of more than 80,000 full-time
students from 131 baccalaureate degree-granting institutions who completed the fourth edition of
the CSEQ between 1998 and 2002. The background characteristics of the respondents in both
samples generally mirror the population of undergraduate students attending four-year colleges
and universities with a couple of exceptions. Women and White students are slightly over-
represented and men, Black students and Hispanic students are under-represented.25
Variables of Interest
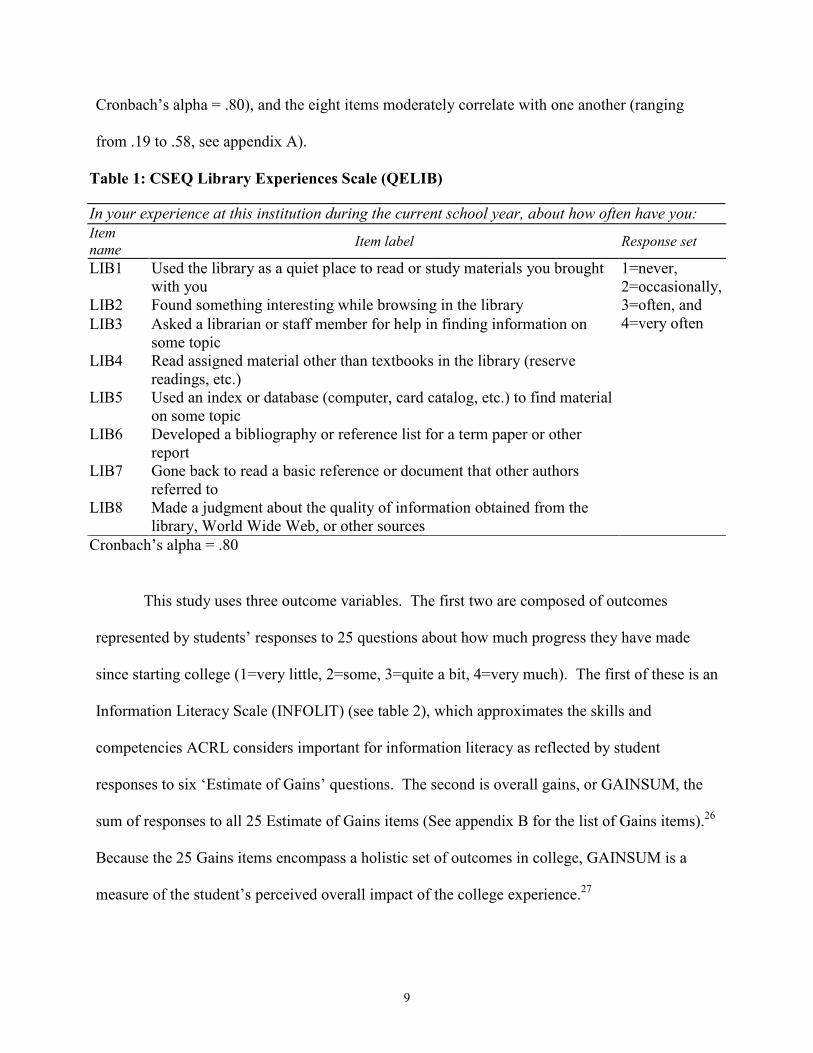
The particular variables of interest in this study are the eight items that make up the
CSEQ library experiences scale (QELIB) (see table 1). The scale is reliable (Table 1,
9
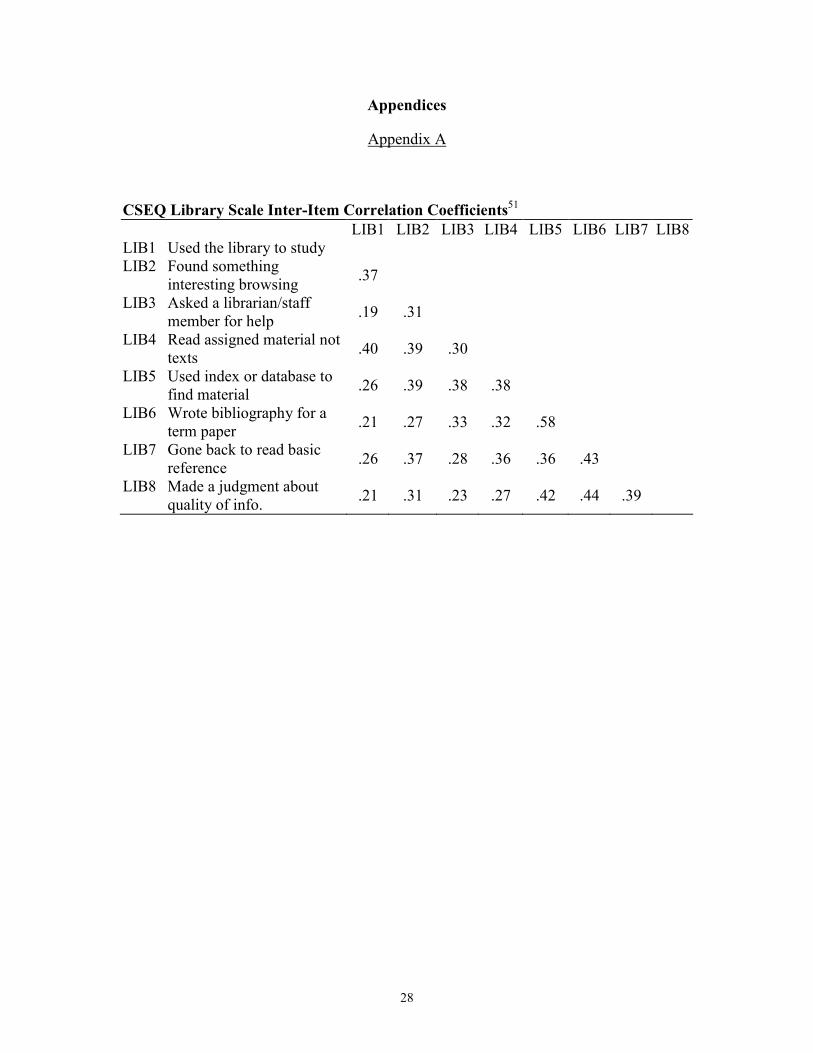
Cronbach’s alpha = .80), and the eight items moderately correlate with one another (ranging
from .19 to .58, see appendix A).
Table 1: CSEQ Library Experiences Scale (QELIB)
In your experience at this institution during the current school year, about how often have you: Item name Item label Response set
LIB1 Used the library as a quiet place to read or study materials you brought with you
LIB2 Found something interesting while browsing in the library LIB3 Asked a librarian or staff member for help in finding information on
some topic LIB4 Read assigned material other than textbooks in the library (reserve
readings, etc.) LIB5 Used an index or database (computer, card catalog, etc.) to find material
on some topic LIB6 Developed a bibliography or reference list for a term paper or other
report LIB7 Gone back to read a basic reference or document that other authors
referred to LIB8 Made a judgment about the quality of information obtained from the
library, World Wide Web, or other sources
1=never, 2=occasionally, 3=often, and 4=very often
Cronbach’s alpha = .80
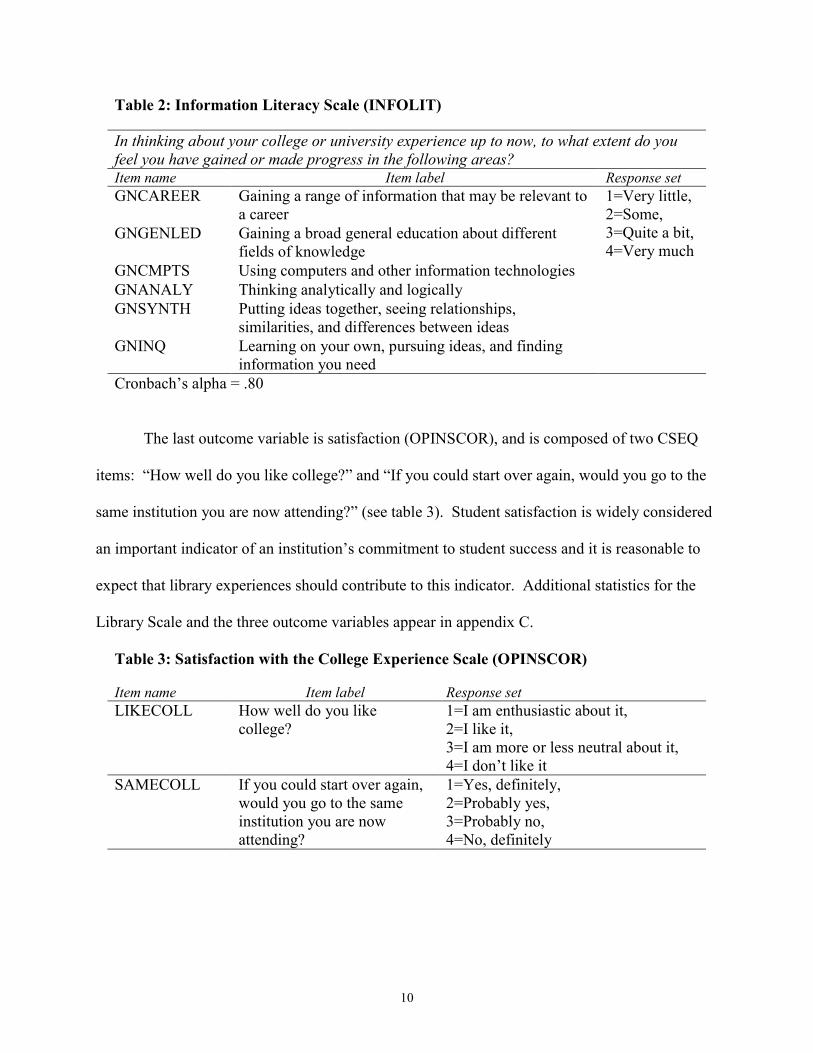
This study uses three outcome variables. The first two are composed of outcomes
represented by students’ responses to 25 questions about how much progress they have made
since starting college (1=very little, 2=some, 3=quite a bit, 4=very much). The first of these is an
Information Literacy Scale (INFOLIT) (see table 2), which approximates the skills and
competencies ACRL considers important for information literacy as reflected by student
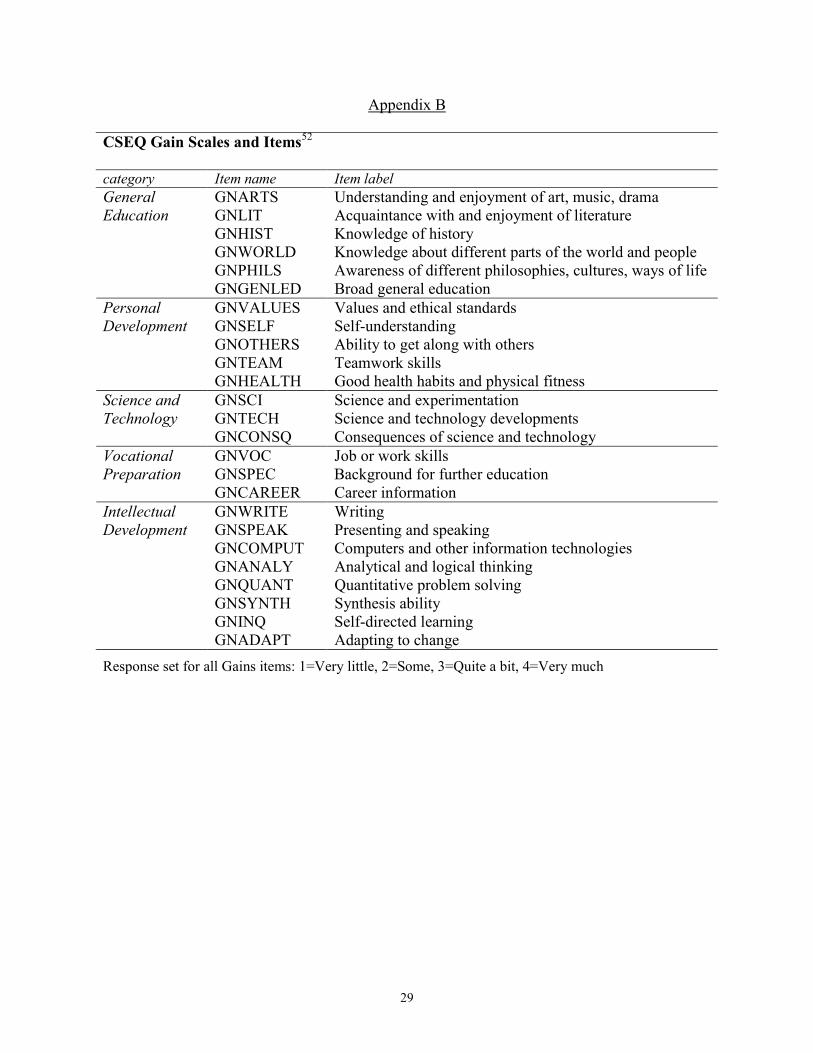
responses to six ‘Estimate of Gains’ questions. The second is overall gains, or GAINSUM, the
sum of responses to all 25 Estimate of Gains items (See appendix B for the list of Gains items).26
Because the 25 Gains items encompass a holistic set of outcomes in college, GAINSUM is a
measure of the student’s perceived overall impact of the college experience.27
10
Table 2: Information Literacy Scale (INFOLIT)
In thinking about your college or university experience up to now, to what extent do you feel you have gained or made progress in the following areas? Item name Item label Response set GNCAREER Gaining a range of information that may be relevant to
a career GNGENLED Gaining a broad general education about different
fields of knowledge GNCMPTS Using computers and other information technologies GNANALY Thinking analytically and logically GNSYNTH Putting ideas together, seeing relationships,
similarities, and differences between ideas GNINQ Learning on your own, pursuing ideas, and finding
information you need
1=Very little, 2=Some, 3=Quite a bit, 4=Very much
Cronbach’s alpha = .80
The last outcome variable is satisfaction (OPINSCOR), and is composed of two CSEQ
items: “How well do you like college?” and “If you could start over again, would you go to the
same institution you are now attending?” (see table 3). Student satisfaction is widely considered
an important indicator of an institution’s commitment to student success and it is reasonable to
expect that library experiences should contribute to this indicator. Additional statistics for the
Library Scale and the three outcome variables appear in appendix C.
Table 3: Satisfaction with the College Experience Scale (OPINSCOR)
Item name Item label Response set LIKECOLL How well do you like
college? 1=I am enthusiastic about it, 2=I like it, 3=I am more or less neutral about it, 4=I don’t like it
SAMECOLL If you could start over again, would you go to the same institution you are now attending?
1=Yes, definitely, 2=Probably yes, 3=Probably no, 4=No, definitely

11
Data Analysis
To answer the first research question, “Has student use of the library changed over time?”
we examined seven library experience items that remained exactly or essentially the same on the
second, third, and fourth editions of the survey, spanning the years 1984 through 2002. One
exception is the second and third edition question “How often have you used a card catalogue.”
On the fourth edition of the CSEQ this item was changed to, “How often have you used an index
or database (computer, card catalog, etc.) to find material on some topic?” We mapped student
responses to this set of library experience items by charting the combined yearly percentage of
students responding “often” or “very often” to each item.
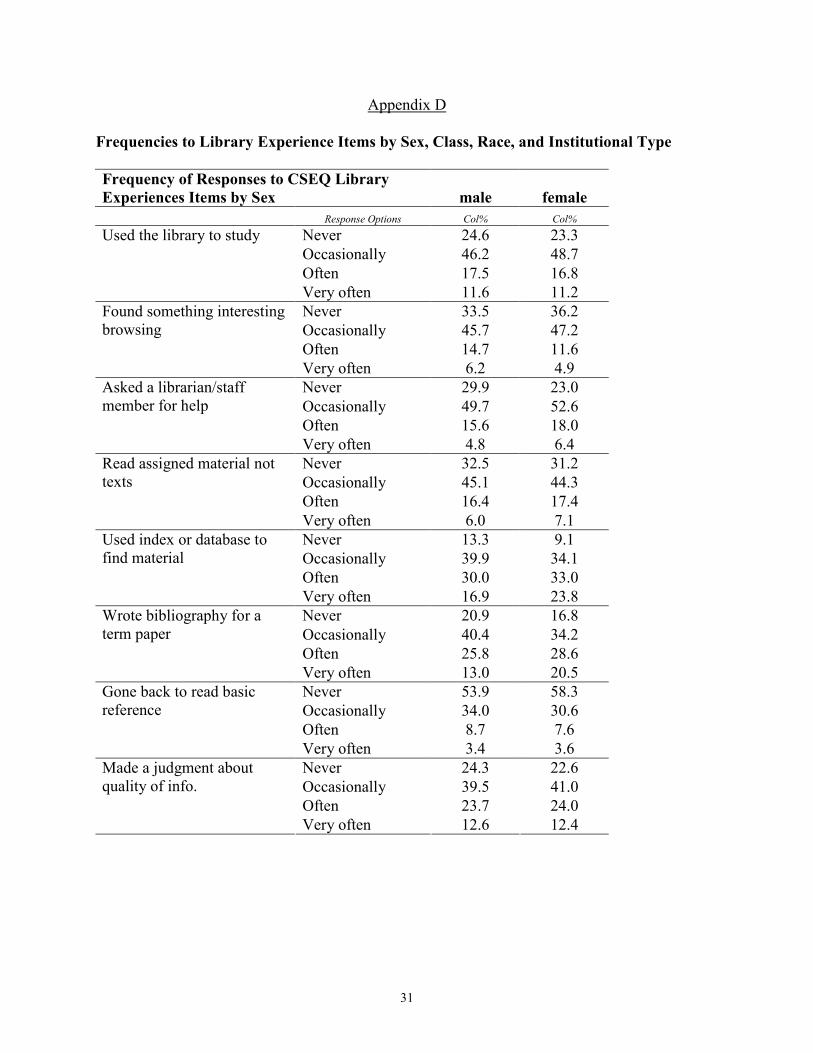
To answer the second and third questions we examined the frequencies of responses to
the library experiences items by gender, year in school, race and institutional type (see appendix
D for frequency tables). We also conducted analysis of variance tests to determine whether
groups differed significantly on their use of the library and in their self-reported gains. Finally,
we conducted a series of regression analyses to examine the relationships among variables
(regression tables are available from the authors).
Student characteristics and institutional characteristics can affect student collegiate
experiences and outcomes.28 For example, students majoring in the humanities (which include
more women than men) may be more likely to use the library facility because the nature of their
academic work requires more reading and, therefore, a greater need to obtain a variety of
reference material. For this reason, we dummy coded gender (women as reference group) and
major field (pre-professional as reference group). We also dummy coded race and ethnicity
(White as reference group) and class level (freshmen as reference group) because the success of
these groups of students are of keen interest to institutions and policy makers.
12
The regression analyses also control for three institutional characteristics: (1)
institutional type as defined by the 2000 Carnegie classification (doctoral/research-extensive
universities, doctoral/research-intensive universities, master’s colleges and universities,
baccalaureate liberal arts colleges, and baccalaureate general colleges),29 (2) institutional
selectivity,30 and (3) institutional control (public and private, with public institutions as reference
group). The Carnegie classifications were dummy coded and entered into the models with
doctoral/research-extensive universities as the reference group.
Four regression models were constructed. In the first model, the Library Experiences
scale (QELIB) is the dependent variable and student and institutional characteristics are control
variables. Then, we added selected items from the CSEQ College Activities scales that are
conceptually associated with library use to determine which may account for an additional
portion of variance in the Library scale. These items are use of computer and information
technology, course learning activities, interactions with faculty members, writing experiences,
and use of campus facilities.
The three remaining regression models examine the contribution of library experiences to
three outcome measures: (1) gains in information literacy (INFOLIT), (2) overall gains in college
(GAINSUM), and (3) satisfaction with the college experience (OPINSCOR). Control variables
in each model included student and institutional characteristics, perceptions of the campus
environment, and the academic challenge scale (see table 4). We controlled for academic
challenge because students at institutions that have high performance expectations for academic
work are more likely to use the library. Finally, we added the library activity items to the model
to see if they would explain additional variance in the outcome measure.
13
Table 4: Academic Challenge Items31
Item name Item Response set STUDIES4 Hours per week on out of class academic
work 1=Up to 5, 2=6-10, 3=11-15, 4=16-20, 5=21-25, 6=26-30, 7=30+
READTXT4 Number of texts read READPAK4 Number of course packets read WRITTRM4 Number of term papers written
1=none, 2=fewer than 5, 3=between 5 and 10, 4=between 10 and 20, 5=more than 20
COURSE5 Put together different facts and ideas COURSE11 Worked on project integrating ideas COURSE8 Applied class material to other areas FAC9 Worked to meet faculty expectations FAC5 Worked harder due to instructor feedback
1=never, 2=occasionally, 3=often, and 4=very often
ENVSCH4 Emphasis on developing academic, scholarly, and intellectual qualities
ENVCRIT4 Emphasis on developing critical, evaluative, and analytical qualities
7=strong emphasis to 1=weak emphasis
Cronbach’s alpha = .74
In reporting the regression results, we will focus only on those findings that are both
statistically significant and have reasonable effect sizes. That is, our objective is to identify
library experiences that have practical implications as well as statistical significance.32 To do
this we computed Y-standardized effect sizes by dividing the unstandardized coefficient by the
standard deviation for the dependent variable.33 We considered effect sizes greater than |.08|
worthy of attention because they represent potentially important relationships between library
experiences, gains from college (including information literacy), and student satisfaction.34
Results
Trend Analysis
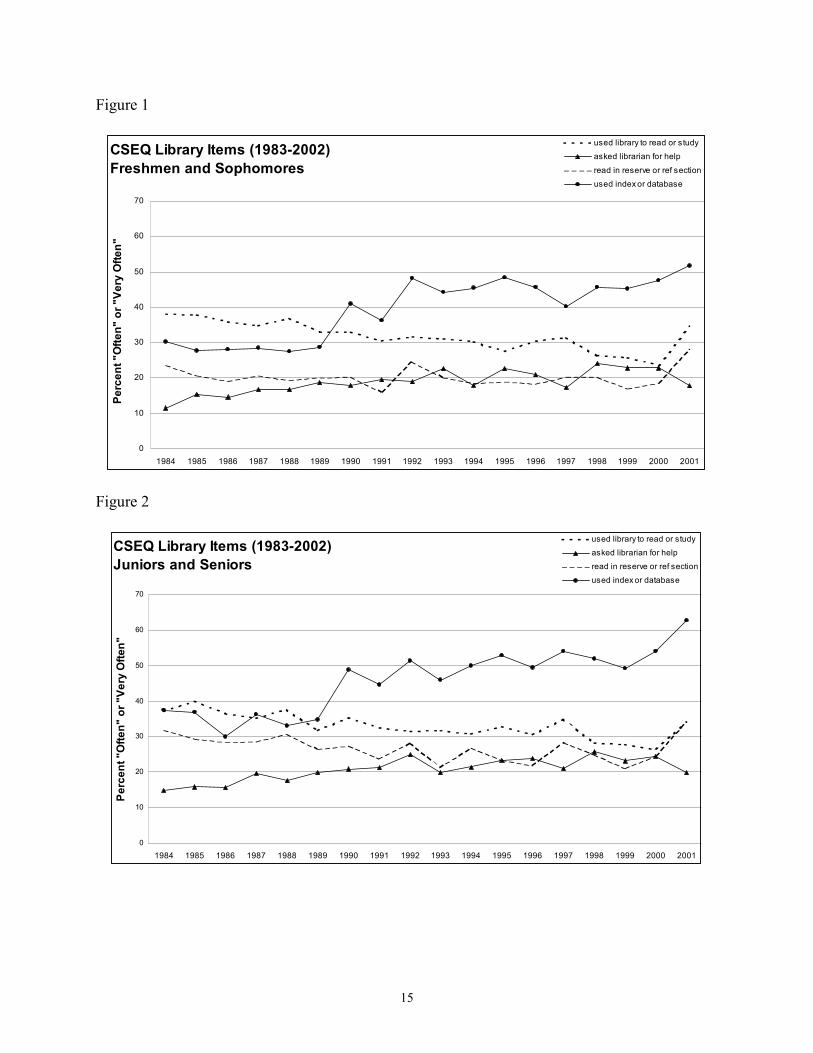
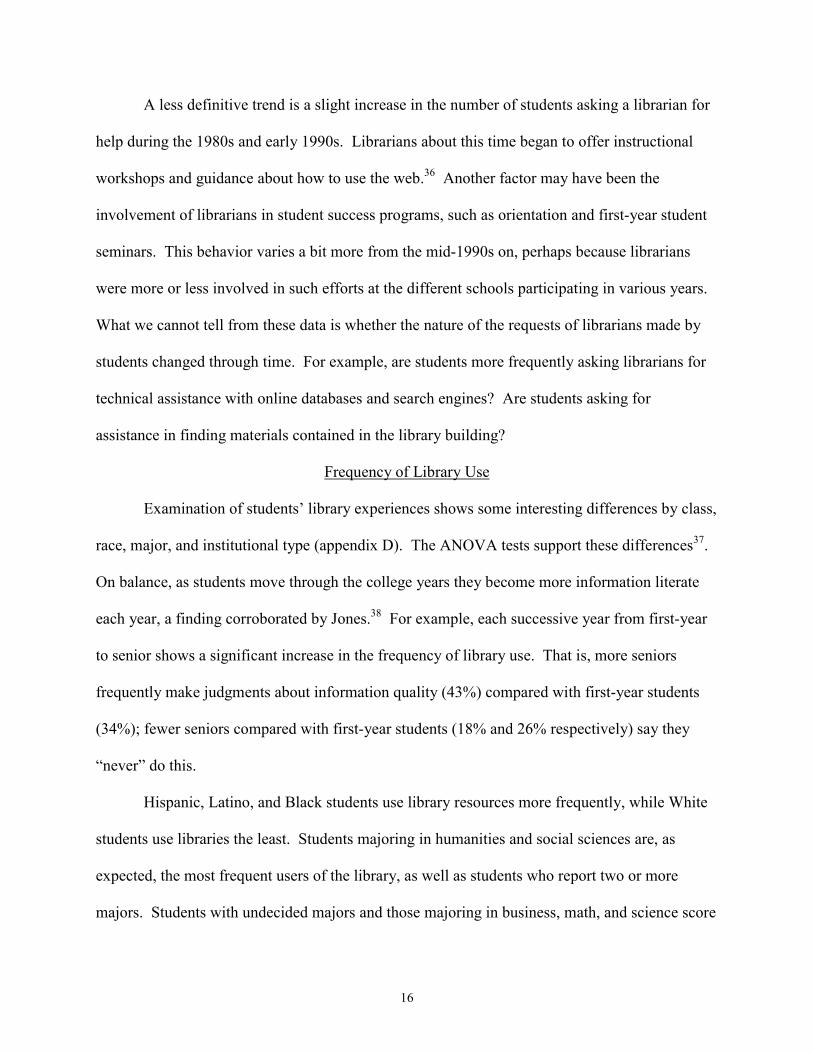
Figures 1 and 2 depict the proportions of first-year and sophomore students (combined)
and juniors and seniors (combined) that responded “often” or “very often” to four selected
library experiences between 1984 and 2002. These activities are: (1) used the library to read or
14
study, (2) asked a librarian for help, (3) read in the library’s reserve or reference section, and (4)
used an index or database. These four experiences showed the greatest changes over the 19-year
period, with the other four library experiences being generally stable. Because different students
and institutions participate in a given year, year-to-year deviations from the trend line are
common. Nevertheless, the overall multi-year trends probably reflect meaningful changes over
time.
Two trends stand out. First, greater numbers of students are using indexes and databases
to find information. This likely reflects the rapid and expansive deployment and use of
computers and information technology during the past decade that makes more information
accessible to more people as well as easier to navigate. To illustrate, in the mid-1980s only
about 30% of first-year and sophomore students said they frequently used indexes or databases.
Beginning in the early 1990s, this percentage jumped to close to half. Juniors and seniors
showed similar increases, from about 38% in the 1980s to over 60% by 2001.
The second trend is the decline in the proportion of students who use the library as a
place to read or study. This is probably due to the explosion of the World Wide Web in the mid-
1990s, making it possible for many students to access information and library resources online
from their dorm rooms, fraternity and sorority houses, other campus locations, and off-campus
residences.35 Another factor may be the availability of additional campus venues where students
can do academic work such as computer labs, academic support centers, and study lounges in
campus unions or residence halls. These locations may be especially attractive to commuter
students if parking near the library is problematic.
15
Figure 1
CSEQ Library Items (1983-2002)Freshmen and Sophomores
0
10
20
30
40
50
60
70
1984 1985 1986 1987 1988 1989 1990 1991 1992 1993 1994 1995 1996 1997 1998 1999 2000 2001
Perc
ent "
Ofte
n" o
r "Ve
ry O
ften"
used library to read or studyasked librarian for helpread in reserve or ref sectionused index or database
Figure 2
CSEQ Library Items (1983-2002)Juniors and Seniors
0
10
20
30
40
50
60
70
1984 1985 1986 1987 1988 1989 1990 1991 1992 1993 1994 1995 1996 1997 1998 1999 2000 2001
Perc
ent "
Ofte
n" o
r "Ve
ry O
ften"
used library to read or studyasked librarian for helpread in reserve or ref sectionused index or database
16
A less definitive trend is a slight increase in the number of students asking a librarian for
help during the 1980s and early 1990s. Librarians about this time began to offer instructional
workshops and guidance about how to use the web.36 Another factor may have been the
involvement of librarians in student success programs, such as orientation and first-year student
seminars. This behavior varies a bit more from the mid-1990s on, perhaps because librarians
were more or less involved in such efforts at the different schools participating in various years.
What we cannot tell from these data is whether the nature of the requests of librarians made by
students changed through time. For example, are students more frequently asking librarians for
technical assistance with online databases and search engines? Are students asking for
assistance in finding materials contained in the library building?
Frequency of Library Use
Examination of students’ library experiences shows some interesting differences by class,
race, major, and institutional type (appendix D). The ANOVA tests support these differences37.
On balance, as students move through the college years they become more information literate
each year, a finding corroborated by Jones.38 For example, each successive year from first-year
to senior shows a significant increase in the frequency of library use. That is, more seniors
frequently make judgments about information quality (43%) compared with first-year students
(34%); fewer seniors compared with first-year students (18% and 26% respectively) say they
“never” do this.
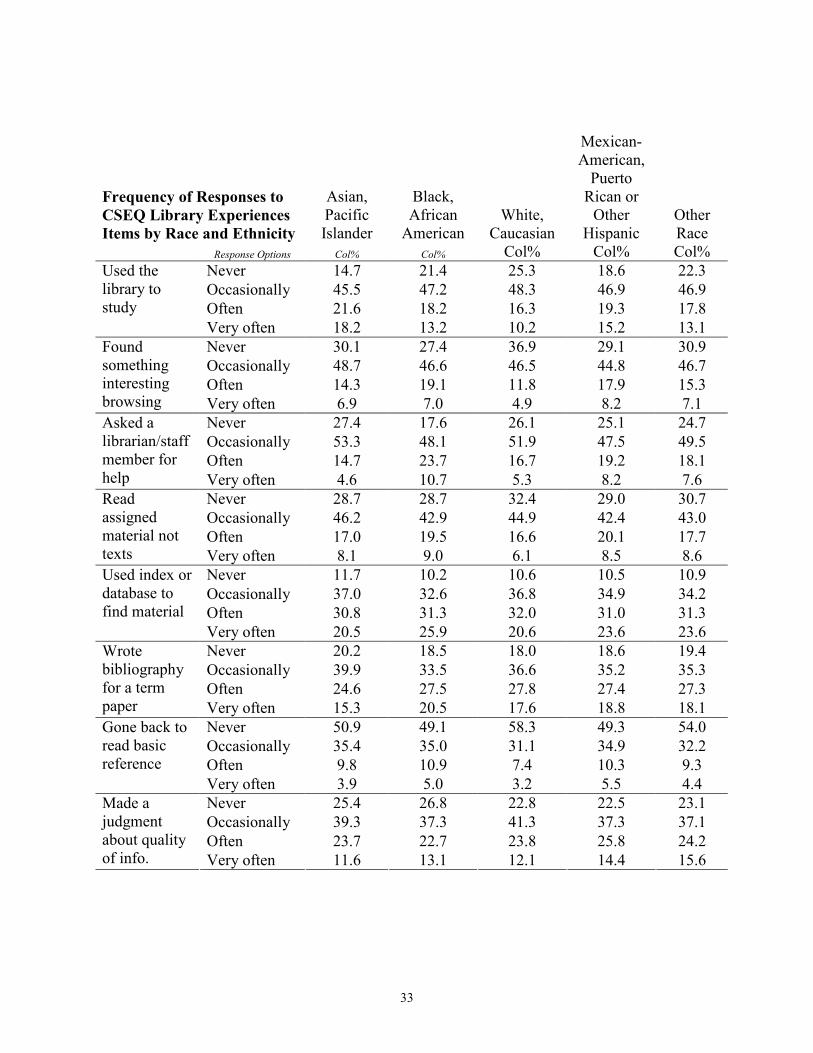
Hispanic, Latino, and Black students use library resources more frequently, while White
students use libraries the least. Students majoring in humanities and social sciences are, as
expected, the most frequent users of the library, as well as students who report two or more
majors. Students with undecided majors and those majoring in business, math, and science score
17
the lowest on the library scale. Finally, students attending baccalaureate liberal arts colleges use
the library more often while those attending baccalaureate general colleges and
doctoral/research-extensive universities do so least often. In the next section, we report whether
or not these differences hold up after controlling for student and institutional variables
simultaneously.
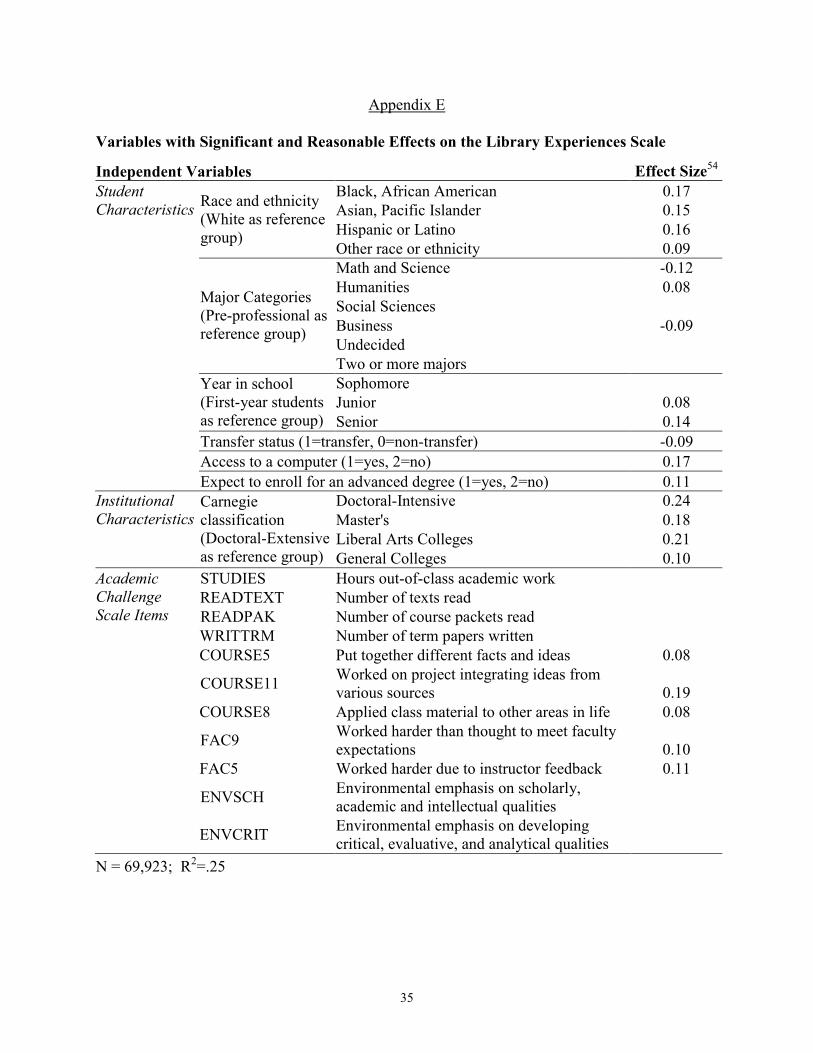
Regression Results
The first regression model uses the library experiences scale (QELIB) as the dependent
variable to answer the question “Who uses the library most?” (see appendix E). After controlling
for student and institutional characteristics, students of color use the library more frequently
compared with White students; students majoring in the humanities and pre-professional fields
use the library more than those majoring in business, math, or science. Access to computing and
information technology inversely relates to library use and shows a relatively large effect size
(.17); that is, students who do not have a computer where they live or work (or nearby) tend to
use the library more. Perhaps for these students, the library is one place where they can use a
computer that, in turn, allows them to access databases and obtain information from other
libraries. At the institutional level, students at doctoral/research-extensive universities use the
library less frequently compared with students attending the other four types of institutions.
Academic challenge relates positively to library use. Of the 11 academic challenge items
(table 4), five have effect sizes greater than |.08|. These include three items related to course
learning experiences (put together different facts and ideas, worked on projects integrating ideas
from various sources, and applied class material to other areas in life) and two student-faculty
interaction items (worked harder than you thought you could to meet faculty expectations and
18
worked harder due to instructor feedback). In addition, all other items in the scale show
statistically significant differences, although with smaller effect sizes.
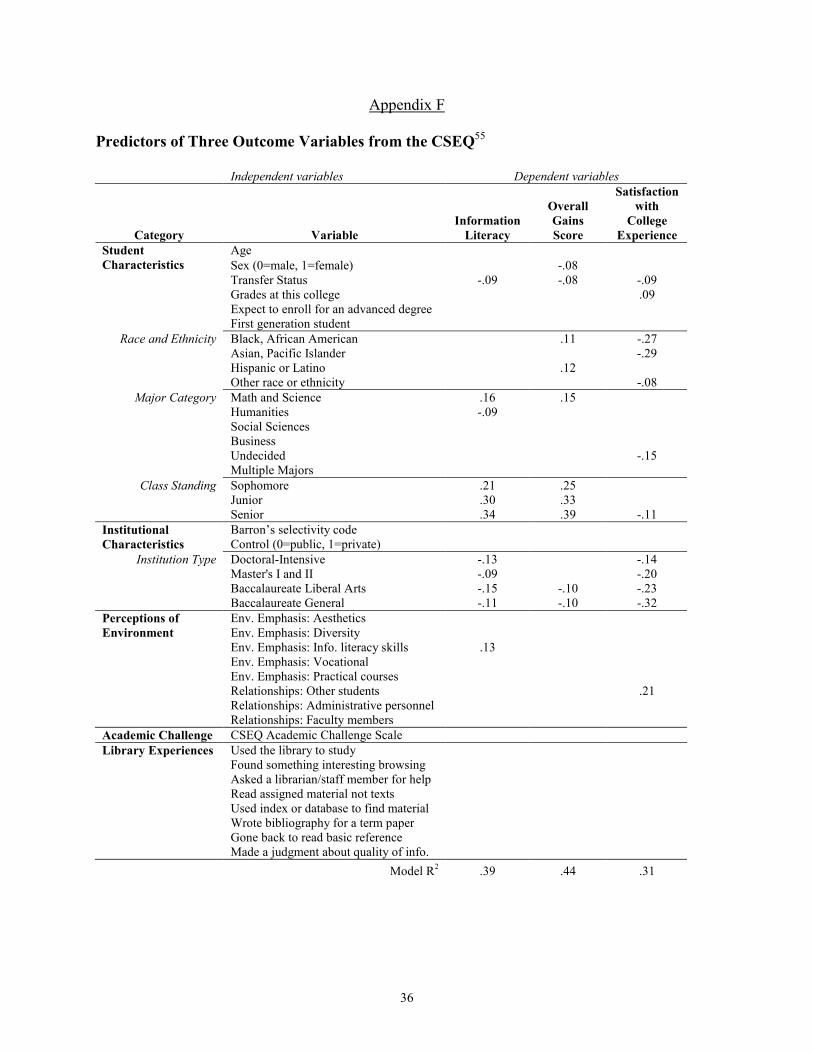
The results from the three regression models predicting desired college outcomes – gains
in information literacy, overall gains in college, and satisfaction – appear in appendix F. Taken
together, these models indicate that none of the individual library activities appears to have a
substantial influence on any of the three outcome variables, after controlling for student and
institutional characteristics, perceptions of the environment, and academic challenge.
The outcome variable represented in the first regression is information literacy. In this
model, transfer students and first-year students make the least progress in information literacy.
For first year students, this is surely due to the small amount of time they have been in college.
For transfer students, the finding is more difficult to interpret and is cause for concern if this
sizeable fraction of students is not gaining as much as other students in this important area.
Though students majoring in math and science do not use the library as much as their peers do,
they report gaining more in information literacy relative to pre-professional majors. Humanities
majors gain less in information literacy (relative to pre-professional majors), after controlling for
other factors. Students at doctoral/research extensive universities report the greatest gains in
information literacy, followed by students at baccalaureate general colleges, doctoral/research
intensive universities, and baccalaureate liberal arts colleges. Finally, as expected, students who
perceive that their institution places a strong emphasis on acquiring information literacy skills
report higher gains in information literacy.
The model predicting overall gains tells a somewhat different story. Women and transfer
students report making less progress during college, after controlling for other student and
institutional characteristics. Black, Hispanic, and Latino students report greater gains than do
19
White students. In terms of institutional type, students at baccalaureate liberal arts and
baccalaureate general colleges report lower gains relative to students in doctoral/research-
extensive universities.
The third model shows that transfer students are less satisfied with their overall college
experiences, and, as expected, students with higher grades are more satisfied. Black and Asian
students are also less satisfied than are White students, but Hispanic students are on par with
Whites in this category. In general, students at the large doctoral-extensive institutions are more
satisfied with college than are students at the other four institutional types. It appears that a key
to satisfaction may be the quality of relationships with other students. This item shows a large
effect size (.21) even after controlling for other factors. Still, as with the previous two, this
model produced no significant relationships between library experiences and satisfaction with
college, after controlling for student and institutional characteristics, perceptions of the
environment, and academic challenge.
In summary, frequency of library use varies depending on the type of student and the type
of institution. The least frequent library users are White students, math and science majors, those
who have ready access to a computer, and those who are attending doctoral-extensive
universities. Those who use the library more frequently report a higher degree of academic
challenge. On balance, library experiences are not directly related to information literacy,
overall gains in college, or satisfaction with the college experience.
Discussion
The results of this study indicate that student use of the library has changed over time.
This is not surprising given the now near-universal access college students have to computing
and information technology. Nonetheless, these data corroborate anecdotal reports and other
20
studies.39 More important, student contact with librarians has increased somewhat during this
period, suggesting that librarians may be becoming more visible and accessible to larger numbers
of students. Perhaps students need help to find good information and to make judgments about
the quality of the information they do find.40 It is supported by the relatively high correlations
produced in this study between “asked a librarian” and other behaviors such as “used index or
database,” “found something interesting while browsing,” and “developed a bibliography for a
term paper.” At the same time, almost one-fifth of all seniors say they never made judgments
about the quality of the information they obtain for use in the academic work. This is an
unacceptably high number of students about to graduate from college who by their own report
are underprepared to live and work in an information-rich world.
Smallness begets distinctiveness in American higher education.41 This appears to be the
case for the library as well, as the character of experiences with academic libraries at small,
academically challenging baccalaureate liberal arts colleges sets them apart from other types of
institutions. For example, more students at baccalaureate liberal arts colleges (40%) say they
frequently make judgments about the quality of the material than at any other type of institution
(33% doctoral/research-extensive universities; 37% doctoral/research intensive universities; 34%
master’s institutions, and 33% baccalaureate general colleges) (appendix E). In addition, library
experiences at the baccalaureate liberal arts colleges strongly correlated with one another and
with other educationally purposeful activities, such as working with a faculty member on
research or discussing papers with faculty members. One obvious explanation for this is that
because most of these institutions are residential in nature, the library is in close proximity to
where students live making access much easier. In contrast, library use is least frequent at larger
doctoral/research-extensive universities. In part, this may be because of the array of alternate
21
academic support venues such institutions provide, such as computer labs and academic skills
centers. Having these options possibly mutes the impact of the academic library on many of the
outcomes measures and reduces the necessity that a student must use the library for these vital
academic services. In addition, research institutions are also more likely to claim better wiring
for technology – with broadband access to computer networks, excellent library search engines
online, network access in residence hall rooms, and so on.
Academic Challenge Matters
Size and selectivity are not the only factors that influence library use. Academic
challenge also is important. That is, institutions that set high standards for academic work seem
to impel students to use a variety of intellectual resources actively, including the library. As a
result, students who frequently use library resources are also more likely to work harder than
they thought they could to meet a faculty member’s expectations and in response to instructor
feedback, and they are assigned projects that require integrating ideas, putting different facts and
ideas together, and applying class material to other areas in life. In addition, students at
academically challenging institutions are more likely to ask a librarian for help, use indexes and
databases, and make thoughtful judgments about the quality of information they receive. At the
same time, using the library does not appear to be associated with the amount of effort students
put forth on their own in many other learning activities, such as the amount of effort they put
forth in writing or the frequency with which they converse about substantive matters with peers.
The Library’s Contribution to Student Success
On balance, the results of this study indicate that libraries play an important role in
helping the institution achieve its academic mission. It is particularly gratifying that students of
color generally use the library as much or more than do other students, especially Black, Asian
22
and Pacific Islander, Hispanic and Latino students. Perhaps students of color find the academic
library to be a safe haven, a place that supports and nurtures academic success in collaboration
with peers of the same racial and ethnic background, much in the same way the campus union
provides a venue for social gatherings. If so, the library is providing a very valuable service for a
subset of undergraduates that is increasing in number.
The most surprising (and mildly disappointing) finding is that library experiences do not
seem to directly contribute to gains in information literacy, to what students gain overall from
college, or to student satisfaction. There are three plausible explanations for this. First, the
information literacy scale created from selected CSEQ items may not be a valid proxy; that is,
other measures may more accurately estimate information literacy as defined by the ACRL.
Second, the lack of baseline measures for information literacy and the other gains makes it
difficult to draw conclusions from student self-reported estimates of their gains.42 For example,
students attending different colleges or majoring in different fields may start college at various
levels of information literacy. Some students who report gaining relatively little may have been
fairly information literate when they started college. Other students who say they gained a good
deal may have started college with a lower level of literacy. So, while the latter group may have,
indeed, gained a substantial amount during college, their actual level of information literacy may
be the same as, or even lower than, their peers who reported making less progress in the area
since beginning college. This same caveat holds for the overall gains measure. Finally, as with
most other desired outcomes, a variety of experiences during college, inside and outside of class,
contribute to gains and satisfaction, not just one type of experience. That is, critical thinking is
not primarily or exclusively cultivated in the classroom or in the major field; rather it is the
product of cumulative experiences over time in a variety of venues.43 There is no reason to
23
expect that the relationship between library experiences and gains in information literacy or other
areas would be different. Indeed, the findings of this study offer no silver bullet (or single
intervention) that will produce an information literate college graduate.
For example, students who report higher levels of information literacy were attending
institutions that emphasized the importance of information literacy and encouraged students to
use computers and other information resources. They also performed a good deal of reading,
including some basic references that are more likely to exist either in the library or online. In
addition, students who gained the most in information literacy more often made judgments about
the quality of the information they obtained. In other words, students who make the greatest
gains in information literacy attend institutions that communicate the importance of information
literacy and practice the skills that lead to information literacy.
Implications for Practice and Additional Research
This brings us to one of the more important findings from this study: students who
perceive that their campus emphasizes information literacy gain more in this area, net of other
influences. This underscores the need to collaborate with classroom instructors and student
affairs professionals to deliver clear and consistent messages about the value of learning about
various sources of information, require evidence that students make discerning judgments about
the quality of the information they use, and, equally important, give students feedback on the
quality of these judgments. Anecdotal experience suggests that students are more likely to
evaluate critically the quality of sources when instructors explicitly require them to do so.44 This
suggests that if institutions are serious about graduating information literate students they should
require activities that give students practice and require them to demonstrate their competence in
evaluating the quality of the information they use. Librarians, faculty members, and others will
have to be directly involved in giving students prompt, ongoing feedback about their
24
performance. The University of California at Berkeley is an example of this where the Teaching
Library and the departments of political science and sociology are designing a graduated
program of instruction across the undergraduate years that will require students to use
information resources.45 Librarians might also partner with student affairs staff to help them
identify ways to identify students who may be struggling with using information appropriately
and responsibly.
A reasonable amount of interaction with knowledgeable adults on a college campus is
very important to student learning. These interactions are especially valuable when they focus
on substantive or course content matters.46 Transfer students are one group of students that
would benefit from more attention in this regard. At least 40% of seniors attending four-year
colleges and universities started college at a school other than the one from which they are about
to graduate.47 Yet they are generally less engaged in educationally purposeful activities than are
their native student counterparts. It is difficult to reach transfer students directly, as they are not
concentrated in living units or certain courses. Perhaps librarians could collaborate with
academic departments to explore ways to induce transfer students to use the library more
frequently and to help them attain levels of information literacy comparable to students who start
and graduate from the same college. The California State University system has recognized this
need and its 23 campuses are joining with community colleges well as high schools to improve
information literacy.48
Higher education needs more investigations into the library’s effectiveness in promoting
student learning. One fruitful line of inquiry would be to determine the kinds of student
interactions with librarians beyond those represented on the CSEQ effectively promote learning
or affect other aspects of the college experience. The CSEQ does not ask about whether students
25
made effective use of what they learned in a session focused on information literacy facilitated
by a librarian; answers to this and related questions would be very instructive in terms of the
library’s contribution. Another instructive effort would be determining which approaches are
most effective in teaching information literacy. Are these skills and competencies best cultivated
through a freestanding course, sprinkled throughout the curriculum, or learned in the context of
the discipline or a specific topic? Other research indicates that students learn what they study. It
would be useful to compare the information literacy levels of students at institutions that require
library assignments as part of one or more courses with those that do not.
Another research question is whether student use of the library and interactions with
librarians are associated with persistence and graduation, net of other factors. Previous research
suggested that library experiences related positively to persistence and student achievement.
Most of this research is dated, however, and did not employ advanced statistical methods that
controlled for student ability or institutional selectivity.
A time-honored improvement strategy in higher education and other sectors is to identify
high-performing organizations, find out what they do well, and adapt these promising practices
for use in other settings. For example, some institutions have higher-than-predicted graduation
rates and student engagement levels.49 Perhaps students at certain colleges and universities use
the library more and benefit more than might be predicted, all things being equal. It would be
instructive to learn more about these institutions and their libraries.
Limitations
This study is limited in that the data are from colleges and universities that voluntarily
administered the CSEQ. If data from other institutions were included, the findings might change
in unknown ways. Another factor that could affect the results is if additional student-level

26
measures (e.g., ability, motivation) and institution-level data (e.g., resources) were included in
the models. There is also the possibility that, as mentioned earlier, students use different
baselines when reporting gains.50 Despite these limitations, the CSEQ research program
represents one of the most extensive national databases with survey information from college
students related to their quality of effort and gains from college. It is one of the few multi-
institution sources of information about the undergraduate experience that examines the
influence of the library on information literacy and other aspects of student learning and personal
development.
Conclusion
The results of this exploratory study indicate that library experiences of undergraduates
positively relate to select educationally purposeful activities, such as using computing and
information technology and interacting with faculty members. Those students who more
frequently use the library reflect a studious work ethic and engage in academically challenging
tasks that require higher order thinking. Though certain student background characteristics (e.g.,
race, major, year in school, transfer status, access to computers) affect the nature and frequency
of students’ library activities, the library appears to be a positive learning environment for all
students, especially members of historically underrepresented groups.
At the same time, library use does not appear to contribute directly to gains in
information literacy and other desirable outcomes. This is not surprising, as rarely does any
single experience or set of activities during college affect student learning and personal
development one way or the other; rather, what is most important to college impact is the nature
and breadth of a student’s experiences over an extended period.
27
Academic librarians are well positioned to provide leadership and expertise to outcomes
associated with information literacy. However, higher education institutions should not expect
them to do this alone. The findings of this study indicate that it takes a whole campus to produce
an information literate college graduate. For this reason, librarians would do well to re-double
their efforts to collaborate with faculty members, instructional development staff, and student
affairs professionals in promoting the value of information literacy in various in-class and out-of-
class activities and provide students with as many opportunities as possible to evaluate the
quality of the information they encounter, on and off the campus.
28
Appendices
Appendix A
CSEQ Library Scale Inter-Item Correlation Coefficients51
LIB1 LIB2 LIB3 LIB4 LIB5 LIB6 LIB7 LIB8LIB1 Used the library to study LIB2 Found something
interesting browsing .37
LIB3 Asked a librarian/staff member for help .19 .31
LIB4 Read assigned material not texts .40 .39 .30
LIB5 Used index or database to find material .26 .39 .38 .38
LIB6 Wrote bibliography for a term paper .21 .27 .33 .32 .58
LIB7 Gone back to read basic reference .26 .37 .28 .36 .36 .43
LIB8 Made a judgment about quality of info. .21 .31 .23 .27 .42 .44 .39
29
Appendix B CSEQ Gain Scales and Items52
category Item name Item label GNARTS Understanding and enjoyment of art, music, drama GNLIT Acquaintance with and enjoyment of literature GNHIST Knowledge of history GNWORLD Knowledge about different parts of the world and people GNPHILS Awareness of different philosophies, cultures, ways of life
General Education
GNGENLED Broad general education GNVALUES Values and ethical standards GNSELF Self-understanding GNOTHERS Ability to get along with others GNTEAM Teamwork skills
Personal Development
GNHEALTH Good health habits and physical fitness GNSCI Science and experimentation GNTECH Science and technology developments
Science and Technology
GNCONSQ Consequences of science and technology GNVOC Job or work skills GNSPEC Background for further education
Vocational Preparation
GNCAREER Career information GNWRITE Writing GNSPEAK Presenting and speaking GNCOMPUT Computers and other information technologies GNANALY Analytical and logical thinking GNQUANT Quantitative problem solving GNSYNTH Synthesis ability GNINQ Self-directed learning
Intellectual Development
GNADAPT Adapting to change Response set for all Gains items: 1=Very little, 2=Some, 3=Quite a bit, 4=Very much

30
Appendix C
Descriptive Statistics for Dependent Variables Used in the Study
Measure Valid N Missing N % Missing Mean S.E.M. Std. Dev. Skewness Kurtosis QELIB 78425 1844 2% 17.0 0.02 4.6 0.37 0.08INFOLIT 76987 3282 4% 17.7 0.01 3.5 -0.29 -0.25GAINSUM 75103 5166 7% 67.8 0.05 13.1 -0.07 -0.14OPINSCOR 78487 1782 2% 6.3 0.01 1.5 -0.76 0.19
All four scales have a minimal percentage of missing values and good normal curve properties as indicated by skewness and kurtosis values in the normal range (between -1 to +1).
31
Appendix D
Frequencies to Library Experience Items by Sex, Class, Race, and Institutional Type
Frequency of Responses to CSEQ Library Experiences Items by Sex male female
Response Options Col% Col% Never 24.6 23.3 Occasionally 46.2 48.7 Often 17.5 16.8
Used the library to study
Very often 11.6 11.2 Never 33.5 36.2 Occasionally 45.7 47.2 Often 14.7 11.6
Found something interesting browsing
Very often 6.2 4.9 Never 29.9 23.0 Occasionally 49.7 52.6 Often 15.6 18.0
Asked a librarian/staff member for help
Very often 4.8 6.4 Never 32.5 31.2 Occasionally 45.1 44.3 Often 16.4 17.4
Read assigned material not texts
Very often 6.0 7.1 Never 13.3 9.1 Occasionally 39.9 34.1 Often 30.0 33.0
Used index or database to find material
Very often 16.9 23.8 Never 20.9 16.8 Occasionally 40.4 34.2 Often 25.8 28.6
Wrote bibliography for a term paper
Very often 13.0 20.5 Never 53.9 58.3 Occasionally 34.0 30.6 Often 8.7 7.6
Gone back to read basic reference
Very often 3.4 3.6 Never 24.3 22.6 Occasionally 39.5 41.0 Often 23.7 24.0
Made a judgment about quality of info.
Very often 12.6 12.4

32
Frequency of Responses to CSEQ Library Experiences Items by Class First-year Sophomore Junior Senior
Response Options Col% Col% Col% Col% Never 25.5 21.6 22.6 23.3 Occasionally 47.8 47.6 47.0 48.5 Often 16.5 17.9 17.7 16.9
Used the library to study
Very often 10.1 12.9 12.7 11.3 Never 39.2 34.7 32.1 29.6 Occasionally 44.9 46.8 48.6 48.4 Often 11.6 13.1 13.3 14.7
Found something interesting browsing Very often 4.3 5.4 6.0 7.3
Never 28.4 26.1 25.0 19.9 Occasionally 48.4 52.4 53.0 55.9 Often 17.4 16.1 16.4 18.0
Asked a librarian/staff member for help Very often 5.8 5.4 5.7 6.2
Never 37.4 29.2 28.8 24.3 Occasionally 42.0 46.3 45.0 48.3 Often 15.1 17.3 18.0 19.9
Read assigned material not texts
Very often 5.5 7.1 8.2 7.5 Never 12.9 10.2 9.9 7.3 Occasionally 37.1 38.7 35.6 33.0 Often 30.8 31.9 32.2 33.4
Used index or database to find material
Very often 19.2 19.2 22.3 26.3 Never 20.9 18.4 17.0 13.9 Occasionally 35.7 39.8 37.3 34.7 Often 26.8 27.0 28.2 28.6
Wrote bibliography for a term paper Very often 16.5 14.8 17.5 22.8
Never 61.1 58.1 54.0 47.5 Occasionally 29.0 31.8 33.8 36.5 Often 7.2 7.4 8.1 10.5
Gone back to read basic reference
Very often 2.8 2.8 4.1 5.5 Never 25.7 23.7 21.7 18.7 Occasionally 40.2 41.5 40.3 39.9 Often 22.8 23.4 24.5 26.2
Made a judgment about quality of info. Very often 11.3 11.4 13.5 15.3
33
Frequency of Responses to CSEQ Library Experiences Items by Race and Ethnicity
Asian, Pacific Islander
Black, African
American White,
Caucasian
Mexican-American,
Puerto Rican or
Other Hispanic
Other Race
Response Options Col% Col% Col% Col% Col% Never 14.7 21.4 25.3 18.6 22.3 Occasionally 45.5 47.2 48.3 46.9 46.9 Often 21.6 18.2 16.3 19.3 17.8
Used the library to study
Very often 18.2 13.2 10.2 15.2 13.1 Never 30.1 27.4 36.9 29.1 30.9 Occasionally 48.7 46.6 46.5 44.8 46.7 Often 14.3 19.1 11.8 17.9 15.3
Found something interesting browsing Very often 6.9 7.0 4.9 8.2 7.1
Never 27.4 17.6 26.1 25.1 24.7 Occasionally 53.3 48.1 51.9 47.5 49.5 Often 14.7 23.7 16.7 19.2 18.1
Asked a librarian/staff member for help Very often 4.6 10.7 5.3 8.2 7.6
Never 28.7 28.7 32.4 29.0 30.7 Occasionally 46.2 42.9 44.9 42.4 43.0 Often 17.0 19.5 16.6 20.1 17.7
Read assigned material not texts Very often 8.1 9.0 6.1 8.5 8.6
Never 11.7 10.2 10.6 10.5 10.9 Occasionally 37.0 32.6 36.8 34.9 34.2 Often 30.8 31.3 32.0 31.0 31.3
Used index or database to find material
Very often 20.5 25.9 20.6 23.6 23.6 Never 20.2 18.5 18.0 18.6 19.4 Occasionally 39.9 33.5 36.6 35.2 35.3 Often 24.6 27.5 27.8 27.4 27.3
Wrote bibliography for a term paper Very often 15.3 20.5 17.6 18.8 18.1
Never 50.9 49.1 58.3 49.3 54.0 Occasionally 35.4 35.0 31.1 34.9 32.2 Often 9.8 10.9 7.4 10.3 9.3
Gone back to read basic reference
Very often 3.9 5.0 3.2 5.5 4.4 Never 25.4 26.8 22.8 22.5 23.1 Occasionally 39.3 37.3 41.3 37.3 37.1 Often 23.7 22.7 23.8 25.8 24.2
Made a judgment about quality of info. Very often 11.6 13.1 12.1 14.4 15.6

34
Frequency of Responses to CSEQ Library Experiences Items by Carnegie Classification53
Doctoral - Extensive
Doctoral - Intensive Master's
Liberal Arts
Colleges General Colleges
Response Options Col% Col% Col% Col% Col% Never 22.9 24.1 25.5 14.8 28.9 Occasionally 47.1 47.4 48.9 46.3 48.1 Often 17.3 17.0 16.4 20.8 15.1
Used the library to study
Very often 12.7 11.5 9.1 18.1 7.9 Never 38.0 32.3 35.0 23.7 38.4 Occasionally 45.5 42.8 48.4 50.4 46.6 Often 11.4 16.0 12.5 17.4 11.1
Found something interesting browsing Very often 5.1 8.9 4.1 8.6 3.8
Never 29.5 23.5 23.0 23.0 24.6 Occasionally 51.4 48.2 51.8 56.2 51.1 Often 14.5 19.5 19.1 16.1 18.3
Asked a librarian/staff member for help Very often 4.6 8.8 6.1 4.7 6.1
Never 33.3 31.7 32.5 17.0 35.1 Occasionally 43.9 43.7 45.9 44.5 44.7 Often 16.1 17.4 16.5 24.6 15.4
Read assigned material not texts
Very often 6.7 7.2 5.2 13.9 4.8 Never 11.6 10.2 10.4 5.6 14.0 Occasionally 37.6 34.1 36.2 30.4 40.5 Often 30.8 33.2 32.7 33.8 28.8
Used index or database to find material
Very often 20.1 22.5 20.8 30.2 16.7 Never 20.7 19.3 17.3 12.0 16.3 Occasionally 37.9 35.7 35.9 33.8 37.5 Often 25.2 27.6 29.4 29.5 27.7
Wrote bibliography for a term paper Very often 16.1 17.4 17.4 24.8 18.4
Never 58.1 55.9 58.1 44.5 56.2 Occasionally 30.9 31.7 30.9 39.0 33.2 Often 7.6 8.6 7.8 10.7 7.4
Gone back to read basic reference
Very often 3.4 3.8 3.1 5.8 3.2 Never 24.1 24.0 23.3 16.4 24.3 Occasionally 39.0 39.7 42.3 38.9 41.4 Often 23.8 23.9 23.4 27.1 23.4
Made a judgment about quality of info. Very often 13.1 12.4 11.0 17.6 10.9
35
Appendix E
Variables with Significant and Reasonable Effects on the Library Experiences Scale
Independent Variables Effect Size54
Black, African American 0.17 Asian, Pacific Islander 0.15 Hispanic or Latino 0.16
Student Characteristics Race and ethnicity
(White as reference group)
Other race or ethnicity 0.09 Math and Science -0.12 Humanities 0.08 Social Sciences Business -0.09 Undecided
Major Categories (Pre-professional as reference group)
Two or more majors Sophomore Junior 0.08
Year in school (First-year students as reference group) Senior 0.14
Transfer status (1=transfer, 0=non-transfer) -0.09 Access to a computer (1=yes, 2=no) 0.17 Expect to enroll for an advanced degree (1=yes, 2=no) 0.11
Doctoral-Intensive 0.24 Master's 0.18 Liberal Arts Colleges 0.21
Institutional Characteristics
Carnegie classification (Doctoral-Extensive as reference group) General Colleges 0.10 STUDIES Hours out-of-class academic work READTEXT Number of texts read
Academic Challenge Scale Items READPAK Number of course packets read WRITTRM Number of term papers written COURSE5 Put together different facts and ideas 0.08
COURSE11 Worked on project integrating ideas from various sources 0.19
COURSE8 Applied class material to other areas in life 0.08
FAC9 Worked harder than thought to meet faculty expectations 0.10
FAC5 Worked harder due to instructor feedback 0.11
ENVSCH Environmental emphasis on scholarly, academic and intellectual qualities
ENVCRIT Environmental emphasis on developing critical, evaluative, and analytical qualities
N = 69,923; R2=.25
36
Appendix F Predictors of Three Outcome Variables from the CSEQ55
Independent variables Dependent variables
Category Variable Information
Literacy
Overall Gains Score
Satisfaction with
College Experience
Age Student Characteristics Sex (0=male, 1=female) -.08 Transfer Status -.09 -.08 -.09 Grades at this college .09 Expect to enroll for an advanced degree First generation student
Race and Ethnicity Black, African American .11 -.27 Asian, Pacific Islander -.29 Hispanic or Latino .12 Other race or ethnicity -.08
Major Category Math and Science .16 .15 Humanities -.09 Social Sciences Business Undecided -.15 Multiple Majors
Class Standing Sophomore .21 .25 Junior .30 .33 Senior .34 .39 -.11
Barron’s selectivity code Institutional Characteristics Control (0=public, 1=private)
Institution Type Doctoral-Intensive -.13 -.14 Master's I and II -.09 -.20 Baccalaureate Liberal Arts -.15 -.10 -.23 Baccalaureate General -.11 -.10 -.32
Env. Emphasis: Aesthetics Perceptions of Environment Env. Emphasis: Diversity Env. Emphasis: Info. literacy skills .13 Env. Emphasis: Vocational Env. Emphasis: Practical courses Relationships: Other students .21 Relationships: Administrative personnel Relationships: Faculty members Academic Challenge CSEQ Academic Challenge Scale
Used the library to study Library Experiences Found something interesting browsing
Asked a librarian/staff member for help Read assigned material not texts Used index or database to find material Wrote bibliography for a term paper Gone back to read basic reference Made a judgment about quality of info. Model R2 .39 .44 .31
37
References
Astin, Alexander W. "Student involvement: A developmental theory for higher education." Journal of College Student Personnel 25 (1984): 297-308.
Barr, Robert B., and Tagg, John. "From teaching to learning- a new paradigm for undergraduate education." Change 27, no. November/December (1995): 13-25.
Barron's profiles of American colleges. 23rd ed. Hauppauge, NY: Barron's Educational Series, 1998.
Brodsky, K., and Toczyski, S. "Information competence in the freshman interest group at Sonoma State University." Paper presented at the First Year Experience Conference, Orlando 2002.
Carnegie Foundation for the Advancement of Teaching. Carnegie classification of institutions of higher education, 2000 edition. Menlo Park, CA: Carnegie Foundation for the Advancement of Teaching, 2000.
Clark, B. "The organizational saga in higher education." In ASHE reader in organization and governance in higher education, edited by Birnbaum, R. Washington, D.C.: Association for the Study of Higher Education, 1972.
Cohen, Jacob. Statistical power analysis for the behavioral sciences. 2nd ed. Hillsdale, N.J.: L. Erlbaum Associates, 1988.
Dunn, K. "Assessing student information literacy skills in the California State University: A progress report." Journal of Academic Librarianship 28, no. 1/2 (2002): 26-35.
Ewell, Peter T., and Jones, Dennis P. Indicators of "good practice" in undergraduate education: A handbook for development and implementation. Boulder, CO: National Center for Higher Education Management Systems, 1996.
Glendale Community College. "Information competency improves grades." 2001.
Gonyea, Robert M., Kish, Kelly, Kuh, George D., Muthiah, Richard, and Thomas, Auden. CSEQ: Norms for the fourth edition. Bloomington, IN: Indiana University Center for Postsecondary Research, Policy, and Planning, 2003.
Jones, Steve. "The internet goes to college: How students are living in the future with today's technology." Washington, D.C.: Pew Internet & American Life Project, 2002.
Kuh, G. D. "What we're learning about student engagement from NSSE." Change 35, no. 2 (2003).
Kuh, George D. "Assessing what really matters to student learning: Inside the national survey of student engagement." Change 33, no. 3 (2001): 10-17, 66.
38
Kuh, George D., and Hu, Shouping. "The effects of student-faculty interaction in the 1990s." Review of Higher Education 24, no. 3 (2001): 309-32.
Kuh, George D., Schuh, J. H., Whitt, E. J., and Associates. Involving colleges: Successful approaches to fostering student learning and development outside the classroom. San Francisco: Jossey Bass, 1991.
Kuh, George D., Vesper, Nick, Connolly, Mark R., and Pace, C. Robert. "College Student Experiences Questionnaire: Revised norms for the third edition." Bloomington, IN: Center for Postsecondary Research and Planning, Indiana University, 1997.
Kuh, George D., and Whitt, Elizabeth J. The invisible tapestry: Culture in American colleges and universities. Edited by Fife, J. D., ASHE-ERIC higher education report no 1. Washington, D.C.: Association for the Student of Higher Education, 1988.
Light, R., and Pillemer, D. "Numbers and narrative: Combining their strengths in research reviews." Harvard Educational Review (1982): 1-26.
Lindauer, B.G. "Defining and measuring the library's impact on campuswide outcomes." College and Research Libraries 59, no. 6 (1998): 546-63.
Maughan, P. D. Information literacy survey. Berkeley, CA: University of California, Berkeley Library, 2002.
Measuring Up. "Measuring up 2002: The state-by-state report card for higher education." San Jose, CA: National Center for Public Policy and Higher Education, 2002.
National Center for Postsecondary Improvement. "The landscape: A report to stakeholders on the condition and effectiveness of postsecondary education." Change 33, no. 3 (2001): 27-42.
Ory, J.C., and Braskamp, L.A. "Involvement and growth of students in three academic programs." Research in Higher Education 28 (1988): 116-29.
Outsell. Managing online information to maximize corporate intranet ROI 2001 [cited July 2001]. Available from www.moreoverpartner.com.
Pace, C. Robert. "Measuring the quality of college student experiences. An account of the development and use of the College Student Experiences Questionnaire." Los Angeles: Higher Education Research Institute, 1984.
Pace, C. Robert, and Kuh, George D. College Student Experiences Questionnaire (fourth edition). Bloomington, IN: Center for Postsecondary Research and Planning, 1998.
Pascarella, Ernest. "Using student self-reported gains to estimate college impact: A cautionary tale." Journal of College Student Development 42 (2001): 488-92.
Pascarella, Ernest T., and Terenzini, Patrick T. How college affects students, The Jossey-bass higher and adult education series. San Francisco: Jossey-Bass, 1991.
39
Powell, R. R. "Impact assessment of university libraries." Library and Information Science Research 14 (1992): 254.
Rockman, I.F., and Smith, Gordon W. "A multi-dimensional project to assess student information competence skills." Paper presented at the E-Learn Conference, Montreal 2002.
Romer, Roy. "Making quality count in undergraduate education." 25. Denver, CO: Education Commission of the States, 1995.
Shapiro, J. J., and Hughes, S. K. "Information literacy as a liberal art: Enlightenment proposals for a new curriculum." Educom Review 31, no. 2 (1996): 31-35.
Tagg, John. The learning paradigm college. Bolton, MA: Anker, 2003.
Terenzini, Patrick T. "Influences affecting the development of students' critical thinking skills." Research in Higher Education 36, no. 1 (1995): 23-39.
Terenzini, Patrick T., and et al. "First-generation college students: Characteristics, experiences, and cognitive development." Research in Higher Education 37, no. 1 (1996): 1-22.
Townsend, B.K., Newell, L.J., and Wiese, M.D. Creating distinctiveness: Lessons from uncommon colleges and universities, AAHE-ERIC/higher education report, no 6. Washington, D.C.: The George Washington University, School of Education and Human Development, 1992.
Whitmire, Ethelene. "Development of critical thinking skills: An analysis of academic library experiences and other measures." College and University Research Libraries 59, no. 3 (1998): 266-73.
———. "Racial differences in the academic library experiences of undergraduates." Journal of Academic Librarianship 25, no. 1 (1999): 33-37.
Wolff, R. A. "Rethinking library self-studies and accreditation visits." In The challenge and practice of academic accreditation: A sourcebook for library administration, edited by Garten, E. D. Westport, CT: Greenwood, 1994.
40
Endnotes
1 This paper was originally prepared for an invited session at the 2003 ACRL National Conference. We thank Ann Bristow, Polly D. Boruff-Jones, Ilene Rockham, and Carolyn Walters for their comments and suggestions on an earlier draft of this paper.
2 Lindauer, B.G., "Defining and measuring the library's impact on campuswide outcomes," College and Research Libraries 59, no. 6 (1998); Measuring Up, "Measuring up 2002: The state-by-state report card for higher education," (San Jose, CA: National Center for Public Policy and Higher Education, 2002).
3 Jones, Steve, "The internet goes to college: How students are living in the future with today's technology," (Washington, D.C.: Pew Internet & American Life Project, 2002).
4 Dunn, K., "Assessing student information literacy skills in the California State University: A progress report," Journal of Academic Librarianship 28, no. 1/2 (2002); Rockman, I.F. and Smith, Gordon W., "A multi-dimensional project to assess student information competence skills" (paper presented at the E-Learn Conference, Montreal, 2002).
5 National Center for Postsecondary Improvement, "The landscape: A report to stakeholders on the condition and effectiveness of postsecondary education," Change 33, no. 3 (2001); Outsell, Managing online information to maximize corporate intranet ROI (2001 [cited July 2001]); available from www.moreoverpartner.com.
6 Lindauer, "Defining and measuring."
7 Shapiro, J. J. and Hughes, S. K., "Information literacy as a liberal art: Enlightenment proposals for a new curriculum," Educom Review 31, no. 2 (1996): 2.
8 P. Boruff-Jones, personal communication, November 2002.
9 Brodsky, K. and Toczyski, S., "Information competence in the freshman interest group at Sonoma State University" (paper presented at the First Year Experience Conference, Orlando, 2002).
10 Barr, Robert B. and Tagg, John, "From teaching to learning- a new paradigm for undergraduate education," Change 27, no. November/December (1995); Tagg, John, The learning paradigm college (Bolton, MA: Anker, 2003).
11 Lindauer, "Defining and measuring."; Wolff, R. A., "Rethinking library self-studies and accreditation visits," in The challenge and practice of academic accreditation: A sourcebook for library administration, ed. Garten, E. D. (Westport, CT: Greenwood, 1994).
12 Powell, R. R., "Impact assessment of university libraries," Library and Information Science Research 14 (1992).
13 Glendale Community College, "Information competency improves grades," (2001).
14 Ory, J.C. and Braskamp, L.A., "Involvement and growth of students in three academic programs," Research in Higher Education 28 (1988).
15 Terenzini, Patrick T., "Influences affecting the development of students' critical thinking skills," Ibid.36, no. 1 (1995); Terenzini, Patrick T. and et al., "First-generation college students: Characteristics, experiences, and cognitive development," Research in Higher Education 37, no. 1 (1996).
16 Pace, C. Robert, "Measuring the quality of college student experiences. An account of the development and use of the College Student Experiences Questionnaire," (Los Angeles: Higher Education Research Institute, 1984).
41
17 Whitmire, Ethelene, "Development of critical thinking skills: An analysis of academic library experiences and other measures," College and University Research Libraries 59, no. 3 (1998).
18 Whitmire, Ethelene, "Racial differences in the academic library experiences of undergraduates," Journal of Academic Librarianship 25, no. 1 (1999).
19 Astin, Alexander W., "Student involvement: A developmental theory for higher education," Journal of College Student Personnel 25 (1984); Pascarella, Ernest T. and Terenzini, Patrick T., How college affects students, The Jossey-bass higher and adult education series (San Francisco: Jossey-Bass, 1991).
20 Kuh, George D., Schuh, J. H., Whitt, E. J., and Associates, Involving colleges: Successful approaches to fostering student learning and development outside the classroom. (San Francisco: Jossey Bass, 1991); Romer, Roy, "Making quality count in undergraduate education," (Denver, CO: Education Commission of the States, 1995).
21 Pace, "Measuring the quality."
22 Kuh, George D., "Assessing what really matters to student learning: Inside the national survey of student engagement," Change 33, no. 3 (2001).
23 Ewell, Peter T. and Jones, Dennis P., Indicators of "good practice" in undergraduate education: A handbook for development and implementation (Boulder, CO: National Center for Higher Education Management Systems, 1996); Gonyea, Robert M., Kish, Kelly, Kuh, George D., Muthiah, Richard, and Thomas, Auden, CSEQ: Norms for the fourth edition (Bloomington, IN: Indiana University Center for Postsecondary Research, Policy, and Planning, 2003).
24 Pace, C. Robert and Kuh, George D., College Student Experiences Questionnaire (fourth edition) (Bloomington, IN: Center for Postsecondary Research and Planning, 1998).
25 The respondents in the first sample who completed the CSEQ between 1984 and 2002 include 60% women; 80% are White, 6% Black, 3% Hispanic, 6% Asian, and 4% other race or ethnicity. First-year students total 35%, sophomores 21%, juniors 17%, and seniors 26%. Of the respondents in the second sample who completed the 4th edition of the CSEQ 61% were women and 77% were White, 8% Asian or Pacific Islander, 5% Black, 3% Mexican-American, Puerto Rican, or other Hispanic, 1% American Indian, 3% multiracial, and 3% other race or ethnic identity. Approximately 43% were first-year students, 20% sophomores, 17% juniors, and 20% seniors. About 20% were majoring in a pre-professional program (e.g., agriculture, education, communications, and health-related fields), 11% in social sciences (e.g., multidisciplinary studies, sociology, and public administration), 16% in mathematics, science, or related area (e.g., computer science and engineering), 8% in the humanities (e.g., ethnic studies, foreign languages, history, and visual and performing arts), and 15% in business. Four percent were undecided as to major field and 21% had two or more majors. In terms of institutional type, 38% percent were from 29 doctoral/research-extensive universities, 13% from 17 doctoral/research-intensive universities, 33% from 41 masters’ colleges and universities, 8% from 21 baccalaureate liberal colleges, and 9% from 23 baccalaureate general colleges; Carnegie Foundation for the Advancement of Teaching, Carnegie classification of institutions of higher education, 2000 edition (Menlo Park, CA: Carnegie Foundation for the Advancement of Teaching, 2000).
26 Kuh, George D., Vesper, Nick, Connolly, Mark R., and Pace, C. Robert, "College Student Experiences Questionnaire: Revised norms for the third edition," (Bloomington, IN: Center for Postsecondary Research and Planning, Indiana University, 1997).
27 Note that INFOLIT is a subset of GAINSUM.
28 Pascarella and Terenzini, How college affects students.
29 Carnegie Foundation for the Advancement of Teaching, Carnegie classification.
30 Barron's profiles of American colleges, 23rd ed. (Hauppauge, NY: Barron's Educational Series, 1998).

42
31 Response values on items appended by a ‘4’ were mathematically collapsed to four-point range giving all items an equal portion of the total scale score.
32 Cohen, Jacob, Statistical power analysis for the behavioral sciences, 2nd ed. (Hillsdale, N.J.: L. Erlbaum Associates, 1988).
33 Light, R. and Pillemer, D., "Numbers and narrative: Combining their strengths in research reviews," Harvard Educational Review (1982).
34 The expression ‘|.08|’ should be read ‘the absolute value of .08.’
35 I. Rockman, personal communication, December 19, 2002.
36 Ibid.
37 ANOVA results are not reported in this paper but are available from the authors.
38 Jones, "The internet goes to college: How students are living in the future with today's technology."
39 Ibid.
40 Dunn, "Assessing student information literacy skills."; Rockman and Smith, "A multi-dimensional project".
41 Clark, B., "The organizational saga in higher education," in ASHE reader in organization and governance in higher education, ed. Birnbaum, R. (Washington, D.C.: Association for the Study of Higher Education, 1972); Kuh, George D. and Whitt, Elizabeth J., The invisible tapestry: Culture in American colleges and universities, ed. Fife, J. D., ASHE-ERIC higher education report no 1 (Washington, D.C.: Association for the Student of Higher Education, 1988); Townsend, B.K., Newell, L.J., and Wiese, M.D., Creating distinctiveness: Lessons from uncommon colleges and universities, AAHE-ERIC/higher education report, no 6 (Washington, D.C.: The George Washington University, School of Education and Human Development, 1992).
42 Pascarella, Ernest, "Using student self-reported gains to estimate college impact: A cautionary tale," Journal of College Student Development 42 (2001).
43 Pascarella and Terenzini, How college affects students.
44 Carolyn Walters, personal communication, December 22, 2002.
45 Maughan, P. D., Information literacy survey (Berkeley, CA: University of California, Berkeley Library, 2002).
46 Kuh, George D. and Hu, Shouping, "The effects of student-faculty interaction in the 1990s," Review of Higher Education 24, no. 3 (2001).
47 Kuh, G. D., "What we're learning about student engagement from NSSE," Change 35, no. 2 (2003).
48 Dunn, "Assessing student information literacy skills."
49 Kuh, "What we're learning about student engagement from NSSE."
50 Pascarella, "Using student self-reported gains to estimate college impact: A cautionary tale."
51 Item-total correlations range from .40 to .62 indicating that each item contributes substantially to the scale.
52 GAINSUM Cronbach’s alpha = .92; item-total correlations range from .39 to .68
53 Carnegie Foundation for the Advancement of Teaching, Carnegie classification.
43
54 Y-standardized effect size (unstandardized B coefficient divided by the standard deviation of the dependent variable).
55 Only Y-standardized effect sizes greater than |.08| are shown.