Embed Size (px)
Citation preview
Kirsty White Head of Quality Regent's Place 350 Euston Road London
NW1 3JN 8th December 2010 Dear Kirsty,
The Royal College of Anaesthetists Annual Specialty Report August 2009 – July 2010
Please find enclosed the ASR for Anaesthesia. This report has been compiled in accordance with the GMC template provided. In addition there are two appendices. Appendix 1 is the FRCA examination data in accordance with the GMC provided template. Appendix 2 is a detailed report on the FRCA examination and comprises data broken down into various areas, which should be used in alongside the main report. As previously discussed the Report has remained generic on purpose. Specific reference to deaneries and hospitals are not made in the report itself in order to enable the report to be shared freely with College representatives and the deaneries. However, the information in the report is derived from information that can be made available to the GMC on request. If you require any further information please do not hesitate to contact me on 020 7092 1558 or [email protected]. Yours sincerely,
R A J Bryant Director of Training & Examinations Copy to: Dr Nightingale - President RCoA Dr van Besouw - Training Vice-President RCoA Dr Thornberry - Medical Secretary RCoA
www.gmc-uk.org 1
Annex 11 to the Quality framework operational guide
ANNUAL SPECIALTY REPORT TO GMC
Section 1. Details of the college/faculty
Name of college/faculty: The Royal College of Anaesthetists
Specialty: Anaesthesia
Section 2. Contact details
Contact details for the person responsible for submitting this form to the GMC
Name: Mr Richard Bryant
Address: Churchill House, 35 Red Lion Square, London, WC1R 4SG
Job title: Director of Training and Examinations
Telephone number: 020 7092 1558
Mobile number: 07545 586613
E-mail: [email protected]
www.gmc-uk.org 2
Please state the evidence that identified or gave rise to the concern when including concerns in the ASR.
Section 3. Topics and issues to be covered in the ASR
Introduction
Question College Response/Comment
Please provide a summary of college/faculty activity in relation to the specialty during the reporting period (e.g. engagement with deaneries, externality in deanery visits, training programmes for trainers/assessors).
GMC PMETB Merger. RCoA engaged actively in the Patel Review, the consultation on the merger of PMETB into the GMC and attended the workshops. Through this the College was able to demonstrate its eagerness to work closely with all key stakeholders in PMETB.
RCoA Quality Management of Training Committee (QMT). The Quality Assurance Committee restructured in late 2009 to become 2 separate bodies. The Service Accreditation Delivery Board, under the Professional Standards Directorate and the QMT under the Training and Examinations Directorate. This revamped committee has quickly established a more efficient means of analysing QM data and acting on it as required. Internal membership of the Committee has ensured that all aspects of PMET quality management are represented, including the Faculty of Pain Medicine (FPM). The Committee receives and responds appropriately to external reports and is the first College point of contact for any quality issue.
MOUs with Deaneries. Following an initiative from the Northern Deanery the RCoA attempted to establish MOUs with all Deaneries. The Deans were concerned that this approach was fragmented and requested further consideration via COPMeD. As an interim measure the College has produced a declaration of the assistance it will provide to Deans on PMET issues to support QA.
External Advisers RCoA continues to provide external advisers to deaneries for visits and ARCPs. RCoA continues to actively support their representatives, which include Regional Advisers (RAs) and senior consultant anaesthetists; and has encouraged RAs to conduct pastoral visits to hospitals within their regions as part of their normal duties. As this is not a formal visit it does not affect daily routine in hospitals and serves to inform the Deanery and College of any potential concerns and importantly, gives the trainees and consultant staff (including College Tutor) within the hospital a chance to discuss issues about training. This has been very successful and detailed agreed reports have resulted in a clear picture of the delivery of training across the countries.
Visits and QMT Data Capture. The QMT has set up a reporting system and has captured all relevant data from visits in a spreadsheet. This has enabled quick identification of both areas of concern and best practice.
Recruitment. RCoA conducted nationally coordinated recruitment for CT2 and ST3 in 2010 in conjunction with the West Midlands Deanery. This was generally a success, with fill rates being high and trainee satisfaction fairly high. A survey of both trainers and recruiters was conducted and the results are available on request. Lessons identified will be learned in the 2011 recruitment rounds.
PLG. Membership of the PLG comprises 9 lay members and 7 medical members, one of whom is a Vice President of the RCoA. The Lay Chairman of the PLG is requested to sit on College Council. Lay members participate in all key college committees and working parties which concern training: Quality Management of Training, Training, Examinations and Equivalence. They have been directly involved on the production of the e-portfolio for anaesthesia trainees. The PLG was represented at all stages of the development of the new curriculum this year and the resultant examination review. In addition, both the Faculty of Pain Medicine and the newly formed Faculty of Intensive Care Medicine have lay members on their respective Boards and this will extend into representation on their respective training committees when
www.gmc-uk.org 3
formed.
Please provide an update on the feedback provided by PMETB/GMC on last year’s ASR. Please note any actions taken.
The feedback from the last ASR submission was welcome and provided clear guidance from the GMC on the requirements for this year’s report. The recommendations have been incorporated into this report. The report includes areas from Core Training and ACCS (Anaesthesia).
The recommendation to provide specific details on areas of concern specific to deaneries and LEPs has been discussed with the GMC. Whilst there will be no specific references in this report, as this report is distributed to all Deaneries and College Representatives, the author has discussed with the Head of Quality a suitable work around.
What initiatives and plans has the college identified for the following year?
Support to RAs. A programme of visits to regions has been set up for 2010-11 to visit RAs and discuss key concerns that effect them locally, these visits will be supported by members of Council including the College Officers and Senior Management Team. The College continues to support clinicians actively involved in all aspects of training and will continue to seek reassurances that they will be appropriately supported by Trusts.
Visits to STCs. The Director of Training and Examinations and the Training Manager will over the early part of the academic year 2010-11 visit school and deanery STCs to discuss training delivery and in particular the implementation of the 2010 Curriculum. This will identify areas of concern trainers might have in the delivery of training within the new Curriculum, particularly in terms of assessments.
Curriculum implementation. The College consulted extensively before finalising the implementation plan for the 2010 curriculum. All CT 1 trainees started on the new curriculum in August 2010 and the remainder of the CT2 to ST5 trainee cohort will transfer on a School of Anaesthesia basis , transfer will be completed by August 2011. Due to the changes at the higher and advanced levels in the curriculum, trainees in ST6 and 7 will remain on the 2007 curriculum to CCT. So far, the feedback on the clinical aspects of the curriculum has been very positive.
MTI. RCoA will fully implement MTI for 2010-11 and will work closely with the AoMRC and Trusts to ensure suitable training and posts are provided which will allow a doctor to utilise their training experience upon return to their home country.
Workforce Planning. Workforce planning is a key factor in PMET delivery and quality. With the creation of CfWI the RCoA is now actively engaged in collection and analysis of workforce data. A clear and distinct workforce strategy is being developed by the College to ensure that the specialty is appropriately supported and correctly configured to meet the future requirements of the NHS in England and the devolved nations.
Recruitment. RCoA continues to improve the national recruitment process for anaesthesia. Recruitment to CT1 anaesthesia and ACCS will be coordinated nationally for the first time in 2011 with the 2nd iteration of CT2 and ST3. Further work will continue over the next 3-5 years to streamline and further improve recruitment to anaesthesia to meet the needs of the workforce plan.
Simulation. Further work will be conducted on the use of simulation to support training. A working group is being set up to identify and to take advantage of existing best practice in the use of simulation for trainers and trainees.
Continued Engagement with COPMeD and Deaneries. RCoA will continue to engage with COPMeD and Deaneries on improving the communication between them and striving for quality improvement.
Broad Based Training. It is clear that trainees are eager to gain a broad spectrum on experience during the early part of their career. RCoA will
www.gmc-uk.org 4
further investigate options to provide broad based training at core level.
Review of FRCA Examinations. RCoA will conduct a thorough review of the FRCA. This will include investigation into the content, position and delivery of both the Primary and Final FRCA within the current curriculum.
FFPMRCA Examination. The FPM project to introduce a Fellowship entry examination will be entering its final stages during 2011, with the first examination expected in 2012. The examination is NOT an exit examination, but will allow the Faculty to monitor standards in Pain Medicine from amongst its future Fellows.
International Programmes. RCoA though the Bernard Johnson Adviser (International Programmes) (BJA(IP)) will look to further investigate support to developing countries over the next year.
RAF Critical Care Air Support Team (CCAST) Training. The College is working with the Defence Medical Services to resolve a problem with training continuity for RAF trainees who have a service obligation to support the Critical Care Air Support Team. This work is ongoing and is expected to be resolved in early 2011.
Workplace Based Assessments Working Party. RCoA has set up a WBA working party to provide clear guidance on WBA within the training programme to all trainers as well as provide advice and recommendations on changes to WBAs.
Key issues
Question College Response/Comment GMC Standards for Training Domains
Did the college/faculty identify any key issues in relation to training nationally for the specialty? (For example challenges on the horizon).
Overseas Doctors Training Scheme (ODTS). ODTS has been widely misunderstood and was being used to employ doctors on short term contracts to cover service shortfalls. As a result the ODTS was suspended in June 2010 and after a period of evaluation the College has decided to fully embrace MTI as the means of providing quality training opportunities to doctors from overseas.
e-LA. The removal of funding support to ELfH has severely affected assistance provided to trainees, particularly in preparing for the FRCA. E-LA is an essential resource that is well used by trainees. Continual development is required.
Lead Employers. The current structure of employment contracts for doctors in training has complicated and compromised the ability of training programmes to move trainees around hospitals within a programme and makes seamless training delivery more difficult. A move to a system of a lead employer within a programme will assist with the issues of rotation. Complexities of repeatedly changing employer is time consuming and makes the training programmes generally inflexible. Discussions on this issue are ongoing.
Funding. The change of Government and the enhanced focus on efficiency savings and stringent cuts has already begun to affect training. SHAs and Deaneries are looking to reduce costs and this is resulting in a reduction of support to trainers and in some cases a reduction in training numbers (see below).
Domains 2,3,4,6,7,8 Domains 5,6,7,8 Domain 2,6,7 Domains 1,2,5,6,7,8

www.gmc-uk.org 5
Workforce Planning. There has been an increasing occurrence of SHAs arbitrarily cutting ST3 numbers, South Central are cutting ST3 numbers by 25% in Oxford and 20% in Wessex for 2011. Although the justification for this is given in reference to the CfWI report it is clear that this is not robust data. RCoA is concerned that the cutting of NTNs is a national issue and should not be conducted at a local level.
Reconfiguration. Reconfiguration will affect all aspects of training delivery as well as service. SHAs are looking to make significant savings by service reconfiguration and training provision is not high on their priority list. There is considerable danger that training will be adversely affected as Trusts reconfigure services.
LTFT Training. There has been an Increase in female recruitment (50% to CT1– 100% for CT 1 in Northern Ireland for August 2010 intake) to the specialty which has resulted in a need to incorporate more slot shares into training rotations and has long term implications for workforce planning. The unknown is how many will want to train on a LTFT basis, perhaps from an earlier stage in the training programme and then how many will wish to work LTFT as a consultant?
Remedial CT2. There is an inconsistency of interpretation on the extension to core training allowed in the Gold Guide. Some Deaneries continue not to extend CT2 contracts if a trainee fails to achieve the BLTC mostly due to examination failure, whereas others automatically grant a full 12 months extension and title this CT2 Remedial. This has an immediate impact on recruitment to ST3 and available vacancies.
Domains 1,4,6,7 Domains 1,5,8 Domains 2,3,4,5,6,7,8 Domains 1,2,4,6,7,8,9
Did the college/faculty identify any concerns in relation to training nationally for the specialty?
Initial Assessment of Competence (IAC). Feedback from trainers has indicated there is some confusion on the level of supervision required for various procedures after a trainee has achieved their IAC. This is of particular concerns with ACCS trainees in EM and AM. The IAC does not allow a trainee to be unsupervised but allows them to be included on the on-call rota where sufficient supervision at the right level is provided. A Training Programme Update was released clarifying the rules pertaining to the IAC and trainers have been informed of the requirements.
Obstetric Competencies/Initial Assessment of Obstetric Competence (IAOC). Evidence suggests that the IAOC is, in some cases not being conducted. This is a key competence at CT2 and non compliance is a concern regarding clinical skills at core level. RAs and CTs are addressing this and the College has mandated that completion of the IAOC is formally reported.
Protected Training Time. Protected training time continues to be an ongoing challenge. Although WTR has impacted upon training time there are other factors which create a challenging environment in which to ensure the delivery of a high quality teaching programme. The College has made it clear that for each unit of training, trainees must be programmed for a minimum of 20 direct training sessions to enable them to achieve the core clinical learning outcomes specified in the curriculum.
Levels of Competence. There continue to be incidents where trainees are asked to perform tasks that are beyond their self-perceived or actual levels of competence. These issues have been raised with specific deaneries following feedback from both pastoral and triggered deanery visits. Where required deaneries have directly addressed the
Domains 1,2,3,6,7,9 Domains 1,2,3,6,7,9 Domains 5,6,7,8 Domains 1,2,6,9
www.gmc-uk.org 6
issues. RCoA actively monitors Trusts where these concerns have been identified in accordance with agreed deanery protocols.
Deferment of Units of Training. There has been a slight increase in the request to defer units of training from the intermediate phase of training to higher. The RCoA is keen to champion the principles of spiral learning and is working with Schools of Anaesthesia to ensure that the curriculum is deliverable.
Service vs Training. There is continued evidence of hospitals providing less effective training opportunities. Deaneries are faced with increasing pressure to reduce costs and adhere to SHA cost cutting policy. This is evident in a number of hospitals currently causing concern.
Domains 2,5,6,7,8,9 Domains 1,2,6,7,9
Did the college/faculty identify any areas of notable practice in relation to training nationally for the specialty?
Defence Medical Services Training. PMETB approved for training a period of deployment to field hospitals for anaesthetic trainees in the Armed Forces in 2009. The training opportunities afforded in the Role 3 hospital at CAMP BASTION, Afghanistan is exceptionally high, with a substantial caseload including trauma, ICU and massive blood transfusion cases. Data is deemed too politically sensitive to include in this report. The PMETB approved training has only been available for those trainees in fulltime service with the UK Armed Forces. The College will seek in the coming year approval from the GMC to extend the approval to those doctors in training who are members of the reserves and who are deployed to CAMP BASTION.
Pain Training Advisory Group Training Days. The FPM has been supportive of the move from local PTAGs, notably in London, to run regular training days. These aim to provide education to Advanced Pain Trainees and also to give these doctors, who are often the only one of their kind within a Trust, a useful discussion forum.
LTFT. In recognition of the predicted increase in demand for training on a less than full time basis, RCoA has run an all day meeting (30 Nov 10) aimed at current LTFT trainees, prospective LTFT trainees and trainers with responsibility for LTFT. The meeting “Making Part-Time Work” included talks from Professor Sir John Temple and Dr Anita Holdcroft as well as presentation of the 1st national anaesthetic LTFT trainee survey. This looked at quality of training, opinions on flexible working and implications of the WTD.
Domains 2,5,6,7,8,9 Domains 2,5,6,7 Domains 2,3,5,6,7
Did the college/faculty identify any key issues with specific deaneries and/or local education providers if not identified above (e.g. notable practice or concerns? In case of any concerns was the Dean notified and if so,
Mid Staffs. The enquiry into Mids Staffordshire identified a gap in the continuity of reporting of concerns as a result of the creation of PMETB. This issue has been resolved by the introduction of a Reporting of Concerns mechanism and the ASR process.
Patient Safety. There were a number of deanery visits attended over the year at which College external advisers raised concerns specifically on patient safety issues. In these cases the College engaged with the deanery involved to ensure appropriate action was taken. These issues are continually monitored and the RCoA reserves the right to escalate their concerns via the GMC or CQC should the actions of the deanery be deemed inadequate. In every case, the deanery actions have been in accordance with the formal reporting process and the RCoA has been informed of progress. The means of communicating concerns on service issues affecting patient safety and not necessarily linked to training has been raised with COPMeD.
Domains 1,7 Domains 1,9
www.gmc-uk.org 7
how was the deanery notified?)
Support to Deanery Visits. In every case where the College nominated an external adviser or assisted on a visits and where RAs conducted informal, pastoral visits, the Dean was sent a copy of the report and was kept informed of College activities related to any identified areas of concern.
Capture of Quality Intelligence. RCoA closely monitors and captures all information on visits, including ARCP outcome reports. This is recorded in a data spreadsheet and is used by the Quality Management of Training Committee (QMT) to capture areas of concern and areas of good practice and to identify the actions required by the College. This spreadsheet forms part of the evidence base for this report.
Domains 7,8 Domains 2,7,8,9
Assessments and Examinations
Question College Response/Comment GMC Standards for Training Domains
How has the college/faculty developed the workplace based assessments?
Workplace Based Assessments. RCoA has conducted considerable work in improving the WBA forms and these have now been implemented across all schools. The College continues to provide support and advice to trainers seeking clarification on WBA via the training department and use of the CTs discussion forum on the secure areas of the RCoA website.
Domains 2,5,6,9
How did the college/faculty support training of assessors/ examiners?
See Trainers Section for details of support provided to trainers.
Examiner Training. All selected examiners undergo a thorough induction and training process which includes a training day prior to beginning their tenure as an examiner. No examiner can start their appointment without this training. New examiners are also subject to a rigorous audit in their first year on all aspects of examination delivery. A structured appraisal is conducted at the end of year one.
Exam Plenary Sessions. During the examination periods plenary sessions are held between the end of the examining day and call over. These 45 minute to an hour long sessions cover a diverse range of examination subjects.
Publications. New Examination Regulations came into force in August 2009 and were widely circulated to Regional Advisors, College Tutors and posted on the website well in advance of this date. A full and comprehensive summary of all changes introduced, have been available on the College website since June 2008. The College publishes Guides to the FRCA examination. A third edition of the Primary Guide was published in February 2010, whilst The Guide to the Final published in June 08 is being revised. All Regulations and relevant sections of the CCT that contain the examinations and training curricula can be accessed on the College website: http://www.rcoa.ac.uk.
Domains 2,5,6,7,9 Domains 5,6,9 Domains 5,6,7,8

www.gmc-uk.org 8
Did the college/faculty identify any trends in examination outcomes (e.g. by PMQ, deanery, grade, etc)? Are the trends consistent across examinations or did the different exams have different trends?
See attached Statistical Report. Domains 2,3,5,7,9
How does each college/faculty set the standard for assessments?
MCQ. Methodology criterion referencing using modified Angoff for the MCQ papers both for the Primary and Final with triangulation against UK graduate first-time pass rate. The latter is much less valid for Primary than Final since the introduction of MMC and earlier entry into specialty training. Use of SEM to identify borderline candidates and reducing Angoff score by 1 SEM for all exams adjusts the pass mark to the candidates’ advantage.
SAQ. Examiner discussion on Standard Setting day and establishing criterion-references pass score for each question by working groups.
SOE. Use of 3-point performance scale with independent marking by 2 examiners for each section. The cohort size is small, but work is in progress re-balancing paper difficulty and curriculum coverage. RCoA is working toward a unified approach for Primary & Final FRCA which will be in place for 2012.
OSCE. Angoff referencing for expected scores, comparison of overall examiner impression of "pass" /"fail" with actual scores and Angoff scores. Summative score so that poor performance in one can be made up for by excellent performance in others.
Visitors to Examinations. 175 visitors including College Tutors, members of the Faculty of Pain, prospective Examiners, representatives from the West Indies and the Patient Liaison Group Attended the exams during the year. Feedback from the visitors was noted and discussed and enables the Board of Examiners to review the exams in accordance with the GMC Standards following feedback.
Examinerships. New examiners are recruited to the Board of Primary FRCA examiners, with upward progression to the Board of Final FRCA examiners. The number of Fellows applying to be examiners remains high and 15 new examiners were initially selected from the 75 applicants. Applications from potential examiners are invited early within the calendar year, and the process of selection continues for a number of months before applicants are notified if successful or not. A prospective examiner is required to be a Fellow in good standing, and have the expectation to give a long-term commitment to the role including the ability to devote a minimum of 15 days per academic year to examiner duties, whilst filling an SAS grade or consultant appointment in the NHS, or a comparable post. In the application, the applicant is expected to demonstrate a commitment to education and the work of the
Domain 5 Domain 5 Domain 5 Domain 5 Domains 2,5,7,8 Domains 5,6,7
www.gmc-uk.org 9
College and it is desirable if he or she has visited a Primary or Final FRCA examination. The selection rules are applied consistently and fairly across the board, and the College is keen to ensure that the composition of the Board reflects the demography of the profession.
Candidate feedback. A candidate feedback form will be introduced for 2010-2011 to enable review and audit of the FRCA, RCoA is developing a questionnaire for candidates to identify problems and feedback on exam process working toward the concept of "utility" of the this part of the exam rather than "reliability".
Domains 2,3,5,9
Please provide us with a narrative regarding the exam performance, including basic statistical info and the reliability coefficient for each exam (not by diet).
The Primary FRCA Examination. A total of 1,061 candidates entered the Primary MCQ examination; 54.1% of entrants passed in the 09-10 academic year. The reliability coefficient of this exam remains consistently high with a mean reliability score across the three exams of 0.929. The 3 sittings of the OSCE /SOE components were attended by 877 candidates; overall 421 candidates passed, thus completing the Primary exam (48% of all entrants). The greater variety of possible outcomes (complete fail, partial pass/fail or complete pass) combined with some candidates re-sitting only a single part of the exam at the January and May sittings, makes interpretation of the results more complex, with 8 different candidate results possible. Encouragingly the pass rate for a candidate re-sitting only one part of the exam in the Jan and May 2010 sittings was high at 75.3% for SOE only and 88.7% for OSCE only. To assess the effect of the changes in exam regulations candidates’ outcomes were compared under the old and new systems. The numbers advantaged or disadvantaged were comparable.
The Final FRCA Examination. A total of 971 sat the Final Written examination; 63.9% passed. 688 candidates sat the SOE; 65.7% passed, this is marginally reduced in comparison to the pass rate under the old system. The overall reliability of the September 09 and March 10 SAQ components were 0.74 and 0.77 respectively, with all questions used demonstrating a strong to very strong correlation to overall performance. The reliability coefficient of the MCQ component for September and March was 0.81 and 0.76 lower than the >0.9 previously seen. The Final MCQ Core Group continues to seek to improve the reliability of this part of the exam. The paper setting, standard setting and marking process of the SAQ continues to be refined.
Examinations Changes. The changes that are to come into force from the 1st September 2010 have been well publicised. These include changes to the rules for Guidance, introduction of Single Best Answer questions into the Final MCQ section of the Final FRCA Written examination and some changes to the marking guides of the Primary MCQ and Final SAQ and MCQ. Full details are available on the website.
Overseas Examinations. RCoA continues to send examiners to affiliated Colleges around the world including Bangladesh, Ireland, Hong Kong, Singapore, Sri Lanka and the West Indies. The reports submitted by visiting examiners are considered by the examinations committee. Detailed feedback is offered to the host institutions, and is considered helpful in maintaining standards. Satisfactory reports form the basis for continuing exemption from the College’s Primary FRCA examination. RCoA does not export the FRCA and it eligibility is limited to UK doctors in training or those who have previously been in UK training posts. This is considered essential in maintaining
Domains 2,5 Domains 2,5 Domains 2,5,7,9 Domain 2

www.gmc-uk.org 10
standards and keeping the FRCA relevant to UK practice in the NHS. Changes are being introduced to allow overseas applicants for ST3 jobs sit the Primary FRCA, but this will be strictly monitored to ensure that UK trainees are not disadvantaged when applying for the examination.
Guidance to unsuccessful Candidates. Guidance has been mandatory for a candidate who has failed the Primary OSCE and/or SOE on two occasions or the Final Written or Final SOE on three occasions before a further attempt at the relevant examination was permitted. The detailed examination results now made available by the Examinations Department have reduced the applicability of this process. A change to the regulations in regard to guidance has been published on the College website and will come into force in September 2010.
Number of Attempts for the Primary MCQ. From June 2009 the number of attempts allowed at the Primary MCQ was reduced from unlimited to five and the validity of a pass as part of the eligibility towards the Primary OSCE/SOE was reduced from three to two years.
The Primary OSCE/SOE Changes. This was the first year of examinations conducted under the revised 2009 regulations. To achieve an ‘overall’ pass in the Primary, candidates must now obtain an obligatory pass in both the OSCE and SOE. Changes to the conduct and assessment of the SOE came into force, whereby a candidate must obtain a total score of 37/48 or more from the summative score of an independent assessment of 4 examiners across the two SOE components.
Final Written Examination Changes. These were the first uncoupled, stand-alone written exams following the 2009 changes. The pass mark for the written paper became the sum of the percentage pass marks from the MCQ and SAQ papers.
The Final SOE Changes. Changes to the conduct and assessment of the SOE came into force similar to that in the Primary requiring a candidate to obtain a total score of 32/40 or more to pass.
Domain 3 Domains 2,5,6 Domains 2,7 Domains 2,5 Domains 2,5 Domains 2,5
Has the college/faculty identified any issues regarding the Annual Review of Competence Progression (ARCP)? Please include commentary on college/faculty involvement in ARCPs and academic training ARCPs.
External Advisers. RCoA provides external advisers to deaneries for ARCP panels. This offer is taken up by all deaneries and is working well.
College ARCPs Reports. RCoA has updated the ARCP external adviser’s report which is sent to the School and Deanery. The standard of ARCP has been high and the reports have been generally complimentary to the ARCP processes across all deaneries. The Peninsula deanery, in particular stood out in this regard.
Primary Exam Failure. A significant amount of Outcome 3 decisions at ARCP between CT2 and ST3 area result of exam failure. Data suggests that trainees who do not achieve an outcome 3 at this stage progress after 6 months additional training time and further opportunities to take and pass the Primary Examination.
Domains 2,5,6,7,9
Domains 2,5,6,7,9
Domains 2,5,6,7,9

www.gmc-uk.org 11
E-Portfolios
Question College Response/Comment GMC Standards for Training Domains
Please comment on the development and local implementation of the e-portfolios (e.g. links with deaneries?)
e-Portfolio SLA. A contract was signed with Premier IT in August 2010 to deliver the training e-Portfolio following development of a full statement of requirements. A pilot using 3 schools (Bristol, Northern Ireland and South East Scotland) started in October 2010.
Planned Roll Out. Full roll out of the e-Portfolio will take place in August 2011 to all schools. Full functionality will be developed in a phased approach and improvements to the system will continue after roll out.
Development of e-Portfolio Operating Procedures. The development of operating procedures is ongoing and this will encompass usage in trusts and schools. The pilot will identify the key issues concerning support of the system. It is likely that there will be some shortfalls in capability as a result of resources at trust level, including administrative staff, access to IT, broadband and internet access.
Usage. Some conflict with Virtual Learning Environments (VLE) in some Schools may create overlap and duplication. It is hoped that anaesthesia trainees will all use RCoA e-Portfolio as this will be accurately mapped to the training programme. Trainees registered with the College will not be charged to use the training e-Portfolio.
Domains 5,6,7,8,9 Domains 5,6,7,8,9 Domains 5,6,7,8,9 Domains 2,7,8
Trainers
Question College Response/Comment GMC Standards for Training Domains
Did the college identify any trends, concerns or notable practice in relation to trainers, locally or nationally (e.g. protected teaching time)?
Support to Trainers. There is continued concern on the support afforded to trainers, both in the delivery and the overall support for training. This includes work as RAs, CTs and for those acting as an external adviser on visits. The Joint statement from PMETB/GMC, COPMeD, and AoMRC has been of some help but continued pressure is required to support medical practitioners who actively seek to improve training quality. Trainers are under increasing pressure to justify supporting professional activities or those which may detract from direct clinical care contracts are under increased scrutiny from employers looking to achieve financial savings. The College continues to actively support trainers but more is needed to be done to formally protect these essential activities.
MSF for Trainers. A number of anaesthetic departments have introduced MSF for trainers over the past year. This has had a marked effect on the quality of training delivery and has resulted in consultants actively seeking to improve their training skills, which also forms an important aspect of the enhanced appraisal for revalidation.
Domain 6,9 Domains 2,6,9
www.gmc-uk.org 12
Please comment on any activity to support and develop trainers (e.g. briefing sessions on delivering the new curriculum). If you deliver any training courses please comment on participation and any trends.
RAs’ Meetings. RCoA hold 3 RAs’ meetings annually, training concerns are raised regularly at these meetings and discussed in detail. Curriculum concerns and implementation has been discussed at these meetings over the year and has proved an excellent forum in which to resolve concerns and confusion of curriculum related issues. . The FPM also runs two RA in Pain Medicine meetings annually, the first of which has an open invitation to Advanced Pain Medicine trainees to discuss training and careers issues. Attendance includes RAs, Heads of School (HoS) and TPDs.
CTs’ Meetings. The College holds an annual meeting for CTs during the summer much in the same vane as the RA meetings. This meeting provides the College the best opportunity to speak to all tutors and vice versa. Attendance is upwards of 300 and feedback is generally positive. It is here that RCoA is able to ascertain what the practical challenges of delivering the training programme are.
Training Programme Updates. RCoA produces regular TPUs on an as required basis. Records of these are available on the RCoA website.
New College Tutor Training Days. These courses are delivered to all newly appointed CTs and occur twice a year to help them with their role. The courses over 2 days cover issues such as mentoring, trainees in difficulty and workplace based assessments. Attendance at these meetings is mandatory and feedback from attendees has been very positive.
ACCS Trainers Day. An ACCS training day was held in Mar 10 for all specialty streams in ACCS. There was valuable discussion on best practice across the country and a number of key issues on the delivery of ACCS training discussed, including the management of rotations and the delivery of anaesthetic training.
Domains 2,6 Domains 2,6 Domains 2,5,6,7,9 Domains 2,5,6 Domains 2,5,6
Flexible Training
Question College Response/Comment GMC Standards for Training Domains
Did the college/faculty identify any trends, concerns or notable practice in relation to flexible training nationally for the specialty
Less Than Full Time (LTFT) Training. Anaesthesia is the 3rd largest specialty for LTFT trainees, 8% of trainees are training LTFT and 90% of these are female. The majority train at 60% and there have currently been no requests to train less than 50%. The College does not support <50% as and is keen to ensure deaneries offer LTFT training at 60-80% despite the difficulties involved in delivering this.
Domain 6
www.gmc-uk.org 13
(e.g. filling rota gaps)?
European Working Time Regulations (EWTR)
Question College Response/Comment GMC Standards for Training Domains
Please comment on the impact of EWTR on training nationally for the specialty.
RCoA EWTR Survey. The RCoA published the results of a post implementation EWTR survey in December 2009. This survey looked at compliance, recruitment, training and the effect on consultant and career grade workload. Concerns raised included the number of gaps on rotas that compromised compliance, difficulties in recruiting middle grade doctors and concerns about trainees failing to reach projected milestones.
Time Taken to Achieve Initial Assessment of Competence (IAC). Detailed investigation of training concerns looking at the time to achieve the initial assessment of competence demonstrated that although the WTR contributed to some delays, the reasons were multi-factorial. A more significant challenge appears to be gaining enough experience in obstetric anaesthesia at basic level within the two year basic training programme. Concerns raised by a trainee survey have been followed by a comprehensive trainers’ survey in conjunction with the OAA.
RCoA Input to the Temple Report. The College has shared their information with the DH and PMETB contributing to the Temple enquiry into the effects of the EWTR on training. Verbal and written reports were submitted and both consultant and trainee representatives participated in discussion forums.
Difficulty of Compliance to Rigid EWTR Rules. The recent GMC trainee survey reports EWTR compliance is still a challenge across all deaneries. Although the overall mean compliance is 90% the inter deanery range varies from 78.5-98%. Verbal feedback from College Tutors suggests that the rigidity of the EWTR rules are more difficult to manage rather than a reduction to 48 hours itself. Any potential reduction in trainee numbers is going to challenge this further especially in the current financial climate limiting consultant expansion.
Domains 1,2,5,7,9 Domains 1,2 5 Domains 2,5,7,9 Domains 1,2,5,7,9
Equality and Diversity
Question College Response/Comment GMC Standards for Training Domains
Please comment on any trends or issues you have identified
Trainees with Disabilities Ability to Complete the Training Programme. There are a number of trainees with disabilities in anaesthesia training. Their ability to cope with the specific demands of the specialty are actively managed. Although every effort is made to ensure their needs are met this must not be to the detriment of patient safety. Discussions are ongoing regarding wheelchair bound trainees and their ability to intubate
Domains 1,3
www.gmc-uk.org 14
regarding Equality and Diversity nationally for the specialty and any actions taken as a result (e.g. fail rates among non-UK PMQ. Is the college/faculty taking any action to support those trainees who are in UK training programmes?).
patients and react to emergency calls.
FRCA Examination Access and Support. RCoA FRCA examinations regulations are implicit in the provision of support required to trainees with specific needs. All information is available on the website and the Examination department are conversant with what can and cannot be provided.
IMG Examination Pass Rate. The pass rates for those trainees who have not attended UK medical school is significantly lower (see statistical report). However there is no significant difference in overseas trainees who have attended medical school in the UK. Training courses and guidance and advice are provided for all trainees to assist them in taking and passing the FRCA.
LTFT Training. LTFT Trainees are actively encouraged in the specialty (see section on LTFT Training in this report).
Domains 3,5 Domains 3,6 Domains 3,6
Academic training
Question College Response/Comment GMC Standards for Training Domains
Please comment on academic training nationally in relation to the specialty (e.g. participation rates or trends, concerns, notable practice).
Academic Post Numbers. There is limited clarity on the number of Academic posts nationally and their status. In terms of workforce planning this is an area of concern. MMC are keen to establish the extent of ‘fellowship’ posts that are effectively training posts by another names. There is evidence that such posts are creating gaps in the rota. RCoA is currently undergoing work to establish the extent of academic posts and whether these are approved under the GMC Form A or are OOPT.
Domains 2,3,5,6,7
Curriculum
Question College Response/Comment GMC Standards for Training Domains
www.gmc-uk.org 15
Did the college/faculty identify any trends, concerns or areas of notable practice regarding core and/or higher specialty training (if applicable)?
As stated previously in this report.
Please describe the colleges’/faculties’ plans and processes regarding the implementation of the 2010 Curriculum. Please comment on any engagement with deaneries.
2010 Curriculum Implementation. The College consulted with the Schools of Anaesthesia on how the curriculum should be implemented and what timelines should be followed. The implementation plan once agreed with the Schools was approved by PMETB.
Pain Medicine Curriculum: The FPM has been in liaison with its regional representatives during 2010 regarding the implementation of the new curriculum, which now requires a 3 month block of Higher training and includes 3 (soon to be 4) optional modules in the advanced year. The FPM has developed Study Days to cover the optional modules and will be developing Frequently Asked Questions.
ACCS Curriculum. The Intercollegiate Committee for ACCS Training (ICACCST) agreed a standard ACCS curriculum for 2010. This is fully compatible with the Anaesthetics Curriculum and reflects the training delivered.
Domains 5 Domain 5 Domain 5
Please describe any actions taken in relation to any remaining conditions on approval set in the Formal Review approval letter.
There are no outstanding conditions.
Please describe any actions taken in relation to any recommendations made (for example following the Formal Review).
The College reviewed the recommendations and a response was sent to the GMC along with our response to the conditions in a letter dated 16 April 2010 to the Head of Curriculum and Evaluation at the GMC (Appendix 2).
Responses to concern
www.gmc-uk.org 16
Question College Response/Comment GMC Standards for Training Domains
Please identify any concerns that the specialty wishes for the GMC to investigate and potentially take action on. Please provide evidence to support the referral.
None identified.
Please refer to sources of evidence but do not attach the evidence unless raising a specific concern for the GMC to investigate. Please do not include workforce or clinical issues that do not impact on training; the link to training needs to be explicit.
Section 4. Declaration
I confirm that the information given on this annual college/faculty reporting form is correct.
Signature:
Date: 8th December 2010
Position held: Director of Training and Examinations
Name
Specialty
Name of examination
DeaneryMale Female Asian Black
Chinese/ SE
AsianWhite Other Unknown UK graduate
Non-UK
graduate
Defence (Tri Services) 9 5 14 14
Primary FRCA SOE/OSCE 12 9 12 7 2 11 10
East of England 7 12 8 10 1 9 10
East of Scotland 1 3 1 1 2 2 2
Kent, Surrey and Sussex 12 6 6 1 11 10 8
London 56 65 35 4 10 58 14 92 29
Mersey 13 10 5 1 16 1 17 6
North of Scotland 5 3 1 6 1 7 1
North Western 17 18 7 1 26 1 30 5
Northern 19 12 10 2 19 21 10
Northern Ireland 3 1 1 3 1 3
Oxford 12 5 6 11 14 3
Severn 9 10 1 16 2 19
South East Scotland 5 2 3 3 1 2 5
South West Peninsula 9 11 2 17 1 18 2
Wales 14 9 8 15 17 6
Wessex 6 10 2 13 1 13 3
West Midlands 24 16 18 1 18 3 24 16
West of Scotland 8 12 6 14 13 7
Yorkshire and Humber 32 32 18 1 41 4 44 20
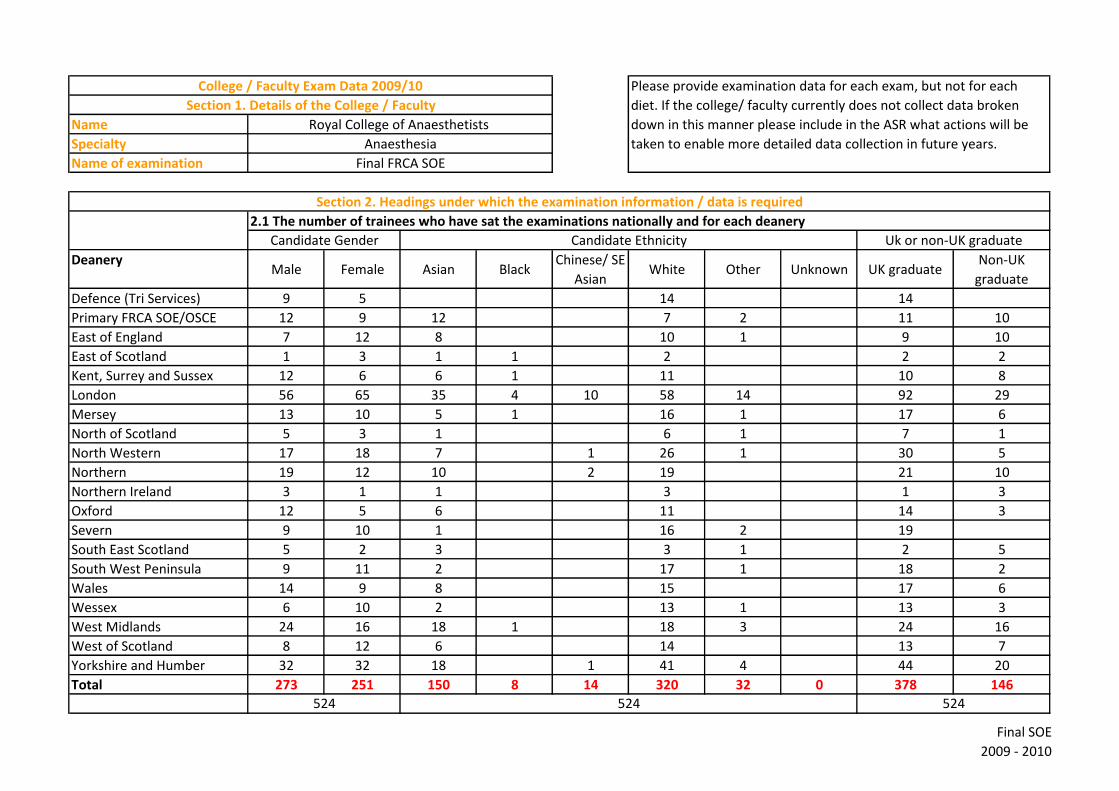
Total 273 251 150 8 14 320 32 0 378 146
524524
College / Faculty Exam Data 2009/10 Please provide examination data for each exam, but not for each
diet. If the college/ faculty currently does not collect data broken
down in this manner please include in the ASR what actions will be
taken to enable more detailed data collection in future years.
Section 1. Details of the College / Faculty
Royal College of Anaesthetists
Anaesthesia
Final FRCA SOE
Section 2. Headings under which the examination information / data is required
524
2.1 The number of trainees who have sat the examinations nationally and for each deanery
Candidate Gender Candidate Ethnicity Uk or non-UK graduate
Final SOE
2009 - 2010
DeaneryMale Female Asian Black
Chinese/ SE
AsianWhite Other Unknown UK graduate
Non-UK
graduate
Defence (Tri Services) 6 5 11 11 -
East Midlands 8 6 5 6 3 9 5
East of England 6 10 6 9 1 9 7
East of Scotland 1 3 1 1 2 2 2
Kent, Surrey and Sussex 10 4 4 1 9 9 5
London 44 53 24 2 6 52 13 77 20
Mersey 11 8 3 1 15 15 4
North of Scotland 3 3 5 1 6 -
North Western 13 12 3 1 20 1 23 2
Northern 18 11 10 19 19 10
Northern Ireland 2 1 3 1 2
Oxford 11 5 5 10 1 13 3
Pharmaceutical Medicine
Severn 9 10 1 16 2 19 -
South East Scotland 2 2 1 3 2 2
South West Peninsula 9 9 2 15 1 16 2
Wales 13 8 5 15 1 16 5
Wessex 5 7 11 1 11 1
West Midlands 15 12 7 1 17 2 20 7
West of Scotland 3 8 2 9 9 2
Yorkshire and Humber 25 29 11 1 37 5 39 15
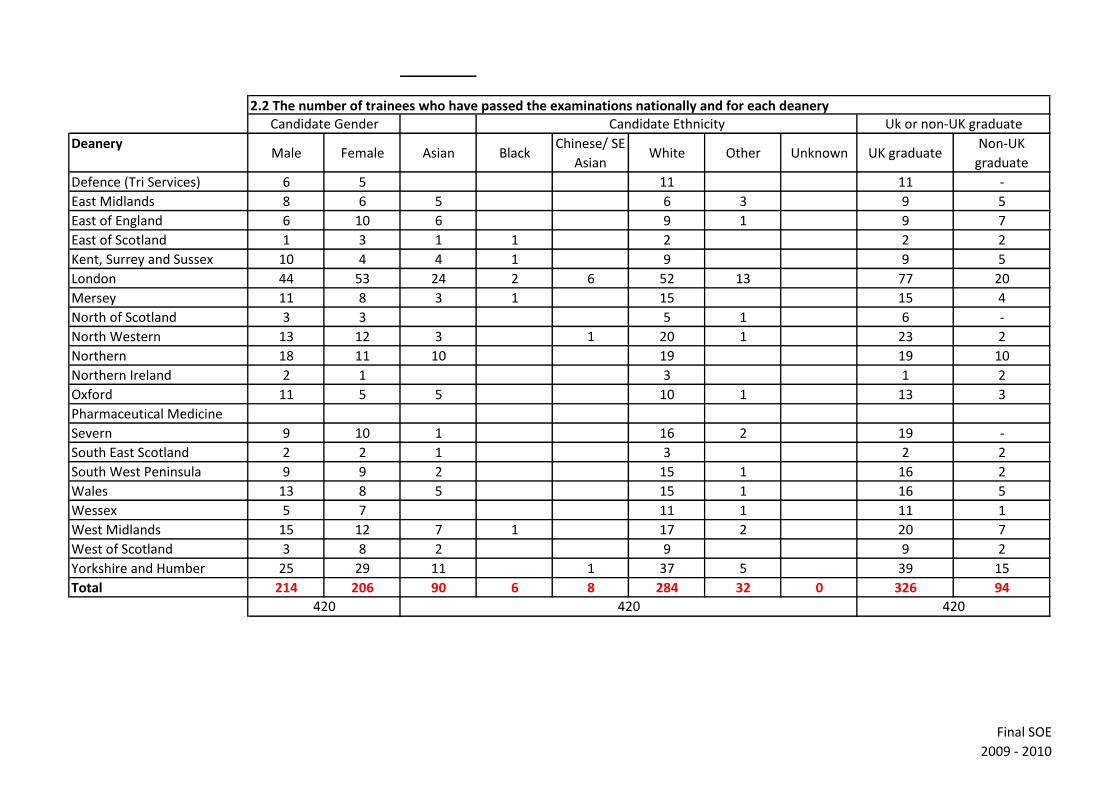
Total 214 206 90 6 8 284 32 0 326 94
Uk or non-UK graduate2.2 The number of trainees who have passed the examinations nationally and for each deanery
420420
Candidate Gender Candidate Ethnicity
420
Final SOE
2009 - 2010
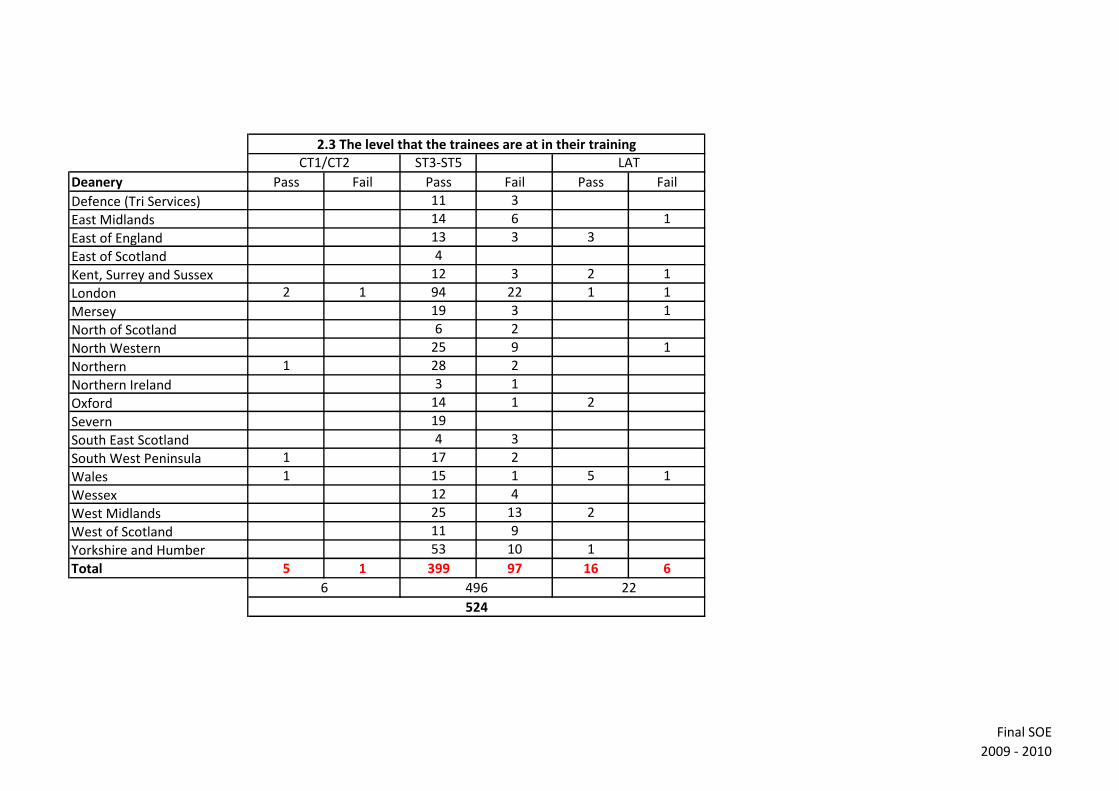
ST3-ST5
Deanery Pass Fail Pass Fail Pass Fail
Defence (Tri Services) 11 3
East Midlands 14 6 1
East of England 13 3 3
East of Scotland 4
Kent, Surrey and Sussex 12 3 2 1
London 2 1 94 22 1 1
Mersey 19 3 1
North of Scotland 6 2
North Western 25 9 1
Northern 1 28 2
Northern Ireland 3 1
Oxford 14 1 2
Severn 19
South East Scotland 4 3
South West Peninsula 1 17 2
Wales 1 15 1 5 1
Wessex 12 4
West Midlands 25 13 2
West of Scotland 11 9
Yorkshire and Humber 53 10 1
Total 5 1 399 97 16 6
CT1/CT2 LAT
6 22496
2.3 The level that the trainees are at in their training
524
Final SOE
2009 - 2010
DeaneryMale Female Asian Black
Chinese /SE
AsianWhite Other
UK
graduate
Non-UK
graduate
Defence (Tri Services) 1 1 1
East Midlands 3 3 3
East of England 1 2 2 1 3
East of Scotland 1 1 1
Kent, Surrey and Sussex 1 1 1
London 4 5 6 1 1 1 2 7
Mersey
North of Scotland
North Western
Northern 1 1 2 1 1
Northern Ireland
Oxford
Severn
South East Scotland
South West Peninsula
Wales 1 1 1
Wessex
West Midlands 4 3 6 1 7
West of Scotland 2 1 1 2 1 2
Yorkshire and Humber 1 2 2 1 1 2
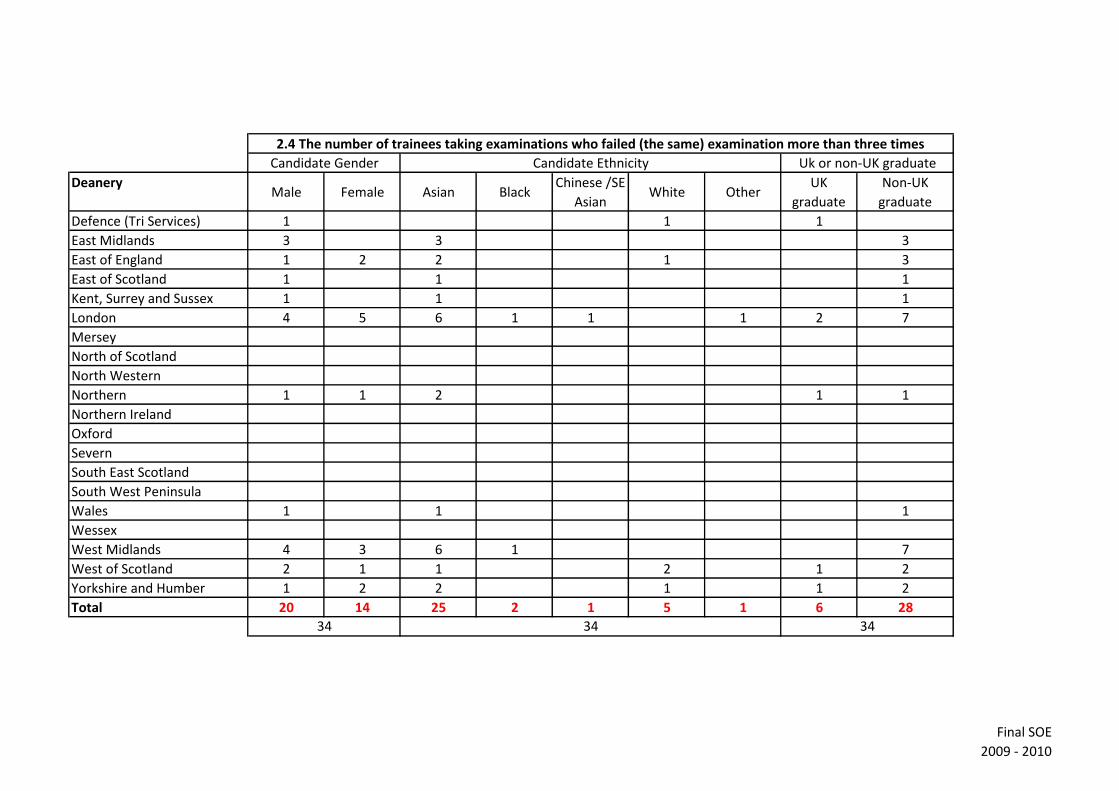
Total 20 14 25 2 1 5 1 6 28
Uk or non-UK graduateCandidate Gender Candidate Ethnicity
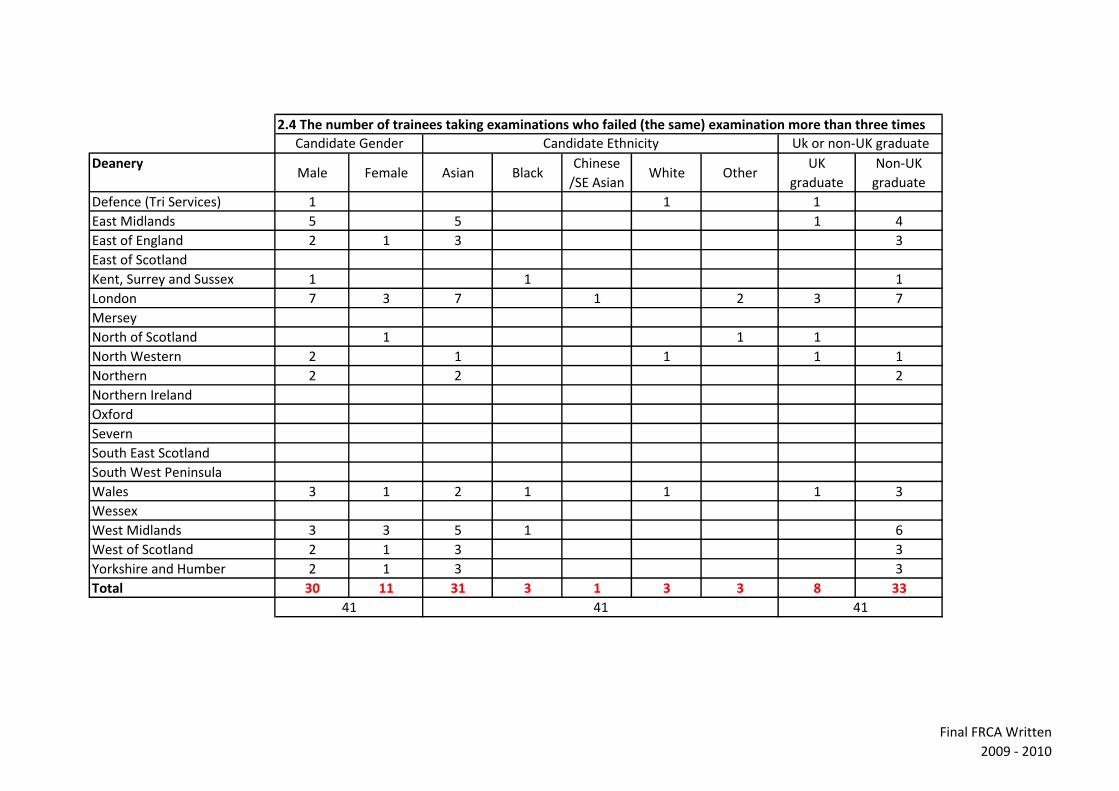
2.4 The number of trainees taking examinations who failed (the same) examination more than three times
34 34 34
Final SOE
2009 - 2010

Name
Address
Job title
Telephone number
Mobile number
Signature:
Date:
Position held:
Section 3. Contact details
Contact details for the person responsible for submitting this form to the GMC
Director of Training and Examinations
Section 4. Declaration
I confirm that the information given on this annual college/faculty reporting form is correct.
06-Dec-10
Richard Bryant
The Royal College of Anaesthetists
Director of Training and Examinations
020 7092 1558
07545 586613
Final SOE
2009 - 2010
Name
Specialty
Name of examination
DeaneryMale Female Asian Black
Chinese/
SE AsianWhite Other Unknown UK graduate
Non-UK
graduate
Defence (Tri Services) 11 5 16 16
East Midlands 18 15 15 1 11 6 16 17
East of England 13 13 11 12 3 9 17
East of Scotland 1 4 1 1 3 3 2
Kent, Surrey and Sussex 18 10 9 4 14 1 16 12
London 87 86 46 5 10 86 26 137 36
Mersey 15 10 5 1 18 1 19 6
North of Scotland 6 5 1 7 3 9 2
North Western 17 25 9 1 31 1 35 7
Northern 22 16 12 2 24 26 12
Northern Ireland 7 2 2 7 4 5
Oxford 14 8 6 1 14 1 20 2
Severn 20 14 4 25 5 29 5
South East Scotland 7 3 4 5 1 4 6
South West Peninsula 7 11 1 16 1 17 1
Wales 25 16 12 3 25 1 25 16
Wessex 7 9 2 1 13 14 2
West Midlands 33 21 26 2 1 21 4 29 25
West of Scotland 18 19 18 18 1 17 20
Yorkshire and Humber 41 35 24 1 46 5 47 29
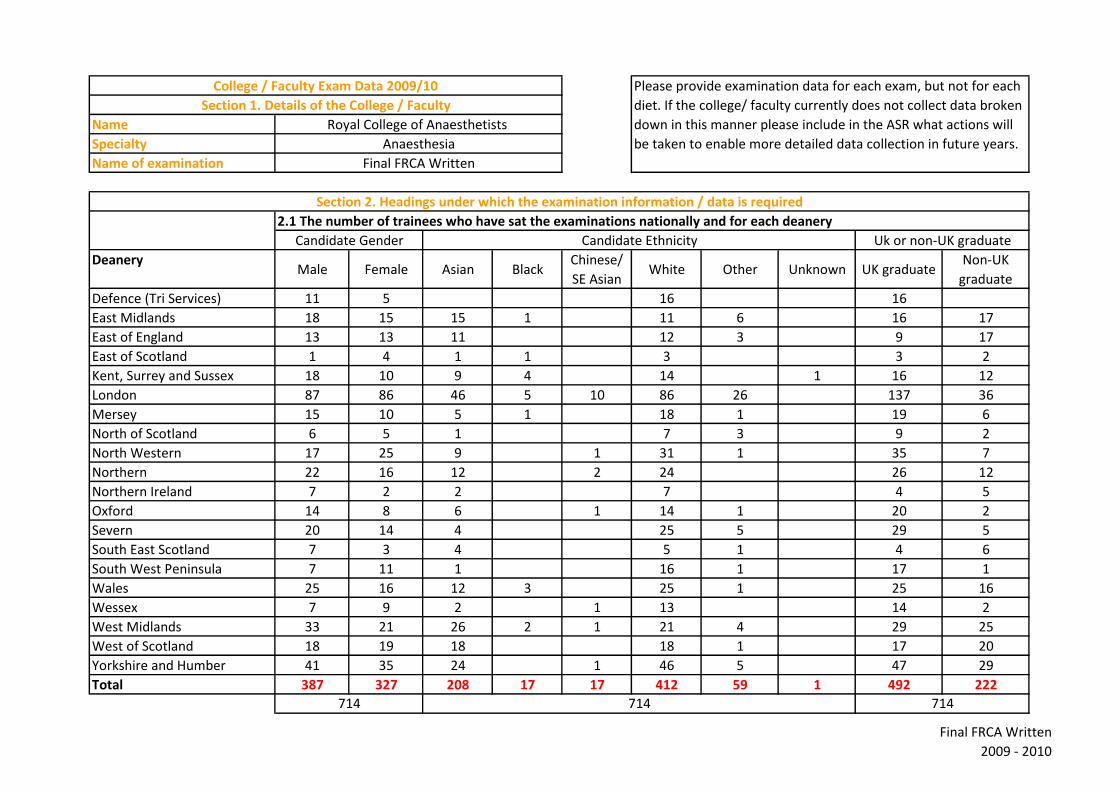
Total 387 327 208 17 17 412 59 1 492 222
Candidate Gender Candidate Ethnicity Uk or non-UK graduate
714714714
Section 2. Headings under which the examination information / data is required
2.1 The number of trainees who have sat the examinations nationally and for each deanery
College / Faculty Exam Data 2009/10 Please provide examination data for each exam, but not for each
diet. If the college/ faculty currently does not collect data broken
down in this manner please include in the ASR what actions will
be taken to enable more detailed data collection in future years.
Section 1. Details of the College / Faculty
Royal College of Anaesthetists
Anaesthesia
Final FRCA Written
Final FRCA Written
2009 - 2010
DeaneryMale Female Asian Black
Chinese/
SE AsianWhite Other Unknown UK graduate
Non-UK
graduate
Defence (Tri Services) 9 5 14 14 0
East Midlands 14 9 13 8 2 12 11
East of England 9 13 10 10 2 8 14
East of Scotland 1 3 1 1 2 2 2
Kent, Surrey and Sussex 13 7 7 1 12 11 9
London 57 73 35 5 10 65 15 104 26
Mersey 13 10 5 1 16 1 17 6
North of Scotland 5 3 1 6 1 7 1
North Western 16 19 7 1 26 1 31 4
Northern 19 13 10 2 20 22 10
Northern Ireland 4 1 1 4 2 3
Oxford 12 4 5 11 14 2
Severn 10 9 1 16 2 19 0
South East Scotland 5 2 3 3 1 2 5
South West Peninsula 7 11 1 16 1 17 1
Wales 14 14 9 19 20 8
Wessex 7 11 2 15 1 15 3
West Midlands 23 16 17 1 18 3 22 17
West of Scotland 9 11 7 13 12 8
Yorkshire and Humber 34 33 19 1 43 4 46 21
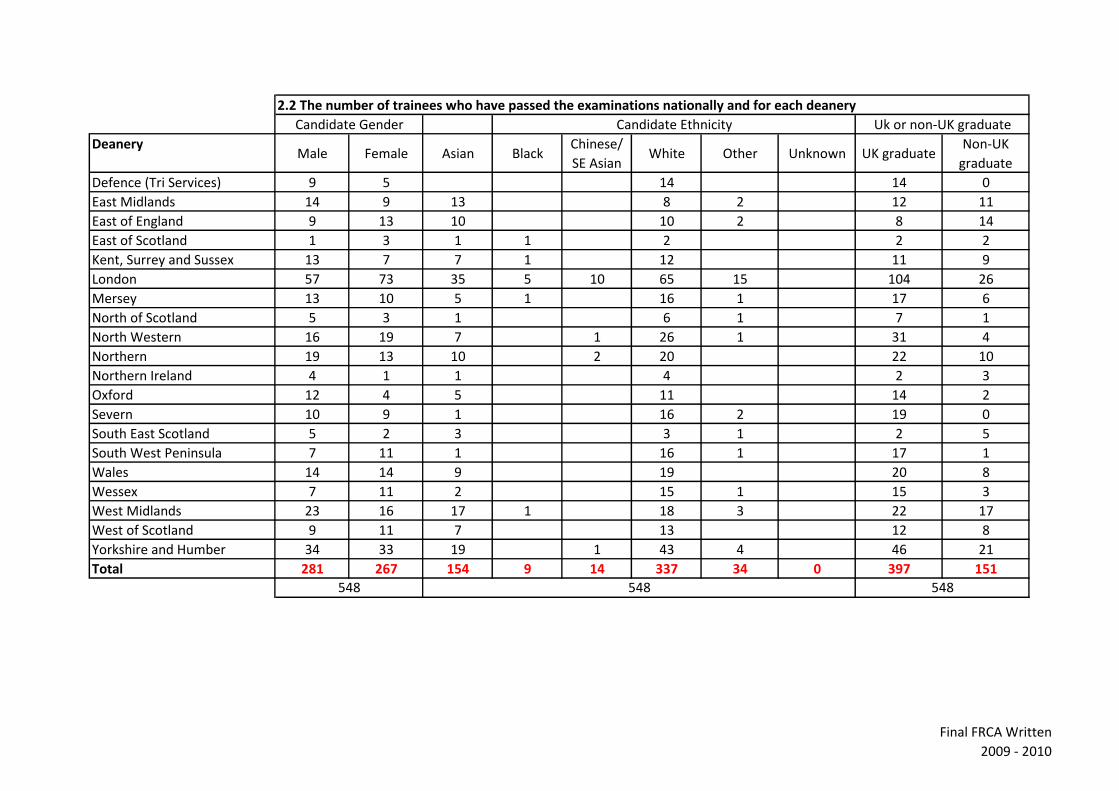
Total 281 267 154 9 14 337 34 0 397 151
2.2 The number of trainees who have passed the examinations nationally and for each deanery
Candidate Gender Candidate Ethnicity Uk or non-UK graduate
548 548 548
Final FRCA Written
2009 - 2010
Deanery Pass Fail Pass Fail Pass Fail Pass Fail
Defence (Tri Services) 14 2
East Midlands 22 8 1 2
East of England 1 16 4 5
East of Scotland 4 1
Kent, Surrey and Sussex 1 16 6 4 1
London 1 124 39 4 4 1
Mersey 22 2 1
North of Scotland 7 2 1
North Western 35 6 1
Northern 30 6 2
Northern Ireland 5 4
Oxford 14 6 1 1
Severn 19 3 2
South East Scotland 7 3
South West Peninsula 18
Wales 1 19 8 8 4 1
Wessex 19 7 1
West Midlands 37 13 2 2
West of Scotland 20 13 2 2
Yorkshire and Humber 1 65 7 1 2
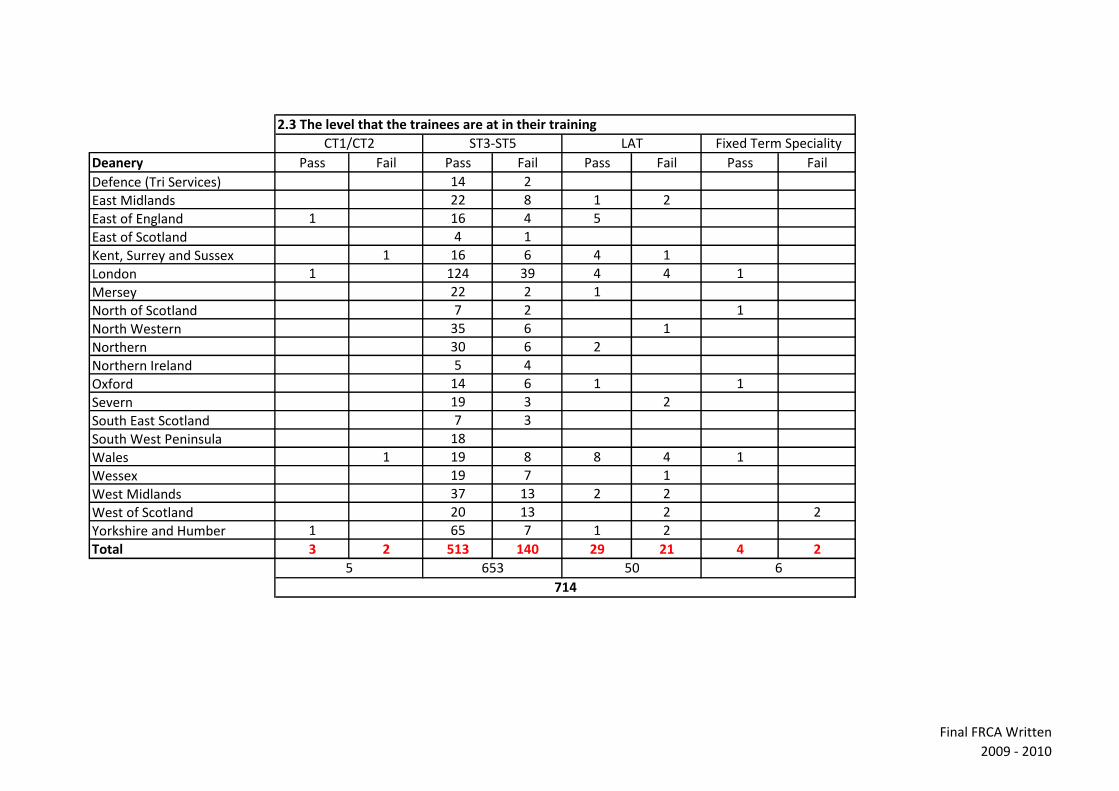
Total 3 2 513 140 29 21 4 2
2.3 The level that the trainees are at in their training
CT1/CT2 ST3-ST5 LAT Fixed Term Speciality
714
5 653 50 6
Final FRCA Written
2009 - 2010
DeaneryMale Female Asian Black
Chinese
/SE AsianWhite Other
UK
graduate
Non-UK
graduate
Defence (Tri Services) 1 1 1
East Midlands 5 5 1 4
East of England 2 1 3 3
East of Scotland
Kent, Surrey and Sussex 1 1 1
London 7 3 7 1 2 3 7
Mersey
North of Scotland 1 1 1
North Western 2 1 1 1 1
Northern 2 2 2
Northern Ireland
Oxford
Severn
South East Scotland
South West Peninsula
Wales 3 1 2 1 1 1 3
Wessex
West Midlands 3 3 5 1 6
West of Scotland 2 1 3 3
Yorkshire and Humber 2 1 3 3
Total 30 11 31 3 1 3 3 8 33
Candidate Gender Uk or non-UK graduate
41 4141
Candidate Ethnicity
2.4 The number of trainees taking examinations who failed (the same) examination more than three times
Final FRCA Written
2009 - 2010

Name
Address
Job title
Telephone number
Mobile number
Signature:
Date:
Position held:
06-Dec-10
Director of Training and Examinations
020 7092 1558
07545 586613
Section 4. Declaration
I confirm that the information given on this annual college/faculty reporting form is correct.
Director of Training and Examinations
Section 3. Contact details
Contact details for the person responsible for submitting this form to the GMC
Richard Bryant
The Royal College of Anaesthetists
Final FRCA Written
2009 - 2010
Name
Specialty
Name of examination
Deanery Male Female Asian BlackChinese/ SE
AsianWhite Other Unknown UK graduate
NonUK
graduate
Defence (Tri Services) 8 4 11 1 12
East Midlands 23 19 9 2 27 4 33 9
East of England 18 8 4 3 13 6 21 5
East of Scotland 6 6 6
Kent, Surrey and Sussex 35 40 15 4 1 40 15 55 20
London 68 100 33 2 10 100 23 149 19
Mersey 31 24 5 45 4 1 54 1
North of Scotland 1 7 1 7 7 1
North Western 27 27 5 1 42 5 1 51 3
Northern 16 13 5 22 2 20 9
Northern Ireland 10 19 2 27 26 3
Oxford 13 12 3 21 1 25
Severn 12 13 3 1 2 18 1 22 3
South East Scotland 12 7 1 18 18 1
South West Peninsula 22 18 2 1 34 3 35 5
Wales 29 24 11 1 2 34 5 32 21
Wessex 11 18 1 1 26 1 29
West Midlands 37 29 19 1 2 39 5 52 14
West of Scotland 11 23 1 2 29 2 32 2
Yorkshire and Humber 26 16 12 2 23 5 30 12
Total 410 427 132 11 27 582 83 2 709 128
Please provide examination data for each exam, but not for each
diet. If the college/ faculty currently does not collect data broken
down in this manner please include in the ASR what actions will
be taken to enable more detailed data collection in future years.
Section 2. Headings under which the examination information / data is required
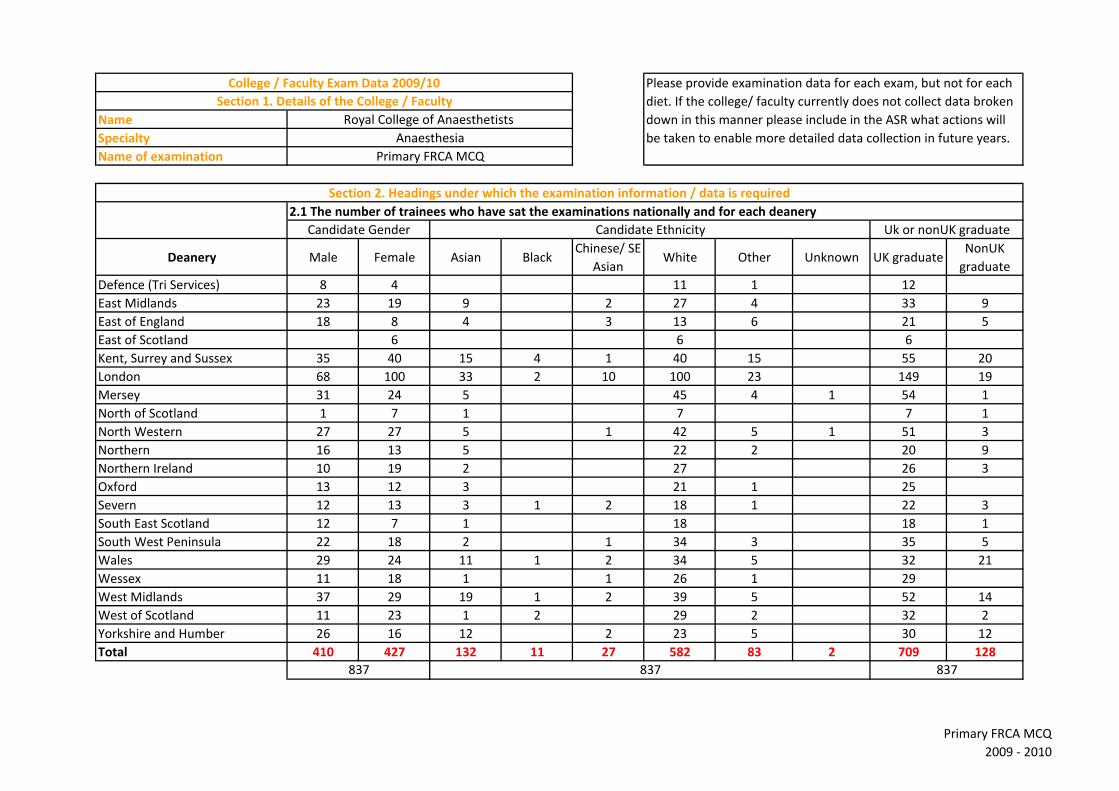
2.1 The number of trainees who have sat the examinations nationally and for each deanery
Candidate Gender Candidate Ethnicity Uk or nonUK graduate
College / Faculty Exam Data 2009/10
Section 1. Details of the College / Faculty
Royal College of Anaesthetists
Anaesthesia
Primary FRCA MCQ
837 837 837
Primary FRCA MCQ
2009 - 2010
Deanery Male Female Asian BlackChinese/ SE
AsianWhite Other Unknown UK graduate
NonUK
graduate
Defence (Tri Services) 7 3 9 1 10
East Midlands 13 10 4 1 15 3 19 4
East of England 11 6 4 3 6 4 13 4
East of Scotland 4 4 4
Kent, Surrey and Sussex 21 26 10 3 1 25 8 38 9
London 54 58 21 1 5 67 18 101 11
Mersey 27 20 5 37 4 1 46 1
North of Scotland 1 4 1 4 4 1
North Western 20 13 2 30 1 31 2
Northern 9 4 2 10 1 10 3
Northern Ireland 4 5 9 8 1
Oxford 10 9 2 17 19
Severn 9 12 1 1 1 17 1 20 1
South East Scotland 10 5 15 14 1
South West Peninsula 19 10 1 26 2 25 4
Wales 16 15 6 2 22 1 23 8
Wessex 10 14 1 22 1 24
West Midlands 20 21 8 2 27 4 36 5
West of Scotland 8 17 2 21 2 24 1
Yorkshire and Humber 18 10 7 2 16 3 21 7
Total 287 266 74 7 18 399 54 1 490 63
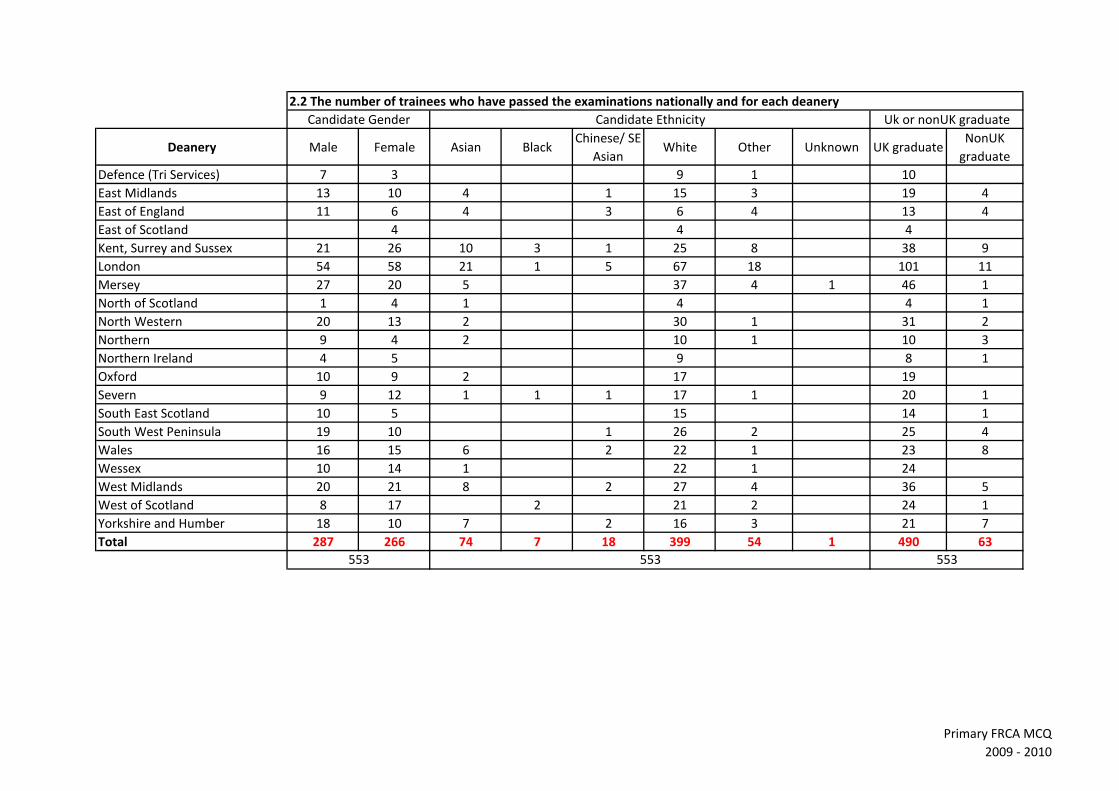
2.2 The number of trainees who have passed the examinations nationally and for each deanery
Candidate Gender Candidate Ethnicity Uk or nonUK graduate
553 553 553
Primary FRCA MCQ
2009 - 2010
Deanery Pass Fail Pass Fail Pass Fail Pass Fail
Defence (Tri Services) 10 2 1
East Midlands 20 16 3 2 1
East of England 17 9
East of Scotland 3 1 1 1
Kent, Surrey and Sussex 38 25 7 1 2
London 94 50 14 6 2 2 2
Mersey 44 8 2
North of Scotland 1 3 3 1
North Western 23 20 9 1 1
Northern 11 11 1 5 1 1
Northern Ireland 8 16 1 3
Oxford 17 6 2
Severn 19 4 2
South East Scotland 6 3 8 1 1
South West Peninsula 23 11 6
Wales 29 18 2 1 3
Wessex 24 5
West Midlands 39 22 2 3
West of Scotland 11 6 13 2 1 1
Yorkshire and Humber 26 13 1 1 1
Total 463 249 78 26 8 8 4 1
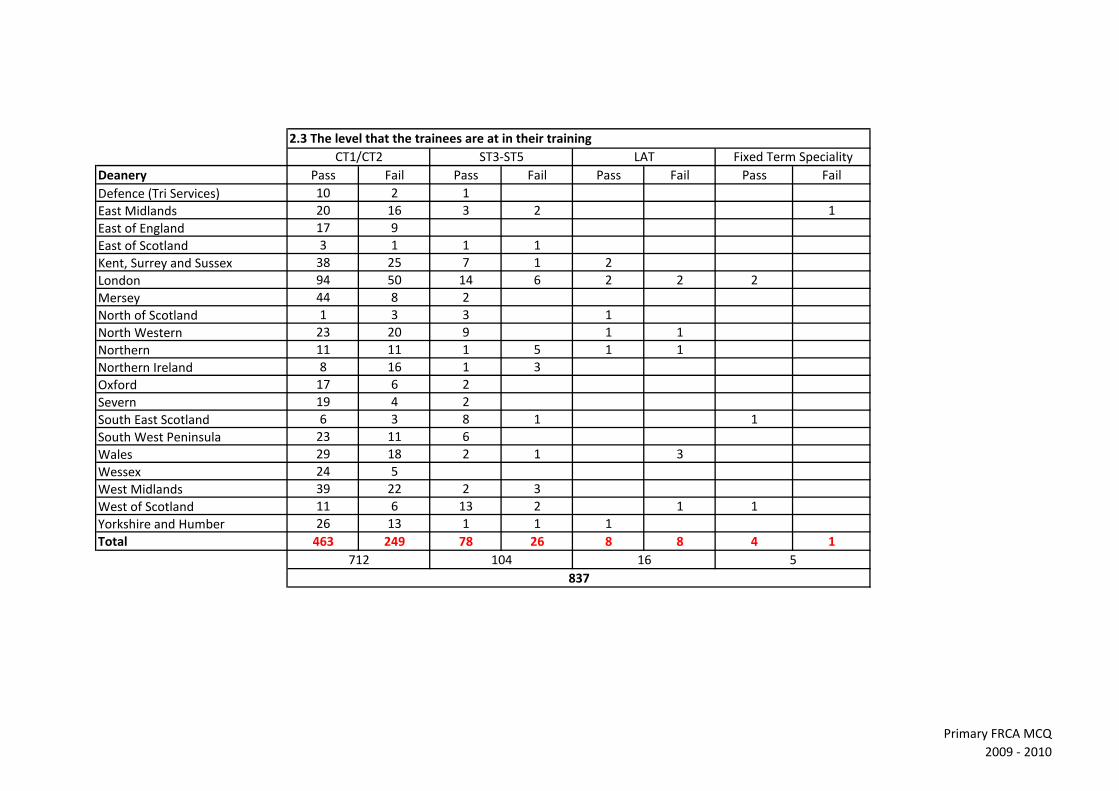
CT1/CT2 ST3-ST5 LAT Fixed Term Speciality
104712
837
2.3 The level that the trainees are at in their training
516
Primary FRCA MCQ
2009 - 2010

Deanery Male Female Asian Black Chinese /SE White Other Unknown UK graduate NonUK
Defence (Tri Services)
East Midlands 1 2 2 1 2 1
East of England 1 1 1
East of Scotland
Kent, Surrey and Sussex 4 1 1 2 3 1
London 3 2 1 2 2 5
Mersey 1 2 2 1 3
North of Scotland
North Western 1 3 4 4
Northern 1 1 1
Northern Ireland
Oxford
Severn
South East Scotland
South West Peninsula 2 2 2
Wales 1 1 1 1 1 1
Wessex 3 2 1
West Midlands 1 2
West of Scotland 1 1 1
Yorkshire and Humber 1 3 1 2 1 3 1
Total 13 20 5 0 1 20 7 0 28 5
2.4 The number of trainees taking examinations who failed (the same) examination more than three times
Candidate Gender Candidate Ethnicity Uk or nonUK graduate
333333
Primary FRCA MCQ
2009 - 2010
Name
Address
Job title
Telephone number
Mobile number
Signature:
Date:
Position held:
06-Dec-10
Director of Training and Examinations
Director of Training and Examinations
020 7092 1558
07545 586613
Section 4. Declaration
I confirm that the information given on this annual college/faculty reporting form is correct.
The Royal College of Anaesthetists
Section 3. Contact details
Contact details for the person responsible for submitting this form to the GMC
Richard Bryant
Primary FRCA MCQ
2009 - 2010
Name
Specialty
Name of examination
DeaneryMale Female Asian Black
Chinese/
SE AsianWhite Other UK graduate
NonUK
graduate
Defence (Tri Services) 5 3 6 8
East Midlands 20 14 8 3 22 3 28 6
East of England 9 15 7 1 15 17 7
East of Scotland 3 3 3
Kent, Surrey and Sussex 21 16 11 3 1 17 1 27 10
London 53 45 14 2 3 81 86 12
Mersey 18 18 6 1 24 5 34 2
North of Scotland 3 5 1 6 1 7 1
North Western 18 17 3 1 3 27 1 32 3
Northern 9 8 1 16 15 2
Northern Ireland 6 7 13 3 12 1
Oxford 8 9 1 13 16 1
Severn 7 13 3 1 15 1 19 1
South East Scotland 10 6 16 15 1
South West Peninsula 20 10 3 1 1 24 1 24 6
Wales 17 16 9 2 22 20 13
Wessex 14 15 2 27 1 29
West Midlands 25 25 20 1 1 25 4 36 14
West of Scotland 11 16 1 2 23 1 25 2
Yorkshire and Humber 25 17 12 3 24 4 35 7
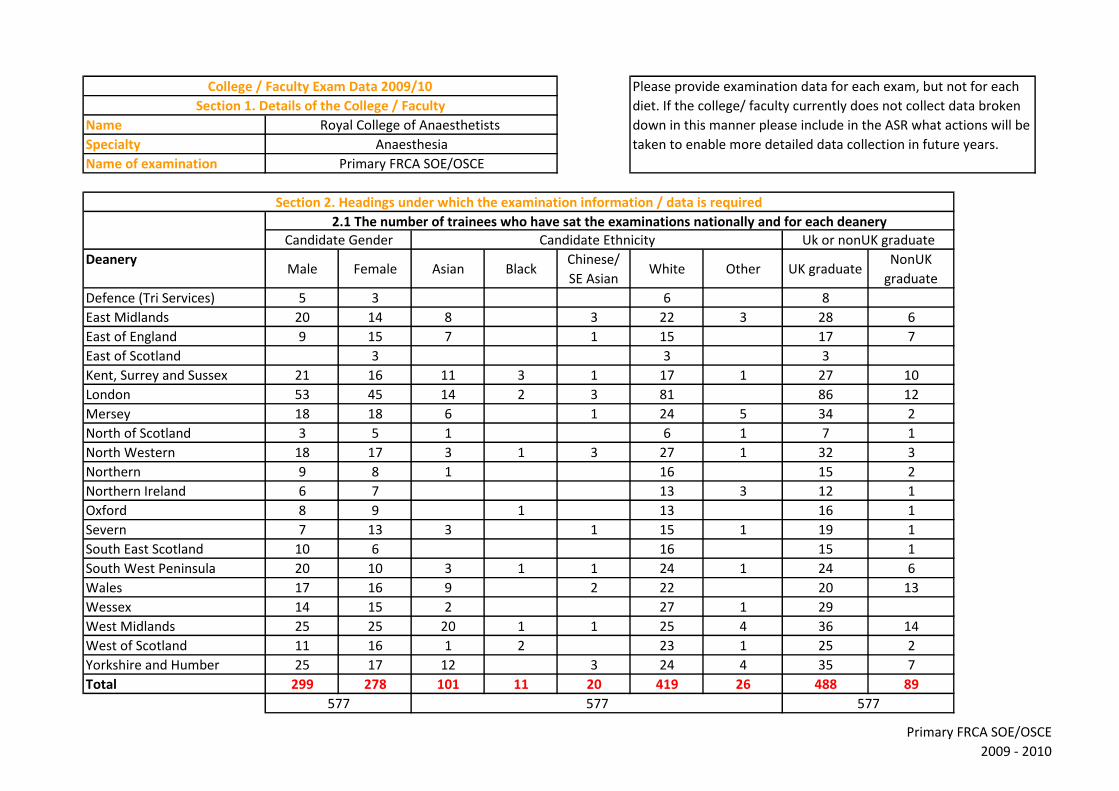
Total 299 278 101 11 20 419 26 488 89
College / Faculty Exam Data 2009/10 Please provide examination data for each exam, but not for each
diet. If the college/ faculty currently does not collect data broken
down in this manner please include in the ASR what actions will be
taken to enable more detailed data collection in future years.
Section 1. Details of the College / Faculty
Royal College of Anaesthetists
Anaesthesia
Primary FRCA SOE/OSCE
Section 2. Headings under which the examination information / data is required
577
Candidate Gender Uk or nonUK graduate
577 577
Candidate Ethnicity
2.1 The number of trainees who have sat the examinations nationally and for each deanery
Primary FRCA SOE/OSCE
2009 - 2010

DeaneryMale Female Asian Black
Chinese/
SE AsianWhite Other UK graduate
NonUK
graduate
Defence (Tri Services) 5 2 6 7
East Midlands 11 11 4 2 16 1 20 2
East of England 7 9 2 13 14 2
East of Scotland 2 2 2
Kent, Surrey and Sussex 15 9 7 1 1 13 1 18 6
London 34 35 8 1 2 51 8 63 6
Mersey 15 12 4 1 19 3 25 2
North of Scotland 2 3 1 3 1 4 1
North Western 13 13 1 1 3 20 1 24 2
Northern 6 7 13 12 1
Northern Ireland 2 6 8 8
Oxford 7 8 1 11 3 14 1
Severn 6 11 2 13 1 17
South East Scotland 9 3 1 12 12
South West Peninsula 15 8 1 1 21 20 3
Wales 8 9 3 14 12 5
Wessex 12 13 1 24 25
West Midlands 19 18 14 1 1 19 3 27 10
West of Scotland 6 13 18 1 19
Yorkshire and Humber 16 9 3 20 2 25
Total 208 201 51 6 11 316 25 368 41
2.2 The number of trainees who have passed the examinations nationally and for each deaneryCandidate Ethnicity
409 409409
Candidate Gender Uk or nonUK graduate
Primary FRCA SOE/OSCE
2009 - 2010
Deanery Pass Fail Pass Fail Pass Fail Pass Fail
Defence (Tri Services) 4 2
East Midlands 15 11 8 1 1
East of England 13 5 2 1 1 1
East of Scotland 2 1
Kent, Surrey and Sussex 17 7 5 3 1
London 39 18 30 10 1 1 1
Mersey 23 7 4 1 1
North of Scotland 1 1 4 2
North Western 18 3 8 5 1
Northern 12 2 1 2
Northern Ireland 7 4 1 1
Oxford 6 1 9 1
Severn 12 2 5 1
South East Scotland 3 1 8 3 1
South West Peninsula 17 5 6 2
Wales 15 12 2 2 1 1
Wessex 17 3 8 2
West Midlands 32 10 6 3
West of Scotland 2 3 16 4 1 1
Yorkshire and Humber 15 14 10 3 1
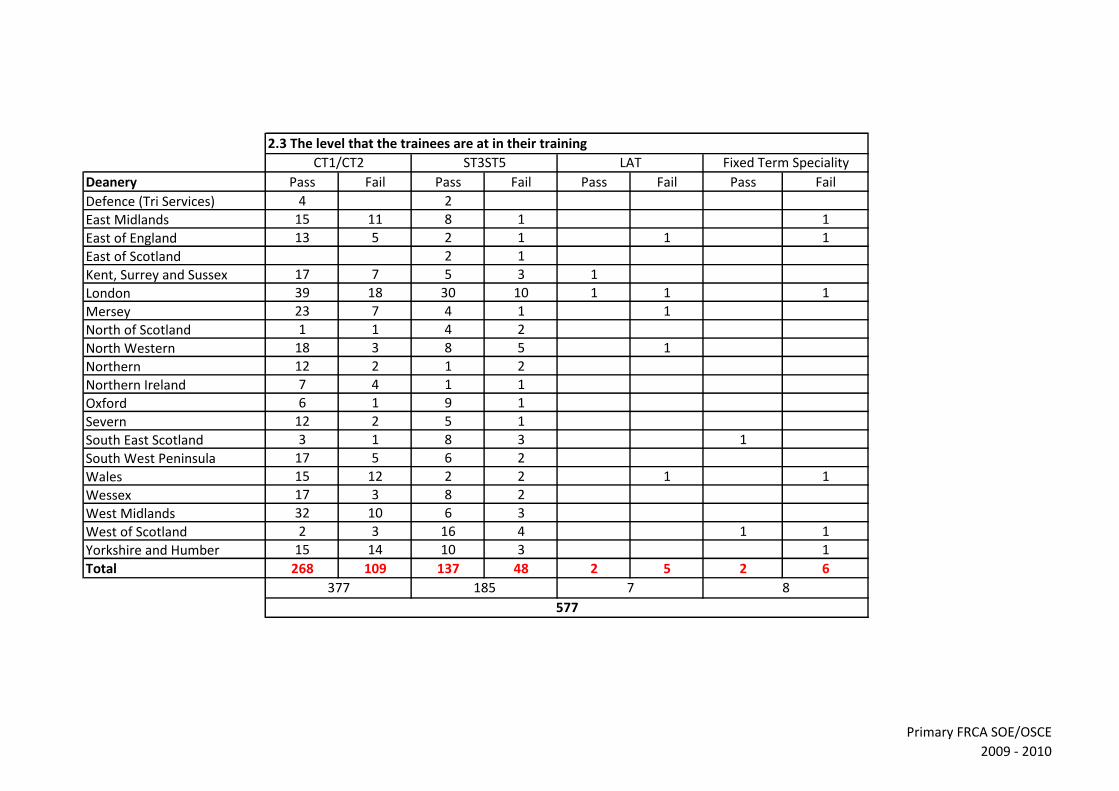
Total 268 109 137 48 2 5 2 6
2.3 The level that the trainees are at in their training
577
CT1/CT2 ST3ST5 LAT Fixed Term Speciality
377 185 7 8
Primary FRCA SOE/OSCE
2009 - 2010

DeaneryMale Female Asian Black
Chinese
/SE AsianWhite Other Unknown UK graduate
Non-UK
graduate
Defence (Tri Services)
East Midlands 1
East of England 1 1
East of Scotland
Kent, Surrey and Sussex 1 1 1
London 1 1 1 1 2
Mersey
North of Scotland
North Western 1 1 1
Northern
Northern Ireland
Oxford
Severn
South East Scotland 1 1 1
South West Peninsula 1 1 1
Wales 1 1 1 1 2
Wessex 1 1 1
West Midlands 1 1 2 2
West of Scotland 1 1 1
Yorkshire and Humber 4 1 4 1 3 2
Total 12 6 9 0 1 6 2 0 11 7
2.4 The number of trainees taking examinations who failed (the same) examination more than three times
Candidate Gender Candidate Ethnicity Uk or non-UK graduate
1818 18
Primary FRCA SOE/OSCE
2009 - 2010
Name
Address
Job title
Telephone number
Mobile number
Signature:
Date:
Position held:
06-Dec-10
Director of Training and Examinations
Director of Training and Examinations
020 7092 1558
07545 586613
Section 4. Declaration
I confirm that the information given on this annual college/faculty reporting form is correct.
Section 3. Contact details
The Royal College of Anaesthetists
Contact details for the person responsible for submitting this form to the GMC
Richard Bryant
Primary FRCA SOE/OSCE
2009 - 2010

1
FRCA Examinations
Annual
Statistical Report
2009/10

2
Table of Contents 1. SUMMARY OF DATA ............................................................................................................ 3
2. PRIMARY MCQ ..................................................................................................................... 4
2.1 Component Breakdown ............................................................................................... 5
2.2 Gender ........................................................................................................................10
2.3 Area of Qualification ....................................................................................................11
2.4 Candidate Primary History ..........................................................................................12
2.5 Regional Centre Performance Variation ......................................................................14
2.6 Reliability ....................................................................................................................15
2.7 Historical Data ............................................................................................................16
3. PRIMARY OSCE/SOE ..........................................................................................................19
3.1 Pass Rate ...................................................................................................................20
3.2 SOE Component Breakdown ......................................................................................22
3.3 Gender ........................................................................................................................26
3.4 Area of Qualification ....................................................................................................27
3.5 Candidate History .......................................................................................................28
3.6 Reliability ....................................................................................................................29
3.7 Historical Data ............................................................................................................30
4. FINAL WRITTEN ..................................................................................................................33
4.1 Component Breakdown ..............................................................................................34
4.2 Gender ........................................................................................................................38
4.3 Area of Qualification ....................................................................................................39
4.4 Candidate History .......................................................................................................40
4.5 Historical Data ............................................................................................................42
5. FINAL SOE ...........................................................................................................................44
5.1 Component Breakdown ..............................................................................................45
5.2 Gender ........................................................................................................................49
5.3 Area of Qualification ....................................................................................................50
5.4 Candidate Final History ...............................................................................................51
5.5 Historical Data ............................................................................................................53

3
1. SUMMARY OF DATA
SEPTEMBER 09 FEBRUARY 10 JUNE 10 TOTAL
Primary MCQ Attendees 314 259 488 1061
Passed 574 54.10%
Failed 487 45.90% OCTOBER 09 JANUARY 10 MAY 10 TOTAL
Primary OSCE/SOE Attendees 261 314 302 877
Passed 421 48.0%
Failed 456 52.0% SEPTEMBER 09 MARCH 10 / TOTAL
Final Written Exam Attendees 460 511 / 971
Passed 620 63.9%
Failed 351 36.1% DECEMBER 2009 / JUNE 2010 TOTAL
Final SOE Attendees 289 / 379 668
Passed 439 65.7%
Failed 229 34.3%
TOTAL Attendees 3577
PASS54%
FAIL46%
Primary MCQ
PASS48%FAIL
52%
Primary OSCE/SOE
PASS64%
FAIL36%
Final Written
PASS66%
FAIL34%
Final SOE

4
2. PRIMARY MCQ
SEPTEMBER 09 FEBRUARY 10 JUNE 10
Attendees 1061 314 259 488
Passed 574 54.10%
Failed 487 45.90%
PASS54%
FAIL46%
Primary MCQ
5
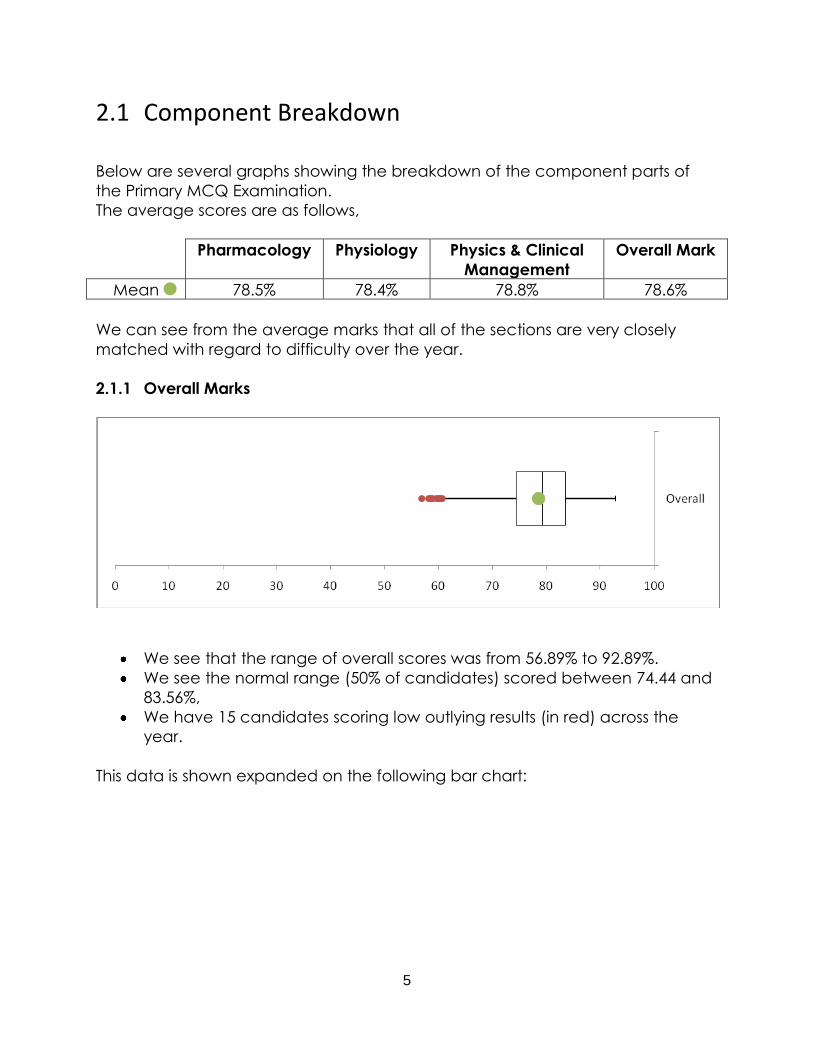
2.1 Component Breakdown Below are several graphs showing the breakdown of the component parts of
the Primary MCQ Examination.
The average scores are as follows,
Pharmacology Physiology Physics & Clinical
Management
Overall Mark
Mean 78.5% 78.4% 78.8% 78.6%
We can see from the average marks that all of the sections are very closely
matched with regard to difficulty over the year.
2.1.1 Overall Marks
We see that the range of overall scores was from 56.89% to 92.89%.
We see the normal range (50% of candidates) scored between 74.44 and
83.56%,
We have 15 candidates scoring low outlying results (in red) across the
year.
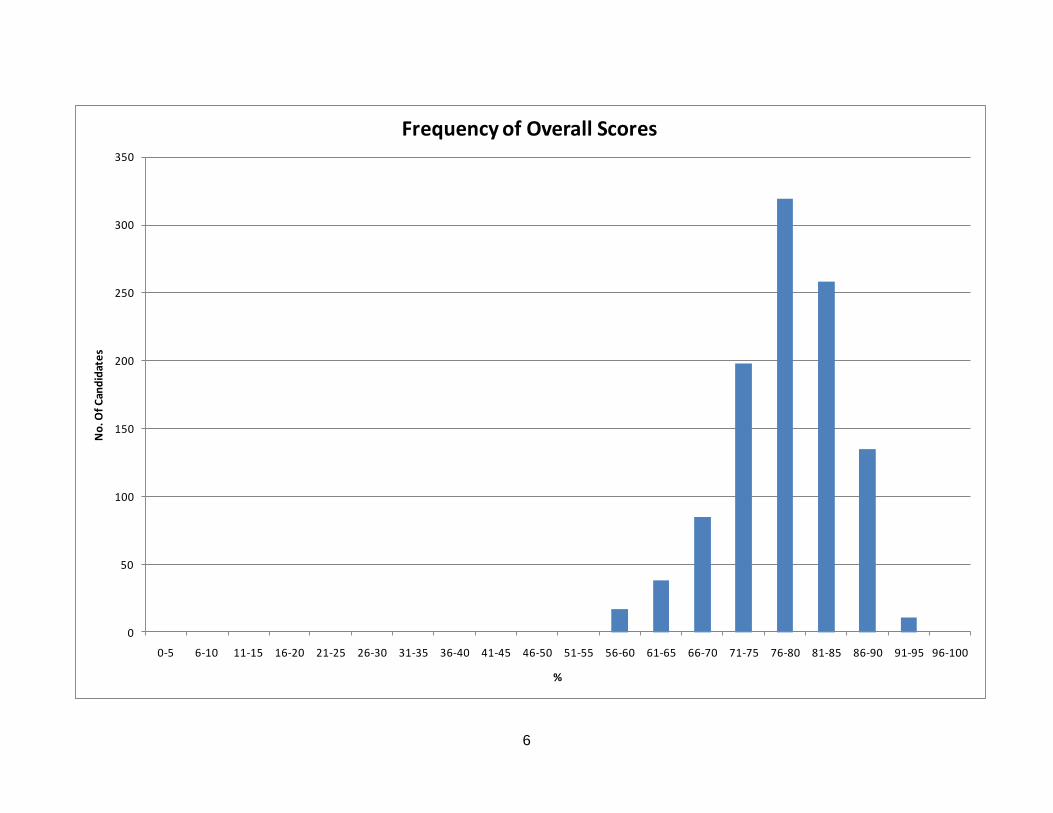
This data is shown expanded on the following bar chart:
6
0
50
100
150
200
250
300
350
0-5 6-10 11-15 16-20 21-25 26-30 31-35 36-40 41-45 46-50 51-55 56-60 61-65 66-70 71-75 76-80 81-85 86-90 91-95 96-100
No
. Of
Can
did
ate
s
%
Frequency of Overall Scores
7
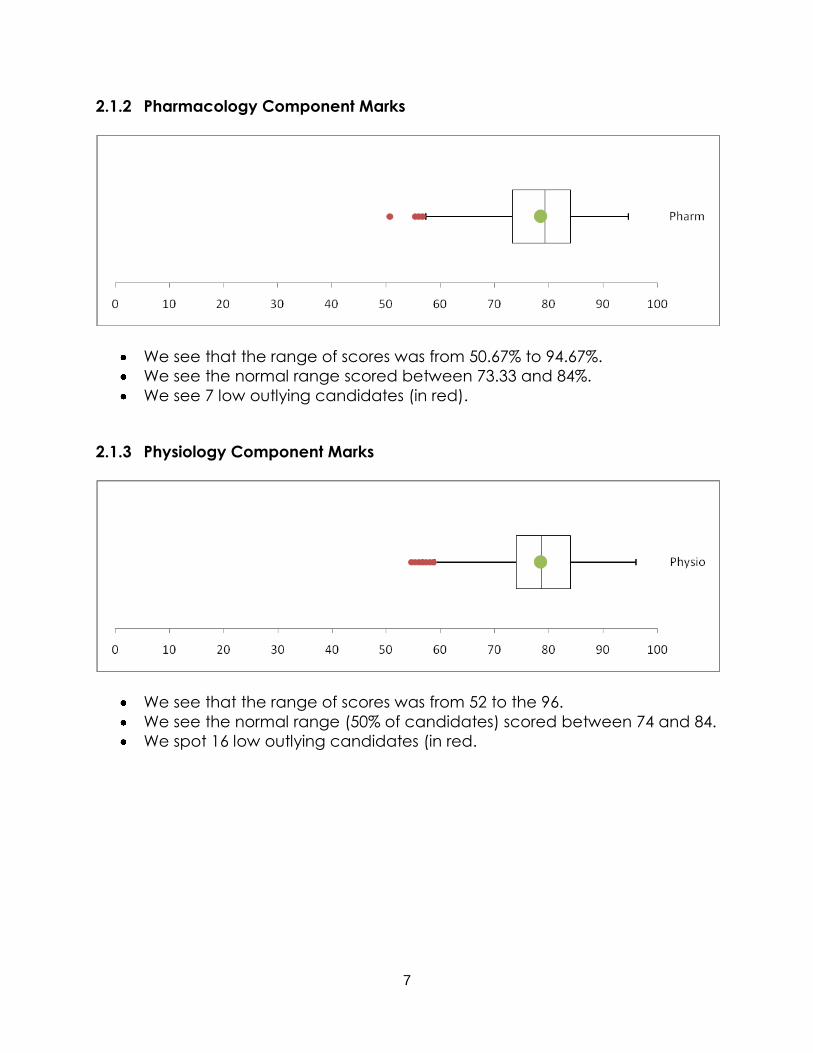
2.1.2 Pharmacology Component Marks
We see that the range of scores was from 50.67% to 94.67%.
We see the normal range scored between 73.33 and 84%.
We see 7 low outlying candidates (in red).
2.1.3 Physiology Component Marks
We see that the range of scores was from 52 to the 96.
We see the normal range (50% of candidates) scored between 74 and 84.
We spot 16 low outlying candidates (in red.
8
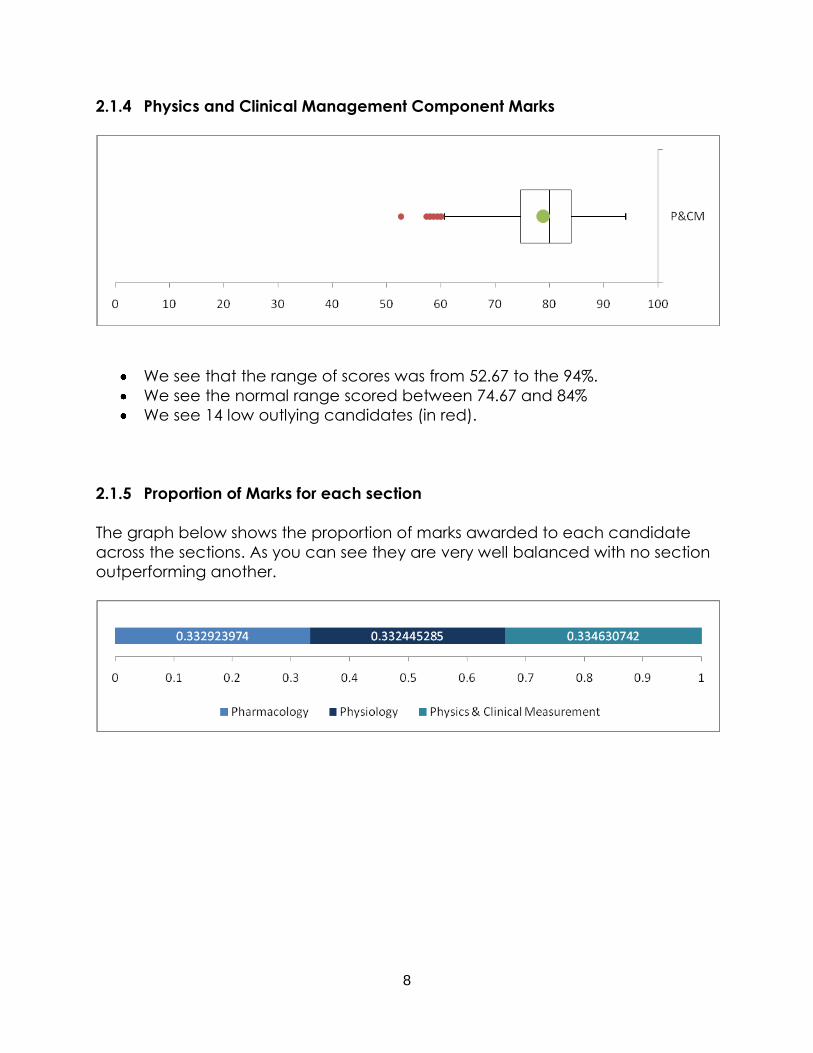
2.1.4 Physics and Clinical Management Component Marks
We see that the range of scores was from 52.67 to the 94%.
We see the normal range scored between 74.67 and 84%
We see 14 low outlying candidates (in red).
2.1.5 Proportion of Marks for each section
The graph below shows the proportion of marks awarded to each candidate
across the sections. As you can see they are very well balanced with no section
outperforming another.

9
2.1.6 Correlation Between Component Marks and Final Score
Performance in each section is a good indicator of overall performance with no component section
performing significantly badly/well in comparison with the final mark for a candidate.
This is confirmed in the correlation coefficients calculated for each section:
Pharmacology: 0.808 Physiology: 0.806 P&CM: 0.837
We see a slightly higher indication of success in a candidates performance in the Physics and Clinical
measurement section, however this difference is not large.
10
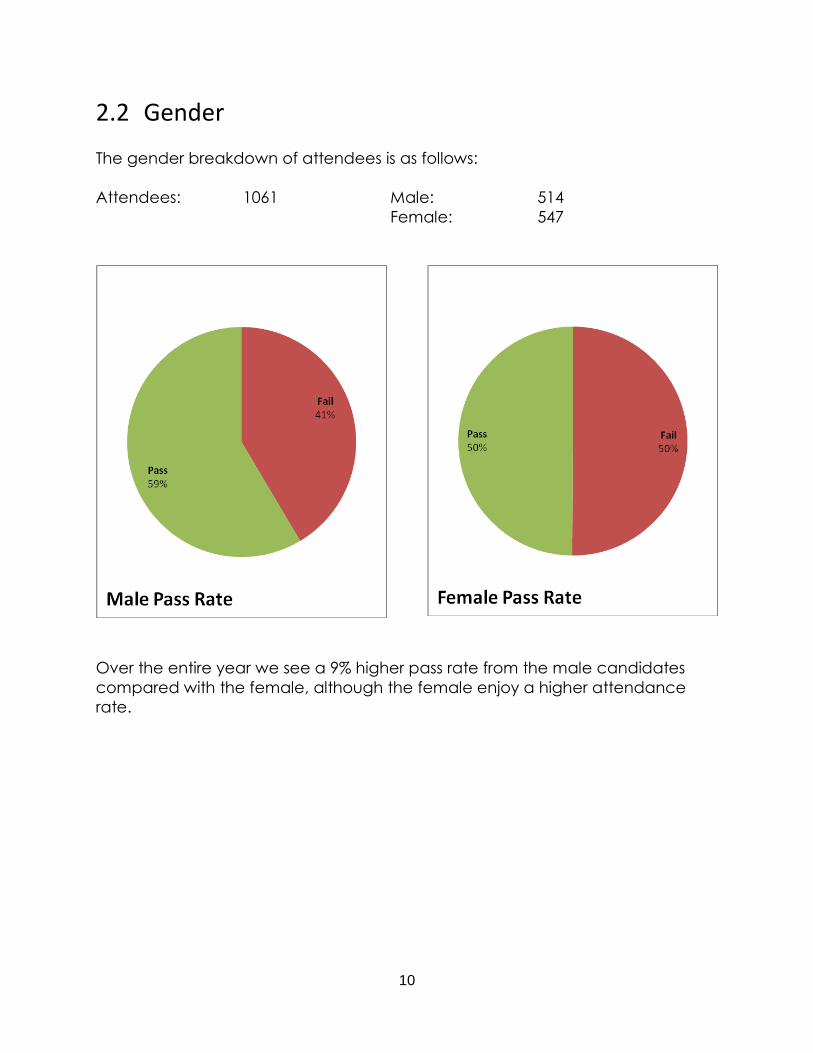
2.2 Gender
The gender breakdown of attendees is as follows:
Attendees: 1061 Male: 514
Female: 547
Over the entire year we see a 9% higher pass rate from the male candidates
compared with the female, although the female enjoy a higher attendance
rate.
11
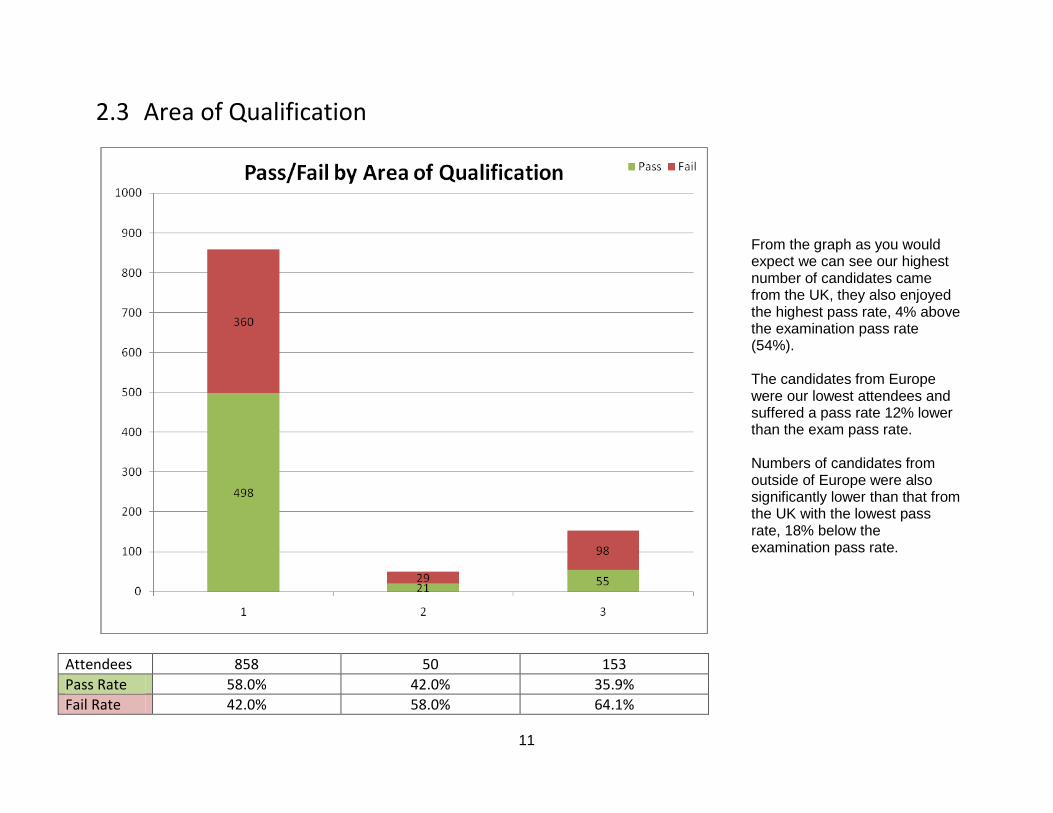
2.3 Area of Qualification
Attendees 858 50 153
Pass Rate 58.0% 42.0% 35.9%
Fail Rate 42.0% 58.0% 64.1%
From the graph as you would expect we can see our highest number of candidates came from the UK, they also enjoyed the highest pass rate, 4% above the examination pass rate (54%). The candidates from Europe were our lowest attendees and suffered a pass rate 12% lower than the exam pass rate. Numbers of candidates from outside of Europe were also significantly lower than that from the UK with the lowest pass rate, 18% below the examination pass rate.
12
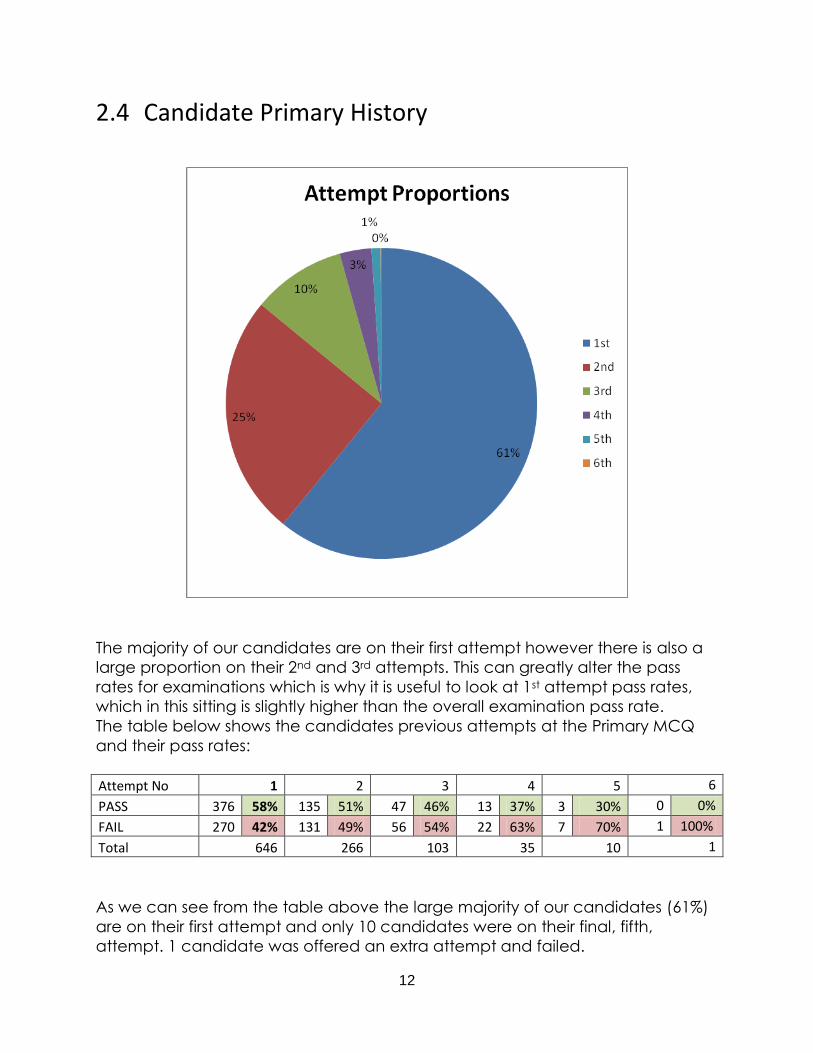
2.4 Candidate Primary History
The majority of our candidates are on their first attempt however there is also a
large proportion on their 2nd and 3rd attempts. This can greatly alter the pass
rates for examinations which is why it is useful to look at 1st attempt pass rates,
which in this sitting is slightly higher than the overall examination pass rate.
The table below shows the candidates previous attempts at the Primary MCQ
and their pass rates:
Attempt No 1 2 3 4 5 6
PASS 376 58% 135 51% 47 46% 13 37% 3 30% 0 0%
FAIL 270 42% 131 49% 56 54% 22 63% 7 70% 1 100%
Total 646 266 103 35 10 1
As we can see from the table above the large majority of our candidates (61%)
are on their first attempt and only 10 candidates were on their final, fifth,
attempt. 1 candidate was offered an extra attempt and failed.

13
The graph below shows the correlation between the pass rate and the attempt
number:
The data shows that there is a negative correlation between the number of
attempts and a candidate’s chance of success.

14
2.5 Regional Centre Performance Variation
Regional Centre Fail Pass Total Belfast 29 11 40
Birmingham 81 85 166
Cardiff 41 66 107
Edinburgh 46 62 108
London 198 256 454
London (RCOA) 32 15 47
Sheffield 60 79 139
There was very little variation in the pass rates across the country, with the
exception of Belfast and the smaller London group at the RCOA who suffered
lower pass rates.
15
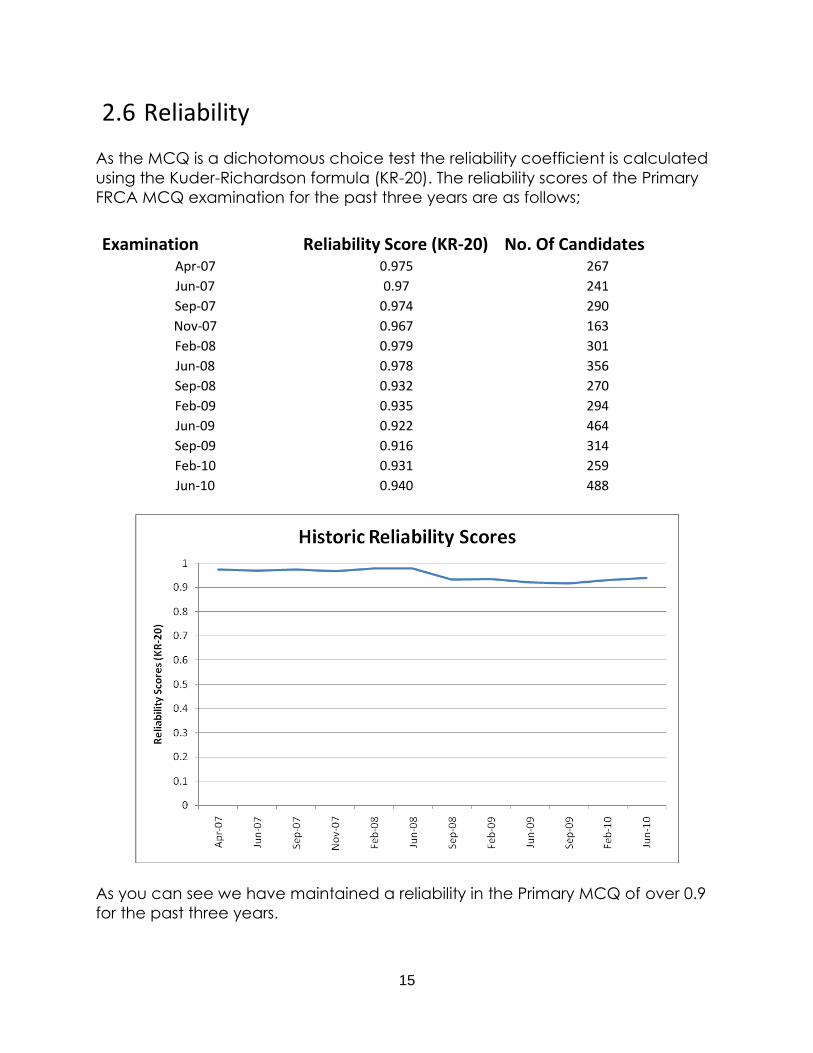
2.6 Reliability
As the MCQ is a dichotomous choice test the reliability coefficient is calculated
using the Kuder-Richardson formula (KR-20). The reliability scores of the Primary
FRCA MCQ examination for the past three years are as follows;
Examination Reliability Score (KR-20) No. Of Candidates Apr-07 0.975 267
Jun-07 0.97 241
Sep-07 0.974 290
Nov-07 0.967 163
Feb-08 0.979 301
Jun-08 0.978 356
Sep-08 0.932 270
Feb-09 0.935 294
Jun-09 0.922 464
Sep-09 0.916 314
Feb-10 0.931 259
Jun-10 0.940 488
As you can see we have maintained a reliability in the Primary MCQ of over 0.9
for the past three years.

16
2.7 Historical Data
Summary of Results for Primary FRCA [October 1996 to May 2007]
Sitting No cand sat
MCQ No cand
eliminated % Eliminated No cand passed
% passed SOEs
% passed overall
Oct-96 141 0 0 53 39 38
Apr-97 215 0 0 96 46 45
Jul-97 215 0 0 104 50 48
Oct-97 225 0 0 95 46 42
Apr-98 364 47 13 151 48 42
Oct-98 345 69 20 131 48 38
Apr-99 306 66 22 132 56 43
Jul-99 278 60 22 127 58 43
Oct-99 199 43 22 93 60 47
Feb-00 245 45 18 98 49 40
Jun-00 326 64 20 139 54 43
Oct-00 232 49 21 97 53 42
Feb-01 283 65 23 119 55 42
Jun-01 341 74 22 139 52 41
Oct-01 253 47 19 124 60 49
Jan-02 308 70 23 126 53 41
May-02 337 69 20 137 52 41
Oct-02 236 47 20 189 61 48
Jan-03 340 66 19 151 56 44
May-03 325 70 22 150 60 46
Oct-03 286 60 21 136 60 47
Jan-04 339 71 21 163 62 48
May-04 360 75 21 161 58 45
Oct-04 316 61 19 151 60 48
Jan-05 381 79 21 163 55 43
May-05 464 95 20 223 61 48
Oct-05 355 72 20 186 67 52
Jan-06 500 198 40 198 66 40
May-06 566 211 37 235 66 42
Oct-06 478 172 36 210 69 44
Jan-07 508 177 35 216 66 43
May-07 272 105 39 109 69 40
17
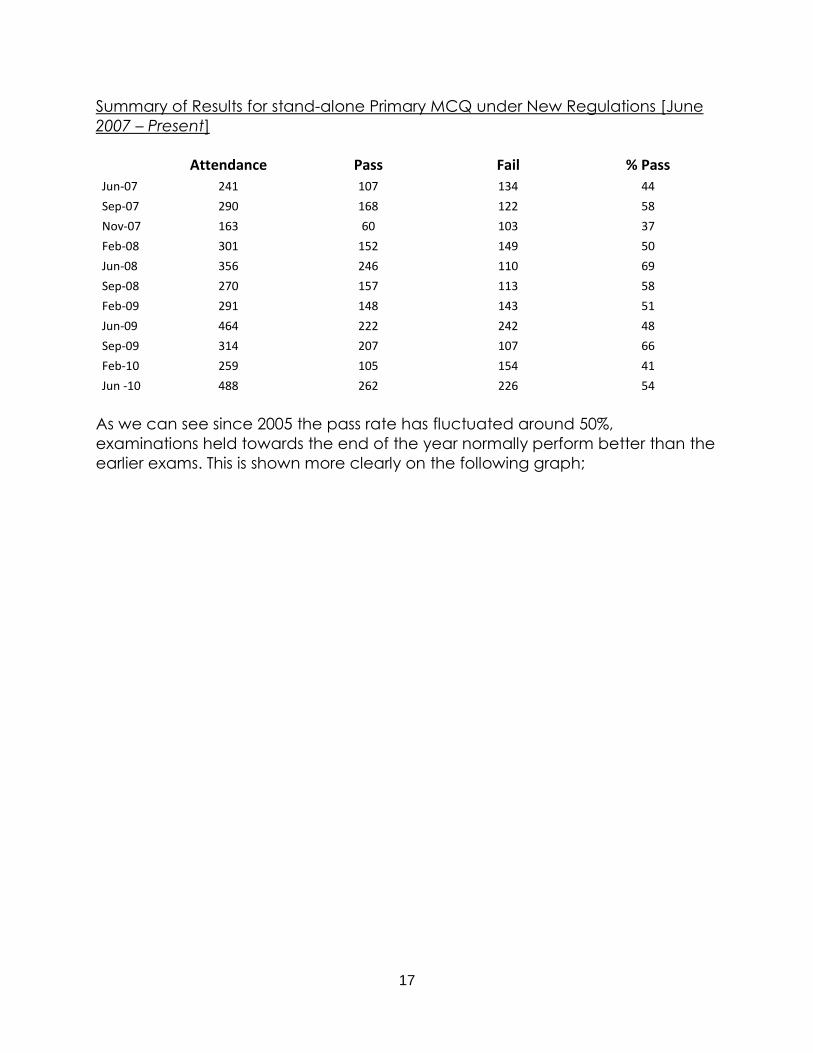
Summary of Results for stand-alone Primary MCQ under New Regulations [June
2007 – Present]
Attendance Pass Fail % Pass
Jun-07 241 107 134 44
Sep-07 290 168 122 58
Nov-07 163 60 103 37
Feb-08 301 152 149 50
Jun-08 356 246 110 69
Sep-08 270 157 113 58
Feb-09 291 148 143 51
Jun-09 464 222 242 48
Sep-09 314 207 107 66
Feb-10 259 105 154 41
Jun -10 488 262 226 54
As we can see since 2005 the pass rate has fluctuated around 50%,
examinations held towards the end of the year normally perform better than the
earlier exams. This is shown more clearly on the following graph;
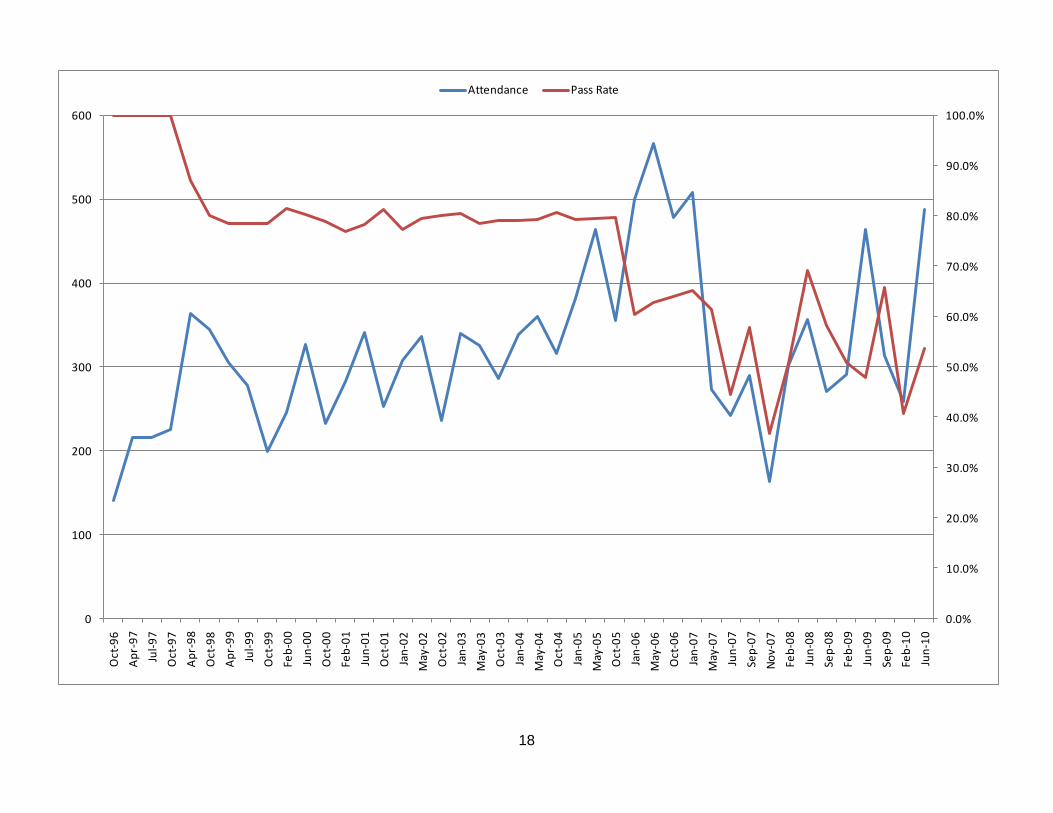
18
0.0%
10.0%
20.0%
30.0%
40.0%
50.0%
60.0%
70.0%
80.0%
90.0%
100.0%
0
100
200
300
400
500
600O
ct-9
6
Ap
r-9
7
Jul-
97
Oct
-97
Ap
r-9
8
Oct
-98
Ap
r-9
9
Jul-
99
Oct
-99
Feb
-00
Jun
-00
Oct
-00
Feb
-01
Jun
-01
Oct
-01
Jan
-02
May
-02
Oct
-02
Jan
-03
May
-03
Oct
-03
Jan
-04
May
-04
Oct
-04
Jan
-05
May
-05
Oct
-05
Jan
-06
May
-06
Oct
-06
Jan
-07
May
-07
Jun
-07
Sep
-07
No
v-0
7
Feb
-08
Jun
-08
Sep
-08
Feb
-09
Jun
-09
Sep
-09
Feb
-10
Jun
-10
Attendance Pass Rate
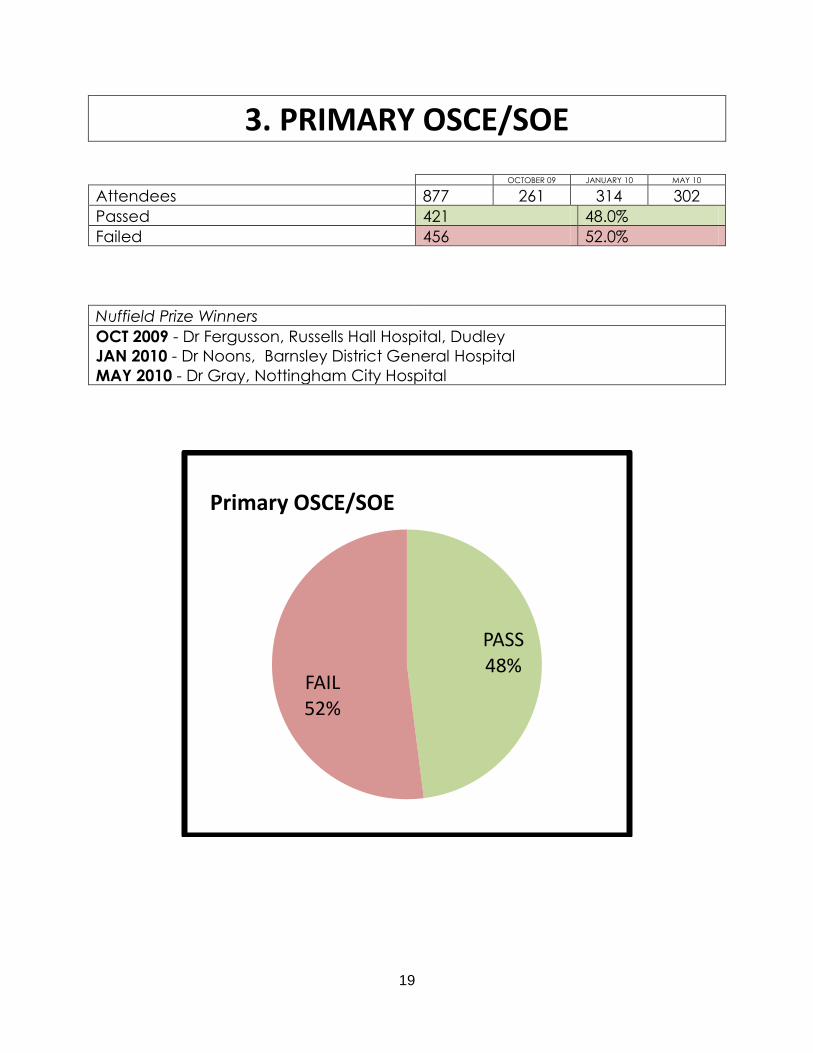
19
3. PRIMARY OSCE/SOE OCTOBER 09 JANUARY 10 MAY 10
Attendees 877 261 314 302
Passed 421 48.0%
Failed 456 52.0%
Nuffield Prize Winners
OCT 2009 - Dr Fergusson, Russells Hall Hospital, Dudley
JAN 2010 - Dr Noons, Barnsley District General Hospital
MAY 2010 - Dr Gray, Nottingham City Hospital
PASS48%
FAIL52%
Primary OSCE/SOE

20
3.1 Pass Rate
Below is the breakdown of candidate pass rates depending on the components
of the OSCE/SOE sat on the day.
Candidates sitting …
Result
Pass Fail Osce Pass SOE Pass
Both sections 297 205 126 97
OSCE only 63 8 - -
SOE only 61 20 - -
We see high pass rates for single components across the year, although we
need to bear in mind that single component candidates would only have been
present in the last two exams of the year.
297
63
61
205
8
20
126
97
0%
10%
20%
30%
40%
50%
60%
70%
80%
90%
100%
BOTH OSCE only SOE only
SOE Pass
OSCE Pass
Fail
Pass

21
3.1.1 1st Attempt Pass Rate
With the introduction of single component passes, the overall examination pass
rates can be significantly skewed with the inclusion of this data. The regulations
state that at the first attempt both components must sat together, as such this
group of candidates should give a good representation of examination
performance.
518
CANDIDATES BOTH OSCE SOE
Pass 232 44.79% 71 13.71% 83 16.02%
Fail 132 25.48%
This data is shown in the graph below;
As you can see 1st time candidates have a 3% lower pass rate than the overall
examination, approximately half of those candidates who failed are leaving
with a partial pass.
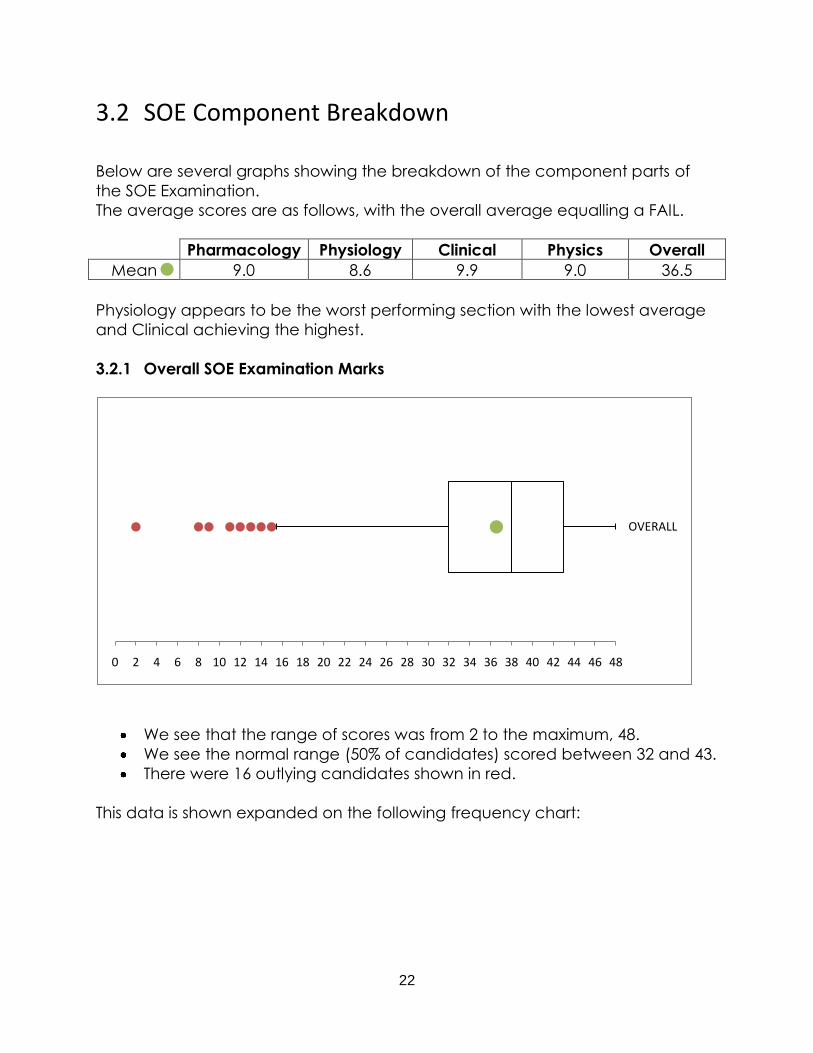
22
3.2 SOE Component Breakdown Below are several graphs showing the breakdown of the component parts of
the SOE Examination.
The average scores are as follows, with the overall average equalling a FAIL.
Pharmacology Physiology Clinical Physics Overall
Mean 9.0 8.6 9.9 9.0 36.5
Physiology appears to be the worst performing section with the lowest average
and Clinical achieving the highest.
3.2.1 Overall SOE Examination Marks
We see that the range of scores was from 2 to the maximum, 48.
We see the normal range (50% of candidates) scored between 32 and 43.
There were 16 outlying candidates shown in red.
This data is shown expanded on the following frequency chart:
0 2 4 6 8 10 12 14 16 18 20 22 24 26 28 30 32 34 36 38 40 42 44 46 48
OVERALL

23
0
10
20
30
40
50
60
0 1 2 3 4 5 6 7 8 9 10 11 12 13 14 15 16 17 18 19 20 21 22 23 24 25 26 27 28 29 30 31 32 33 34 35 36 37 38 39 40 41 42 43 44 45 46 47 48
Fre
qu
en
cy
Total SOE Mark
Total Mark Frequency

24
3.2.2 SOE Component – Pharmacology
We see that the range of scores was from 0 to the maximum, 12.
We see the normal range (50% of candidates) scored between 7 and 11.
We have 3 outlying candidates shown in red.
3.2.3 SOE Component – Physiology
We see that the range of scores was from 0 to the maximum, 12.
We see the normal range (50% of candidates) scored between 7 and 11.
We see 5 outlying candidates shown in red.
0 1 2 3 4 5 6 7 8 9 10 11 12
Pharmacology
0 1 2 3 4 5 6 7 8 9 10 11 12
Physiology

25
3.2.4 SOE Component – Clinical
We see that the range of scores was from 0 to the maximum, 12.
We see the normal range (75% of candidates) scored between 9 and 12.
We see 28 outlying candidates, shown in red.
3.2.5 SOE Component – Physics
We see that the range of scores was from 0 to the maximum, 12.
We see the normal range (50% of candidates) scored between 8 and 11.
We see 40 outlying candidates shown in red.
0 1 2 3 4 5 6 7 8 9 10 11 12
Clinical
0 1 2 3 4 5 6 7 8 9 10 11 12
Physics

26
3.3 Gender
The gender breakdown of attendees is as follows:
Attendees: 877 Male: 471
Female: 406
We see similar pass rates for the genders although the male candidates were
slightly lower pass rate but with a slightly higher attendance.
Fail54%
Pass46%
Male Pass Rate
Fail50%
Pass50%
Female Pass Rate

27
3.4 Area of Qualification
Attendees 700 37 140
Pass Rate 53.14% 29.73% 27.14%
Fail Rate 46.86% 70.27% 72.86%
From the graph as you would expect we can see our highest number of candidates came from the UK, they also enjoyed the highest pass rate, above the examination pass rate by 5%. The candidates from Europe were our lowest attendees and had a pass rate 18% lower than that of the overall examination. Candidates from outside of Europe were greater than those from Europe and have the lowest pass rate 21% below the examination pass rate.

28
3.5 Candidate History
The table below shows the candidates previous attempts at the Primary FRCA
and pass rates:
Attempt No 1 2 3 4
PASS 232 44.79% 141 53.41% 38 54.29% 10 40%
FAIL 286 55.21% 123 46.59% 32 45.71% 15 60%
Total 518 264 70 25
As we can see from the table above the large majority of our candidates (59%)
are on their first attempt and only 5% of candidates are on their final, fourth,
attempt. The graph below shows the correlation between the pass rate and the
attempt number:
Unlike the Final examinations there is an increase in pass rate for those on their
second and third attempt, this may be due to the experience of the OSCE/SOE
format gained in their first attempt.
29
3.6 Reliability The OSCE examination is conducted twice on 17 candidates each giving a
maximum cohort of 34. This is a similar situation to the SOE which examines 24
candidates in each cohort. According to PMETB Guidance 09/1 “Reliability
issues in the assessment of small cohorts” January 2009,
“Reliability (and hence the Standard Error of Measurement) cannot be
measured in assessments where there are small cohorts”
As previously stated the OSCE and SOE examinations do not reach the kind of
level required to calculate the reliability, the minimum number has been
variously calculated between 100-300 (Dr Gareth Holsgrove, Reliability issues in
the assessment of small cohorts p 9) and as such reliability coefficients are not
available for these examination components.

30
3.7 Historical Data Summary of Results for Primary FRCA Combined Examination
[October 1996 to May 2007]
Sitting No cand sat
MCQ No cand
eliminated % Eliminated No cand passed
% passed SOEs
% passed overall
Oct-96 141 0 0 53 39 38
Apr-97 215 0 0 96 46 45
Jul-97 215 0 0 104 50 48
Oct-97 225 0 0 95 46 42
Apr-98 364 47 13 151 48 42
Oct-98 345 69 20 131 48 38
Apr-99 306 66 22 132 56 43
Jul-99 278 60 22 127 58 43
Oct-99 199 43 22 93 60 47
Feb-00 245 45 18 98 49 40
Jun-00 326 64 20 139 54 43
Oct-00 232 49 21 97 53 42
Feb-01 283 65 23 119 55 42
Jun-01 341 74 22 139 52 41
Oct-01 253 47 19 124 60 49
Jan-02 308 70 23 126 53 41
May-02 337 69 20 137 52 41
Oct-02 236 47 20 189 61 48
Jan-03 340 66 19 151 56 44
May-03 325 70 22 150 60 46
Oct-03 286 60 21 136 60 47
Jan-04 339 71 21 163 62 48
May-04 360 75 21 161 58 45
Oct-04 316 61 19 151 60 48
Jan-05 381 79 21 163 55 43
May-05 464 95 20 223 61 48
Oct-05 355 72 20 186 67 52
Jan-06 500 198 40 198 66 40
May-06 566 211 37 235 66 42
Oct-06 478 172 36 210 69 44
Jan-07 508 177 35 216 66 43
May-07 272 105 39 109 69 40

31
Summary of Results for Primary OSCE/SOE [October 2007 – October 2009]
Attended Passed %
Oct-07 143 85 59%
Jan-08 258 164 64%
May-08 222 143 64%
Oct-08 242 185 76%
Jan-09 271 184 68%
May-09 203 117 58%
Oct-09 261 122 47%
Summary of Results for Primary OSCE/SOE under new regulations allowing for
component pass [January 2010 – present]
Attended Candidates
Sat… RESULTS
Pass Fail Osce Pass SOE Pass Jan-10 314 Both 100 72 45 45
OSCE only 22 2 SOE only 20 8 Mar-10 302 Both 75 63 39 25
OSCE only 41 6 SOE only 41 12
The graph on the following page shows a comparison of the overall
examination pass rate, those candidates walking away at the end of the day
with a Primary FRCA. As you can see we have had a decrease in pass rate since
the uncoupling of the Primary MCQ and Primary OSCE/SOE, this decrease has
slowed and we must also now take into account 90 candidates in the most
recent sitting have achieved a partial pass.
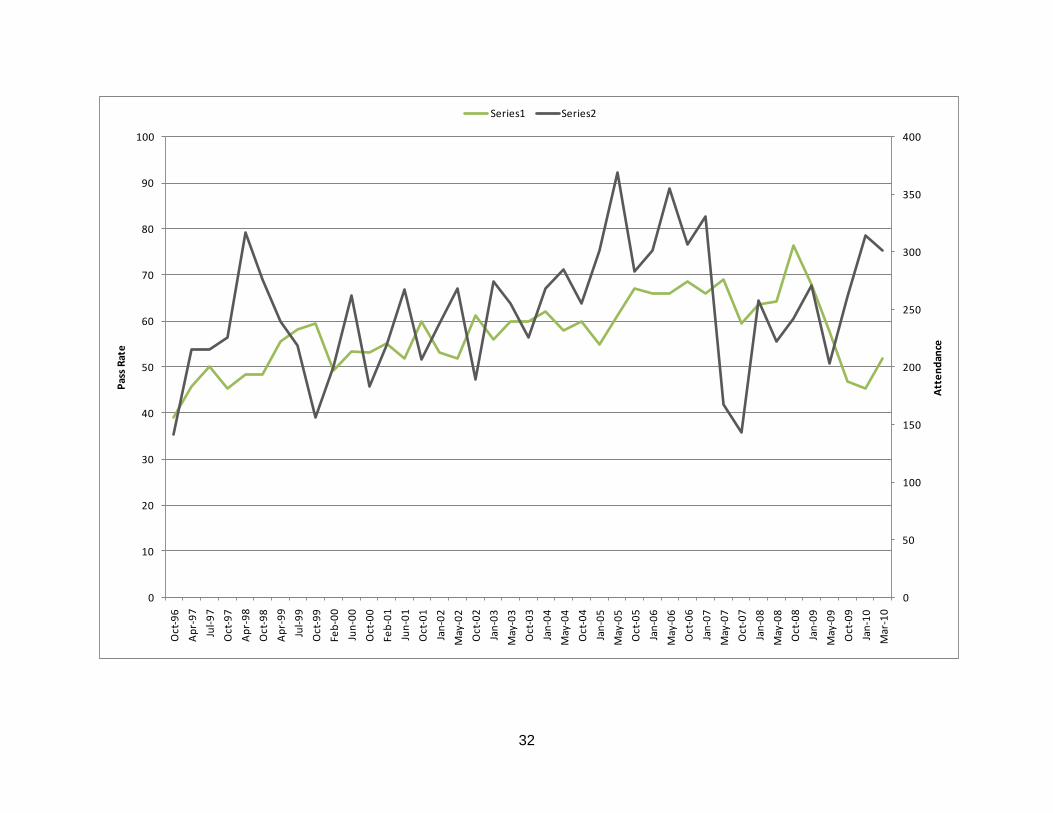
32
0
50
100
150
200
250
300
350
400
0
10
20
30
40
50
60
70
80
90
100
Oct
-96
Ap
r-9
7
Jul-
97
Oct
-97
Ap
r-9
8
Oct
-98
Ap
r-9
9
Jul-
99
Oct
-99
Feb
-00
Jun
-00
Oct
-00
Feb
-01
Jun
-01
Oct
-01
Jan
-02
May
-02
Oct
-02
Jan
-03
May
-03
Oct
-03
Jan
-04
May
-04
Oct
-04
Jan
-05
May
-05
Oct
-05
Jan
-06
May
-06
Oct
-06
Jan
-07
May
-07
Oct
-07
Jan
-08
May
-08
Oct
-08
Jan
-09
May
-09
Oct
-09
Jan
-10
Mar
-10
Att
en
dan
ce
Pas
s R
ate
Series1 Series2
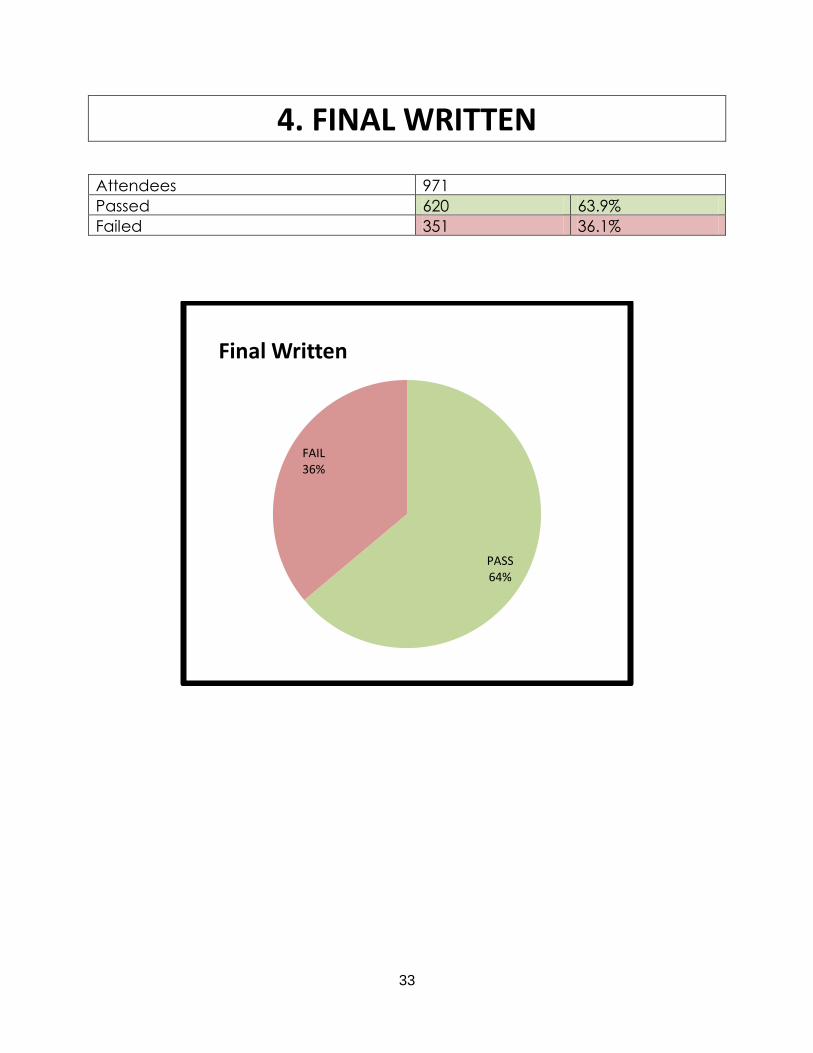
33
4. FINAL WRITTEN Attendees 971
Passed 620 63.9%
Failed 351 36.1%
PASS64%
FAIL36%
Final Written

34
4.1 Component Breakdown
4.1.1 Overall Marks
Below are several graphs showing the breakdown of the component parts of
the Final Written Examination.
The average scores are as follows,
MCQ SAQ Overall Mark
Mean 77.8% 64.1% 142.1%
We see that the range of overall scores was from 108% to 169%.
We see the normal range (50% of candidates) scored between 136 and
149%, indicating a very narrow distribution of marks.
We can see the cohort is evenly distributed with the median sitting with
the mean.
We have seven low outlying candidates (in red) although still very close to
the main pack.
This data is shown expanded on the following page.
126 candidates (13%) that passed the overall written examination failed the
MCQ and 65 candidates (7%) failed the SAQ component but passed overall.
0 20 40 60 80 100 120 140 160 180 200
OVERALL
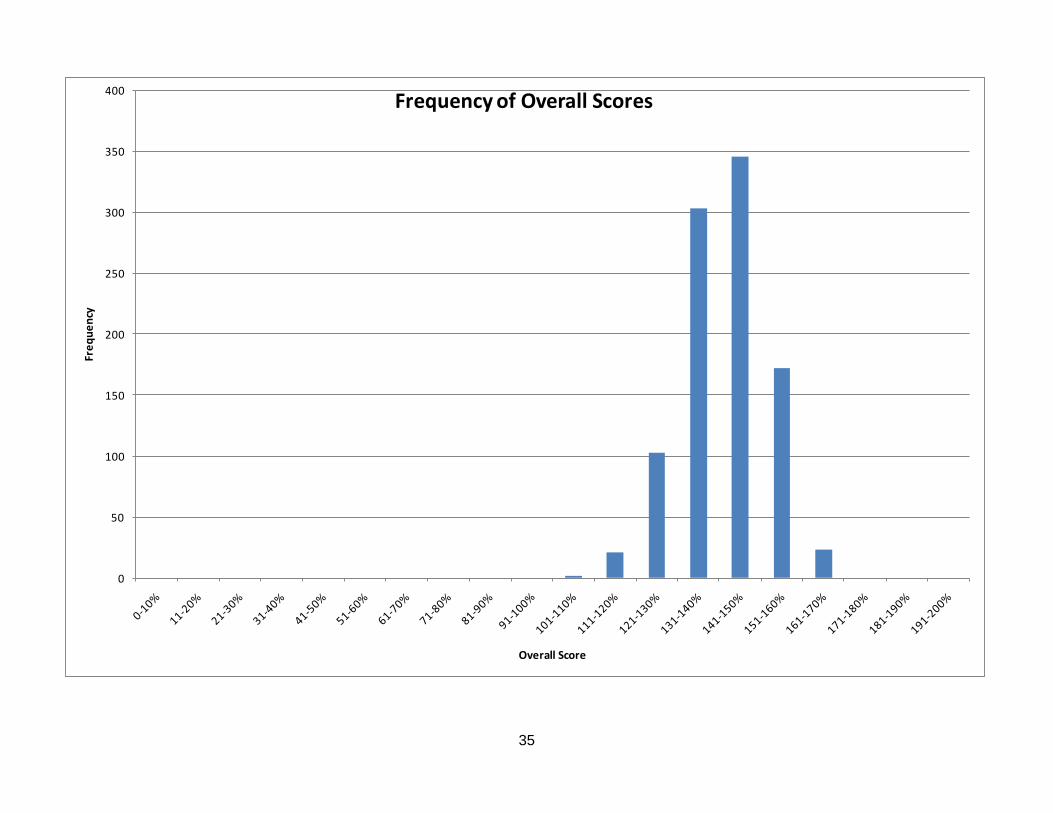
35
0
50
100
150
200
250
300
350
400Fr
eq
ue
ncy
Overall Score
Frequency of Overall Scores
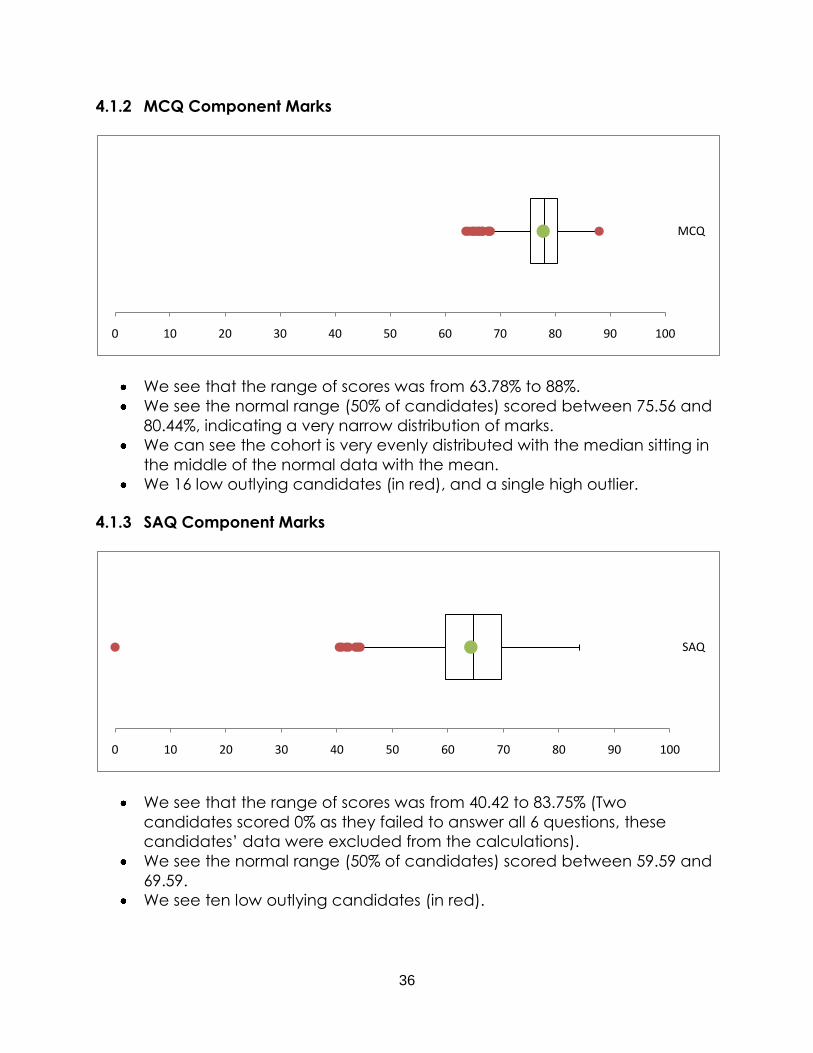
36
4.1.2 MCQ Component Marks
We see that the range of scores was from 63.78% to 88%.
We see the normal range (50% of candidates) scored between 75.56 and
80.44%, indicating a very narrow distribution of marks.
We can see the cohort is very evenly distributed with the median sitting in
the middle of the normal data with the mean.
We 16 low outlying candidates (in red), and a single high outlier.
4.1.3 SAQ Component Marks
We see that the range of scores was from 40.42 to 83.75% (Two
candidates scored 0% as they failed to answer all 6 questions, these
candidates’ data were excluded from the calculations).
We see the normal range (50% of candidates) scored between 59.59 and
69.59.
We see ten low outlying candidates (in red).
0 10 20 30 40 50 60 70 80 90 100
MCQ
0 10 20 30 40 50 60 70 80 90 100
SAQ

37
4.1.4 SAQ Component – ‘Poor Fail’ Analysis
As per the Primary and Final FRCA Examination Regulations “candidates who
get poor fails in three or more questions will have their examination papers
reviewed by the examiners”. In this sitting of the examination the number of poor
fails achieved by candidates were as follows:
The green bars indicate candidates who achieved poor fails and still passed the
overall examination. 45 candidates achieved 3 or more poor fails with one
candidate scoring 6 poor fails and still passing the paper overall.
4.1.5 Proportion of total marks from each section
As you can see candidates get a slightly higher proportion of their marks from
the MCQ on average.
0
50
100
150
200
250
300
1 2 3 4 5 6 7 8 9 10 11 12 13
No
of
Can
did
ate
s
No of Poor Fails
Total
Pass
MCQ, 0.548964508 SAQ, 0.449884206
0 0.1 0.2 0.3 0.4 0.5 0.6 0.7 0.8 0.9 1

38
Fail28%
Pass72%
Female Pass Rate
4.2 Gender
The gender breakdown of attendees is as follows:
Attendees: 971 Male: 573
Female: 398
As you can see the female candidates enjoy a significantly higher pass rate
than the male candidates. Whereas male candidates have a higher
attendance.
Fail42%
Pass58%
Male Pass Rate

39
4.3 Area of Qualification
Attendees 548 44 379
Pass Rate 73.36% 47.73% 51.98%
Fail Rate 26.64% 52.27% 48.02%
From the graph as you would expect we can see our highest number of candidates came from the UK, achieving the highest pass rate, 9% above the examination pass rate (66%). This is consistent with previous sittings. The candidates from Europe were our lowest attendees and suffered a pass rate 15% lower than the exam pass rate. Attendance of candidates from outside of Europe was down from last sitting but again had a much lower pass rate, 18% less than the examination pass rate.
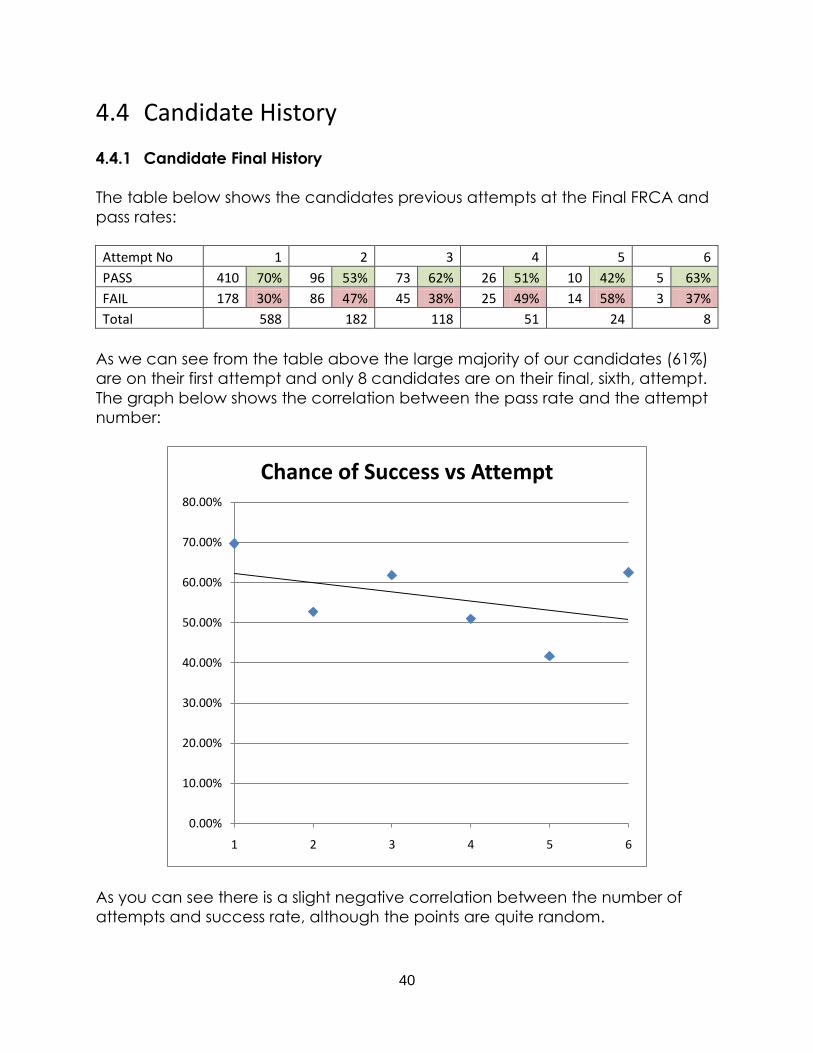
40
4.4 Candidate History
4.4.1 Candidate Final History
The table below shows the candidates previous attempts at the Final FRCA and
pass rates:
Attempt No 1 2 3 4 5 6
PASS 410 70% 96 53% 73 62% 26 51% 10 42% 5 63%
FAIL 178 30% 86 47% 45 38% 25 49% 14 58% 3 37%
Total 588 182 118 51 24 8
As we can see from the table above the large majority of our candidates (61%)
are on their first attempt and only 8 candidates are on their final, sixth, attempt.
The graph below shows the correlation between the pass rate and the attempt
number:
As you can see there is a slight negative correlation between the number of
attempts and success rate, although the points are quite random.
0.00%
10.00%
20.00%
30.00%
40.00%
50.00%
60.00%
70.00%
80.00%
1 2 3 4 5 6
Chance of Success vs Attempt
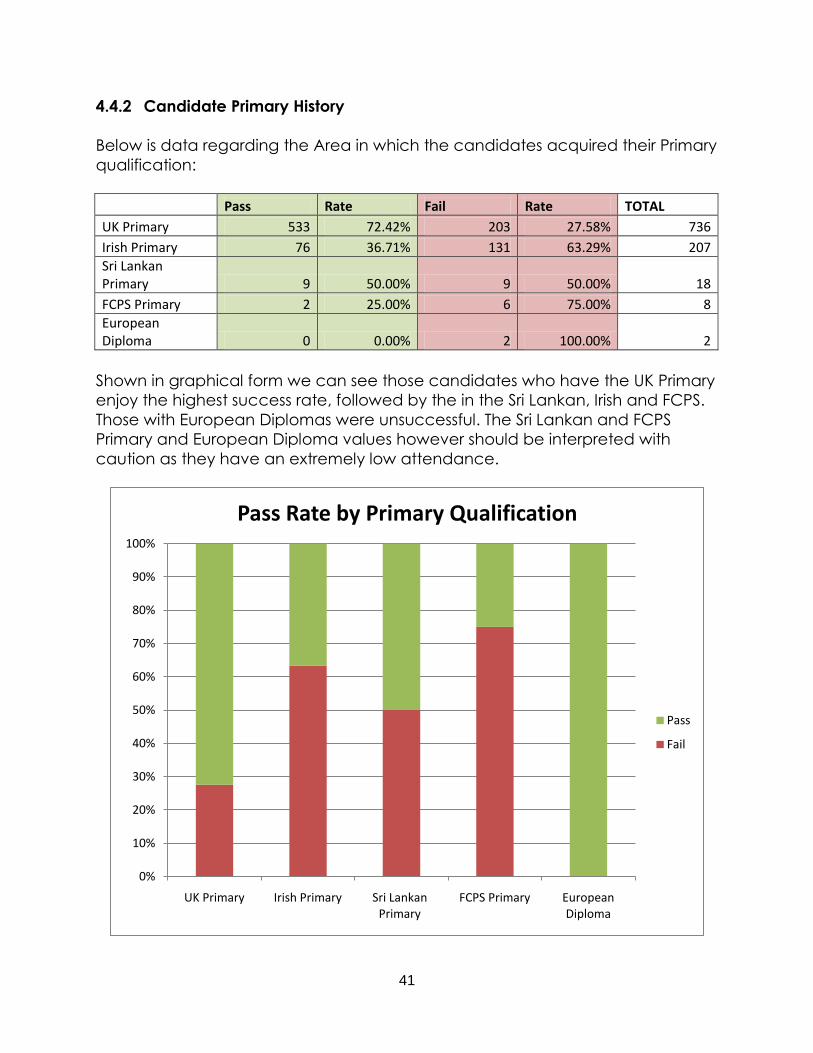
41
4.4.2 Candidate Primary History
Below is data regarding the Area in which the candidates acquired their Primary
qualification:
Pass Rate Fail Rate TOTAL
UK Primary 533 72.42% 203 27.58% 736
Irish Primary 76 36.71% 131 63.29% 207
Sri Lankan Primary 9 50.00% 9 50.00% 18
FCPS Primary 2 25.00% 6 75.00% 8
European Diploma 0 0.00% 2 100.00% 2
Shown in graphical form we can see those candidates who have the UK Primary
enjoy the highest success rate, followed by the in the Sri Lankan, Irish and FCPS.
Those with European Diplomas were unsuccessful. The Sri Lankan and FCPS
Primary and European Diploma values however should be interpreted with
caution as they have an extremely low attendance.
0%
10%
20%
30%
40%
50%
60%
70%
80%
90%
100%
UK Primary Irish Primary Sri Lankan Primary
FCPS Primary European Diploma
Pass Rate by Primary Qualification
Pass
Fail
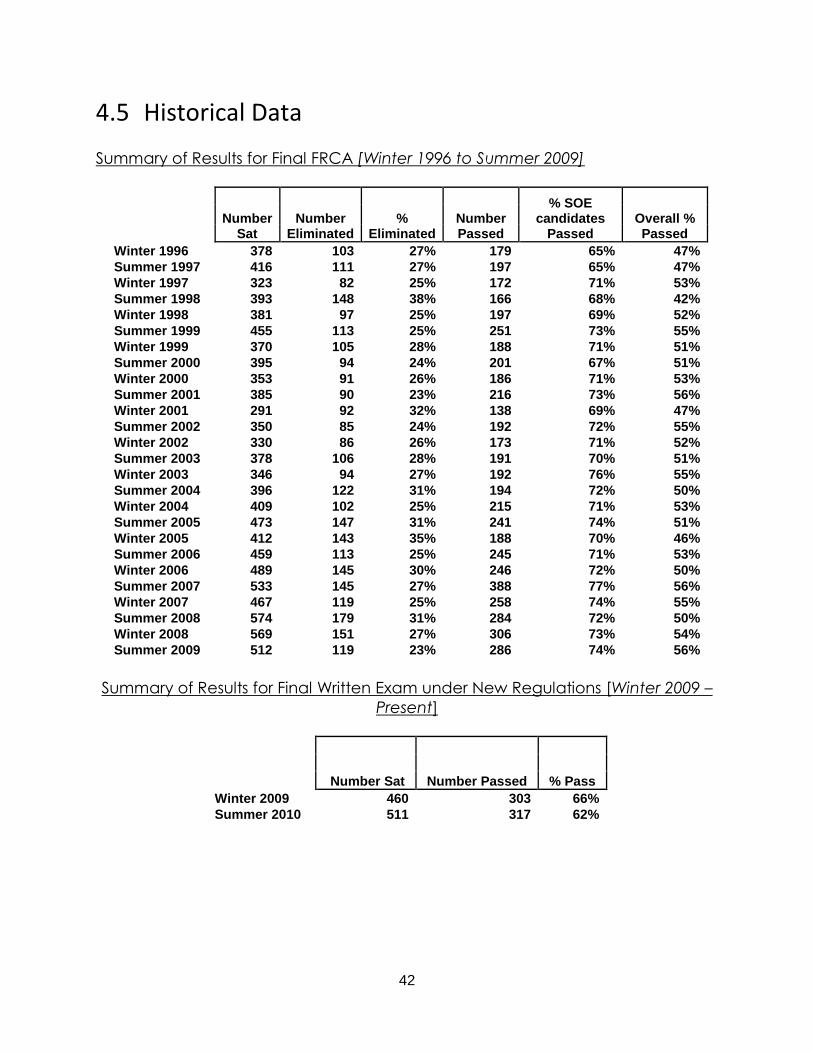
42
4.5 Historical Data
Summary of Results for Final FRCA [Winter 1996 to Summer 2009]
Summary of Results for Final Written Exam under New Regulations [Winter 2009 –
Present]
Number Sat Number Passed % Pass
Winter 2009 460 303 66%
Summer 2010 511 317 62%
Number
Sat Number
Eliminated %
Eliminated Number Passed
% SOE candidates
Passed Overall % Passed
Winter 1996 378 103 27% 179 65% 47%
Summer 1997 416 111 27% 197 65% 47%
Winter 1997 323 82 25% 172 71% 53%
Summer 1998 393 148 38% 166 68% 42%
Winter 1998 381 97 25% 197 69% 52%
Summer 1999 455 113 25% 251 73% 55%
Winter 1999 370 105 28% 188 71% 51%
Summer 2000 395 94 24% 201 67% 51%
Winter 2000 353 91 26% 186 71% 53%
Summer 2001 385 90 23% 216 73% 56%
Winter 2001 291 92 32% 138 69% 47%
Summer 2002 350 85 24% 192 72% 55%
Winter 2002 330 86 26% 173 71% 52%
Summer 2003 378 106 28% 191 70% 51%
Winter 2003 346 94 27% 192 76% 55%
Summer 2004 396 122 31% 194 72% 50%
Winter 2004 409 102 25% 215 71% 53%
Summer 2005 473 147 31% 241 74% 51%
Winter 2005 412 143 35% 188 70% 46%
Summer 2006 459 113 25% 245 71% 53%
Winter 2006 489 145 30% 246 72% 50%
Summer 2007 533 145 27% 388 77% 56%
Winter 2007 467 119 25% 258 74% 55%
Summer 2008 574 179 31% 284 72% 50%
Winter 2008 569 151 27% 306 73% 54%
Summer 2009 512 119 23% 286 74% 56%

43
As you can see we have a drop in both attendance and pass rate with the introduction of the new regulations.
0.00%
10.00%
20.00%
30.00%
40.00%
50.00%
60.00%
70.00%
80.00%
90.00%
0
100
200
300
400
500
600
700
W 1
99
6
S 1
99
7
W 1
99
7
S 1
99
8
W 1
99
8
S 1
99
9
W 1
99
9
S 2
00
0
W 2
00
0
S 2
00
1
W 2
00
1
S 2
00
2
W 2
00
2
S 2
00
3
W 2
00
3
S 2
00
4
W 2
00
4
S 2
00
5
W 2
00
5
S 2
00
6
W 2
00
6
S 2
00
7
W 2
00
7
S 2
00
8
W 2
00
8
S 2
00
9
W 2
00
9
S 2
01
0
Attendance
Pass Rate
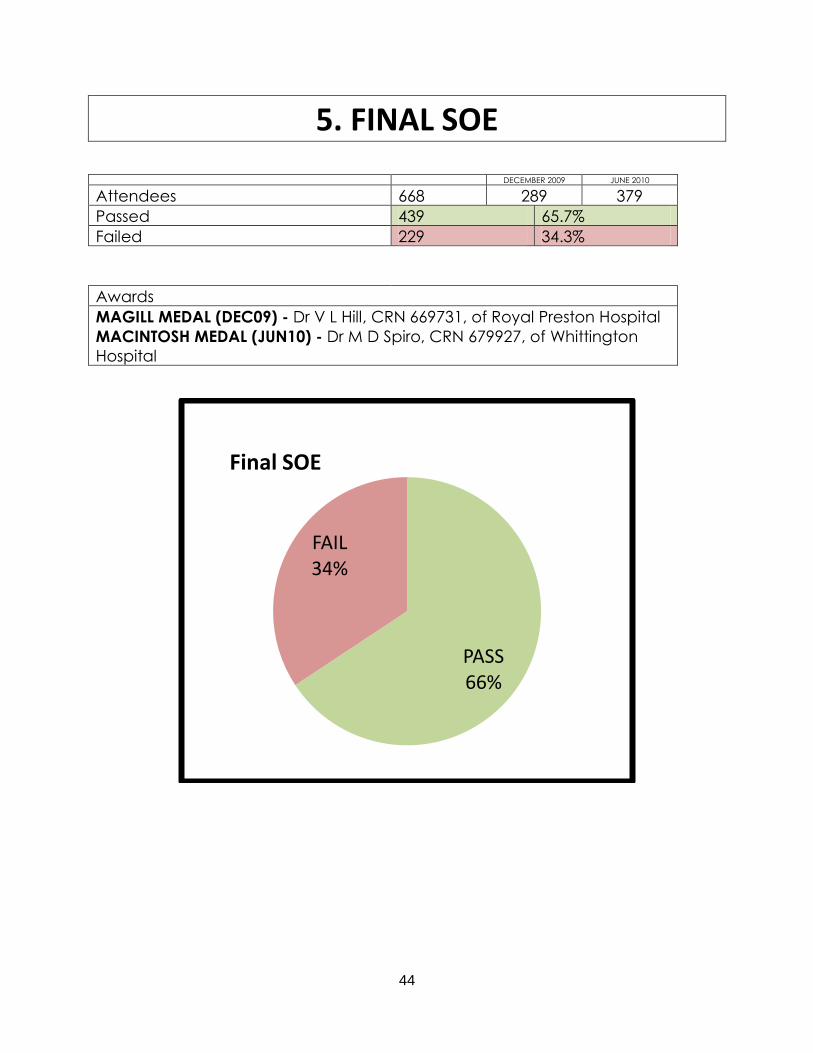
44
5. FINAL SOE DECEMBER 2009 JUNE 2010
Attendees 668 289 379
Passed 439 65.7%
Failed 229 34.3%
Awards
MAGILL MEDAL (DEC09) - Dr V L Hill, CRN 669731, of Royal Preston Hospital
MACINTOSH MEDAL (JUN10) - Dr M D Spiro, CRN 679927, of Whittington
Hospital
PASS66%
FAIL34%
Final SOE
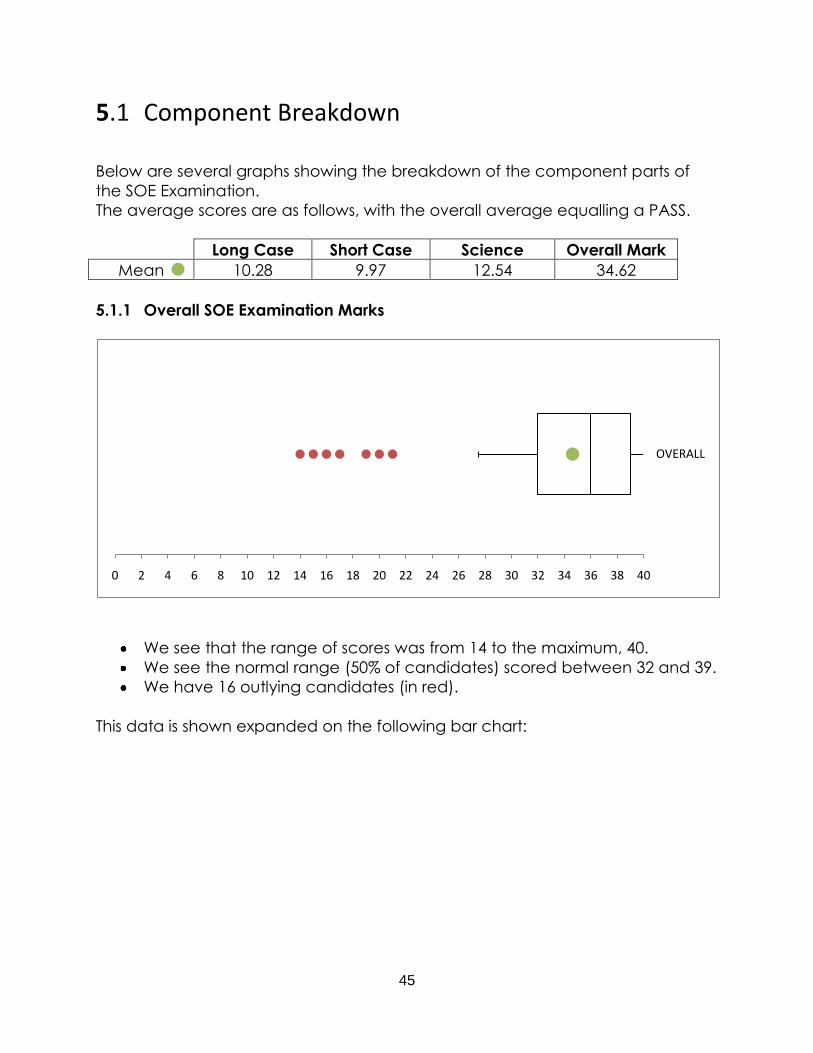
45
5.1 Component Breakdown Below are several graphs showing the breakdown of the component parts of
the SOE Examination.
The average scores are as follows, with the overall average equalling a PASS.
Long Case Short Case Science Overall Mark
Mean 10.28 9.97 12.54 34.62
5.1.1 Overall SOE Examination Marks
We see that the range of scores was from 14 to the maximum, 40.
We see the normal range (50% of candidates) scored between 32 and 39.
We have 16 outlying candidates (in red).
This data is shown expanded on the following bar chart:
0 2 4 6 8 10 12 14 16 18 20 22 24 26 28 30 32 34 36 38 40
OVERALL
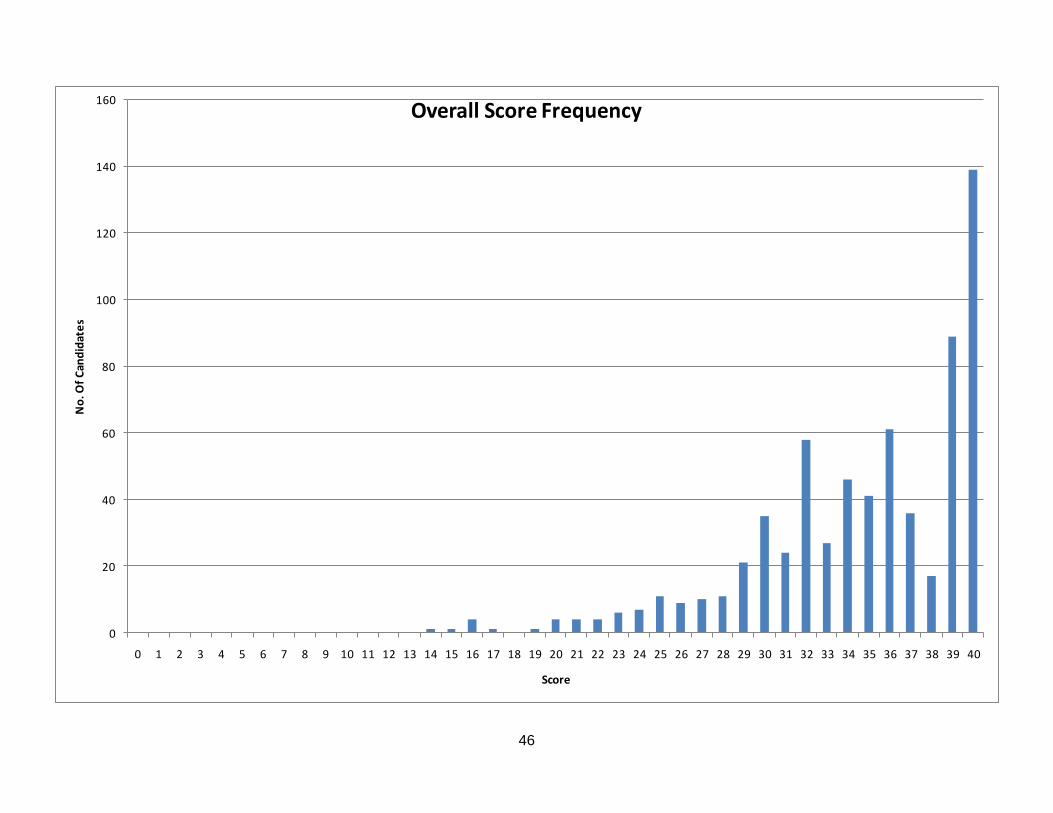
46
0
20
40
60
80
100
120
140
160
0 1 2 3 4 5 6 7 8 9 10 11 12 13 14 15 16 17 18 19 20 21 22 23 24 25 26 27 28 29 30 31 32 33 34 35 36 37 38 39 40
No
. Of
Can
did
ate
s
Score
Overall Score Frequency

47
5.1.2 SOE Component – Long Case
We see that the range of scores was from 1 to the maximum, 12.
We see the normal range (75% of candidates) scored between 9 and 12.
We have 14 outlying candidates (in red)
5.1.3 SOE Component – Short Case
We see that the range of scores was from 1 to the maximum, 12.
We see the normal range (75% of candidates) scored between 9 and 12.
We have 17 outlying candidates (in red).
0 1 2 3 4 5 6 7 8 9 10 11 12
LONG
0 1 2 3 4 5 6 7 8 9 10 11 12
SHORT
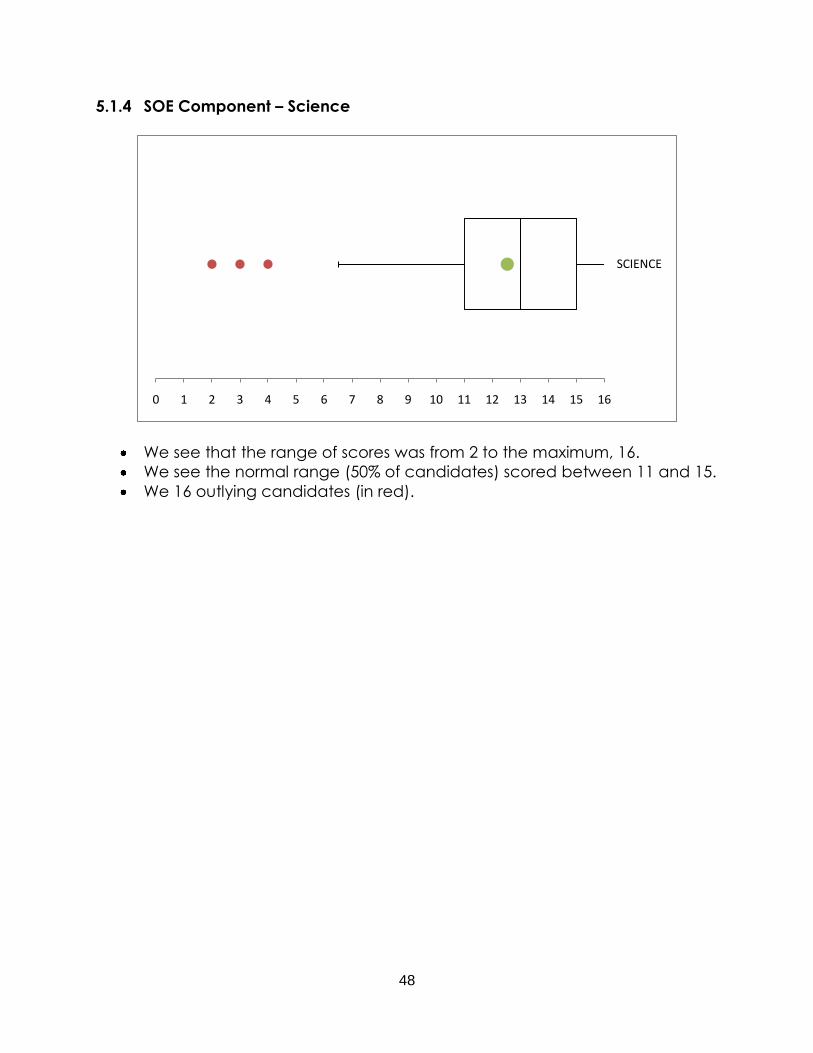
48
5.1.4 SOE Component – Science
We see that the range of scores was from 2 to the maximum, 16.
We see the normal range (50% of candidates) scored between 11 and 15.
We 16 outlying candidates (in red).
0 1 2 3 4 5 6 7 8 9 10 11 12 13 14 15 16
SCIENCE

49
Fail30%
Pass70%
Female Pass Rate
5.2 Gender
The gender breakdown of attendees is as follows:
Attendees: 668 Male: 369
Female: 299
As you can see the female candidates enjoy a slightly higher pass rate and the
male candidates a higher attendance rate.
Fail38%
Pass62%
Male Pass Rate
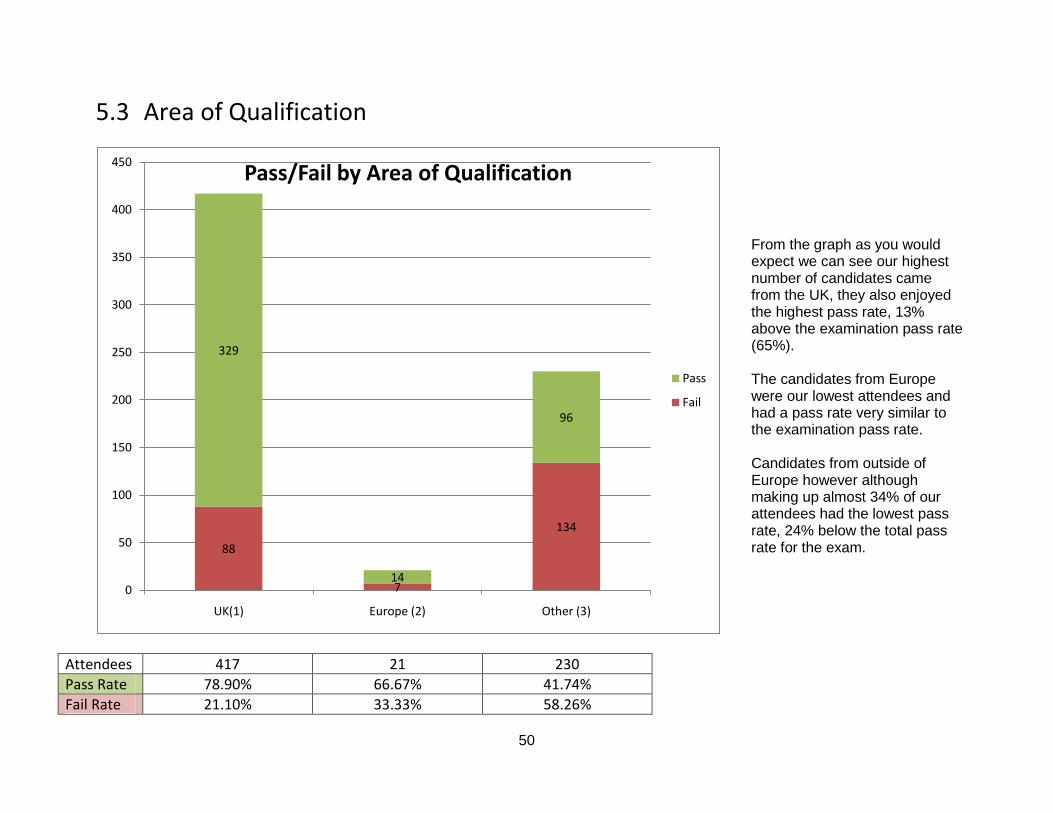
50
5.3 Area of Qualification
Attendees 417 21 230
Pass Rate 78.90% 66.67% 41.74%
Fail Rate 21.10% 33.33% 58.26%
88
7
134
329
14
96
0
50
100
150
200
250
300
350
400
450
UK(1) Europe (2) Other (3)
Pass/Fail by Area of Qualification
Pass
Fail
From the graph as you would expect we can see our highest number of candidates came from the UK, they also enjoyed the highest pass rate, 13% above the examination pass rate (65%). The candidates from Europe were our lowest attendees and had a pass rate very similar to the examination pass rate. Candidates from outside of Europe however although making up almost 34% of our attendees had the lowest pass rate, 24% below the total pass rate for the exam.
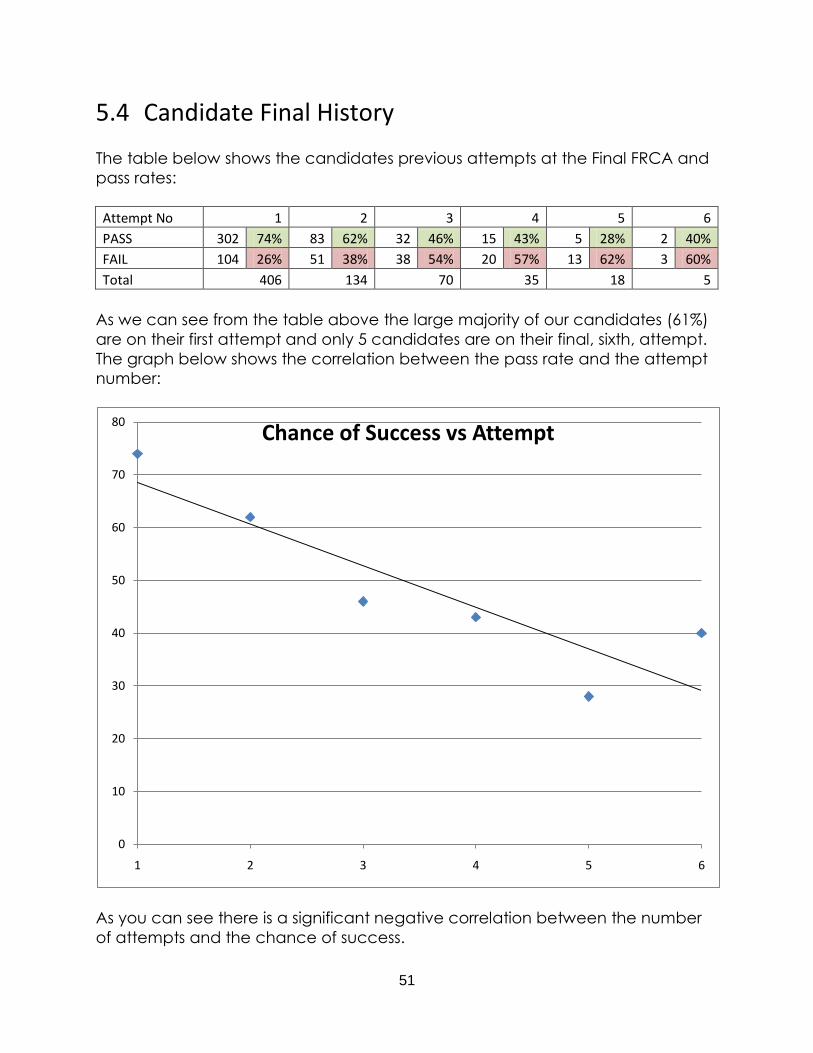
51
5.4 Candidate Final History
The table below shows the candidates previous attempts at the Final FRCA and
pass rates:
Attempt No 1 2 3 4 5 6
PASS 302 74% 83 62% 32 46% 15 43% 5 28% 2 40%
FAIL 104 26% 51 38% 38 54% 20 57% 13 62% 3 60%
Total 406 134 70 35 18 5
As we can see from the table above the large majority of our candidates (61%)
are on their first attempt and only 5 candidates are on their final, sixth, attempt.
The graph below shows the correlation between the pass rate and the attempt
number:
As you can see there is a significant negative correlation between the number
of attempts and the chance of success.
0
10
20
30
40
50
60
70
80
1 2 3 4 5 6
Chance of Success vs Attempt

52
5.4.1 Candidate Primary History
Below is data regarding the Area in which the candidates acquired their Primary
qualification:
Pass Rate Fail Rate TOTAL
UK Primary 488 84.72% 88 15.28% 576
Irish Primary 57 74.03% 20 25.97% 77
Sri Lankan Primary 9 69.23% 4 30.77% 13
FCPS Primary 1 50.00% 1 50.00% 2
Shown in graphical form we can see those candidates who have the UK Primary
enjoy the highest success rate, followed by the in the Irish, Sri Lankan and FCPS
Primary Candidates. The Sri Lankan and FCPS Primary values however should be
interpreted with caution as they have an extremely low attendance.
0%
10%
20%
30%
40%
50%
60%
70%
80%
90%
100%
UK Primary Irish Primary FCPS Primary Sri Lankan Primary
Fail
Pass

53
5.5 Historical Data
Summary of Results for Final FRCA [Winter 1996 to Summer 2009]
Summary of Results for Final SOE under New Regulations [Winter 2009 – Present]
Number Sat Number Passed % Pass
Winter 2009 289 176 61%
Summer 2010 379 263 71%
Number
Sat Number
Eliminated %
Eliminated Number Passed
% SOE candidates
Passed Overall % Passed
Winter 1996 378 103 27% 179 65% 47%
Summer 1997 416 111 27% 197 65% 47%
Winter 1997 323 82 25% 172 71% 53%
Summer 1998 393 148 38% 166 68% 42%
Winter 1998 381 97 25% 197 69% 52%
Summer 1999 455 113 25% 251 73% 55%
Winter 1999 370 105 28% 188 71% 51%
Summer 2000 395 94 24% 201 67% 51%
Winter 2000 353 91 26% 186 71% 53%
Summer 2001 385 90 23% 216 73% 56%
Winter 2001 291 92 32% 138 69% 47%
Summer 2002 350 85 24% 192 72% 55%
Winter 2002 330 86 26% 173 71% 52%
Summer 2003 378 106 28% 191 70% 51%
Winter 2003 346 94 27% 192 76% 55%
Summer 2004 396 122 31% 194 72% 50%
Winter 2004 409 102 25% 215 71% 53%
Summer 2005 473 147 31% 241 74% 51%
Winter 2005 412 143 35% 188 70% 46%
Summer 2006 459 113 25% 245 71% 53%
Winter 2006 489 145 30% 246 72% 50%
Summer 2007 533 145 27% 388 77% 56%
Winter 2007 467 119 25% 258 74% 55%
Summer 2008 574 179 31% 284 72% 50%
Winter 2008 569 151 27% 306 73% 54%
Summer 2009 512 119 23% 286 74% 56%

54
0.00%
10.00%
20.00%
30.00%
40.00%
50.00%
60.00%
70.00%
80.00%
0
50
100
150
200
250
300
350
400
450
W 1996
S 1997
W 1997
S 1998
W 1998
S 1999
W 1999
S 2000
W 2000
S 2001
W 2001
S 2002
W 2002
S 2003
W 2003
S 2004
W 2004
S 2005
W 2005
S 2006
W 2006
S 2007
W 2007
S 2008
W 2008
S 2009
W 2009
S 2010
Pas
s R
ate
SOE
Att
en
dan
ce
Attendance Pass Rate