Embed Size (px)
Citation preview
1107AUGUST 2004AMERICAN METEOROLOGICAL SOCIETY |
S evere thunderstorms, because of their propensityto injure, kill, and cause extensive property dam-age, are a primary concern to not only weather
forecasters but also the public. However, these stormsremain a puzzling scientific and forecasting problem,
as they exhibit not only a wide range of electrical ac-tivity, but also diversity in precipitation type andamount. One of the more intriguing severe stormstypes in this regard is the supercell thunderstorm(Browning 1964). In its most pristine state, a supercellis a unicellular thunderstorm comprised of a single,long-lived, rotating updraft, and it frequently pro-duces large hail, high winds, prolific lightning, andoccasionally tornadoes. While the basic dynamics ofsupercells seem well understood (e.g., Klemp 1987),these storms exhibit a wide variety of precipitationcharacteristics that are not understood. For instance,supercells have been classified as either low precipi-tation (LP; Donaldson et al. 1965; Davies-Jones et al.1976; Burgess and Davies-Jones 1979; Bluestein andParks 1983), classic or medium precipitation (MP),or heavy precipitation (HP; Doswell and Burgess1993; Rasmussen and Straka 1998) based on visualobservations of the cloud and precipitation shafts.Perhaps the least-understood among these storms areLP supercells, which characteristically produce somelarge hail but little rain. Potentially because of the dryenvironment and lack of visible precipitation, the vis-ible cloud below the anvil is a skeleton compared with
THE SEVERE THUNDERSTORMELECTRIFICATION ANDPRECIPITATION STUDY
BY TIMOTHY J. LANG, L. JAY MILLER, MORRIS WEISMAN, STEVEN A. RUTLEDGE, LLYLE J. BARKER III,V. N. BRINGI, V. CHANDRASEKAR, ANDREW DETWILER, NOLAN DOESKEN, JOHN HELSDON,
CHARLES KNIGHT, PAUL KREHBIEL, WALTER A. LYONS, DON MACGORMAN,ERIK RASMUSSEN, WILLIAM RISON, W. DAVID RUST, AND RONALD J. THOMAS
Data from a field project on the Colorado–Kansas border in summer 2000 is helping to
improve our understanding of positive cloud-to-ground lightning and low-precipitation storms.
AFFILIATIONS: LANG, RUTLEDGE, BRINGI, AND CHANDRASEKAR—Colorado State University, Fort Collins, Colorado; MILLER, WEISMAN,AND KNIGHT—National Center for Atmospheric Research, Boulder,Colorado; BARKER—National Weather Service, Lincoln, Illinois;DETWILER AND HELSDON—South Dakota School of Mines andTechnology, Rapid City, South Dakota; DOESKEN—Colorado ClimateCenter, Fort Collins, Colorado; KREHBIEL, RISON, AND THOMAS—New Mexico Institute of Mining and Technology, Socorro, NewMexico; LYONS—FMA Research, Inc., Fort Collins, Colorado;MACGORMAN, RASMUSSEN, AND RUST—National Severe StormsLaboratory, Norman, OklahomaCORRESPONDING AUTHOR: Timothy J. Lang, Department ofAtmospheric Science, Colorado State University, Fort Collins, CO80523E-mail: [email protected]: 10.1175/BAMS-85-8-1107
In final form 26 March 2004”2004 American Meteorological Society
1108 AUGUST 2004|
other supercell storms (Bluestein and Parks 1983;Bluestein and Woodall 1990).
Another unusual aspect of some convective storms,including supercells, is their tendency to producecopious positive cloud-to-ground (+CG) lightning(e.g., Branick and Doswell 1992; Curran and Rust1992; Carey and Rutledge 1998; Williams 2001), incontrast with most warm-season thunderstorms thatproduce predominantly negative CG lightning (~90%of all warm-season CGs are negative; Orville 1994;Orville and Silver 1997; Orville and Huffines 2001).In fact, the percentage of CG lightning that is posi-tive in these storms [predominantly positive CG(PPCG) storms] can be far greater than 50%, some-times approaching 100%. Many PPCG storms aresevere, but not all severe storms are PPCG (Carey andRutledge 2003; Carey et al. 2003), and we currentlydo not understand what exactly distinguishes PPCGstorms from other storms.
Researchers typically observe two major positivecharge regions within the updrafts of ordinary thun-derstorms, an upper one (above the –20∞C isothermaltitude; the main reservoir for positive charge) anda lower one (near 0∞C altitude), with a major nega-tive charge region (thought to be the source regionfor most –CGs) in between (i.e., between –10∞ and–20∞C altitude; e.g., Krehbiel 1986; Koshak andKrider 1989; Stolzenburg et al. 1998a,b). This typicalstructure is often thought of as a dipole (main upperpositive charge over midlevel negative) or tripole(considering the commonly observed lower positivecharge; Williams 1989), although thunderstormcharge structures can be more complex than a simpledipole or tripole, particularly outside the main updraft(Stolzenburg 1998a,b). However, PPCG storms maynot have typical electrical structures. Indeed, out-standing issues in +CG research include identifyingthe positive charge region that is the source for +CGs,and in addition, understanding if, how, and why thecharge structures in PPCG storms differ from ordi-nary thunderstorms. Williams (2001) reviewed hy-potheses for positive CG storms, and testing thesehypotheses requires more information on relation-ships between precipitation formation, airflow kine-matics, electrification, and lightning production inPPCG thunderstorms.
The ability to understand these relationships, how-ever, requires sophisticated tools to observe and ana-lyze thunderstorm characteristics. In particular, forprecipitation, research with polarimetric radars hasled to an emerging capability for identifying hydrom-eteor types remotely (Vivekandan et al. 1999; Liu andChandrasekar 2000; Straka et al. 2000). Such work
began with efforts to discriminate between hail andrain, but as these radars became more sophisticated,the number of observed variables and thus the num-ber of potential discriminants increased. Some algo-rithms distinguish between such diverse hydrometeortypes as large and small hail, graupel, snow, andmixed-phase precipitation. Hydrometeor identifica-tion can be useful in various applications to weatherforecasting and aviation weather warnings, as well asin fundamental studies of storm structure and evolu-tion. However, like all remote sensing techniques, po-larimetric hydrometeor classification needs in situ veri-fication to establish and improve the scope of its validity.
During May–July 2000, the Severe ThunderstormElectrification and Precipitation Study (STEPS;Weisman and Miller 2000; http://box.mmm.ucar.edu/pdas/STEPS.html) took place near the Colorado–Kansas border in order to achieve a better under-standing of the interactions between kinematics, pre-cipitation production, and electrification in severethunderstorms. Specific scientific objectives included1) understanding the apparent major differences inprecipitation output from supercells that have led totheir being classified as LP, MP, and HP; 2) under-standing lightning occurrence and behavior in storms,and how it differs among storm types, particularly tobetter understand the mechanisms by which stormsproduce predominantly +CG lightning; and 3) veri-fying and improving microphysical interpretationsfrom polarimetric radar. Additionally, the emphasison +CG lightning enabled research into what is dif-ferent about the small subset of +CGs, usually fromlarge thunderstorms known as mesoscale convectivesystems (MCSs), that trigger mesospheric transientluminous events (TLEs) such as sprites (Lyons et al.2000, 2003a,b; Williams 1998). This latter problemhas important implications for our understanding ofhow TLEs occur.
This paper is intended to be an overview of theSTEPS field campaign and in addition provides a briefexamination of STEPS research in order to demon-strate how the design and execution of the field cam-paign helped address the project goals. Because oflength constraints, this paper mainly, though not ex-clusively, focuses on the positive CG issue (STEPSgoal no. 2) in discussing the STEPS project.
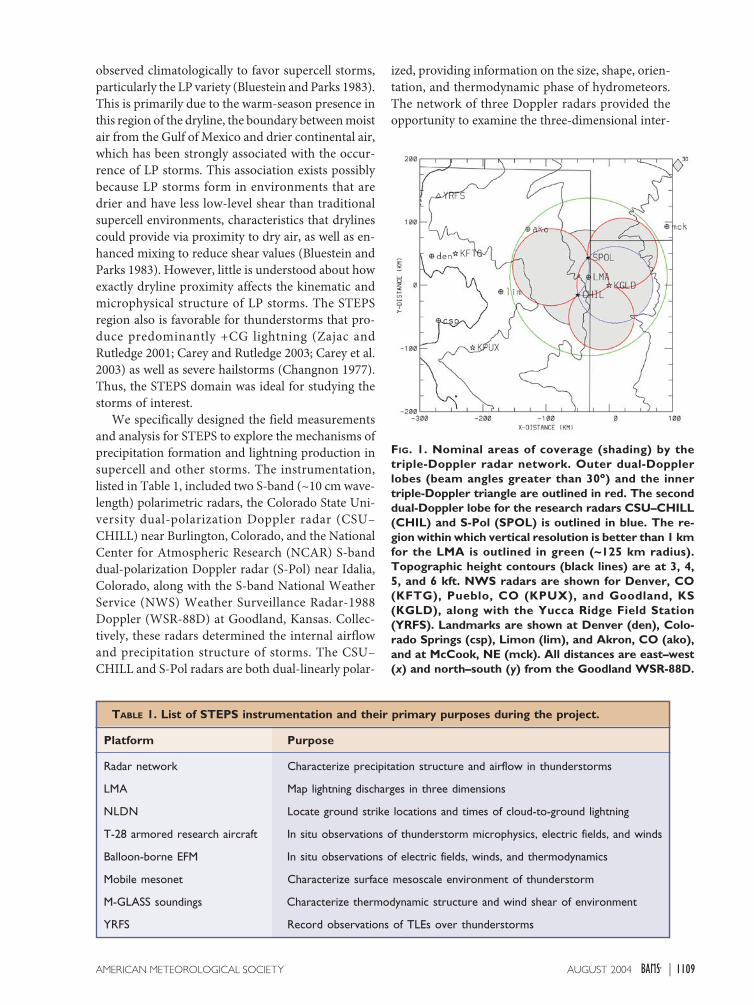
STEPS DESIGN AND EXECUTION. TheSTEPS project brought together a unique suite ofcomplementary observing platforms in eastern Colo-rado and western Kansas. The basic geographical lay-out of the project is shown in Fig. 1. This portion ofthe High Plains region of the United States has been
1109AUGUST 2004AMERICAN METEOROLOGICAL SOCIETY |
observed climatologically to favor supercell storms,particularly the LP variety (Bluestein and Parks 1983).This is primarily due to the warm-season presence inthis region of the dryline, the boundary between moistair from the Gulf of Mexico and drier continental air,which has been strongly associated with the occur-rence of LP storms. This association exists possiblybecause LP storms form in environments that aredrier and have less low-level shear than traditionalsupercell environments, characteristics that drylinescould provide via proximity to dry air, as well as en-hanced mixing to reduce shear values (Bluestein andParks 1983). However, little is understood about howexactly dryline proximity affects the kinematic andmicrophysical structure of LP storms. The STEPSregion also is favorable for thunderstorms that pro-duce predominantly +CG lightning (Zajac andRutledge 2001; Carey and Rutledge 2003; Carey et al.2003) as well as severe hailstorms (Changnon 1977).Thus, the STEPS domain was ideal for studying thestorms of interest.
We specifically designed the field measurementsand analysis for STEPS to explore the mechanisms ofprecipitation formation and lightning production insupercell and other storms. The instrumentation,listed in Table 1, included two S-band (~10 cm wave-length) polarimetric radars, the Colorado State Uni-versity dual-polarization Doppler radar (CSU–CHILL) near Burlington, Colorado, and the NationalCenter for Atmospheric Research (NCAR) S-banddual-polarization Doppler radar (S-Pol) near Idalia,Colorado, along with the S-band National WeatherService (NWS) Weather Surveillance Radar-1988Doppler (WSR-88D) at Goodland, Kansas. Collec-tively, these radars determined the internal airflowand precipitation structure of storms. The CSU–CHILL and S-Pol radars are both dual-linearly polar-
ized, providing information on the size, shape, orien-tation, and thermodynamic phase of hydrometeors.The network of three Doppler radars provided theopportunity to examine the three-dimensional inter-
FIG. 1. Nominal areas of coverage (shading) by thetriple-Doppler radar network. Outer dual-Dopplerlobes (beam angles greater than 30∞∞∞∞∞) and the innertriple-Doppler triangle are outlined in red. The seconddual-Doppler lobe for the research radars CSU–CHILL(CHIL) and S-Pol (SPOL) is outlined in blue. The re-gion within which vertical resolution is better than 1 kmfor the LMA is outlined in green (~125 km radius).Topographic height contours (black lines) are at 3, 4,5, and 6 kft. NWS radars are shown for Denver, CO(KFTG), Pueblo, CO (KPUX), and Goodland, KS(KGLD), along with the Yucca Ridge Field Station(YRFS). Landmarks are shown at Denver (den), Colo-rado Springs (csp), Limon (lim), and Akron, CO (ako),and at McCook, NE (mck). All distances are east–west(x) and north–south (y) from the Goodland WSR-88D.
Radar network Characterize precipitation structure and airflow in thunderstorms
LMA Map lightning discharges in three dimensions
NLDN Locate ground strike locations and times of cloud-to-ground lightning
T-28 armored research aircraft In situ observations of thunderstorm microphysics, electric fields, and winds
Balloon-borne EFM In situ observations of electric fields, winds, and thermodynamics
Mobile mesonet Characterize surface mesoscale environment of thunderstorm
M-GLASS soundings Characterize thermodynamic structure and wind shear of environment
YRFS Record observations of TLEs over thunderstorms
TABLE 1. List of STEPS instrumentation and their primary purposes during the project.
Platform Purpose
1110 AUGUST 2004|
nal airflow of STEPS storms, via postproject synthe-sis of the multiple-Doppler observations.
The deployable Lightning Mapping Array (LMA)from the New Mexico Institute of Mining and Tech-nology mapped the three-dimensional total lightningactivity. The system located the sources of impulsivevery high frequency (VHF) radio signals from thelightning by measuring the time that the signals ar-rived at the 13 receiving stations deployed over a 60–80-km-diameter area in northwestern Kansas andeastern Colorado. The LMA locates numerous VHFsources from the lightning activity, which can begrouped into individual flashes either manually usingspecial analysis software or through an automated al-gorithm such as that of Thomas et al. (2003), by con-sidering the spatial and temporal proximity of VHFsources to one another. The LMA is most sensitive toVHF radiation from negative breakdown occurringwithin regions of net positive charge (Mazur et al.1997; Rison et al. 1999). Thus, the LMA can be usedto identify major positive charge regions tapped bylightning based on analysis of VHF emission density.
The National Lightning Detection Network(NLDN) provided CG flash data. The NLDN consistsof a network of magnetic direction finder and timeof arrival sensors used to locate in space and timeground strike locations of CG lightning. Informationon CG polarity, peak current, and multiplicity also areavailable. The most recent NLDN upgrade, discussedin Cummins et al. (1998), gives greater than 90% de-tection efficiency and 0.5-km location accuracy withinthe STEPS domain.
The South Dakota School of Mines and Technol-ogy (SDSMT) armored T-28 aircraft provided in situwind, microphysical, electric field, and particle chargedata in the lower- to middle-altitude range within up-drafts and hail shafts. The T-28 measured the com-plete spectrum of water and ice particles in clouds,ranging from cloud droplets a few micrometers indiameter to about 5-cm-diameter hail. One of its threeprecipitation particle imaging probes had the capa-bility to determine particle charge as the particle isimaged (minimum sensitivity as low as 0.5 pC). Inaddition, it carried a six-instrument electric fieldmeter system that maps the total vector electric fieldinside and outside clouds.
Mobile sounding systems from the National Oce-anic and Atmospheric Administration/National Se-vere Storms Laboratory (NOAA/NSSL) obtained bal-loon-borne measurements of electric fields insidestorms [electric field meter (EFM) balloons]. Themain instrument was the balloon-borne EFM [origi-nally developed by Winn and Byerley (1975)] that
NSSL has improved and used for 15 yr. An overviewof this instrument is provided by MacGorman andRust (1998, their section 6.2.3). The electric field datayielded the full three-dimensional electric field vec-tor and can be used to infer layers of net negative orpositive charge (e.g., Stolzenburg and Marshall 1994).The mobile laboratory also contained standard surfacemeteorological sensors and a surface electric field meter.
NCAR mobile sounding systems [Mobile GPS/Lo-ran Atmospheric Sounding System (M-GLASS)] andNOAA/NSSL mobile mesonet vehicles characterizedthe storm environment. The mesonet vehicles, whichaugment existing meteorological networks, consistedof meteorological instruments mounted on standardautomobiles. They can provide accurate observationsof pressure, temperature, and relative humidity, aswell as wind direction and speed, whether the vehicleis moving or stationary. The M-GLASS systems weremounted on pickup trucks and made standard atmo-spheric sounding and surface measurements.
Finally, the Yucca Ridge Field Station (YRFS), lo-cated near Fort Collins, Colorado (275 km northwestof the LMA centroid; Fig. 1), provided observationsof TLEs during STEPS. The YRFS, operated by FMAResearch, made use of numerous on- and off-site in-struments, including radio frequency (RF), telescopic,and photometric sensors along with low-light imag-ers. Data from up to six extremely low frequency(ELF) sensors on four different continents providedadditional information on the parent lightning of TLEphenomena in the STEPS domain.
The combination of all of these observations pro-vided, along with an understanding of each storm’smesoscale environment, a depiction of the coevolv-ing kinematic, microphysical, and electrical structuresand lightning behavior of STEPS thunderstorms.Because of the detailed observing network, the STEPSdata provide a unique opportunity to answer keyquestions about precipitation formation and electri-fication within severe storms. Additionally, the pres-ence of two polarimetric radars and in situ observa-tions provided an opportunity to evaluate andimprove radar-based hydrometeor identification andquantification algorithms.
The operations center for STEPS was at the CSU–CHILL radar facility, temporarily relocated from itshome base at Greeley, Colorado, to Burlington, Colo-rado. Mobile facilities and STEPS personnel gener-ally were based out of Burlington and Goodland, Kan-sas. STEPS received significant support from the localNWS forecast office in Goodland (see sidebar 1), anddaily forecast and observational platform status brief-ings occurred each morning at this NWS facility.

1111AUGUST 2004AMERICAN METEOROLOGICAL SOCIETY |
Based on each briefing, we formulated operationsplans for the afternoon and evening. The researchradars (CSU–CHILL and S-Pol) typically were run-ning surveillance scans by noon. When convectionwas likely, M-GLASS soundings were released at vari-ous locations and vehicle platforms (mobile mesonet,EFM balloons) were deployed in strategic locationswhere we expected activity. Once we identified con-vective targets, the vehicles and T-28 aircraft werevectored to the storm via two-way radio communi-cations with the operations center. In addition, theresearch radars would begin synchronized sector-based plan position indicator (PPI) and RHI scans ofthe target storm.
The main focus of observations was storms that oc-curred within or passed through the dual-Dopplerlobes formed by each radar pair within the STEPSnetwork (see Fig. 1). Of these, the highest priority wassupercell storms, especially those with LP character-istics, as well as thunderstorms observed to be pro-ducing predominantly +CGs.
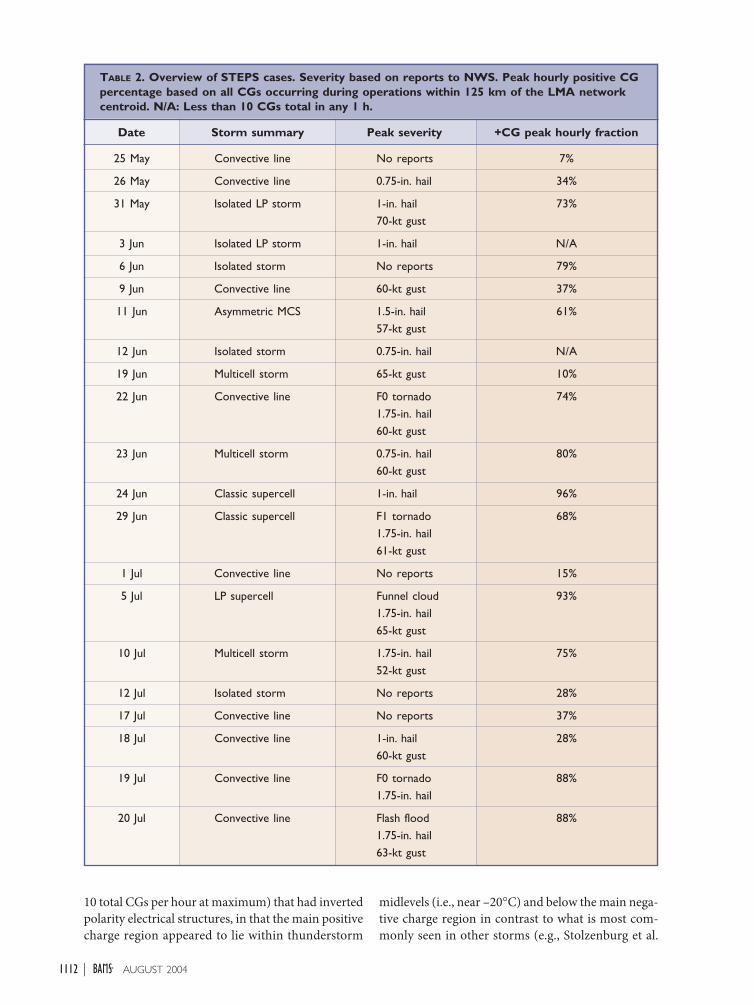
EXAMPLES OF STEPS OBSERVATIONS.Overview of STEPS cases. We were able to obtain dataon a number of different cases during STEPS. Table 2lists the major STEPS operations days, along with ashort description of the most interesting storms ofthose days, and the most extreme severe storm re-ports (if any) associated with those storms. In addi-
tion, Table 2 lists the peak hourly percentage withpositive polarity of all CGs that occurred within125 km of the LMA network centroid. This is usedas an indicator of positive CG production, as not allstorms have had their lightning data (both NLDNand LMA) analyzed in detail yet. Only cases that had10 or more CGs per hour at peak have percentagescomputed. Note that since STEPS instrumentationfocused on storms producing the most +CGs, thiscolumn in Table 2 tends to underestimate the maxi-mum percentage of +CGs in the target storm becauseof the potential inclusion of concurrent storms notproducing as many +CGs. Despite this limitation,Table 2 demonstrates that most of the STEPS casesproduced some sort of severe weather, and at leasthalf were associated with more than 50% +CGs atpeak (i.e., PPCG storms).
Indeed, it was the ubiquity of PPCG storms in thisarea that was one of the distinctive results of STEPS,in that the storms spanned vastly different organiza-tional categories, from small isolated convection tovarious types of large multicell storms, as well assupercells. Both storms with LP characteristics (de-termined visually; total of three cases—31 May,3 June, and 5 July) and non-LP storms exhibited thisflash behavior. While most +CG storms were associ-ated with severe weather, there was one PPCG case(6 June) that had no severe weather reports. In addi-tion, there were examples of low-CG storms (less than
The NWS office in Goodland, Kansaswas in a unique position to provide theSTEPS experiment with logisticalassistance, forecast personnel, localexpertise, and volunteer field-teamparticipants. Indeed, demonstration ofcooperation between the forecast andresearch communities was a goal of theexperiment. Preoperational phasesupport included assistance in facilityprocurement, sensor placement,climatological research, lodgingassistance, and building local communitysupport for the project. In addition,NWS personnel provided much of thelocal media support during STEPS,including arranging of the STEPS mediaday.
During the operational phase, theNWS office was the hub for planningand forecasting. Morning briefingsoccurred at the office through the useof both NWS computer resources and
COOPERATION BETWEEN RESEARCH AND FORECAST COMMUNITIESWeb-based NCAR model output.NWS short-term forecasters andproject investigators collaborated onforecast briefings. This allowed localexpertise to be integrated into theoperational decision process. LocalNOAA Weather Radio stationsdisseminated a daily briefing summary.
Twenty-five volunteers from sevenNWS offices participated in varioussupport positions. The roles of thesevolunteers ranged from projectnowcasters to field participants in themobile mesonet and EFM ballooningoperations. A two-way radio enhancedcommunications between the NWSoffice and the STEPS OperationsCenter (OC). NWS relayed fixedmesonet data, output from NWSanalysis software [such as the LocalAnalysis and Prediction System (LAPS)and the System for Convection
Analysis and Nowcasting (SCAN)], andsevere weather reports to the OCduring field operations.
The NWS benefited throughexposure to unique datasets in near–real time. Forecaster access to M-GLASS soundings, timely reports fromthe mobile mesonet, and Web-basedCSU–CHILL and NCAR S-Pol data allcontributed to an improved warningprogram. Interaction with STEPSresearchers, including seminarspresented by project investigators,allowed NWS staff to increase theirknowledge of convective processes andsevere convection forecasting. Theprocedures and lessons learned duringSTEPS provided a model for NWSparticipation in the Bow Echo andMesoscale Convective Vortex (MCV)Experiment (BAMEX) field project,which occurred in the summer of 2003.
1111AUGUST 2004AMERICAN METEOROLOGICAL SOCIETY |
1112 AUGUST 2004|
10 total CGs per hour at maximum) that had invertedpolarity electrical structures, in that the main positivecharge region appeared to lie within thunderstorm
midlevels (i.e., near –20∞C) and below the main nega-tive charge region in contrast to what is most com-monly seen in other storms (e.g., Stolzenburg et al.
25 May Convective line No reports 7%
26 May Convective line 0.75-in. hail 34%
31 May Isolated LP storm 1-in. hail 73%70-kt gust
3 Jun Isolated LP storm 1-in. hail N/A
6 Jun Isolated storm No reports 79%
9 Jun Convective line 60-kt gust 37%
11 Jun Asymmetric MCS 1.5-in. hail 61%57-kt gust
12 Jun Isolated storm 0.75-in. hail N/A
19 Jun Multicell storm 65-kt gust 10%
22 Jun Convective line F0 tornado 74%1.75-in. hail60-kt gust
23 Jun Multicell storm 0.75-in. hail 80%60-kt gust
24 Jun Classic supercell 1-in. hail 96%
29 Jun Classic supercell F1 tornado 68%1.75-in. hail61-kt gust
1 Jul Convective line No reports 15%
5 Jul LP supercell Funnel cloud 93%1.75-in. hail65-kt gust
10 Jul Multicell storm 1.75-in. hail 75%52-kt gust
12 Jul Isolated storm No reports 28%
17 Jul Convective line No reports 37%
18 Jul Convective line 1-in. hail 28%60-kt gust
19 Jul Convective line F0 tornado 88%1.75-in. hail
20 Jul Convective line Flash flood 88%1.75-in. hail63-kt gust
TABLE 2. Overview of STEPS cases. Severity based on reports to NWS. Peak hourly positive CGpercentage based on all CGs occurring during operations within 125 km of the LMA networkcentroid. N/A: Less than 10 CGs total in any 1 h.
Date Storm summary Peak severity +CG peak hourly fraction
1113AUGUST 2004AMERICAN METEOROLOGICAL SOCIETY |
1998a,b). The most prominent example was 3 June, asmall isolated storm with LP characteristics that pro-duced no CGs of either polarity but had a possiblyinverted electrical structure based on inferences froman EFM balloon sounding and LMA intracloud flashbehavior (Rust and MacGorman 2002; Hamlin et al.2003). Many of the PPCG storms also appeared tohave inverted polarity structures based on EFM andLMA data (Rust and MacGorman 2002; Hamlin et al.2003; Rust et al. 2003). Apart from the main cases re-viewed here, there were smaller storms with low to-tal flash rates (2–3 min-1) that exhibited inverted elec-trical behavior. One such storm, different from thesupercell on that day, occurred on 24 June. An inter-esting contrast to these PPCG and potentially invertedstorms is the severe multicell storm of 19 June, whichproduced at most 10% +CGs.
Based on Table 2, there are several case studies andcomparisons that can be done to address the goals ofthe STEPS project. Many of these are either under-way or planned. A main focus of STEPS wassupercells, and the project obtained data on three. Toillustrate how the STEPS suite of observing platformsworked together to accomplish project goals, we haveselected two supercell cases for short overviews: a clas-sic supercell that occurred on 29 June 2000, and anLP supercell that occurred on 5 July.
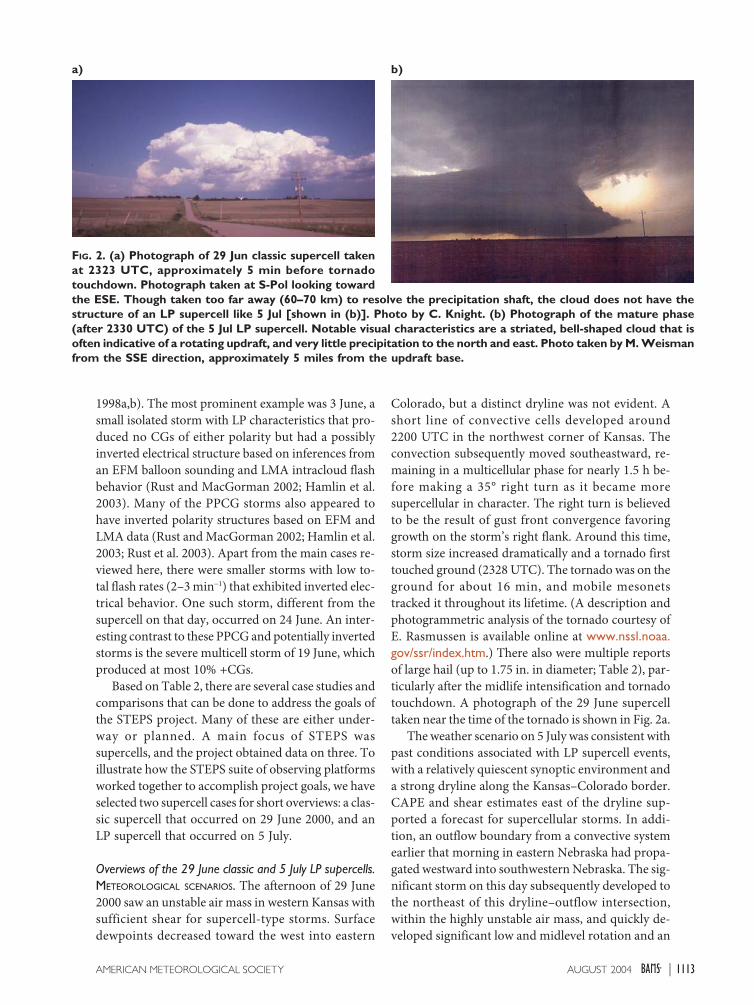
Overviews of the 29 June classic and 5 July LP supercells.METEOROLOGICAL SCENARIOS. The afternoon of 29 June2000 saw an unstable air mass in western Kansas withsufficient shear for supercell-type storms. Surfacedewpoints decreased toward the west into eastern
FIG. 2. (a) Photograph of 29 Jun classic supercell takenat 2323 UTC, approximately 5 min before tornadotouchdown. Photograph taken at S-Pol looking towardthe ESE. Though taken too far away (60–70 km) to resolve the precipitation shaft, the cloud does not have thestructure of an LP supercell like 5 Jul [shown in (b)]. Photo by C. Knight. (b) Photograph of the mature phase(after 2330 UTC) of the 5 Jul LP supercell. Notable visual characteristics are a striated, bell-shaped cloud that isoften indicative of a rotating updraft, and very little precipitation to the north and east. Photo taken by M. Weismanfrom the SSE direction, approximately 5 miles from the updraft base.
a) b)
Colorado, but a distinct dryline was not evident. Ashort line of convective cells developed around2200 UTC in the northwest corner of Kansas. Theconvection subsequently moved southeastward, re-maining in a multicellular phase for nearly 1.5 h be-fore making a 35° right turn as it became moresupercellular in character. The right turn is believedto be the result of gust front convergence favoringgrowth on the storm’s right flank. Around this time,storm size increased dramatically and a tornado firsttouched ground (2328 UTC). The tornado was on theground for about 16 min, and mobile mesonetstracked it throughout its lifetime. (A description andphotogrammetric analysis of the tornado courtesy ofE. Rasmussen is available online at www.nssl.noaa.gov/ssr/index.htm.) There also were multiple reportsof large hail (up to 1.75 in. in diameter; Table 2), par-ticularly after the midlife intensification and tornadotouchdown. A photograph of the 29 June supercelltaken near the time of the tornado is shown in Fig. 2a.
The weather scenario on 5 July was consistent withpast conditions associated with LP supercell events,with a relatively quiescent synoptic environment anda strong dryline along the Kansas–Colorado border.CAPE and shear estimates east of the dryline sup-ported a forecast for supercellular storms. In addi-tion, an outflow boundary from a convective systemearlier that morning in eastern Nebraska had propa-gated westward into southwestern Nebraska. The sig-nificant storm on this day subsequently developed tothe northeast of this dryline–outflow intersection,within the highly unstable air mass, and quickly de-veloped significant low and midlevel rotation and an
1114 AUGUST 2004|
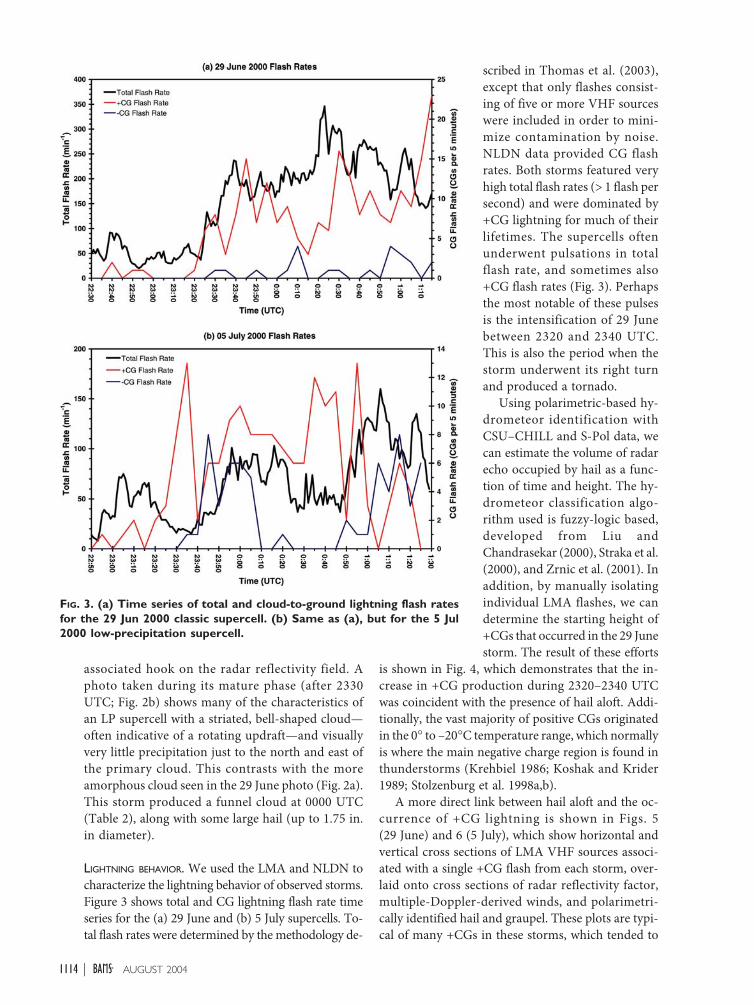
scribed in Thomas et al. (2003),except that only flashes consist-ing of five or more VHF sourceswere included in order to mini-mize contamination by noise.NLDN data provided CG flashrates. Both storms featured veryhigh total flash rates (> 1 flash persecond) and were dominated by+CG lightning for much of theirlifetimes. The supercells oftenunderwent pulsations in totalflash rate, and sometimes also+CG flash rates (Fig. 3). Perhapsthe most notable of these pulsesis the intensification of 29 Junebetween 2320 and 2340 UTC.This is also the period when thestorm underwent its right turnand produced a tornado.
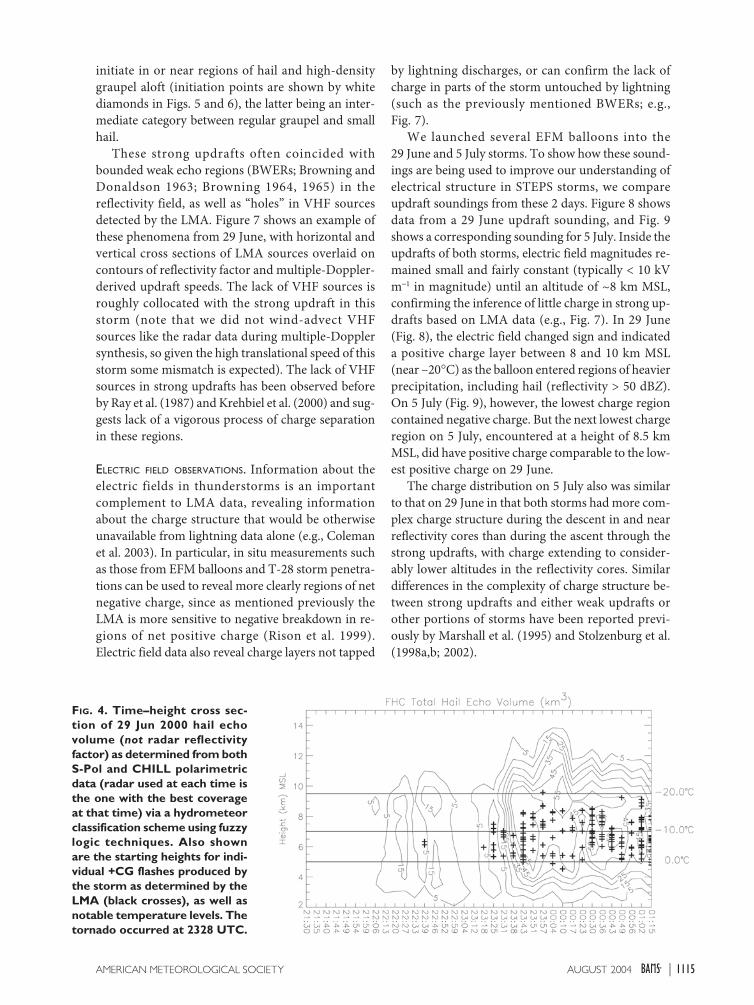
Using polarimetric-based hy-drometeor identification withCSU–CHILL and S-Pol data, wecan estimate the volume of radarecho occupied by hail as a func-tion of time and height. The hy-drometeor classification algo-rithm used is fuzzy-logic based,developed from Liu andChandrasekar (2000), Straka et al.(2000), and Zrnic et al. (2001). Inaddition, by manually isolatingindividual LMA flashes, we candetermine the starting height of+CGs that occurred in the 29 Junestorm. The result of these efforts
is shown in Fig. 4, which demonstrates that the in-crease in +CG production during 2320–2340 UTCwas coincident with the presence of hail aloft. Addi-tionally, the vast majority of positive CGs originatedin the 0∞ to –20∞C temperature range, which normallyis where the main negative charge region is found inthunderstorms (Krehbiel 1986; Koshak and Krider1989; Stolzenburg et al. 1998a,b).
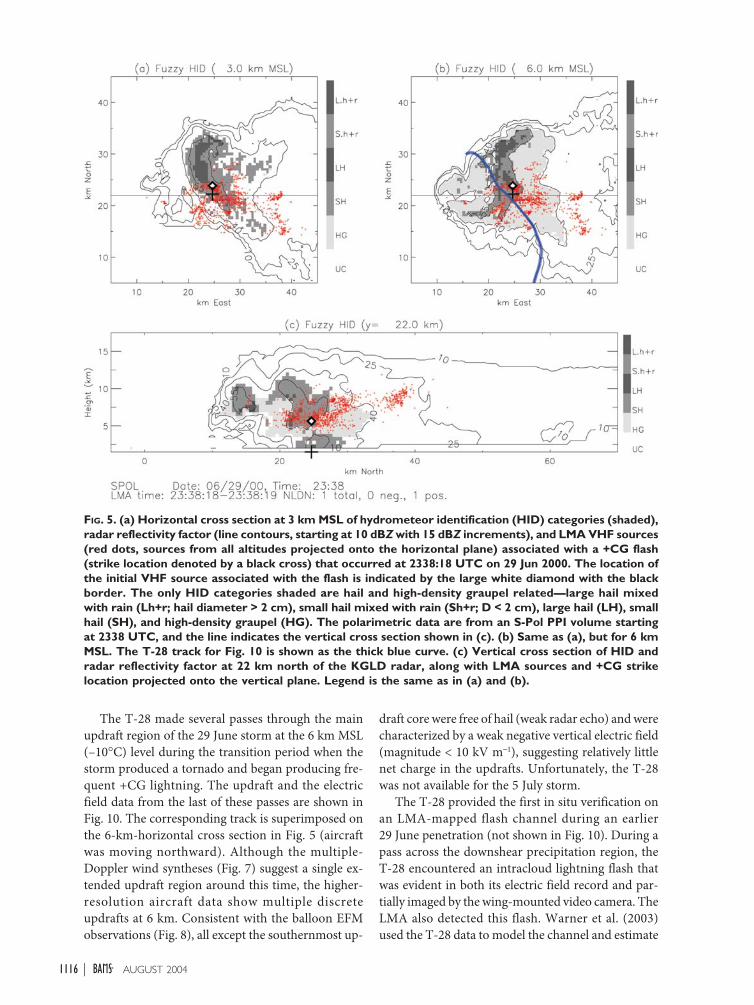
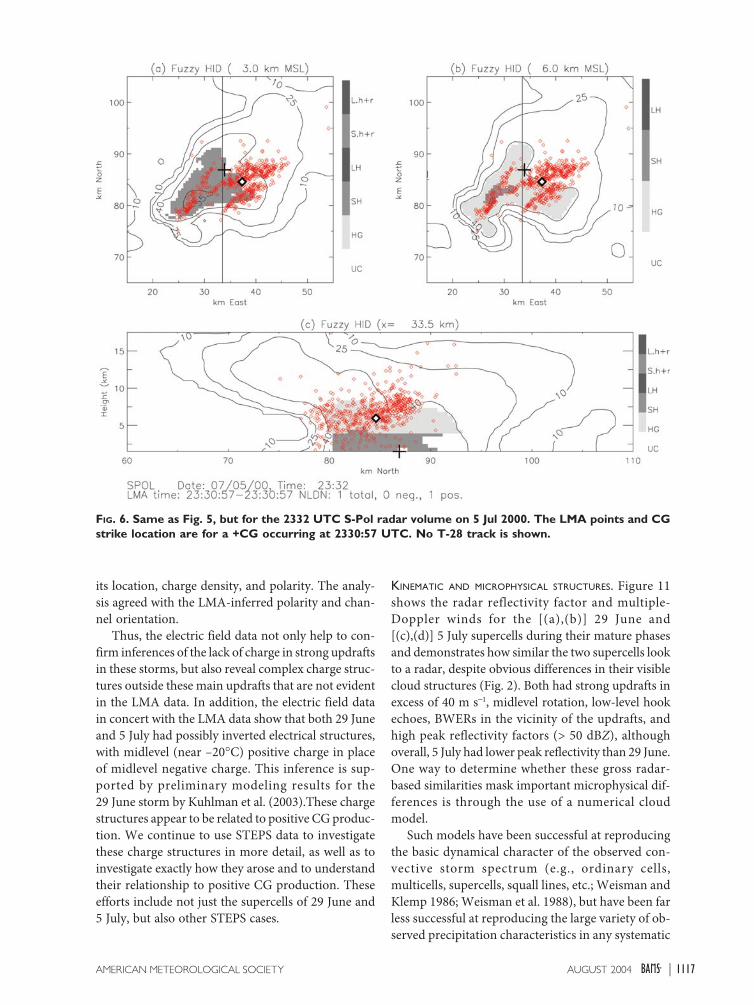
A more direct link between hail aloft and the oc-currence of +CG lightning is shown in Figs. 5(29 June) and 6 (5 July), which show horizontal andvertical cross sections of LMA VHF sources associ-ated with a single +CG flash from each storm, over-laid onto cross sections of radar reflectivity factor,multiple-Doppler-derived winds, and polarimetri-cally identified hail and graupel. These plots are typi-cal of many +CGs in these storms, which tended to
FIG. 3. (a) Time series of total and cloud-to-ground lightning flash ratesfor the 29 Jun 2000 classic supercell. (b) Same as (a), but for the 5 Jul2000 low-precipitation supercell.
associated hook on the radar reflectivity field. Aphoto taken during its mature phase (after 2330UTC; Fig. 2b) shows many of the characteristics ofan LP supercell with a striated, bell-shaped cloud—often indicative of a rotating updraft—and visuallyvery little precipitation just to the north and east ofthe primary cloud. This contrasts with the moreamorphous cloud seen in the 29 June photo (Fig. 2a).This storm produced a funnel cloud at 0000 UTC(Table 2), along with some large hail (up to 1.75 in.in diameter).
LIGHTNING BEHAVIOR. We used the LMA and NLDN tocharacterize the lightning behavior of observed storms.Figure 3 shows total and CG lightning flash rate timeseries for the (a) 29 June and (b) 5 July supercells. To-tal flash rates were determined by the methodology de-
1115AUGUST 2004AMERICAN METEOROLOGICAL SOCIETY |
initiate in or near regions of hail and high-densitygraupel aloft (initiation points are shown by whitediamonds in Figs. 5 and 6), the latter being an inter-mediate category between regular graupel and smallhail.
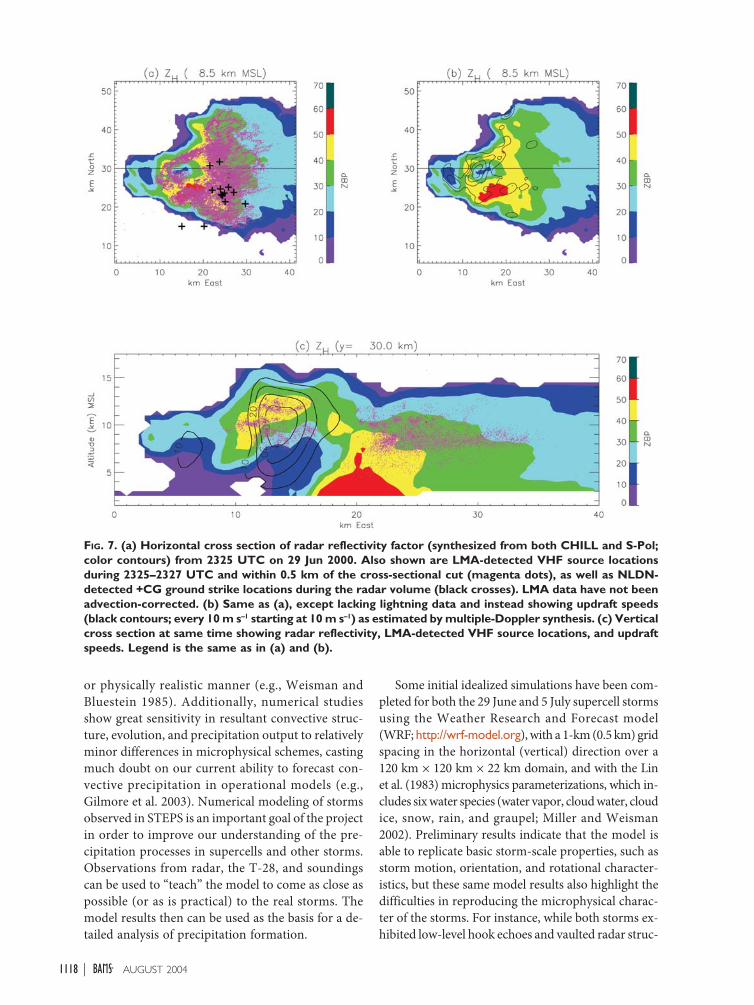
These strong updrafts often coincided withbounded weak echo regions (BWERs; Browning andDonaldson 1963; Browning 1964, 1965) in thereflectivity field, as well as “holes” in VHF sourcesdetected by the LMA. Figure 7 shows an example ofthese phenomena from 29 June, with horizontal andvertical cross sections of LMA sources overlaid oncontours of reflectivity factor and multiple-Doppler-derived updraft speeds. The lack of VHF sources isroughly collocated with the strong updraft in thisstorm (note that we did not wind-advect VHFsources like the radar data during multiple-Dopplersynthesis, so given the high translational speed of thisstorm some mismatch is expected). The lack of VHFsources in strong updrafts has been observed beforeby Ray et al. (1987) and Krehbiel et al. (2000) and sug-gests lack of a vigorous process of charge separationin these regions.
ELECTRIC FIELD OBSERVATIONS. Information about theelectric fields in thunderstorms is an importantcomplement to LMA data, revealing informationabout the charge structure that would be otherwiseunavailable from lightning data alone (e.g., Colemanet al. 2003). In particular, in situ measurements suchas those from EFM balloons and T-28 storm penetra-tions can be used to reveal more clearly regions of netnegative charge, since as mentioned previously theLMA is more sensitive to negative breakdown in re-gions of net positive charge (Rison et al. 1999).Electric field data also reveal charge layers not tapped
by lightning discharges, or can confirm the lack ofcharge in parts of the storm untouched by lightning(such as the previously mentioned BWERs; e.g.,Fig. 7).
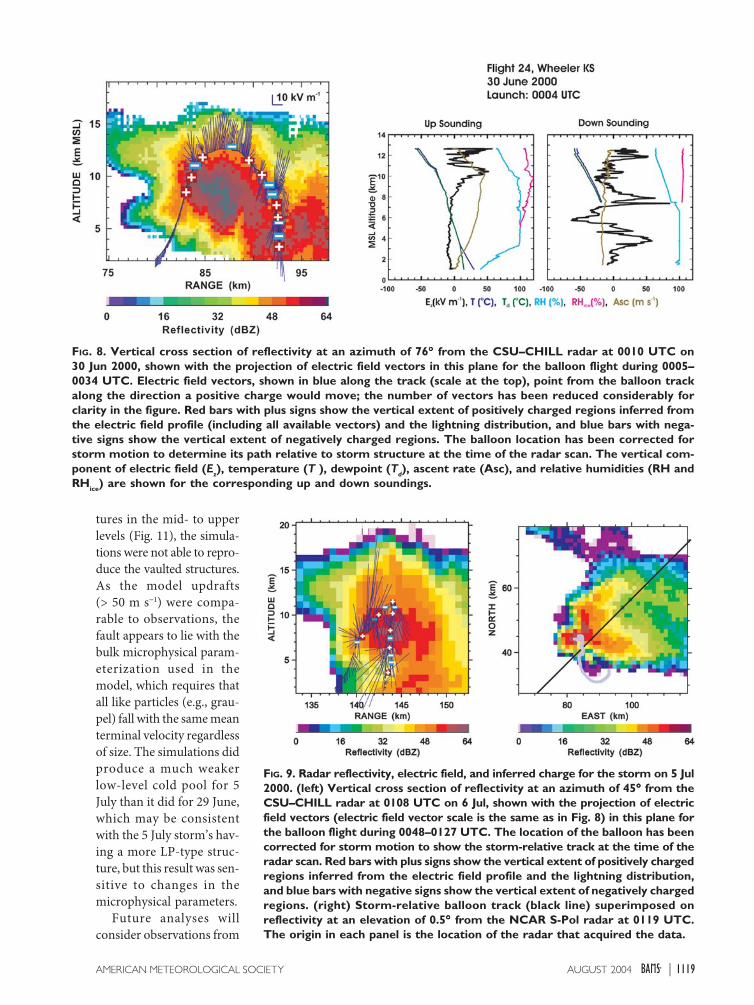
We launched several EFM balloons into the29 June and 5 July storms. To show how these sound-ings are being used to improve our understanding ofelectrical structure in STEPS storms, we compareupdraft soundings from these 2 days. Figure 8 showsdata from a 29 June updraft sounding, and Fig. 9shows a corresponding sounding for 5 July. Inside theupdrafts of both storms, electric field magnitudes re-mained small and fairly constant (typically < 10 kVm-1 in magnitude) until an altitude of ~8 km MSL,confirming the inference of little charge in strong up-drafts based on LMA data (e.g., Fig. 7). In 29 June(Fig. 8), the electric field changed sign and indicateda positive charge layer between 8 and 10 km MSL(near –20∞C) as the balloon entered regions of heavierprecipitation, including hail (reflectivity > 50 dBZ).On 5 July (Fig. 9), however, the lowest charge regioncontained negative charge. But the next lowest chargeregion on 5 July, encountered at a height of 8.5 kmMSL, did have positive charge comparable to the low-est positive charge on 29 June.
The charge distribution on 5 July also was similarto that on 29 June in that both storms had more com-plex charge structure during the descent in and nearreflectivity cores than during the ascent through thestrong updrafts, with charge extending to consider-ably lower altitudes in the reflectivity cores. Similardifferences in the complexity of charge structure be-tween strong updrafts and either weak updrafts orother portions of storms have been reported previ-ously by Marshall et al. (1995) and Stolzenburg et al.(1998a,b; 2002).
FIG. 4. Time–height cross sec-tion of 29 Jun 2000 hail echovolume (not radar reflectivityfactor) as determined from bothS-Pol and CHILL polarimetricdata (radar used at each time isthe one with the best coverageat that time) via a hydrometeorclassification scheme using fuzzylogic techniques. Also shownare the starting heights for indi-vidual +CG flashes produced bythe storm as determined by theLMA (black crosses), as well asnotable temperature levels. Thetornado occurred at 2328 UTC.
1116 AUGUST 2004|
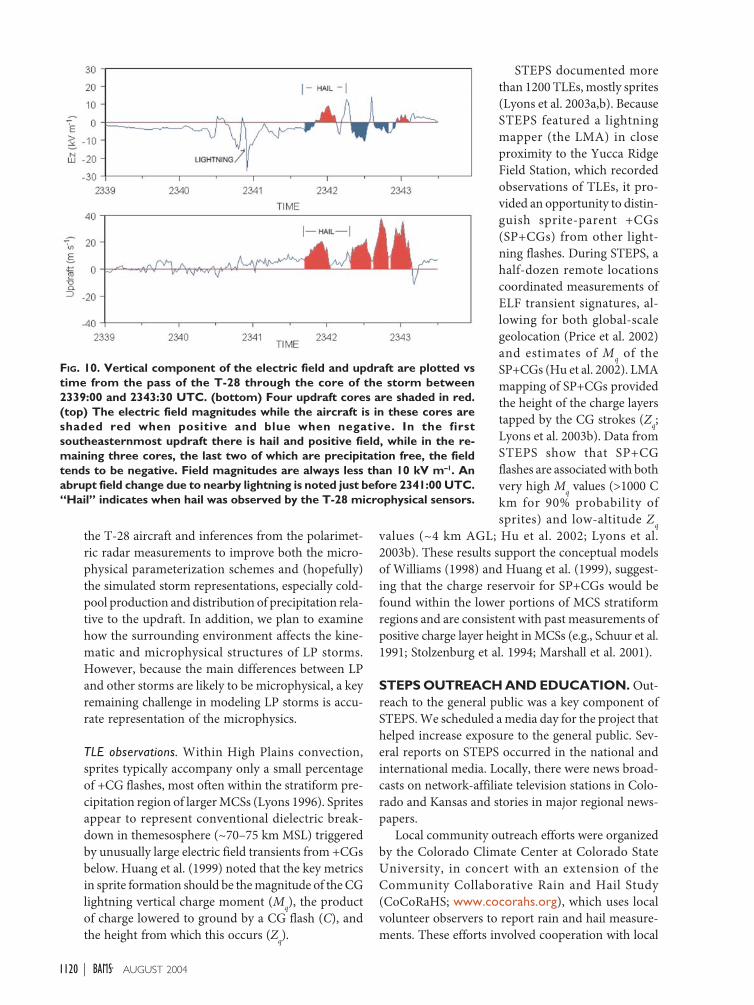
The T-28 made several passes through the mainupdraft region of the 29 June storm at the 6 km MSL(–10∞C) level during the transition period when thestorm produced a tornado and began producing fre-quent +CG lightning. The updraft and the electricfield data from the last of these passes are shown inFig. 10. The corresponding track is superimposed onthe 6-km-horizontal cross section in Fig. 5 (aircraftwas moving northward). Although the multiple-Doppler wind syntheses (Fig. 7) suggest a single ex-tended updraft region around this time, the higher-resolution aircraft data show multiple discreteupdrafts at 6 km. Consistent with the balloon EFMobservations (Fig. 8), all except the southernmost up-
draft core were free of hail (weak radar echo) and werecharacterized by a weak negative vertical electric field(magnitude < 10 kV m-1), suggesting relatively littlenet charge in the updrafts. Unfortunately, the T-28was not available for the 5 July storm.
The T-28 provided the first in situ verification onan LMA-mapped flash channel during an earlier29 June penetration (not shown in Fig. 10). During apass across the downshear precipitation region, theT-28 encountered an intracloud lightning flash thatwas evident in both its electric field record and par-tially imaged by the wing-mounted video camera. TheLMA also detected this flash. Warner et al. (2003)used the T-28 data to model the channel and estimate
FIG. 5. (a) Horizontal cross section at 3 km MSL of hydrometeor identification (HID) categories (shaded),radar reflectivity factor (line contours, starting at 10 dBZ with 15 dBZ increments), and LMA VHF sources(red dots, sources from all altitudes projected onto the horizontal plane) associated with a +CG flash(strike location denoted by a black cross) that occurred at 2338:18 UTC on 29 Jun 2000. The location ofthe initial VHF source associated with the flash is indicated by the large white diamond with the blackborder. The only HID categories shaded are hail and high-density graupel related—large hail mixedwith rain (Lh+r; hail diameter > 2 cm), small hail mixed with rain (Sh+r; D < 2 cm), large hail (LH), smallhail (SH), and high-density graupel (HG). The polarimetric data are from an S-Pol PPI volume startingat 2338 UTC, and the line indicates the vertical cross section shown in (c). (b) Same as (a), but for 6 kmMSL. The T-28 track for Fig. 10 is shown as the thick blue curve. (c) Vertical cross section of HID andradar reflectivity factor at 22 km north of the KGLD radar, along with LMA sources and +CG strikelocation projected onto the vertical plane. Legend is the same as in (a) and (b).
1117AUGUST 2004AMERICAN METEOROLOGICAL SOCIETY |
FIG. 6. Same as Fig. 5, but for the 2332 UTC S-Pol radar volume on 5 Jul 2000. The LMA points and CGstrike location are for a +CG occurring at 2330:57 UTC. No T-28 track is shown.
its location, charge density, and polarity. The analy-sis agreed with the LMA-inferred polarity and chan-nel orientation.
Thus, the electric field data not only help to con-firm inferences of the lack of charge in strong updraftsin these storms, but also reveal complex charge struc-tures outside these main updrafts that are not evidentin the LMA data. In addition, the electric field datain concert with the LMA data show that both 29 Juneand 5 July had possibly inverted electrical structures,with midlevel (near –20∞C) positive charge in placeof midlevel negative charge. This inference is sup-ported by preliminary modeling results for the29 June storm by Kuhlman et al. (2003).These chargestructures appear to be related to positive CG produc-tion. We continue to use STEPS data to investigatethese charge structures in more detail, as well as toinvestigate exactly how they arose and to understandtheir relationship to positive CG production. Theseefforts include not just the supercells of 29 June and5 July, but also other STEPS cases.
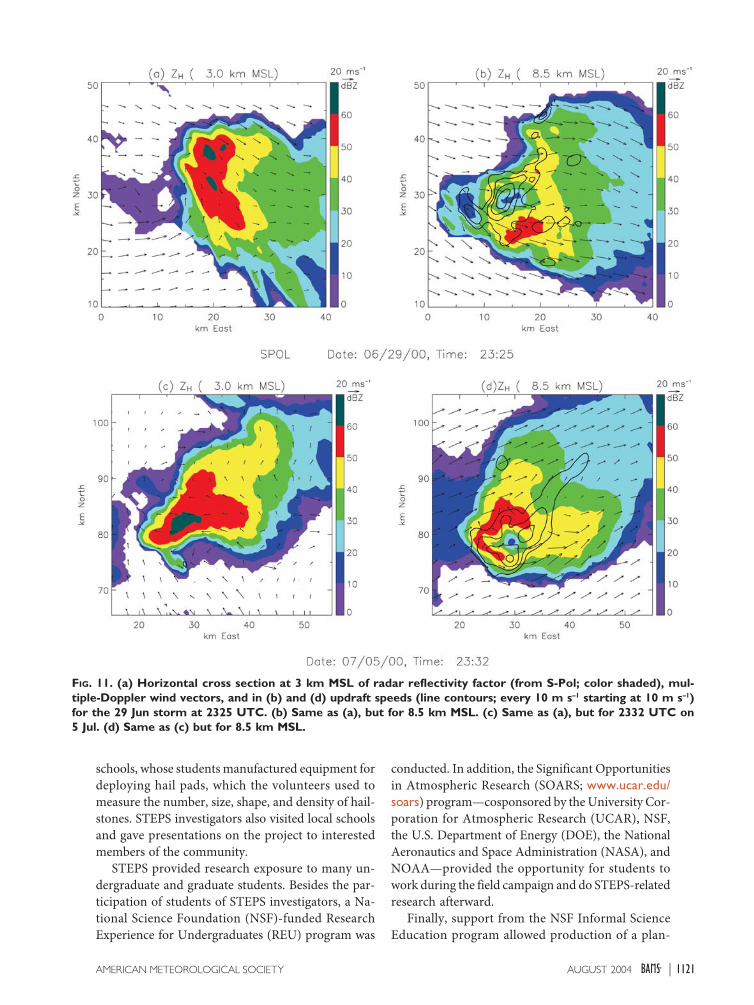
KINEMATIC AND MICROPHYSICAL STRUCTURES. Figure 11shows the radar reflectivity factor and multiple-Doppler winds for the [(a),(b)] 29 June and[(c),(d)] 5 July supercells during their mature phasesand demonstrates how similar the two supercells lookto a radar, despite obvious differences in their visiblecloud structures (Fig. 2). Both had strong updrafts inexcess of 40 m s-1, midlevel rotation, low-level hookechoes, BWERs in the vicinity of the updrafts, andhigh peak reflectivity factors (> 50 dBZ), althoughoverall, 5 July had lower peak reflectivity than 29 June.One way to determine whether these gross radar-based similarities mask important microphysical dif-ferences is through the use of a numerical cloudmodel.
Such models have been successful at reproducingthe basic dynamical character of the observed con-vective storm spectrum (e.g., ordinary cells,multicells, supercells, squall lines, etc.; Weisman andKlemp 1986; Weisman et al. 1988), but have been farless successful at reproducing the large variety of ob-served precipitation characteristics in any systematic
1118 AUGUST 2004|
Some initial idealized simulations have been com-pleted for both the 29 June and 5 July supercell stormsusing the Weather Research and Forecast model(WRF; http://wrf-model.org), with a 1-km (0.5 km) gridspacing in the horizontal (vertical) direction over a120 km × 120 km × 22 km domain, and with the Linet al. (1983) microphysics parameterizations, which in-cludes six water species (water vapor, cloud water, cloudice, snow, rain, and graupel; Miller and Weisman2002). Preliminary results indicate that the model isable to replicate basic storm-scale properties, such asstorm motion, orientation, and rotational character-istics, but these same model results also highlight thedifficulties in reproducing the microphysical charac-ter of the storms. For instance, while both storms ex-hibited low-level hook echoes and vaulted radar struc-
FIG. 7. (a) Horizontal cross section of radar reflectivity factor (synthesized from both CHILL and S-Pol;color contours) from 2325 UTC on 29 Jun 2000. Also shown are LMA-detected VHF source locationsduring 2325–2327 UTC and within 0.5 km of the cross-sectional cut (magenta dots), as well as NLDN-detected +CG ground strike locations during the radar volume (black crosses). LMA data have not beenadvection-corrected. (b) Same as (a), except lacking lightning data and instead showing updraft speeds(black contours; every 10 m s–1 starting at 10 m s–1) as estimated by multiple-Doppler synthesis. (c) Verticalcross section at same time showing radar reflectivity, LMA-detected VHF source locations, and updraftspeeds. Legend is the same as in (a) and (b).
or physically realistic manner (e.g., Weisman andBluestein 1985). Additionally, numerical studiesshow great sensitivity in resultant convective struc-ture, evolution, and precipitation output to relativelyminor differences in microphysical schemes, castingmuch doubt on our current ability to forecast con-vective precipitation in operational models (e.g.,Gilmore et al. 2003). Numerical modeling of stormsobserved in STEPS is an important goal of the projectin order to improve our understanding of the pre-cipitation processes in supercells and other storms.Observations from radar, the T-28, and soundingscan be used to “teach” the model to come as close aspossible (or as is practical) to the real storms. Themodel results then can be used as the basis for a de-tailed analysis of precipitation formation.
1119AUGUST 2004AMERICAN METEOROLOGICAL SOCIETY |
tures in the mid- to upperlevels (Fig. 11), the simula-tions were not able to repro-duce the vaulted structures.As the model updrafts(> 50 m s-1) were compa-rable to observations, thefault appears to lie with thebulk microphysical param-eterization used in themodel, which requires thatall like particles (e.g., grau-pel) fall with the same meanterminal velocity regardlessof size. The simulations didproduce a much weakerlow-level cold pool for 5July than it did for 29 June,which may be consistentwith the 5 July storm’s hav-ing a more LP-type struc-ture, but this result was sen-sitive to changes in themicrophysical parameters.
Future analyses willconsider observations from
FIG. 8. Vertical cross section of reflectivity at an azimuth of 76∞∞∞∞∞ from the CSU–CHILL radar at 0010 UTC on30 Jun 2000, shown with the projection of electric field vectors in this plane for the balloon flight during 0005–0034 UTC. Electric field vectors, shown in blue along the track (scale at the top), point from the balloon trackalong the direction a positive charge would move; the number of vectors has been reduced considerably forclarity in the figure. Red bars with plus signs show the vertical extent of positively charged regions inferred fromthe electric field profile (including all available vectors) and the lightning distribution, and blue bars with nega-tive signs show the vertical extent of negatively charged regions. The balloon location has been corrected forstorm motion to determine its path relative to storm structure at the time of the radar scan. The vertical com-ponent of electric field (Ez), temperature (T ), dewpoint (Td), ascent rate (Asc), and relative humidities (RH andRHice) are shown for the corresponding up and down soundings.
FIG. 9. Radar reflectivity, electric field, and inferred charge for the storm on 5 Jul2000. (left) Vertical cross section of reflectivity at an azimuth of 45∞∞∞∞∞ from theCSU–CHILL radar at 0108 UTC on 6 Jul, shown with the projection of electricfield vectors (electric field vector scale is the same as in Fig. 8) in this plane forthe balloon flight during 0048–0127 UTC. The location of the balloon has beencorrected for storm motion to show the storm-relative track at the time of theradar scan. Red bars with plus signs show the vertical extent of positively chargedregions inferred from the electric field profile and the lightning distribution,and blue bars with negative signs show the vertical extent of negatively chargedregions. (right) Storm-relative balloon track (black line) superimposed onreflectivity at an elevation of 0.5∞∞∞∞∞ from the NCAR S-Pol radar at 0119 UTC.The origin in each panel is the location of the radar that acquired the data.
1120 AUGUST 2004|
the T-28 aircraft and inferences from the polarimet-ric radar measurements to improve both the micro-physical parameterization schemes and (hopefully)the simulated storm representations, especially cold-pool production and distribution of precipitation rela-tive to the updraft. In addition, we plan to examinehow the surrounding environment affects the kine-matic and microphysical structures of LP storms.However, because the main differences between LPand other storms are likely to be microphysical, a keyremaining challenge in modeling LP storms is accu-rate representation of the microphysics.
TLE observations. Within High Plains convection,sprites typically accompany only a small percentageof +CG flashes, most often within the stratiform pre-cipitation region of larger MCSs (Lyons 1996). Spritesappear to represent conventional dielectric break-down in themesosphere (~70–75 km MSL) triggeredby unusually large electric field transients from +CGsbelow. Huang et al. (1999) noted that the key metricsin sprite formation should be the magnitude of the CGlightning vertical charge moment (Mq), the productof charge lowered to ground by a CG flash (C), andthe height from which this occurs (Zq).
STEPS documented morethan 1200 TLEs, mostly sprites(Lyons et al. 2003a,b). BecauseSTEPS featured a lightningmapper (the LMA) in closeproximity to the Yucca RidgeField Station, which recordedobservations of TLEs, it pro-vided an opportunity to distin-guish sprite-parent +CGs(SP+CGs) from other light-ning flashes. During STEPS, ahalf-dozen remote locationscoordinated measurements ofELF transient signatures, al-lowing for both global-scalegeolocation (Price et al. 2002)and estimates of Mq of theSP+CGs (Hu et al. 2002). LMAmapping of SP+CGs providedthe height of the charge layerstapped by the CG strokes (Zq;Lyons et al. 2003b). Data fromSTEPS show that SP+CGflashes are associated with bothvery high Mq values (>1000 Ckm for 90% probability ofsprites) and low-altitude Zq
values (~4 km AGL; Hu et al. 2002; Lyons et al.2003b). These results support the conceptual modelsof Williams (1998) and Huang et al. (1999), suggest-ing that the charge reservoir for SP+CGs would befound within the lower portions of MCS stratiformregions and are consistent with past measurements ofpositive charge layer height in MCSs (e.g., Schuur et al.1991; Stolzenburg et al. 1994; Marshall et al. 2001).
STEPS OUTREACH AND EDUCATION. Out-reach to the general public was a key component ofSTEPS. We scheduled a media day for the project thathelped increase exposure to the general public. Sev-eral reports on STEPS occurred in the national andinternational media. Locally, there were news broad-casts on network-affiliate television stations in Colo-rado and Kansas and stories in major regional news-papers.
Local community outreach efforts were organizedby the Colorado Climate Center at Colorado StateUniversity, in concert with an extension of theCommunity Collaborative Rain and Hail Study(CoCoRaHS; www.cocorahs.org), which uses localvolunteer observers to report rain and hail measure-ments. These efforts involved cooperation with local
FIG. 10. Vertical component of the electric field and updraft are plotted vstime from the pass of the T-28 through the core of the storm between2339:00 and 2343:30 UTC. (bottom) Four updraft cores are shaded in red.(top) The electric field magnitudes while the aircraft is in these cores areshaded red when positive and blue when negative. In the firstsoutheasternmost updraft there is hail and positive field, while in the re-maining three cores, the last two of which are precipitation free, the fieldtends to be negative. Field magnitudes are always less than 10 kV m–1. Anabrupt field change due to nearby lightning is noted just before 2341:00 UTC.“Hail” indicates when hail was observed by the T-28 microphysical sensors.
1121AUGUST 2004AMERICAN METEOROLOGICAL SOCIETY |
schools, whose students manufactured equipment fordeploying hail pads, which the volunteers used tomeasure the number, size, shape, and density of hail-stones. STEPS investigators also visited local schoolsand gave presentations on the project to interestedmembers of the community.
STEPS provided research exposure to many un-dergraduate and graduate students. Besides the par-ticipation of students of STEPS investigators, a Na-tional Science Foundation (NSF)-funded ResearchExperience for Undergraduates (REU) program was
conducted. In addition, the Significant Opportunitiesin Atmospheric Research (SOARS; www.ucar.edu/soars) program—cosponsored by the University Cor-poration for Atmospheric Research (UCAR), NSF,the U.S. Department of Energy (DOE), the NationalAeronautics and Space Administration (NASA), andNOAA—provided the opportunity for students towork during the field campaign and do STEPS-relatedresearch afterward.
Finally, support from the NSF Informal ScienceEducation program allowed production of a plan-
FIG. 11. (a) Horizontal cross section at 3 km MSL of radar reflectivity factor (from S-Pol; color shaded), mul-tiple-Doppler wind vectors, and in (b) and (d) updraft speeds (line contours; every 10 m s–1 starting at 10 m s–1)for the 29 Jun storm at 2325 UTC. (b) Same as (a), but for 8.5 km MSL. (c) Same as (a), but for 2332 UTC on5 Jul. (d) Same as (c) but for 8.5 km MSL.
1122 AUGUST 2004|
etarium program and home/classroom video, TheHundred Year Hunt for the Red Sprite, featuring therole of STEPS research in determining the atypicalnature of the sprite-parent lightning discharges (seewww.Sky-Fire.TV for details).
CONCLUDING REMARKS. The STEPS projecthas provided the research community with observa-tions of the evolving kinematic, microphysical, andelectrical structures of a diverse array of thunder-storms, including the primary targets of the experi-ment: supercells and predominantly positive CG(PPCG) storms. The project also provided both po-larimetric and in situ microphysical data to help im-prove polarimetric radar–based hydrometeor classi-fication and quantification schemes, as well as anopportunity to study the reasons transient luminousevents (TLEs) occur above thunderstorms.
The cooperation between the NWS and atmo-spheric research communities, as well as outreach tothe general public, were major goals of STEPS. Thesetwo activities are increasingly identified as major fac-tors in a field project’s overall success (e.g., Schultzet al. 2002), and the efforts to maximize outreach andintercommunity cooperation during STEPS couldhelp provide a model for future field projects.
The combination of polarimetric and multiple-Doppler radar observations, along with LMA-basedlightning mapping and in situ observations of elec-tric field structure, may provide new insights into thenature of predominantly +CG thunderstorms. For ex-ample, comparisons of the 29 June and 5 Julysupercells suggest important linkages between strongupdrafts, the development of large hail aloft, anomalouscharging in thunderstorm midlevels, and subsequentproduction of positive CG flashes. These potential in-terrelationships between thunderstorm kinematics,microphysics, electrical structure, and lightning arethe subject of ongoing research, not only in the afore-mentioned supercells but also other STEPS storms.
Indeed, a key to unlocking the mystery of PPCGthunderstorms, as well as other storms with inverted-polarity charge structures, could be identifying andunderstanding the common kinematic, micro-physical, and electrical features of all such thunder-storms observed in STEPS. In addition, we need tounderstand the key differences between these stormsand storms like that on 19 June 2000, which was se-vere but produced mostly –CGs Because all of thesestorms spanned different mesoscale environments, or-ganizational structures, and levels of severity, this is amajor research task that is still ongoing. Look for moreSTEPS results in both current and future publications.
ACKNOWLEDGMENTS. The STEPS project wasfunded by the National Science Foundation through thePhysical Meteorology, Aeronomy, and Lower AtmosphericObserving Facilities programs. In particular, STEPS wouldnot have occurred without the support and guidance pro-vided by Dr. Rod Rogers at NSF/ATM. NSF also fundedthe REU component of STEPS. NOAA and the NationalCenter for Atmospheric Research provided significant sup-port for STEPS as well. In addition, the extensive collabo-ration with the National Weather Service, in particular theGoodland office, was a major key to the project’s success.The STEPS community appreciates the great cooperationof the governments, schools, and general public of the cit-ies of Burlington, Colorado, and Goodland, Kansas. KenCummins and Global Atmospherics, Inc., now part ofVaisala, generously provided the NLDN lightning data.Data collection, as well as installation and teardown ofmajor facilities like the CSU–CHILL and S-Pol radars, wasprimarily the result of the dedicated staffs of all of the in-strument platforms, as well as the tremendous number ofenthusiastic undergraduate and graduate students whoparticipated in the field campaign. People who made extraor-dinary contributions to STEPS data collection and analysisinclude Eric Bruning, Larry Carey, Tim Hamlin, JeremiahHarlin, Sang-Hun Lim, Thomas E. Nelson, Walt Petersen,Sarah Tessendorf, and Kyle Wiens. We thank Bruce Entwistleat the Goodland NWS office for providing additional severestorm reports not available in Storm Data. Steve Nesbitt pro-vided last-minute assistance with some figures in this paper.
REFERENCESBluestein, H. B., and C. R. Parks, 1983: A synoptic and
photographic climatology of low-precipitation severethunderstorms in the southern plains. Mon. Wea.Rev., 111, 2034–2046.
——, and G. R. Woodall, 1990: Doppler-radar analysisof a low-precipitation severe storm. Mon. Wea. Rev.,118, 1640–1664.
Branick, M. L., and C. A. Doswell III, 1992: An obser-vation of the relationship between supercell structureand lightning ground strike polarity. Wea. Forecast-ing, 7, 143–149.
Browning, K. A., 1964: Airflow and precipitation trajec-tories within severe local storms which travel to theright of the winds. J. Atmos. Sci., 21, 634–639.
——, 1965: Some inferences about the updraft within asevere local storm. J. Atmos. Sci., 22, 669–677.
——, and R. J. Donaldson, 1963: Airflow and structureof a tornadic storm. J. Atmos. Sci., 20, 533–545.
Burgess, D. W., and R. P. Davies-Jones, 1979: Unusualtornadic storms in eastern Oklahoma on 5 Decem-ber 1975. Mon. Wea. Rev., 107, 451–457.
1123AUGUST 2004AMERICAN METEOROLOGICAL SOCIETY |
Carey, L. D., and S. A. Rutledge, 1998: Electrical andmultiparameter radar observations of a severe hail-storm. J. Geophys. Res., 103, 13 979–14 000.
——, and ——, 2003: Characteristics of cloud-to-groundlightning in severe and nonsevere storms over thecentral United States from 1989–1998. J. Geophys.Res., 108, 4483, doi:10.1029/2002JD002951.
——, ——, and W. A. Petersen, 2003: The relationshipbetween severe storm reports and cloud-to-groundlightning polarity in the contiguous United Statesfrom 1989 to 1998. Mon. Wea. Rev., 131, 1211–1228.
Changnon, S. A., Jr., 1977: The climatology of hail inNorth America. Hail: A Review of Hail Science andHail Suppression, Meteor. Monogr. No. 38, Amer.Meteor. Soc., 107–128.
Coleman, L. M., T. C. Marshall, M. Stolzenburg, T.Hamlin, P. Krehbiel, W. Rison, and R. J. Thomas,2003: Effects of charge and electrostatic potential onlightning propagation. J. Geophys. Res., 108, 4298,doi:10.1029/2002JD002718.
Cummins, K. L., M. J. Murphy, E. A. Bardo, W. L.Hiscox, R. B. Pyle, and A. E. Pifer, 1998: A combinedTOA/MDF technology upgrade of the U.S. NationalLightning Detection Network. J. Geophys. Res., 103,9035–9044.
Curran, E. B., and W. D. Rust, 1992: Positive groundflashes produced by low-precipitation thunderstormsin Oklahoma on 26 April 1984. Mon. Wea. Rev., 120,544–553.
Davies-Jones, R. P., D. W. Burgess, and L. R. Lemon,1976: An atypical tornado producing cumulonimbus.Weather, 31, 336–347.
Donaldson, R., A. Spatola, and K. Browning, 1965: Vi-sual observations of severe weather phenomena. Afamily outbreak of severe local storms—Acomprensive study of the storms in Oklahoma on26 May 1963. Part I. Special Rep. 32, Air Force Cam-bridge Research Laboratory, 73–97.
Doswell, C. A., III, and D. W. Burgess, 1993: Tornadoesand tornadic storms: A review of conceptual mod-els. The Tornado: Its Structure, Dynamics, Prediction,and Hazards, Geophys. Monogr., No. 79, Amer.Geophys. Union, 161–172.
Gilmore, M. S., J. M. Straka, and E. N. Rasmussen, 2003:Precipitation and evolution sensitivity in simulateddeep convective storms: Comparisons between liq-uid-only and simple ice and liquid phase microphys-ics. Mon. Wea. Rev., in press.
Hamlin, T., P. R. Krehbiel, R. J. Thomas, W. Rison, andJ. Harlin, 2003: Electrical structures and storm sever-ity inferred by 3-D lightning mapping observationsduring STEPS. Proc. 12th Int. Conf. on Atmospheric
Electricity, Versailles, France, International Commis-sion on Atmospheric Electricity, 189–192.
Hu, W., S. Cummer, W. A. Lyons, and T. E. Nelson,2002: Lightning charge moment changes for the ini-tiation of sprites. Geophys. Res. Lett., 29, 1279,doi:10.1029/2001GL014593.
Huang, E., E. R. Williams, R. Boldi, S. Heckman, W. A.Lyons, M. Taylor, T. E. Nelson, and C. Wong, 1999:Criteria for sprites and elves based on Schumannresonance observations. J. Geophys. Res., 104, 16 943–16 964.
Klemp, J. B., 1987: Dynamics of tornadic thunderstorms.Ann. Rev. Fluid Mech., 19, 369–402.
Koshak, W. J., and E. P. Krider, 1989: Analysis of light-ning field changes during active Florida thunder-storms. J. Geophys. Res., 94, 1165–1186.
Krehbiel, P. R., 1986: The electrical structure of thun-derstorms. The Earth’s Electrical Environment, E. P.Krider and R. G. Roble, Eds., National AcademyPress, 90–113.
——, R. J. Thomas, W. Rison, T. Hamlin, J. Harlin, andM. Davis, 2000: GPS-based mapping system revealslightning inside storms. Eos, Trans. Amer. Geophys.Union, 81, 21–25.
Kuhlman, K. M., E. R. Mansell, C. L. Ziegler, D. R.MacGorman, and J. M. Straka, 2003: Charging andlightning in simulations of the 29 June 2000 STEPSsupercell. Proc. 12th Int. Conf. on Atmospheric Elec-tricity, Versailles, France, International Commissionon Atmospheric Electricity, 199–202.
Lin, Y.-L., R. D. Farley, and H. D. Orville, 1983: Bulkparameterization of the snow field in a cloud model.J. Climate Appl. Meteor., 22, 1065–1092.
Liu, H., and V. Chandrasekar, 2000: Classification of hy-drometeors based on polarimetric radar measure-ments: Development of fuzzy logic and neuro-fuzzysystems, and in situ verification. J. Atmos. OceanicTechnol., 17, 140–164.
Lyons, W. A., 1996: Sprite observations above the U.S.High Plains in relation to their parent thunderstormsystems. J. Geophys. Res., 101, 29 641–29 652.
——, R. A. Armstrong, E. R. Williams, and E. A. Bering,2000: The hundred year hunt for the sprite. Eos,Trans. Amer. Geophys. Union, 81, 373–377.
——, T. E. Nelson, R. A. Armstrong, V. P. Pasko, andM. A. Stanley, 2003a: Upward electrical dischargesfrom thunderstorm tops. Bull. Amer. Meteor. Soc., 84,445–454.
——, ——, E. R. Williams, S. A. Cummer, and M. A.Stanley, 2003b: Characteristics of sprite-producingpositive cloud-to-ground lightning during the 19 July2000 STEPS mesoscale convective systems. Mon.Wea. Rev., 131, 2417–2427.
1124 AUGUST 2004|
MacGorman, D. R., and W. D. Rust, 1998: The Electri-cal Nature of Storms. Oxford University Press,422 pp.
Marshall, T. C., W. D. Rust, and M. Stolzenburg, 1995:Electrical structure and updraft speeds in thunder-storms over the southern Great Plains. J. Geophys.Res., 100, 1001–1015.
——, M. Stolzenburg, W. D. Rust, E. R. Williams, andR. Boldi, 2001: Positive charge in the stratiform cloudof a mesoscale convective system. J. Geophys. Res.,106, 1157–1163.
Mazur, V., E. Williams, R. Boldi, L. Maier, and D. E.Proctor, 1997: Initial comparison of lightning map-ping with operational time-of-arrival and interfero-metric systems. J. Geophys. Res., 102, 11 071–11 085.
Miller, L. J., and M. Weisman, 2002: Comparison ofradar-observed and WRF-modeled structures of twoSTEPS storms. Proc., 21st Conf. on Severe LocalStorms, San Antonio, Texas, Amer. Meteor. Soc.,299–302.
Orville, R. E., 1994: Cloud-to-ground lightning flashcharacteristics in the contiguous United States: 1989–1991. J. Geophys. Res., 99, 10 833–10 841.
——, and A. C. Silver, 1997: Lightning ground flash den-sity in the contiguous United States: 1992–1995. Mon.Wea. Rev., 125, 631–638.
——, and G. R. Huffines, 2001: Cloud-to-ground light-ning in the United States: NLDN results in the firstdecade, 1989–1998. Mon. Wea. Rev., 129, 1179–1193.
Price, C., M. Asfur, W. Lyons, and T. Nelson, 2002: AnImproved ELF/VLF method for globally geolocatingsprite-producing lightning. Geophys. Res. Lett., 29,1031, doi:10.1029/2001GL013519.
Rasmussen, E. N., and J. M. Straka, 1998: Variations insupercell morphology. Part I: Observations of the roleof upper-level storm-relative flow. Mon. Wea. Rev.,126, 2406–2421.
Ray, P. S., D. R. MacGorman, W. D. Rust, W. L. Taylor,and L. W. Rasmussen, 1987: Lightning location rela-tive to storm structure in a supercell storm and a mul-ticell storm. J. Geophys. Res., 92, 5713–5724.
Rison, W., R. J. Thomas, P. R. Krehbiel, T. Hamlin, andJ. Harlin, 1999: A GPS-based three-dimensionallightning mapping system: Initial observations inNew Mexico. Geophys. Res. Lett., 26, 3573–3576.
Rust, W. D., and D. R. MacGorman, 2002: Possibly in-verted-polarity electrical structures in thunderstormsduring STEPS. Geophys. Res. Lett., 29, 1571,doi:10.1029/2001GL014303.
——, ——, P. R. Krehbiel, R. J. Thomas, E. C. Bruning,and S. A. Stroman, 2003: The status of our search forinverted polarity electrical structures in thunder-
storms. Proc. 12th Int. Conf. on Atmospheric Electric-ity, Versailles, France, International Commission onAtmospheric Electricity, 135–138.
Schultz, D. M., and Coauthors, 2002: Understanding Utahwinter storms: The Intermountain Precipitation Ex-periment. Bull. Amer. Meteor. Soc., 83, 189–210.
Schuur, T. J., B. F. Smull, W. D. Rust, and T. C. Marshall,1991: Electrical and kinematic structure of the strati-form precipitation region trailing an Oklahomasquall line. J. Atmos. Sci., 48, 825–842.
Stolzenburg, M., and T. C. Marshall, 1994: Testing mod-els of thunderstorm charge distributions withCoulomb’s law. J. Geophys. Res., 99, 25 921–25 932.
——, ——, W. D. Rust, and B. F. Smull, 1994: Horizontaldistribution of electrical and meteorologicalconditions across the stratiform region of a mesos-cale convective system. Mon. Wea. Rev., 122, 1777–1797.
——, W. D. Rust, and T. C. Marshall, 1998a: Electricalstructure in thunderstorm convective regions.Part II: Isolated storms. J. Geophys. Res., 103,14 079–14 096.
——, ——, and ——, 1998b: Electrical structure in thun-derstorm convective regions. Part III: Synthesis. J.Geophys. Res., 103, 14 097–14 108.
——, T. C. Marshall, W. D. Rust, and D. L. Bartels, 2002:Two simultaneous charge structures in thunder-storm convection. J. Geophys. Res., 107, 4352,doi:10.1029/2001JD000904.
Straka, J. M., D. S. Zrnic, and A. V. Ryzhkov, 2000: Bulkhydrometeor classification and quantification usingpolarimetric radar data: Synthesis of relations. J.Appl. Meteor., 39, 1341–1372.
Thomas, R., P. Krehbiel, W. Rison, J. Harlin, T. Hamlin,and N. Campbell, 2003: The LMA flash algorithm.Proc. 12th Int. Conf. on Atmospheric Electricity,Versailles, France, International Commission onAtmospheric Electricity, 655–656.
Vivekandan, J., S. M. Ellis, R. Oye, D. S. Zrnic, A. V.Ryzhkov, and J. Strata, 1999: Cloud microphysicsretrieval using S-band dual-polarization radar mea-surements. Bull. Amer. Meteor. Soc., 80, 381–388.
Warner, T. A., J. H. Helsdon Jr., and A. G. Detwiler,2003: Aircraft observations of a lightning channel inSTEPS. Geophys. Res. Lett., 30, 1984, doi:10.1029/2003GL017334.
Weisman, M. L., and H. B. Bluestein, 1985: Dynamicsof numerically simulated LP storms. Preprints, 15thConf. on Severe Local Storms, Indianapolis, IN, Amer.Meteor. Soc., 167–171.
——, and J. B. Klemp, 1986: Characteristics of isolatedconvective storms. Mesoscale Meteorology and Fore-casting, P. Ray, Ed., Amer. Meteor. Soc., 331–357.

1125AUGUST 2004AMERICAN METEOROLOGICAL SOCIETY |
——, and L. J. Miller, 2000: An overview of the severethunderstorm electrification and precipitation study(STEPS). Preprints, 20th Conf. on Severe LocalStorms, Orlando, FL, Amer. Meteor. Soc., 273–276.
——, ——, and R. Rotunno, 1988: The structure and evo-lution of numerically simulated squall lines. J. Atmos.Sci., 45, 1990–2013.
Williams, E. R., 1989: The tripole structure of thunder-storms. J. Geophys. Res., 94, 13 151–13 167.
——, 1998: The positive charge reservoir for sprite-pro-ducing lightning. J. Atmos. Sol. Terr. Phys., 60, 689–692.
——, 2001: The electrification of severe storms. SevereConvective Storms, Meteor. Monogr. No. 49, Amer.Meteor. Soc., 527–561.
Winn, W. P., and L. G. Byerley III, 1975: Electric fieldgrowth in thunderclouds. Quart. J. Roy. Meteor. Soc.,101, 979–994.
Zajac, B. A., and S. A. Rutledge, 2001: Cloud-to-groundlightning activity in the contiguous United Statesfrom 1995 to 1999. Mon. Wea. Rev., 129, 999–1019.
Zrnic, D. S., A. Ryzhkov, J. Straka, Y. Liu, and J.Vivekandan, 2001: Testing a procedure for automaticclassification of hydrometeor types. J. Atmos. OceanicTechnol., 18, 892–913.