Embed Size (px)
Citation preview
The Sizes and Albedos of Centaurs 2014 YY49 and 2013 NL24 from Stellar OccultationMeasurements by RECON
Ryder H. Strauss1,2 , Rodrigo Leiva3 , John M. Keller1 , Elizabeth Wilde1, Marc W. Buie3 , Robert J. Weryk4 ,JJ Kavelaars5 , Terry Bridges6,7, Lawrence H. Wasserman8 , David E. Trilling2 , Deanna Ainsworth9,10, Seth Anthony9,11,Robert Baker9,12, Jerry Bardecker9,13, James K Bean, Jr.9,14,15, Stephen Bock9, Stefani Chase9,10, Bryan Dean9, Chessa Frei9,10,Tony George9,16, Harnoorat Gill9, H. Wm. Gimple9, Rima Givot9,17, Samuel E. Hopfe9,18, Juan M. Cota, Jr.9,19, Matthew Kehrli9,18,Rebekah King9, Sean L. Haley9, Charisma Lara9, Nels Lund9,20, Martin L. Mattes9,21, Keitha McCandless9,19, Delsie McCrystal9,17,
Josh McRae9,21, Leonardo Emmanuel Rodriguez Melgarejo9,15, Paola Mendoza9,17, Alexandra Miller9, Ian R. Norfolk9,12,Bruce Palmquist9,21, Robert D. Reaves9,22, Megan L Rivard9, Michael von Schalscha9, Ramsey Schar9,17, Timothy J Stoffel9,
Diana J. Swanson9,18, Doug Thompson9,23, J. A. Wise9,12, Levi Woods9,14, and Yuehai Yang9,111 Department of Astrophysical and Planetary Sciences, University of Colorado Boulder, 2000 Colorado Avenue, Boulder, CO 80309, USA; [email protected]
2 Department of Astronomy and Planetary Science, Northern Arizona University, 527 South Beaver Street, Flagstaff, AZ 86011, USA3 Southwest Research Institute, 1050 Walnut Street, Suite 300, Boulder, CO 80302, USA
4 Institute for Astronomy, University of Hawai’i, 2680 Woodlawn Drive, Honolulu, HI 96822, USA5 National Research Council of Canada, Victoria, BC V9E 2E7, Canada
6 Department of Physics and Astronomy, Okanagan College, Kelowna, BC, Canada7 CanCON, Canadian Research and Education Collaborative Occultation Network, Canada
8 Lowell Observatory, 1400 West Mars Hill Road, Flagstaff, AZ 86001, USA9 RECON, Research and Education Collaborative Occultation Network, USA
10 Lake Havasu High School, Lake Havasu City, AZ, USA11 Oregon Institute of Technology, Klamath Falls, OR, USA
12Wildwood Institute for STEM Research and Development, Los Angeles, CA, USA13 International Occultation Timing Association, USA14 Jack C. Davis Observatory, Carson City, NV, USA
15 Carson High School, Carson City, NV, USA16 International Occultation Timing Association of North America, Scottsdale, AZ, USA
17 Sisters High School/Sisters Astronomy Club, Sisters, OR, USA18 California Polytechnic State University, San Luis Obispo, CA, USA
19 Calipatria High School, Calipatria, CA, USA20 Chelan Middle School, Chelan, WA, USA
21 Central Washington University, Ellensburg, WA, USA22 Arizona Western College, Parker, AZ, USA23 Arizona Western College, Yuma, AZ, USA
Received 2020 October 25; revised 2020 December 15; accepted 2020 December 21; published 2021 February 5
Abstract
In 2019, the Research and Education Collaborative Occultation Network (RECON) obtained multiple-chord occultationmeasurements of two Centaur objects: 2014 YY49 on 2019 January 28 and 2013 NL24 on 2019 September 4. RECONis a citizen-science telescope network designed to observe high-uncertainty occultations by outer solar system objects.Adopting circular models for the object profiles, we derive a radius = -
+r 16 12 km and a geometric albedo
= -+p 0.13V 0.024
0.015 for 2014 YY49 and a radius = -+r 66 5
5 km and a geometric albedo = -+p 0.045V 0.008
0.006 for 2013 NL24.To the precision of these measurements, no atmosphere or rings are detected for either object. The two objects measuredhere are among the smallest distant objects measured with the stellar occultation technique. In addition to thesegeometric constraints, the occultation measurements provide astrometric constraints for these two Centaurs at a higherprecision than has been feasible by direct imaging. To supplement the occultation results, we also present an analysis ofcolor photometry from the Pan-STARRS surveys to constrain the rotational light curve amplitudes and spectral colors ofthese two Centaurs. We recommend that future work focus on photometry to more deliberately constrain the objects’colors and light curve amplitudes and on follow-on occultation efforts informed by this astrometry.
Unified Astronomy Thesaurus concepts: Stellar occultation (2135); Centaur group (215)
Supporting material: data behind figures, tar.gz file
1. Introduction
The small bodies of the outer solar system are an importantpopulation in the realm of solar system science. Trans-Neptunian objects (TNOs) are thought to be among the most
primordial objects in the solar system. The sparse environmentin the TNO region of the outer solar system means thatinteractions are very infrequent. The most compelling evidencefor the primordial nature of these objects is the observations ofthe surface of the classical TNO Arrokoth during the flyby byNew Horizons (Stern et al. 2019). Arrokoth appears to consistof a number of smaller sections that look to have gentlyaccreted together. Additionally, the surface of the object issmooth and lightly cratered, but the density of the craters is
The Planetary Science Journal, 2:22 (19pp), 2021 February https://doi.org/10.3847/PSJ/abd62a© 2021. The Author(s). Published by the American Astronomical Society.
Original content from this work may be used under the termsof the Creative Commons Attribution 4.0 licence. Any further
distribution of this work must maintain attribution to the author(s) and the titleof the work, journal citation and DOI.
1
consistent with a >4 billion yr old surface (Spencer et al.2020). For these reasons, it is likely that this object has existedmostly unchanged since the early accretionary solar system. Inlearning about the physical properties of these bodies, we standto gain valuable insight into the composition and origin ofplanetesimals in the infant solar system.
A population of outer solar system bodies equally asinteresting as TNOs are Centaurs, objects with semimajor axesin between those of the giant planets. Dynamical simulationshave indicated that these objects have unstable orbits with veryshort dynamical lifetimes; the ensemble half-life of the entirepopulation is only 2.7 million yr (Horner et al. 2004). Thissuggests that current Centaurs likely originated elsewhere inthe solar system. A relatively widely held current consensus isthat Centaurs appear to be a stage in the transition betweenTNOs and Jupiter-family comets, though their origin is likelysomewhat heterogeneous. The primary source for Centaursappears to be the scattered disk (Di Sisto & Brunini 2007; Volk& Malhotra 2008; Di Sisto & Rossignoli 2020), but other,secondary sources for this population may include plutinos(Morbidelli 1997; Di Sisto et al. 2010), Neptune Trojans(Horner & Lykawka 2010), and even some Jupiter Trojans (DiSisto et al. 2019).
While Centaurs are not as well characterized as otherpopulations within the solar system, some relations have beennoted between various orbital and physical parameters. Tegleret al. (2016) suggested a correlation between the color andorbital inclination of Centaurs, where redder objects have asmaller distribution of inclination angles than grayer objects.Marsset et al. (2019) saw the same trend within the Centaurs, aswell as within the TNO population as a whole. A subject ofsome controversy has been an observed bimodal colordistribution among Centaurs, split between very red objectsand grayer objects (Peixinho et al. 2012; Tegler et al. 2016).This split has become less clear in recent years as the samplesize has increased, and further measurements are required todetermine whether the color distribution is truly bimodal. For amore comprehensive literature review of the current knowledgeof the Centaur population, see Peixinho et al. (2020).
Due to their small size, low brightness, and distance from theEarth, Centaurs and TNOs are difficult to probe via directmeasurement. It is possible to obtain some information abouttheir characteristics in this way. Extended characteristics suchas comae (Stansberry et al. 2004) and binarity in the case oflarge angular separation (Grundy et al. 2019) can be identifiedusing direct observational techniques. Sizes and albedos canalso be estimated using radiometric techniques (Müller et al.2009). Radiometric methods offer the ability to probe a largenumber of objects, but the precision of these solutions isgenerally low and highly model-dependent.
While radiometric techniques provide an opportunity tocharacterize a larger number of objects, occultations canprovide ground-truth measurements for object sizes andalbedos, which can inform thermal modeling efforts. Occulta-tions can also provide astrometric constraints at a much higherprecision than is possible through direct measurement. Whenan object occults a distant star, the drop in the flux from thatstar can be recorded to generate a light curve, and the durationof that drop provides a very accurate measurement of the widthalong a specific chord of the object. If stations spaced acrossthe path of the object’s shadow observe the occultation,multiple chords across the object are measured, and a model of
the two-dimensional profile of the object can be fit to lightcurve data.Due to the large uncertainties in the orbit fits for TNOs,
occultations by these objects are difficult to observe—muchmore so than occultations by main-belt asteroids. This is, inpart, due to the fact that telescope astrometry can only beacquired to a certain angular precision. This angular precisionputs a limit on the spatial precision, depending on the distanceto the object: a given angular uncertainty of 10 mascorresponds to a ground-track uncertainty of just 22 km at adistance of 3 au (within the main belt), but at 30 au, the sameuncertainty corresponds to a ground-track uncertainty of200 km. It is also the case that main-belt asteroids are mucheasier to observe than TNOs with comparable sizes due to theirapparent brightness, so astrometry can be more readilyobtained. In addition, TNOs have very long orbital periods.Because most of these objects were discovered very recently,the observed orbital arcs are very short relative to the fullorbits. This contrasts with inner solar system objects, many ofwhich have astrometric measurements over their full orbits.With measurements over a large fraction of the orbit, an orbitalsolution can be fitted to a much higher precision than with thepartial arc measurements that exist for all TNOs.The Research and Education Collaborative Occultation
Network (RECON) is a network of telescopes designed withthis challenge in mind. RECON (described in more detail inSection 2) is a large-scale stationary network of volunteercitizen astronomer sites set up as a north–south “picket fence”along the western United States, extending 2000 km in thenorth–south direction, with the intent of observing these large-uncertainty occultations with a reasonable probability ofsuccess (Buie & Keller 2016). The notion that the majorityof Centaurs seem to have originated as TNOs makes themprime targets in our effort to study the physical properties ofTNOs. Additionally, their relative proximity makes them easiertargets for which to obtain astrometry, and this astrometry canbe obtained with a smaller ground-track uncertainty. For thesereasons, occultations by Centaurs make up a large fraction ofobjects attempted by the RECON project.In 2019, among other results, RECON obtained multiple-
chord measurements for the Centaurs 2014 YY49 and 2013NL24. This paper presents the results from both of theseoccultation measurements. It is organized such that the twooccultation efforts are presented in parallel, from predictions toresults. Section 3 describes the prediction for each occultationevent. Section 4 details the observation efforts for the twoevents. Section 5 describes the method and results of thephotometric analysis of the data from these events. Section 6details the modeling of the object profiles and the results ofthese modeling efforts. Section 7 provides a discussion ofresults, implications, and supplemental work. Section 8summarizes this work’s findings and provides recommenda-tions for future research.
2. RECON
RECON is a network nominally made up of 54 telescopeobserving sites spread across the western United States fromsouthern California to northern Washington. Equipped withbackyard Celestron CPC-1100 telescopes, these observingstations are operated mainly by faculty and students affiliatedwith local high schools and colleges, as well as otherenthusiastic volunteers within the communities. In 2018
2
The Planetary Science Journal, 2:22 (19pp), 2021 February Strauss et al.
September, a 100 km, seven-site Canadian extension named theCanadian Collaborative Occultation Network (CanCON) waslaunched to supplement the RECON network (Boley et al.2019).
As of 2020 August, the RECON project had coordinated 54occultation campaigns (summarized in Table 1) involvingobjects beyond the main belt, including Jupiter Trojans,Centaurs, classical KBOs, resonant KBOs, and scattered diskobjects. Thirteen of these 54 campaigns have resulted inpositive detections. Nineteen of the 54 RECON campaignshave involved objects from the Centaur population, more thanfor any other object type. Of these 19 Centaur campaigns, threehave resulted in detections.
As of late 2020, occultation measurements of only sevenCentaurs had been obtained outside of this work (Braga-Ribaset al. 2019). Only four Centaurs have occultation measurementswith multiple chords. In 2019, RECON made multiple-chordoccultation measurements of three additional Centaurs, bring-ing this number to nine and extending this sample towardsmaller sizes. These three objects make up the total of Centaursmeasured by RECON to date. Because of similarities in thedetection and analyses, two of these, 2014 YY49 (measuredon 2019 January 28) and 2013 NL24 (measured on 2019September 4), are combined as the subjects of this paper. Apublication on the third Centaur measured by RECON, 2008YB3, measured on 2019 August 17, is forthcoming.
3. Predictions
3.1. Prediction for 2014 YY49
An occultation by the Centaur 2014 YY49, at 05:08:56 on2019 January 28 UTC, was identified by the RECONprediction system, which automatically predicts appulses andselects those that may result in occultations observable by theRECON network. This prediction system is described in detailin Buie & Keller (2016). This Centaur was discovered by Pan-STARRS (Chambers et al. 2016) in 2014, with observationsrecovered back through 2004. These data from Pan-STARRSallowed the prediction of an appulse between the Centaur andthe Gaia DR2 star with source ID 3318035546681086336.Measurements taken by the RECON team 2 months prior tothe event using the ARC 3.5 m telescope at Apache PointObservatory further reduced the astrometric uncertainty for thisprediction. The 1σ time uncertainty for this prediction was 48 s
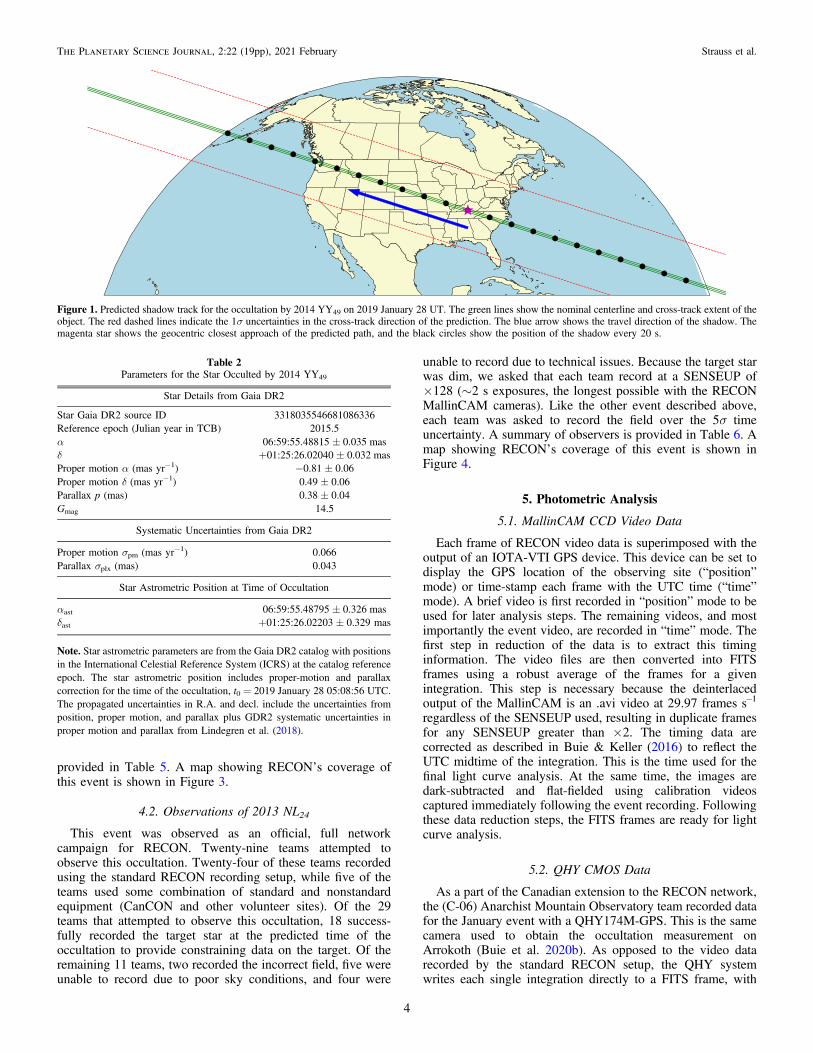
based on a shadow velocity of 21.5 km s−1, and the 1σ cross-track uncertainty was 57 mas, corresponding to an uncertaintyof 738 km at the distance of the object, with the nominalshadow path passing directly over central Washington, USA.The RECON network spanned +0.3σ to the north and −1.5σto the south in the cross-track direction. Figure 1 shows thegeometry of the occultation prediction on the Earth. With anabsolute magnitude from the Minor Planet Center (MPC) ofHV= 10.2, the diameter of the object was predicted to have alower limit of 22.5 km assuming a 30% geometric albedo. Witha median site spacing of 18.2 km in the cross-track direction,the probability of at least one detection (assuming 100%network participation by all 61 teams) was 45.5%. Details ofthe occulted star are summarized in Table 2. A summary ofprediction details can be found in Table 4.
3.2. Prediction for 2013 NL24
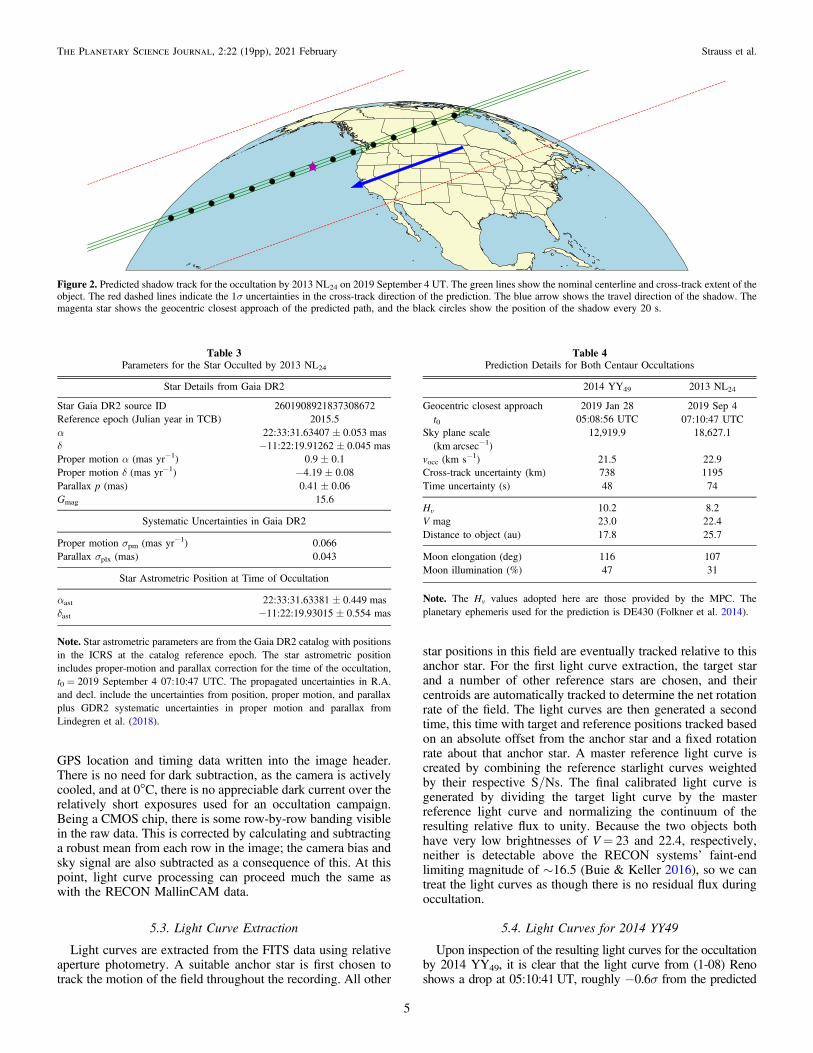
The automated RECON prediction system (Buie &Keller 2016)identified an occultation opportunity between the Centaur object2013 NL24 and the Gaia DR2 star 2601908921837308672, takingplace at 07:10:47 on 2019 September 4 UT. This object wasdiscovered by the Pan-STARRS project in 2013, with measure-ments recovered back through 2010. All TNO astrometryinforming this prediction was obtained by the Pan-STARRSproject (Chambers et al. 2016). The 1σ time uncertainty for thisprediction was 74 s based on a velocity of 22.9 km s−1, and the 1σcross-track uncertainty was 64mas, corresponding to 1195 km atthe distance of the object, with the nominal centerline passing overthe Canadian sites at the northernmost end of the joint RECON/CanCON network (geometry shown in Figure 2). The networkspanned +0.023σ to the north and −0.98σ to the south in thecross-track direction. In the down-track direction, we asked thateach team record for ±5σ about the predicted midtime. With anabsolute magnitude from MPC of HV= 8.2, the diameter of theCentaur was predicted to have a lower limit of 55.6 km assuminga 30% geometric albedo. With a median site spacing of 12.6 km inthe cross-track direction, the probability of detection was 26.3%.Details of the occulted star are summarized in Table 3. Details ofthis prediction are summarized in Table 4.
4. Observations
4.1. Observations of 2014 YY49
This event was observed as an official, full networkcampaign for RECON. Thirty-six teams attempted to observethe event. Of these, 33 used the standard RECON recordingsetup detailed in Buie & Keller (2016). The remaining teams(namely, the CanCON teams) used a different configurationinvolving a QHY174M-GPS CMOS camera. Each team wasasked to record the target field for a duration of±5σ about thenominal event time. Nominally, each RECON team was torecord at a SENSEUP of ×64 (∼1 s exposures), selected tooptimize the balance between signal-to-noise ratio (S/N) andtemporal resolution. A number of teams recorded usingSENSEUPs as high as ×128 (∼2 s exposures), based onpoorer sky conditions at their respective locations. Of the 36teams that attempted to observe the occultation, 23 successfullyrecorded the target star at the predicted time of the occultationto provide constraining data on the target. Of the remaining 13teams, three recorded the incorrect field, six were unable tocollect data due to sky conditions, and four were unable torecord due to technical issues. A summary of observers is
Table 1Number of Campaigns for Each Object Class (in Order of Average OrbitalSemimajor Axis) Attempted by the RECON Network as of 2020 August
Dynamical Classification Campaigns Official Optional Detections
Jupiter Trojan (1), (2) 4 1 3 4Centaur (1), (3) 19 18 1 3Classical KBO (4) 9 5 4 1Resonant KBO (1), (5) 15 14 1 3Scattered Disk Object
(6), (7)7 6 1 2
Note. “Official” denotes a high-priority campaign in which we ask all volunteerobservers in the network to participate, while “Optional” denotes a lower-priority campaign in which the network, or some subset of the network, maychoose to participate. RECON publications: (1) publication forthcoming, (2)Buie et al. (2015), (3) this work, (4) Souami et al. (2020), (5) Leiva et al.(2020), (6) Benedetti-Rossi et al. (2016), (7) Buie et al. (2020a).
3
The Planetary Science Journal, 2:22 (19pp), 2021 February Strauss et al.
provided in Table 5. A map showing RECON’s coverage ofthis event is shown in Figure 3.
4.2. Observations of 2013 NL24
This event was observed as an official, full networkcampaign for RECON. Twenty-nine teams attempted toobserve this occultation. Twenty-four of these teams recordedusing the standard RECON recording setup, while five of theteams used some combination of standard and nonstandardequipment (CanCON and other volunteer sites). Of the 29teams that attempted to observe this occultation, 18 success-fully recorded the target star at the predicted time of theoccultation to provide constraining data on the target. Of theremaining 11 teams, two recorded the incorrect field, five wereunable to record due to poor sky conditions, and four were
unable to record due to technical issues. Because the target starwas dim, we asked that each team record at a SENSEUP of×128 (∼2 s exposures, the longest possible with the RECONMallinCAM cameras). Like the other event described above,each team was asked to record the field over the 5σ timeuncertainty. A summary of observers is provided in Table 6. Amap showing RECON’s coverage of this event is shown inFigure 4.
5. Photometric Analysis
5.1. MallinCAM CCD Video Data
Each frame of RECON video data is superimposed with theoutput of an IOTA-VTI GPS device. This device can be set todisplay the GPS location of the observing site (“position”mode) or time-stamp each frame with the UTC time (“time”mode). A brief video is first recorded in “position” mode to beused for later analysis steps. The remaining videos, and mostimportantly the event video, are recorded in “time” mode. Thefirst step in reduction of the data is to extract this timinginformation. The video files are then converted into FITSframes using a robust average of the frames for a givenintegration. This step is necessary because the deinterlacedoutput of the MallinCAM is an .avi video at 29.97 frames s–1
regardless of the SENSEUP used, resulting in duplicate framesfor any SENSEUP greater than ×2. The timing data arecorrected as described in Buie & Keller (2016) to reflect theUTC midtime of the integration. This is the time used for thefinal light curve analysis. At the same time, the images aredark-subtracted and flat-fielded using calibration videoscaptured immediately following the event recording. Followingthese data reduction steps, the FITS frames are ready for lightcurve analysis.
5.2. QHY CMOS Data
As a part of the Canadian extension to the RECON network,the (C-06) Anarchist Mountain Observatory team recorded datafor the January event with a QHY174M-GPS. This is the samecamera used to obtain the occultation measurement onArrokoth (Buie et al. 2020b). As opposed to the video datarecorded by the standard RECON setup, the QHY systemwrites each single integration directly to a FITS frame, with
Figure 1. Predicted shadow track for the occultation by 2014 YY49 on 2019 January 28 UT. The green lines show the nominal centerline and cross-track extent of theobject. The red dashed lines indicate the 1σ uncertainties in the cross-track direction of the prediction. The blue arrow shows the travel direction of the shadow. Themagenta star shows the geocentric closest approach of the predicted path, and the black circles show the position of the shadow every 20 s.
Table 2Parameters for the Star Occulted by 2014 YY49
Star Details from Gaia DR2
Star Gaia DR2 source ID 3318035546681086336Reference epoch (Julian year in TCB) 2015.5α 06:59:55.48815 ± 0.035 masδ +01:25:26.02040 ± 0.032 masProper motion α (mas yr−1) −0.81 ± 0.06Proper motion δ (mas yr−1) 0.49 ± 0.06Parallax p (mas) 0.38 ± 0.04Gmag 14.5
Systematic Uncertainties from Gaia DR2
Proper motion σpm (mas yr−1) 0.066Parallax σplx (mas) 0.043
Star Astrometric Position at Time of Occultation
αast 06:59:55.48795 ± 0.326 masδast +01:25:26.02203 ± 0.329 mas
Note. Star astrometric parameters are from the Gaia DR2 catalog with positionsin the International Celestial Reference System (ICRS) at the catalog referenceepoch. The star astrometric position includes proper-motion and parallaxcorrection for the time of the occultation, t0 = 2019 January 28 05:08:56 UTC.The propagated uncertainties in R.A. and decl. include the uncertainties fromposition, proper motion, and parallax plus GDR2 systematic uncertainties inproper motion and parallax from Lindegren et al. (2018).
4
The Planetary Science Journal, 2:22 (19pp), 2021 February Strauss et al.
GPS location and timing data written into the image header.There is no need for dark subtraction, as the camera is activelycooled, and at 0°C, there is no appreciable dark current over therelatively short exposures used for an occultation campaign.Being a CMOS chip, there is some row-by-row banding visiblein the raw data. This is corrected by calculating and subtractinga robust mean from each row in the image; the camera bias andsky signal are also subtracted as a consequence of this. At thispoint, light curve processing can proceed much the same aswith the RECON MallinCAM data.
5.3. Light Curve Extraction
Light curves are extracted from the FITS data using relativeaperture photometry. A suitable anchor star is first chosen totrack the motion of the field throughout the recording. All other
star positions in this field are eventually tracked relative to thisanchor star. For the first light curve extraction, the target starand a number of other reference stars are chosen, and theircentroids are automatically tracked to determine the net rotationrate of the field. The light curves are then generated a secondtime, this time with target and reference positions tracked basedon an absolute offset from the anchor star and a fixed rotationrate about that anchor star. A master reference light curve iscreated by combining the reference starlight curves weightedby their respective S/Ns. The final calibrated light curve isgenerated by dividing the target light curve by the masterreference light curve and normalizing the continuum of theresulting relative flux to unity. Because the two objects bothhave very low brightnesses of V= 23 and 22.4, respectively,neither is detectable above the RECON systems’ faint-endlimiting magnitude of ∼16.5 (Buie & Keller 2016), so we cantreat the light curves as though there is no residual flux duringoccultation.
5.4. Light Curves for 2014 YY49
Upon inspection of the resulting light curves for the occultationby 2014 YY49, it is clear that the light curve from (1-08) Renoshows a drop at 05:10:41UT, roughly −0.6σ from the predicted
Figure 2. Predicted shadow track for the occultation by 2013 NL24 on 2019 September 4 UT. The green lines show the nominal centerline and cross-track extent of theobject. The red dashed lines indicate the 1σ uncertainties in the cross-track direction of the prediction. The blue arrow shows the travel direction of the shadow. Themagenta star shows the geocentric closest approach of the predicted path, and the black circles show the position of the shadow every 20 s.
Table 3Parameters for the Star Occulted by 2013 NL24
Star Details from Gaia DR2
Star Gaia DR2 source ID 2601908921837308672Reference epoch (Julian year in TCB) 2015.5α 22:33:31.63407 ± 0.053 masδ −11:22:19.91262 ± 0.045 masProper motion α (mas yr−1) 0.9 ± 0.1Proper motion δ (mas yr−1) −4.19 ± 0.08Parallax p (mas) 0.41 ± 0.06Gmag 15.6
Systematic Uncertainties in Gaia DR2
Proper motion σpm (mas yr−1) 0.066Parallax σplx (mas) 0.043
Star Astrometric Position at Time of Occultation
αast 22:33:31.63381 ± 0.449 masδast −11:22:19.93015 ± 0.554 mas
Note. Star astrometric parameters are from the Gaia DR2 catalog with positionsin the ICRS at the catalog reference epoch. The star astrometric positionincludes proper-motion and parallax correction for the time of the occultation,t0 = 2019 September 4 07:10:47 UTC. The propagated uncertainties in R.A.and decl. include the uncertainties from position, proper motion, and parallaxplus GDR2 systematic uncertainties in proper motion and parallax fromLindegren et al. (2018).
Table 4Prediction Details for Both Centaur Occultations
2014 YY49 2013 NL24
Geocentric closest approacht0
2019 Jan 2805:08:56 UTC
2019 Sep 407:10:47 UTC
Sky plane scale(km arcsec−1)
12,919.9 18,627.1
vocc (km s−1) 21.5 22.9Cross-track uncertainty (km) 738 1195Time uncertainty (s) 48 74
Hv 10.2 8.2V mag 23.0 22.4Distance to object (au) 17.8 25.7
Moon elongation (deg) 116 107Moon illumination (%) 47 31
Note. The Hv values adopted here are those provided by the MPC. Theplanetary ephemeris used for the prediction is DE430 (Folkner et al. 2014).
5
The Planetary Science Journal, 2:22 (19pp), 2021 February Strauss et al.
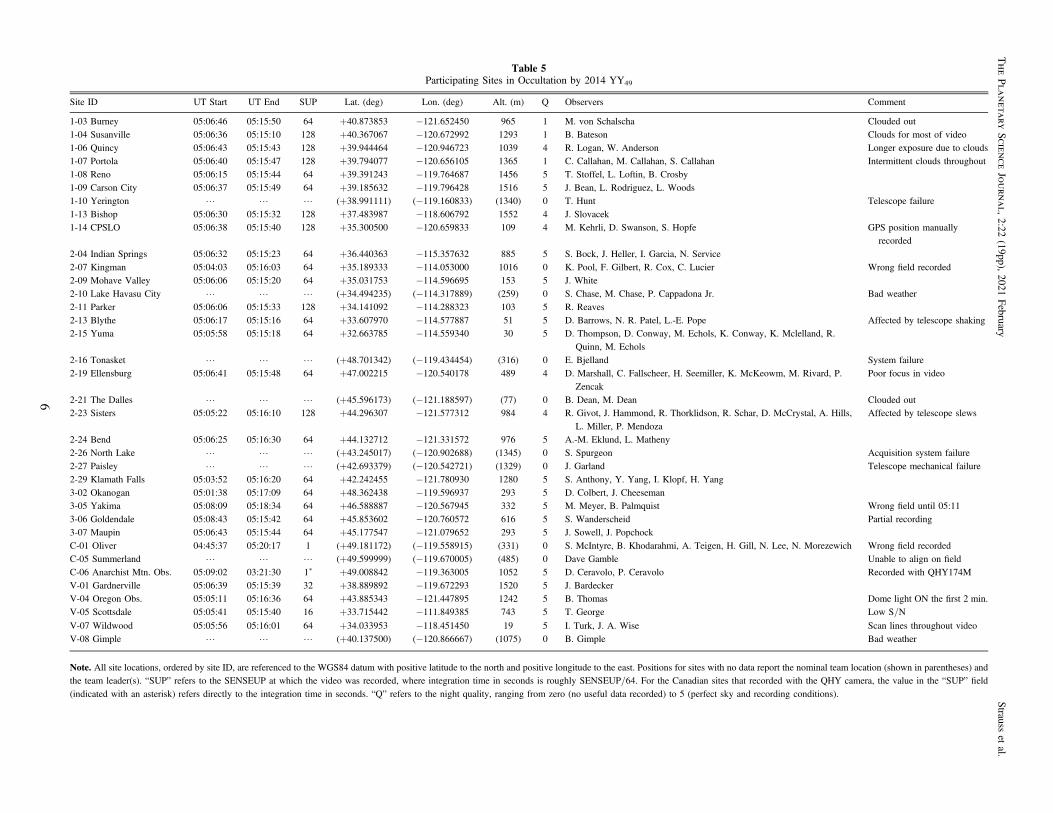
Table 5Participating Sites in Occultation by 2014 YY49
Site ID UT Start UT End SUP Lat. (deg) Lon. (deg) Alt. (m) Q Observers Comment
1-03 Burney 05:06:46 05:15:50 64 +40.873853 −121.652450 965 1 M. von Schalscha Clouded out
1-04 Susanville 05:06:36 05:15:10 128 +40.367067 −120.672992 1293 1 B. Bateson Clouds for most of video
1-06 Quincy 05:06:43 05:15:43 128 +39.944464 −120.946723 1039 4 R. Logan, W. Anderson Longer exposure due to clouds
1-07 Portola 05:06:40 05:15:47 128 +39.794077 −120.656105 1365 1 C. Callahan, M. Callahan, S. Callahan Intermittent clouds throughout
1-08 Reno 05:06:15 05:15:44 64 +39.391243 −119.764687 1456 5 T. Stoffel, L. Loftin, B. Crosby
1-09 Carson City 05:06:37 05:15:49 64 +39.185632 −119.796428 1516 5 J. Bean, L. Rodriguez, L. Woods
1-10 Yerington L L L (+38.991111) (−119.160833) (1340) 0 T. Hunt Telescope failure
1-13 Bishop 05:06:30 05:15:32 128 +37.483987 −118.606792 1552 4 J. Slovacek
1-14 CPSLO 05:06:38 05:15:40 128 +35.300500 −120.659833 109 4 M. Kehrli, D. Swanson, S. Hopfe GPS position manuallyrecorded
2-04 Indian Springs 05:06:32 05:15:23 64 +36.440363 −115.357632 885 5 S. Bock, J. Heller, I. Garcia, N. Service
2-07 Kingman 05:04:03 05:16:03 64 +35.189333 −114.053000 1016 0 K. Pool, F. Gilbert, R. Cox, C. Lucier Wrong field recorded
2-09 Mohave Valley 05:06:06 05:15:20 64 +35.031753 −114.596695 153 5 J. White
2-10 Lake Havasu City L L L (+34.494235) (−114.317889) (259) 0 S. Chase, M. Chase, P. Cappadona Jr. Bad weather
2-11 Parker 05:06:06 05:15:33 128 +34.141092 −114.288323 103 5 R. Reaves
2-13 Blythe 05:06:17 05:15:16 64 +33.607970 −114.577887 51 5 D. Barrows, N. R. Patel, L.-E. Pope Affected by telescope shaking2-15 Yuma 05:05:58 05:15:18 64 +32.663785 −114.559340 30 5 D. Thompson, D. Conway, M. Echols, K. Conway, K. Mclelland, R.
Quinn, M. Echols
2-16 Tonasket L L L (+48.701342) (−119.434454) (316) 0 E. Bjelland System failure
2-19 Ellensburg 05:06:41 05:15:48 64 +47.002215 −120.540178 489 4 D. Marshall, C. Fallscheer, H. Seemiller, K. McKeowm, M. Rivard, P.
Zencak
Poor focus in video
2-21 The Dalles L L L (+45.596173) (−121.188597) (77) 0 B. Dean, M. Dean Clouded out2-23 Sisters 05:05:22 05:16:10 128 +44.296307 −121.577312 984 4 R. Givot, J. Hammond, R. Thorklidson, R. Schar, D. McCrystal, A. Hills,
L. Miller, P. Mendoza
Affected by telescope slews
2-24 Bend 05:06:25 05:16:30 64 +44.132712 −121.331572 976 5 A.-M. Eklund, L. Matheny
2-26 North Lake L L L (+43.245017) (−120.902688) (1345) 0 S. Spurgeon Acquisition system failure
2-27 Paisley L L L (+42.693379) (−120.542721) (1329) 0 J. Garland Telescope mechanical failure
2-29 Klamath Falls 05:03:52 05:16:20 64 +42.242455 −121.780930 1280 5 S. Anthony, Y. Yang, I. Klopf, H. Yang
3-02 Okanogan 05:01:38 05:17:09 64 +48.362438 −119.596937 293 5 D. Colbert, J. Cheeseman3-05 Yakima 05:08:09 05:18:34 64 +46.588887 −120.567945 332 5 M. Meyer, B. Palmquist Wrong field until 05:11
3-06 Goldendale 05:08:43 05:15:42 64 +45.853602 −120.760572 616 5 S. Wanderscheid Partial recording
3-07 Maupin 05:06:43 05:15:44 64 +45.177547 −121.079652 293 5 J. Sowell, J. Popchock
C-01 Oliver 04:45:37 05:20:17 1 (+49.181172) (−119.558915) (331) 0 S. McIntyre, B. Khodarahmi, A. Teigen, H. Gill, N. Lee, N. Morezewich Wrong field recorded
C-05 Summerland L L L (+49.599999) (−119.670005) (485) 0 Dave Gamble Unable to align on field
C-06 Anarchist Mtn. Obs. 05:09:02 03:21:30 1* +49.008842 −119.363005 1052 5 D. Ceravolo, P. Ceravolo Recorded with QHY174M
V-01 Gardnerville 05:06:39 05:15:39 32 +38.889892 −119.672293 1520 5 J. BardeckerV-04 Oregon Obs. 05:05:11 05:16:36 64 +43.885343 −121.447895 1242 5 B. Thomas Dome light ON the first 2 min.
V-05 Scottsdale 05:05:41 05:15:40 16 +33.715442 −111.849385 743 5 T. George Low S/NV-07 Wildwood 05:05:56 05:16:01 64 +34.033953 −118.451450 19 5 I. Turk, J. A. Wise Scan lines throughout video
V-08 Gimple L L L (+40.137500) (−120.866667) (1075) 0 B. Gimple Bad weather
Note. All site locations, ordered by site ID, are referenced to the WGS84 datum with positive latitude to the north and positive longitude to the east. Positions for sites with no data report the nominal team location (shown in parentheses) andthe team leader(s). “SUP” refers to the SENSEUP at which the video was recorded, where integration time in seconds is roughly SENSEUP/64. For the Canadian sites that recorded with the QHY camera, the value in the “SUP” field
(indicated with an asterisk) refers directly to the integration time in seconds. “Q” refers to the night quality, ranging from zero (no useful data recorded) to 5 (perfect sky and recording conditions).
6
ThePla
neta
ryScien
ceJourn
al,
2:22(19pp),
2021February
Strauss
etal.
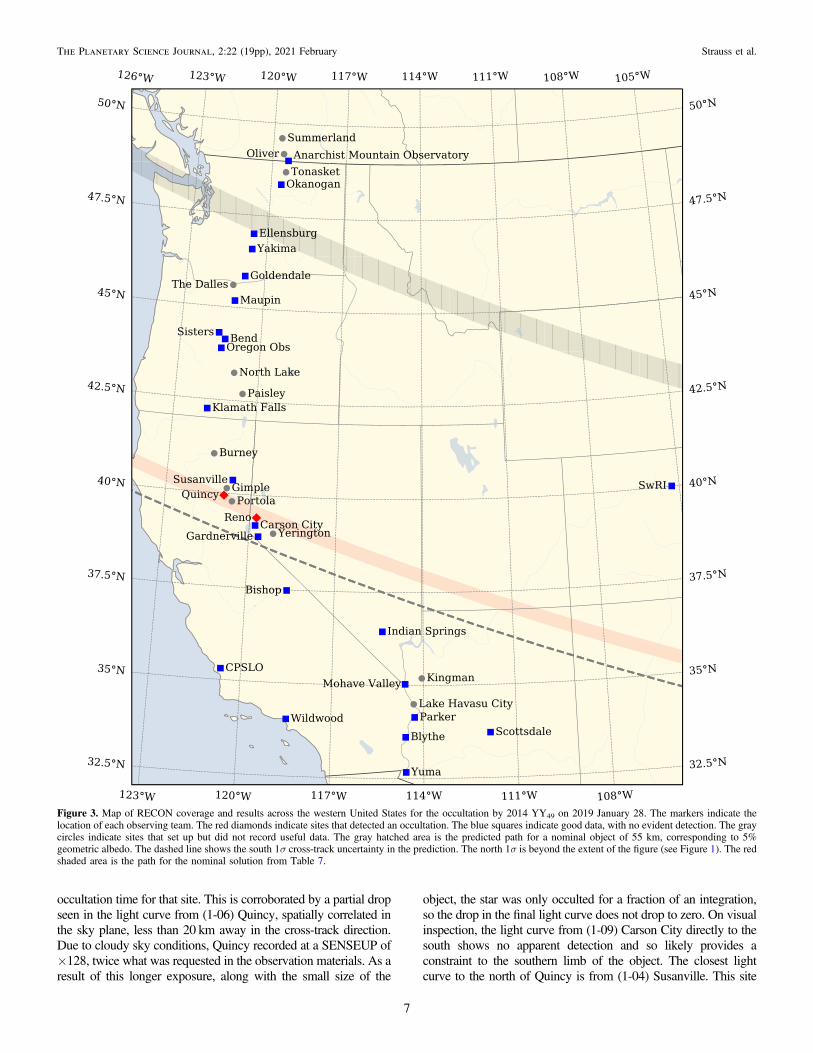
occultation time for that site. This is corroborated by a partial dropseen in the light curve from (1-06) Quincy, spatially correlated inthe sky plane, less than 20 km away in the cross-track direction.Due to cloudy sky conditions, Quincy recorded at a SENSEUP of×128, twice what was requested in the observation materials. As aresult of this longer exposure, along with the small size of the
object, the star was only occulted for a fraction of an integration,so the drop in the final light curve does not drop to zero. On visualinspection, the light curve from (1-09) Carson City directly to thesouth shows no apparent detection and so likely provides aconstraint to the southern limb of the object. The closest lightcurve to the north of Quincy is from (1-04) Susanville. This site
Figure 3. Map of RECON coverage and results across the western United States for the occultation by 2014 YY49 on 2019 January 28. The markers indicate thelocation of each observing team. The red diamonds indicate sites that detected an occultation. The blue squares indicate good data, with no evident detection. The graycircles indicate sites that set up but did not record useful data. The gray hatched area is the predicted path for a nominal object of 55 km, corresponding to 5%geometric albedo. The dashed line shows the south 1σ cross-track uncertainty in the prediction. The north 1σ is beyond the extent of the figure (see Figure 1). The redshaded area is the path for the nominal solution from Table 7.
7
The Planetary Science Journal, 2:22 (19pp), 2021 February Strauss et al.
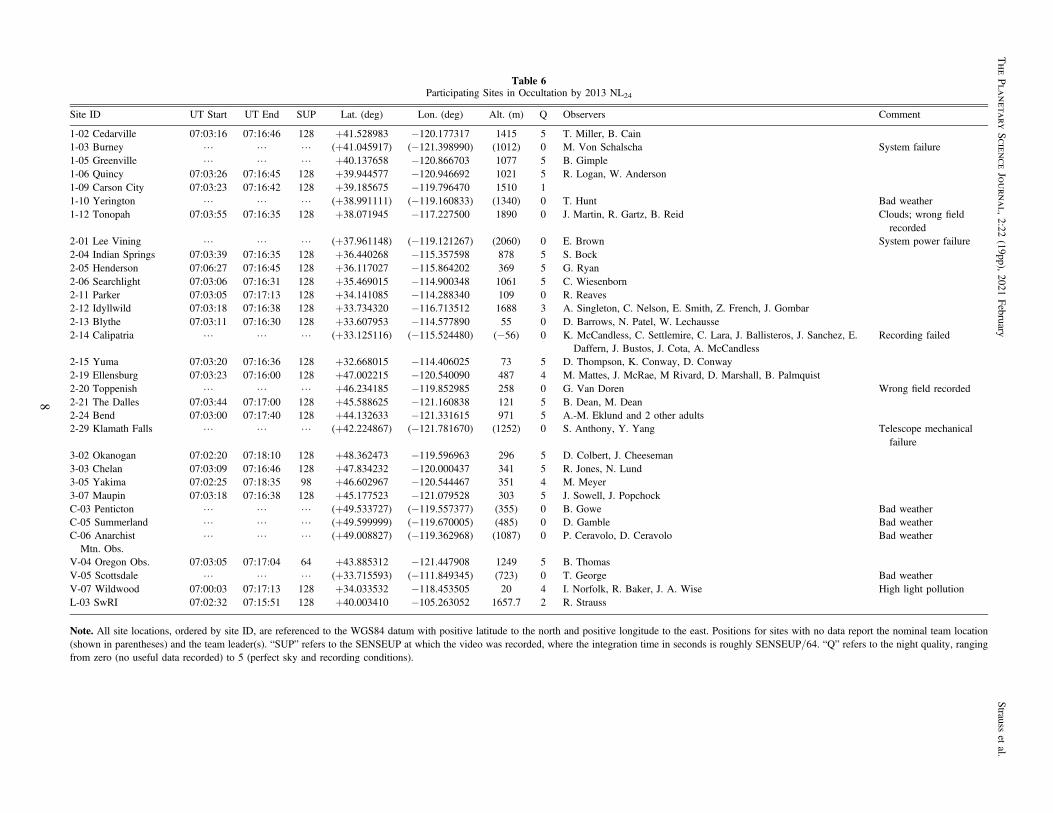
Table 6Participating Sites in Occultation by 2013 NL24
Site ID UT Start UT End SUP Lat. (deg) Lon. (deg) Alt. (m) Q Observers Comment
1-02 Cedarville 07:03:16 07:16:46 128 +41.528983 −120.177317 1415 5 T. Miller, B. Cain1-03 Burney L L L (+41.045917) (−121.398990) (1012) 0 M. Von Schalscha System failure1-05 Greenville L L L +40.137658 −120.866703 1077 5 B. Gimple1-06 Quincy 07:03:26 07:16:45 128 +39.944577 −120.946692 1021 5 R. Logan, W. Anderson1-09 Carson City 07:03:23 07:16:42 128 +39.185675 −119.796470 1510 11-10 Yerington L L L (+38.991111) (−119.160833) (1340) 0 T. Hunt Bad weather1-12 Tonopah 07:03:55 07:16:35 128 +38.071945 −117.227500 1890 0 J. Martin, R. Gartz, B. Reid Clouds; wrong field
recorded2-01 Lee Vining L L L (+37.961148) (−119.121267) (2060) 0 E. Brown System power failure2-04 Indian Springs 07:03:39 07:16:35 128 +36.440268 −115.357598 878 5 S. Bock2-05 Henderson 07:06:27 07:16:45 128 +36.117027 −115.864202 369 5 G. Ryan2-06 Searchlight 07:03:06 07:16:31 128 +35.469015 −114.900348 1061 5 C. Wiesenborn2-11 Parker 07:03:05 07:17:13 128 +34.141085 −114.288340 109 0 R. Reaves2-12 Idyllwild 07:03:18 07:16:38 128 +33.734320 −116.713512 1688 3 A. Singleton, C. Nelson, E. Smith, Z. French, J. Gombar2-13 Blythe 07:03:11 07:16:30 128 +33.607953 −114.577890 55 0 D. Barrows, N. Patel, W. Lechausse2-14 Calipatria L L L (+33.125116) (−115.524480) (−56) 0 K. McCandless, C. Settlemire, C. Lara, J. Ballisteros, J. Sanchez, E.
Daffern, J. Bustos, J. Cota, A. McCandlessRecording failed
2-15 Yuma 07:03:20 07:16:36 128 +32.668015 −114.406025 73 5 D. Thompson, K. Conway, D. Conway2-19 Ellensburg 07:03:23 07:16:00 128 +47.002215 −120.540090 487 4 M. Mattes, J. McRae, M Rivard, D. Marshall, B. Palmquist2-20 Toppenish L L L +46.234185 −119.852985 258 0 G. Van Doren Wrong field recorded2-21 The Dalles 07:03:44 07:17:00 128 +45.588625 −121.160838 121 5 B. Dean, M. Dean2-24 Bend 07:03:00 07:17:40 128 +44.132633 −121.331615 971 5 A.-M. Eklund and 2 other adults2-29 Klamath Falls L L L (+42.224867) (−121.781670) (1252) 0 S. Anthony, Y. Yang Telescope mechanical
failure3-02 Okanogan 07:02:20 07:18:10 128 +48.362473 −119.596963 296 5 D. Colbert, J. Cheeseman3-03 Chelan 07:03:09 07:16:46 128 +47.834232 −120.000437 341 5 R. Jones, N. Lund3-05 Yakima 07:02:25 07:18:35 98 +46.602967 −120.544467 351 4 M. Meyer3-07 Maupin 07:03:18 07:16:38 128 +45.177523 −121.079528 303 5 J. Sowell, J. PopchockC-03 Penticton L L L (+49.533727) (−119.557377) (355) 0 B. Gowe Bad weatherC-05 Summerland L L L (+49.599999) (−119.670005) (485) 0 D. Gamble Bad weatherC-06 AnarchistMtn. Obs.
L L L (+49.008827) (−119.362968) (1087) 0 P. Ceravolo, D. Ceravolo Bad weather
V-04 Oregon Obs. 07:03:05 07:17:04 64 +43.885312 −121.447908 1249 5 B. ThomasV-05 Scottsdale L L L (+33.715593) (−111.849345) (723) 0 T. George Bad weatherV-07 Wildwood 07:00:03 07:17:13 128 +34.033532 −118.453505 20 4 I. Norfolk, R. Baker, J. A. Wise High light pollutionL-03 SwRI 07:02:32 07:15:51 128 +40.003410 −105.263052 1657.7 2 R. Strauss
Note. All site locations, ordered by site ID, are referenced to the WGS84 datum with positive latitude to the north and positive longitude to the east. Positions for sites with no data report the nominal team location(shown in parentheses) and the team leader(s). “SUP” refers to the SENSEUP at which the video was recorded, where the integration time in seconds is roughly SENSEUP/64. “Q” refers to the night quality, rangingfrom zero (no useful data recorded) to 5 (perfect sky and recording conditions).
8
ThePla
neta
ryScien
ceJourn
al,
2:22(19pp),
2021February
Strauss
etal.
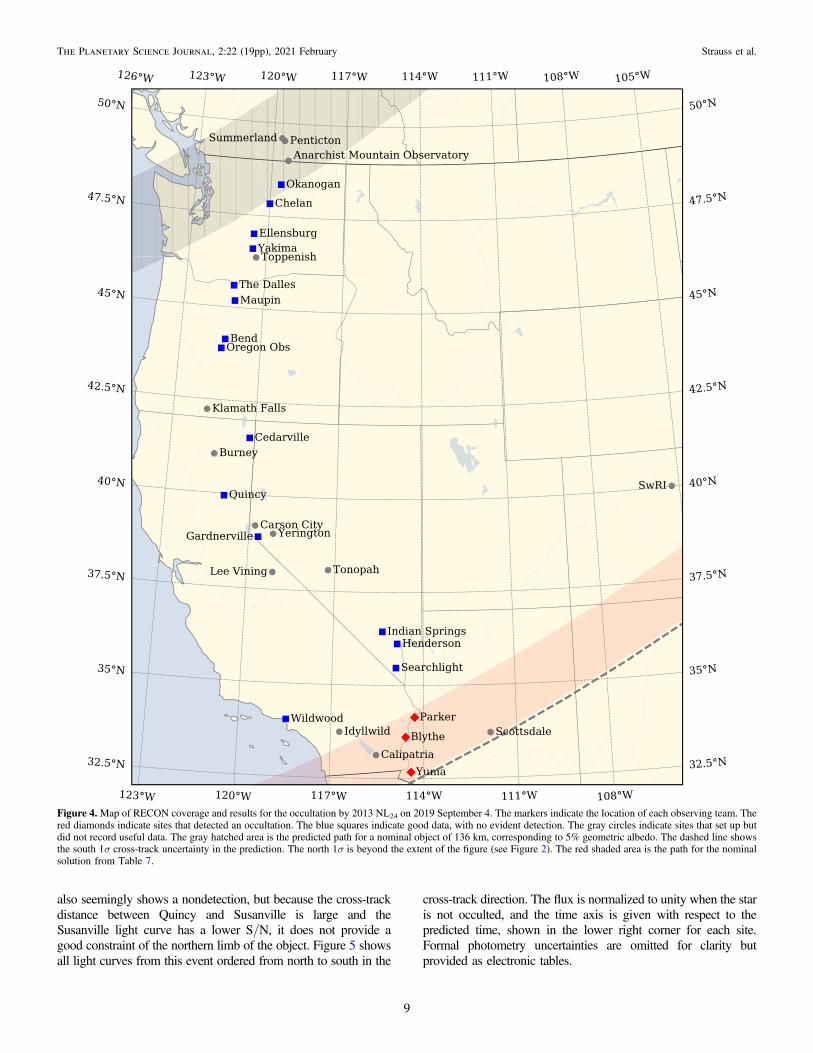
also seemingly shows a nondetection, but because the cross-trackdistance between Quincy and Susanville is large and theSusanville light curve has a lower S/N, it does not provide agood constraint of the northern limb of the object. Figure 5 showsall light curves from this event ordered from north to south in the
cross-track direction. The flux is normalized to unity when the staris not occulted, and the time axis is given with respect to thepredicted time, shown in the lower right corner for each site.Formal photometry uncertainties are omitted for clarity butprovided as electronic tables.
Figure 4.Map of RECON coverage and results for the occultation by 2013 NL24 on 2019 September 4. The markers indicate the location of each observing team. Thered diamonds indicate sites that detected an occultation. The blue squares indicate good data, with no evident detection. The gray circles indicate sites that set up butdid not record useful data. The gray hatched area is the predicted path for a nominal object of 136 km, corresponding to 5% geometric albedo. The dashed line showsthe south 1σ cross-track uncertainty in the prediction. The north 1σ is beyond the extent of the figure (see Figure 2). The red shaded area is the path for the nominalsolution from Table 7.
9
The Planetary Science Journal, 2:22 (19pp), 2021 February Strauss et al.
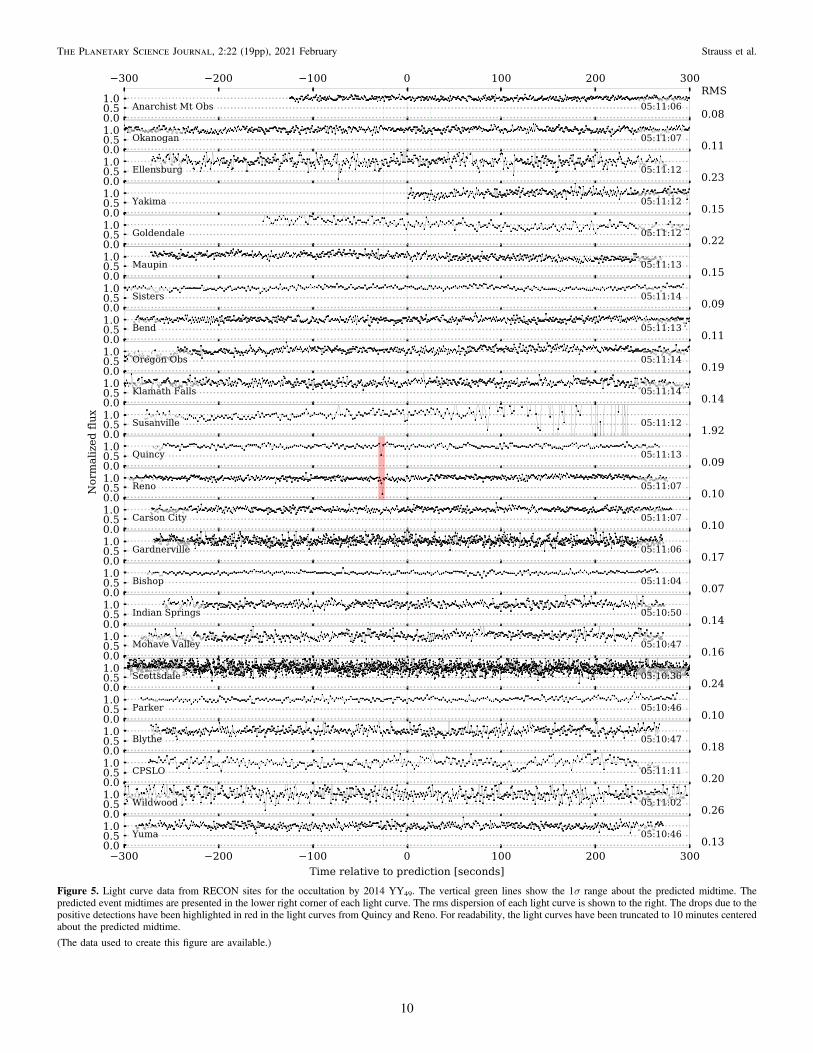
Figure 5. Light curve data from RECON sites for the occultation by 2014 YY49. The vertical green lines show the 1σ range about the predicted midtime. Thepredicted event midtimes are presented in the lower right corner of each light curve. The rms dispersion of each light curve is shown to the right. The drops due to thepositive detections have been highlighted in red in the light curves from Quincy and Reno. For readability, the light curves have been truncated to 10 minutes centeredabout the predicted midtime.
(The data used to create this figure are available.)
10
The Planetary Science Journal, 2:22 (19pp), 2021 February Strauss et al.
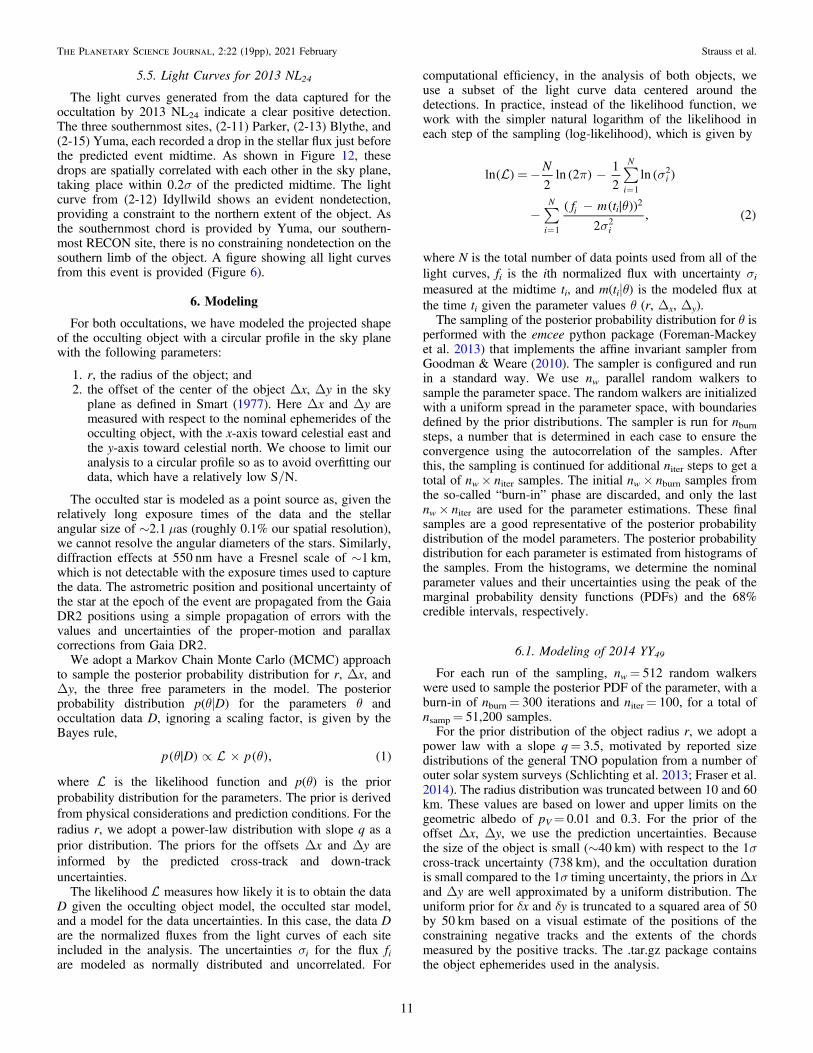
5.5. Light Curves for 2013 NL24
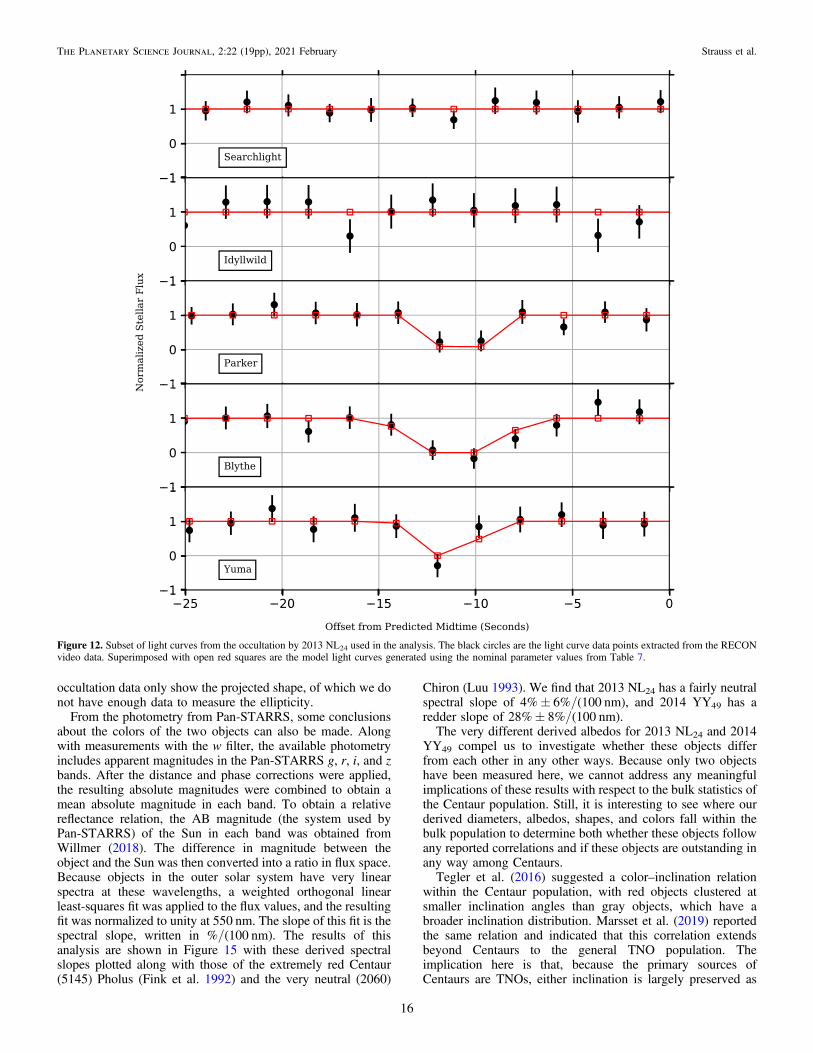
The light curves generated from the data captured for theoccultation by 2013 NL24 indicate a clear positive detection.The three southernmost sites, (2-11) Parker, (2-13) Blythe, and(2-15) Yuma, each recorded a drop in the stellar flux just beforethe predicted event midtime. As shown in Figure 12, thesedrops are spatially correlated with each other in the sky plane,taking place within 0.2σ of the predicted midtime. The lightcurve from (2-12) Idyllwild shows an evident nondetection,providing a constraint to the northern extent of the object. Asthe southernmost chord is provided by Yuma, our southern-most RECON site, there is no constraining nondetection on thesouthern limb of the object. A figure showing all light curvesfrom this event is provided (Figure 6).
6. Modeling
For both occultations, we have modeled the projected shapeof the occulting object with a circular profile in the sky planewith the following parameters:
1. r, the radius of the object; and2. the offset of the center of the object Δx, Δy in the sky
plane as defined in Smart (1977). Here Δx and Δy aremeasured with respect to the nominal ephemerides of theocculting object, with the x-axis toward celestial east andthe y-axis toward celestial north. We choose to limit ouranalysis to a circular profile so as to avoid overfitting ourdata, which have a relatively low S/N.
The occulted star is modeled as a point source as, given therelatively long exposure times of the data and the stellarangular size of ∼2.1 μas (roughly 0.1% our spatial resolution),we cannot resolve the angular diameters of the stars. Similarly,diffraction effects at 550 nm have a Fresnel scale of ∼1 km,which is not detectable with the exposure times used to capturethe data. The astrometric position and positional uncertainty ofthe star at the epoch of the event are propagated from the GaiaDR2 positions using a simple propagation of errors with thevalues and uncertainties of the proper-motion and parallaxcorrections from Gaia DR2.
We adopt a Markov Chain Monte Carlo (MCMC) approachto sample the posterior probability distribution for r, Δx, andΔy, the three free parameters in the model. The posteriorprobability distribution p(θ|D) for the parameters θ andoccultation data D, ignoring a scaling factor, is given by theBayes rule,
q qµ ´p D p , 1( ∣ ) ( ) ( )
where is the likelihood function and p(θ) is the priorprobability distribution for the parameters. The prior is derivedfrom physical considerations and prediction conditions. For theradius r, we adopt a power-law distribution with slope q as aprior distribution. The priors for the offsets Δx and Δy areinformed by the predicted cross-track and down-trackuncertainties.
The likelihood measures how likely it is to obtain the dataD given the occulting object model, the occulted star model,and a model for the data uncertainties. In this case, the data Dare the normalized fluxes from the light curves of each siteincluded in the analysis. The uncertainties σi for the flux fiare modeled as normally distributed and uncorrelated. For
computational efficiency, in the analysis of both objects, weuse a subset of the light curve data centered around thedetections. In practice, instead of the likelihood function, wework with the simpler natural logarithm of the likelihood ineach step of the sampling (log-likelihood), which is given by
å
å
p s
qs
=- -
--
=
=
N
f m t
ln2
ln 21
2ln
2, 2
i
N
i
i
Ni i
i
1
2
1
2
2
( ) ( ) ( )
( ( ∣ ))( )
where N is the total number of data points used from all of thelight curves, fi is the ith normalized flux with uncertainty σimeasured at the midtime ti, and m(ti|θ) is the modeled flux atthe time ti given the parameter values θ (r, Δx, Δy).The sampling of the posterior probability distribution for θ is
performed with the emcee python package (Foreman-Mackeyet al. 2013) that implements the affine invariant sampler fromGoodman & Weare (2010). The sampler is configured and runin a standard way. We use nw parallel random walkers tosample the parameter space. The random walkers are initializedwith a uniform spread in the parameter space, with boundariesdefined by the prior distributions. The sampler is run for nburnsteps, a number that is determined in each case to ensure theconvergence using the autocorrelation of the samples. Afterthis, the sampling is continued for additional niter steps to get atotal of nw× niter samples. The initial nw× nburn samples fromthe so-called “burn-in” phase are discarded, and only the lastnw× niter are used for the parameter estimations. These finalsamples are a good representative of the posterior probabilitydistribution of the model parameters. The posterior probabilitydistribution for each parameter is estimated from histograms ofthe samples. From the histograms, we determine the nominalparameter values and their uncertainties using the peak of themarginal probability density functions (PDFs) and the 68%credible intervals, respectively.
6.1. Modeling of 2014 YY49
For each run of the sampling, nw= 512 random walkerswere used to sample the posterior PDF of the parameter, with aburn-in of nburn= 300 iterations and niter= 100, for a total ofnsamp= 51,200 samples.For the prior distribution of the object radius r, we adopt a
power law with a slope q= 3.5, motivated by reported sizedistributions of the general TNO population from a number ofouter solar system surveys (Schlichting et al. 2013; Fraser et al.2014). The radius distribution was truncated between 10 and 60km. These values are based on lower and upper limits on thegeometric albedo of pV= 0.01 and 0.3. For the prior of theoffset Δx, Δy, we use the prediction uncertainties. Becausethe size of the object is small (∼40 km) with respect to the 1σcross-track uncertainty (738 km), and the occultation durationis small compared to the 1σ timing uncertainty, the priors inΔxand Δy are well approximated by a uniform distribution. Theuniform prior for δx and δy is truncated to a squared area of 50by 50 km based on a visual estimate of the positions of theconstraining negative tracks and the extents of the chordsmeasured by the positive tracks. The .tar.gz package containsthe object ephemerides used in the analysis.
11
The Planetary Science Journal, 2:22 (19pp), 2021 February Strauss et al.
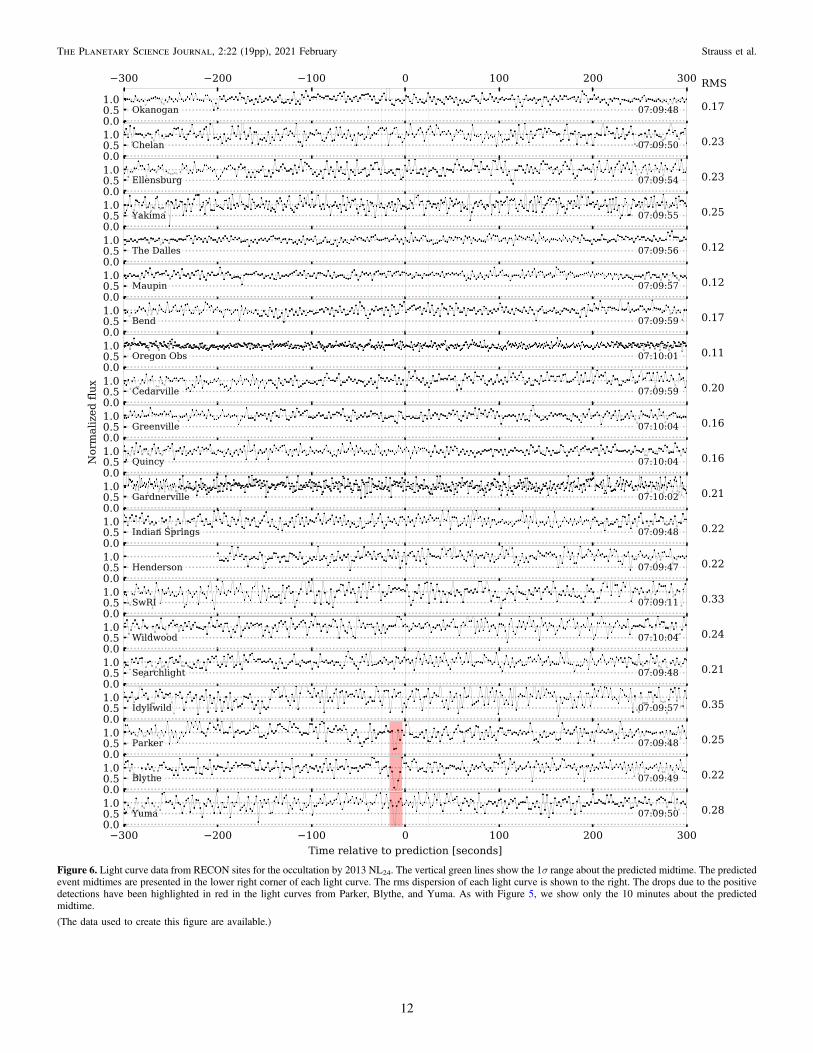
Figure 6. Light curve data from RECON sites for the occultation by 2013 NL24. The vertical green lines show the 1σ range about the predicted midtime. The predictedevent midtimes are presented in the lower right corner of each light curve. The rms dispersion of each light curve is shown to the right. The drops due to the positivedetections have been highlighted in red in the light curves from Parker, Blythe, and Yuma. As with Figure 5, we show only the 10 minutes about the predictedmidtime.
(The data used to create this figure are available.)
12
The Planetary Science Journal, 2:22 (19pp), 2021 February Strauss et al.
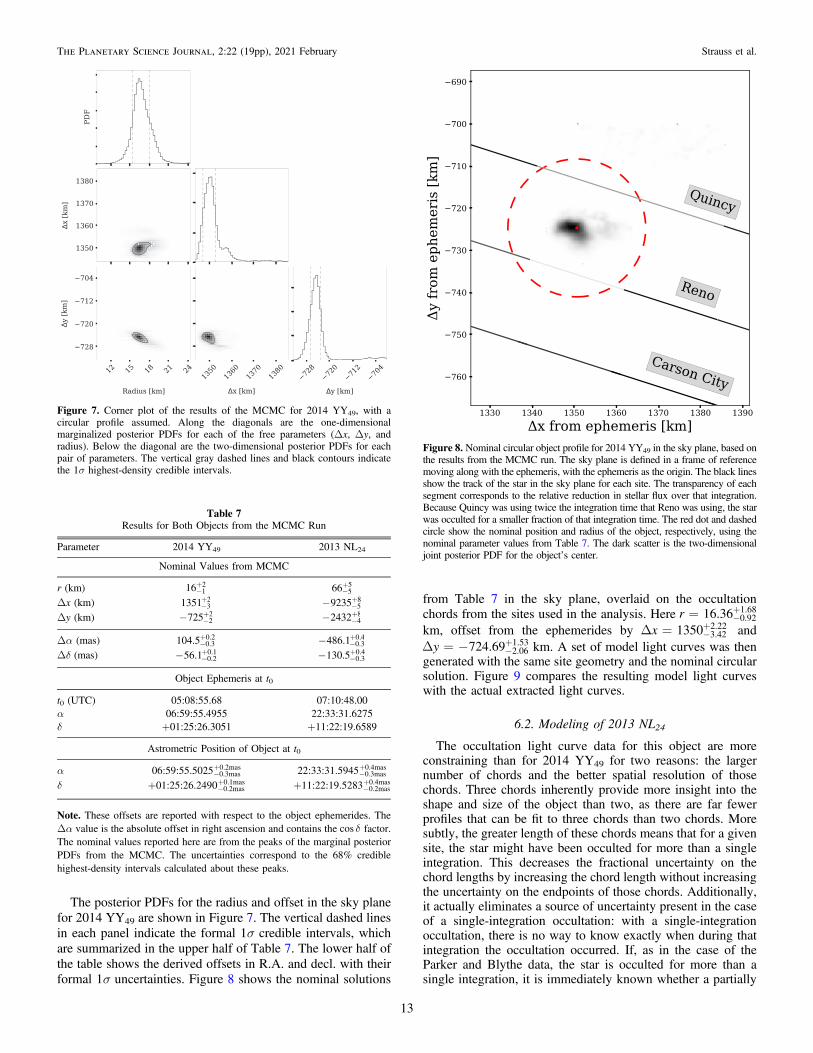
The posterior PDFs for the radius and offset in the sky planefor 2014 YY49 are shown in Figure 7. The vertical dashed linesin each panel indicate the formal 1σ credible intervals, whichare summarized in the upper half of Table 7. The lower half ofthe table shows the derived offsets in R.A. and decl. with theirformal 1σ uncertainties. Figure 8 shows the nominal solutions
from Table 7 in the sky plane, overlaid on the occultationchords from the sites used in the analysis. Here = -
+r 16.36 0.921.68
km, offset from the ephemerides by D = -+x 1350 3.42
2.22 andD = - -
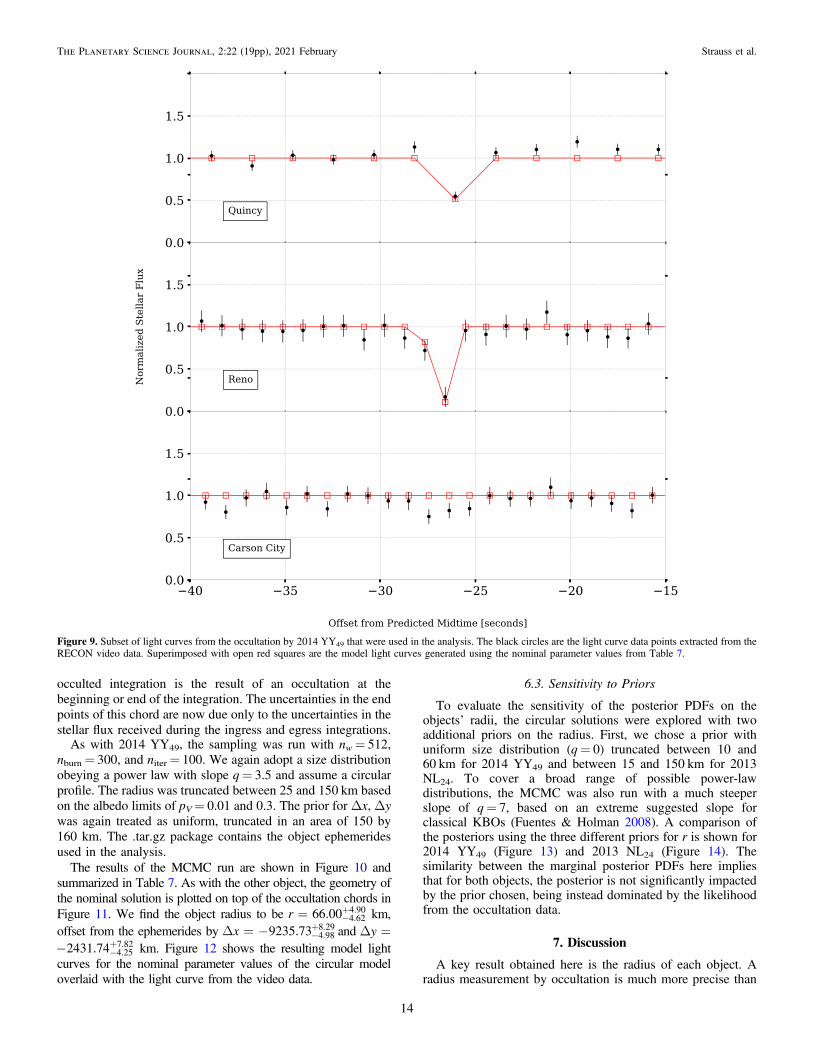
+y 724.69 2.061.53 km. A set of model light curves was then
generated with the same site geometry and the nominal circularsolution. Figure 9 compares the resulting model light curveswith the actual extracted light curves.
6.2. Modeling of 2013 NL24
The occultation light curve data for this object are moreconstraining than for 2014 YY49 for two reasons: the largernumber of chords and the better spatial resolution of thosechords. Three chords inherently provide more insight into theshape and size of the object than two, as there are far fewerprofiles that can be fit to three chords than two chords. Moresubtly, the greater length of these chords means that for a givensite, the star might have been occulted for more than a singleintegration. This decreases the fractional uncertainty on thechord lengths by increasing the chord length without increasingthe uncertainty on the endpoints of those chords. Additionally,it actually eliminates a source of uncertainty present in the caseof a single-integration occultation: with a single-integrationoccultation, there is no way to know exactly when during thatintegration the occultation occurred. If, as in the case of theParker and Blythe data, the star is occulted for more than asingle integration, it is immediately known whether a partially
Figure 7. Corner plot of the results of the MCMC for 2014 YY49, with acircular profile assumed. Along the diagonals are the one-dimensionalmarginalized posterior PDFs for each of the free parameters (Δx, Δy, andradius). Below the diagonal are the two-dimensional posterior PDFs for eachpair of parameters. The vertical gray dashed lines and black contours indicatethe 1σ highest-density credible intervals.
Table 7Results for Both Objects from the MCMC Run
Parameter 2014 YY49 2013 NL24
Nominal Values from MCMC
r (km) -+16 1
2-+66 5
5
Δx (km) -+1351 3
2 - -+9235 5
8
Δy (km) - -+725 2
2 - -+2432 4
8
Δα (mas) -+104.5 0.3
0.2 - -+486.1 0.3
0.4
Δδ (mas) - -+56.1 0.2
0.1 - -+130.5 0.3
0.4
Object Ephemeris at t0
t0 (UTC) 05:08:55.68 07:10:48.00α 06:59:55.4955 22:33:31.6275δ +01:25:26.3051 +11:22:19.6589
Astrometric Position of Object at t0
α 06:59:55.5025-+
0.3mas0.2mas 22:33:31.5945-
+0.3mas0.4mas
δ +01:25:26.2490-+
0.2mas0.1mas +11:22:19.5283-
+0.2mas0.4mas
Note. These offsets are reported with respect to the object ephemerides. TheΔα value is the absolute offset in right ascension and contains the dcos factor.The nominal values reported here are from the peaks of the marginal posteriorPDFs from the MCMC. The uncertainties correspond to the 68% crediblehighest-density intervals calculated about these peaks.
Figure 8. Nominal circular object profile for 2014 YY49 in the sky plane, based onthe results from the MCMC run. The sky plane is defined in a frame of referencemoving along with the ephemeris, with the ephemeris as the origin. The black linesshow the track of the star in the sky plane for each site. The transparency of eachsegment corresponds to the relative reduction in stellar flux over that integration.Because Quincy was using twice the integration time that Reno was using, the starwas occulted for a smaller fraction of that integration time. The red dot and dashedcircle show the nominal position and radius of the object, respectively, using thenominal parameter values from Table 7. The dark scatter is the two-dimensionaljoint posterior PDF for the object’s center.
13
The Planetary Science Journal, 2:22 (19pp), 2021 February Strauss et al.
occulted integration is the result of an occultation at thebeginning or end of the integration. The uncertainties in the endpoints of this chord are now due only to the uncertainties in thestellar flux received during the ingress and egress integrations.
As with 2014 YY49, the sampling was run with nw= 512,nburn= 300, and niter= 100. We again adopt a size distributionobeying a power law with slope q= 3.5 and assume a circularprofile. The radius was truncated between 25 and 150 km basedon the albedo limits of pV= 0.01 and 0.3. The prior for Δx, Δywas again treated as uniform, truncated in an area of 150 by160 km. The .tar.gz package contains the object ephemeridesused in the analysis.
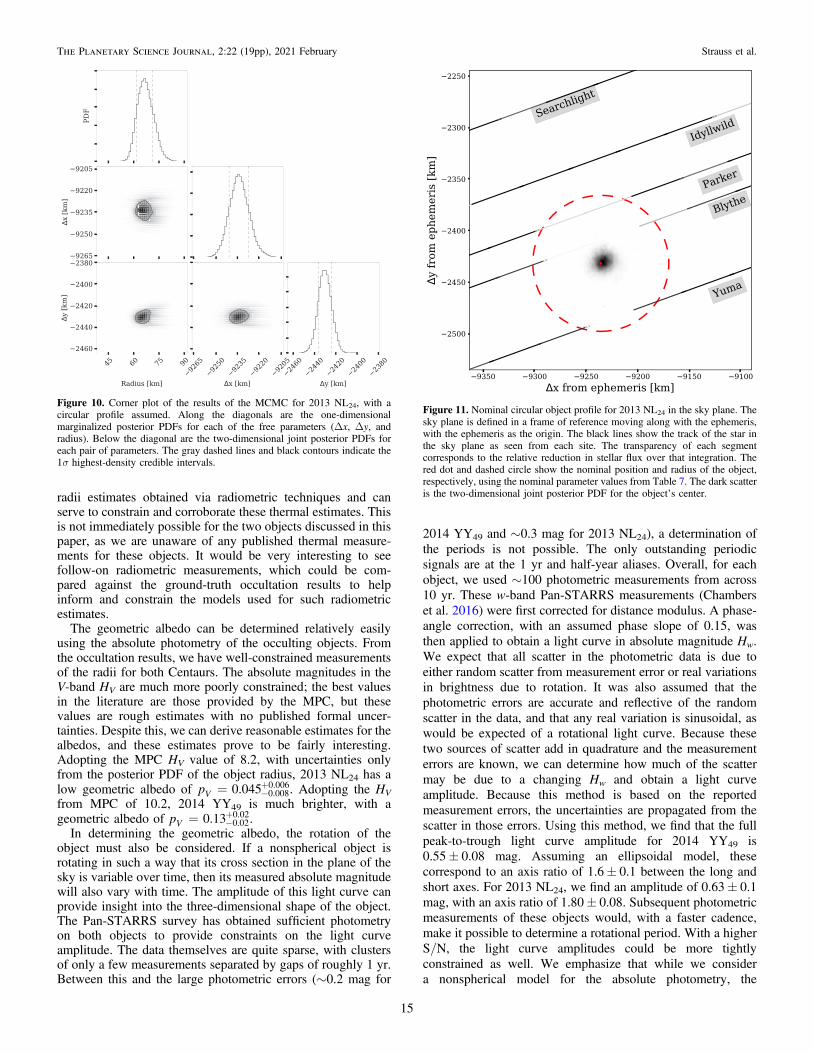
The results of the MCMC run are shown in Figure 10 andsummarized in Table 7. As with the other object, the geometry ofthe nominal solution is plotted on top of the occultation chords inFigure 11. We find the object radius to be = -
+r 66.00 4.624.90 km,
offset from the ephemerides by D = - -+x 9235.73 4.98
8.29 and D =y- -
+2431.74 4.257.82 km. Figure 12 shows the resulting model light
curves for the nominal parameter values of the circular modeloverlaid with the light curve from the video data.
6.3. Sensitivity to Priors
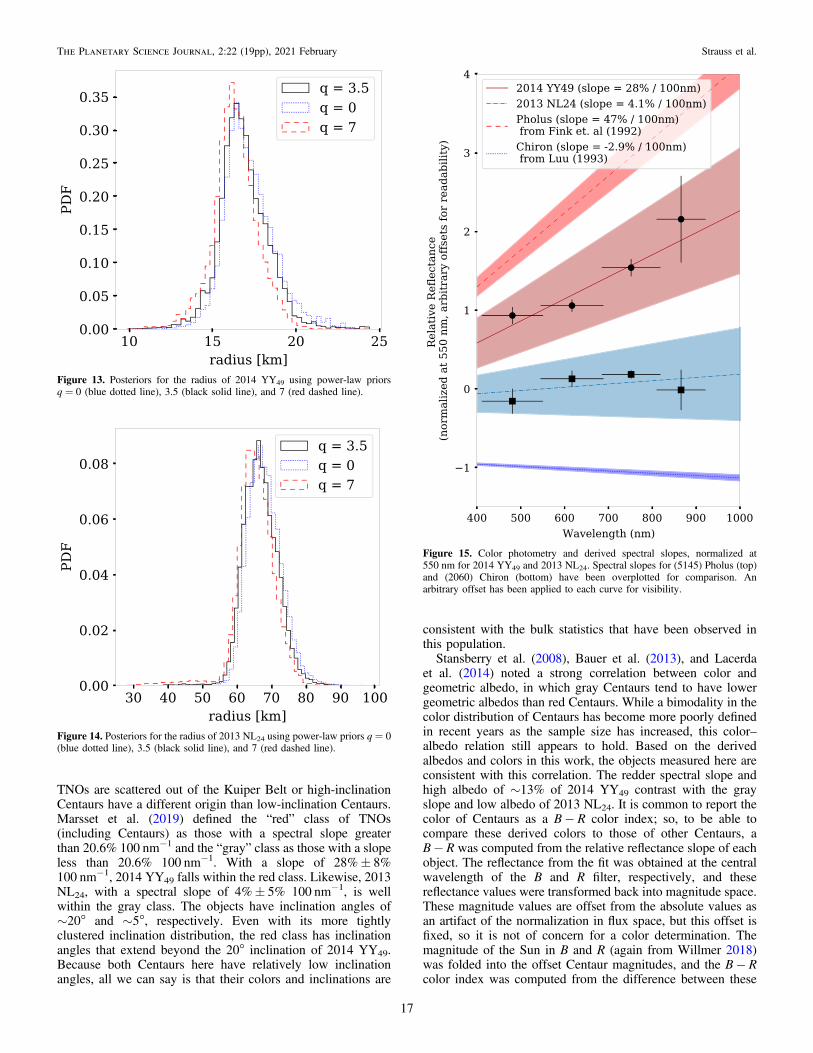
To evaluate the sensitivity of the posterior PDFs on theobjects’ radii, the circular solutions were explored with twoadditional priors on the radius. First, we chose a prior withuniform size distribution (q= 0) truncated between 10 and60 km for 2014 YY49 and between 15 and 150 km for 2013NL24. To cover a broad range of possible power-lawdistributions, the MCMC was also run with a much steeperslope of q= 7, based on an extreme suggested slope forclassical KBOs (Fuentes & Holman 2008). A comparison ofthe posteriors using the three different priors for r is shown for2014 YY49 (Figure 13) and 2013 NL24 (Figure 14). Thesimilarity between the marginal posterior PDFs here impliesthat for both objects, the posterior is not significantly impactedby the prior chosen, being instead dominated by the likelihoodfrom the occultation data.
7. Discussion
A key result obtained here is the radius of each object. Aradius measurement by occultation is much more precise than
Figure 9. Subset of light curves from the occultation by 2014 YY49 that were used in the analysis. The black circles are the light curve data points extracted from theRECON video data. Superimposed with open red squares are the model light curves generated using the nominal parameter values from Table 7.
14
The Planetary Science Journal, 2:22 (19pp), 2021 February Strauss et al.
radii estimates obtained via radiometric techniques and canserve to constrain and corroborate these thermal estimates. Thisis not immediately possible for the two objects discussed in thispaper, as we are unaware of any published thermal measure-ments for these objects. It would be very interesting to seefollow-on radiometric measurements, which could be com-pared against the ground-truth occultation results to helpinform and constrain the models used for such radiometricestimates.
The geometric albedo can be determined relatively easilyusing the absolute photometry of the occulting objects. Fromthe occultation results, we have well-constrained measurementsof the radii for both Centaurs. The absolute magnitudes in theV-band HV are much more poorly constrained; the best valuesin the literature are those provided by the MPC, but thesevalues are rough estimates with no published formal uncer-tainties. Despite this, we can derive reasonable estimates for thealbedos, and these estimates prove to be fairly interesting.Adopting the MPC HV value of 8.2, with uncertainties onlyfrom the posterior PDF of the object radius, 2013 NL24 has alow geometric albedo of = -
+p 0.045V 0.0080.006. Adopting the HV
from MPC of 10.2, 2014 YY49 is much brighter, with ageometric albedo of = -
+p 0.13V 0.020.02.
In determining the geometric albedo, the rotation of theobject must also be considered. If a nonspherical object isrotating in such a way that its cross section in the plane of thesky is variable over time, then its measured absolute magnitudewill also vary with time. The amplitude of this light curve canprovide insight into the three-dimensional shape of the object.The Pan-STARRS survey has obtained sufficient photometryon both objects to provide constraints on the light curveamplitude. The data themselves are quite sparse, with clustersof only a few measurements separated by gaps of roughly 1 yr.Between this and the large photometric errors (∼0.2 mag for
2014 YY49 and ∼0.3 mag for 2013 NL24), a determination ofthe periods is not possible. The only outstanding periodicsignals are at the 1 yr and half-year aliases. Overall, for eachobject, we used ∼100 photometric measurements from across10 yr. These w-band Pan-STARRS measurements (Chamberset al. 2016) were first corrected for distance modulus. A phase-angle correction, with an assumed phase slope of 0.15, wasthen applied to obtain a light curve in absolute magnitude Hw.We expect that all scatter in the photometric data is due toeither random scatter from measurement error or real variationsin brightness due to rotation. It was also assumed that thephotometric errors are accurate and reflective of the randomscatter in the data, and that any real variation is sinusoidal, aswould be expected of a rotational light curve. Because thesetwo sources of scatter add in quadrature and the measurementerrors are known, we can determine how much of the scattermay be due to a changing Hw and obtain a light curveamplitude. Because this method is based on the reportedmeasurement errors, the uncertainties are propagated from thescatter in those errors. Using this method, we find that the fullpeak-to-trough light curve amplitude for 2014 YY49 is0.55± 0.08 mag. Assuming an ellipsoidal model, thesecorrespond to an axis ratio of 1.6± 0.1 between the long andshort axes. For 2013 NL24, we find an amplitude of 0.63± 0.1mag, with an axis ratio of 1.80± 0.08. Subsequent photometricmeasurements of these objects would, with a faster cadence,make it possible to determine a rotational period. With a higherS/N, the light curve amplitudes could be more tightlyconstrained as well. We emphasize that while we considera nonspherical model for the absolute photometry, the
Figure 10. Corner plot of the results of the MCMC for 2013 NL24, with acircular profile assumed. Along the diagonals are the one-dimensionalmarginalized posterior PDFs for each of the free parameters (Δx, Δy, andradius). Below the diagonal are the two-dimensional joint posterior PDFs foreach pair of parameters. The gray dashed lines and black contours indicate the1σ highest-density credible intervals.
Figure 11. Nominal circular object profile for 2013 NL24 in the sky plane. Thesky plane is defined in a frame of reference moving along with the ephemeris,with the ephemeris as the origin. The black lines show the track of the star inthe sky plane as seen from each site. The transparency of each segmentcorresponds to the relative reduction in stellar flux over that integration. Thered dot and dashed circle show the nominal position and radius of the object,respectively, using the nominal parameter values from Table 7. The dark scatteris the two-dimensional joint posterior PDF for the object’s center.
15
The Planetary Science Journal, 2:22 (19pp), 2021 February Strauss et al.
occultation data only show the projected shape, of which we donot have enough data to measure the ellipticity.
From the photometry from Pan-STARRS, some conclusionsabout the colors of the two objects can also be made. Alongwith measurements with the w filter, the available photometryincludes apparent magnitudes in the Pan-STARRS g, r, i, and zbands. After the distance and phase corrections were applied,the resulting absolute magnitudes were combined to obtain amean absolute magnitude in each band. To obtain a relativereflectance relation, the AB magnitude (the system used byPan-STARRS) of the Sun in each band was obtained fromWillmer (2018). The difference in magnitude between theobject and the Sun was then converted into a ratio in flux space.Because objects in the outer solar system have very linearspectra at these wavelengths, a weighted orthogonal linearleast-squares fit was applied to the flux values, and the resultingfit was normalized to unity at 550 nm. The slope of this fit is thespectral slope, written in %/(100 nm). The results of thisanalysis are shown in Figure 15 with these derived spectralslopes plotted along with those of the extremely red Centaur(5145) Pholus (Fink et al. 1992) and the very neutral (2060)
Chiron (Luu 1993). We find that 2013 NL24 has a fairly neutralspectral slope of 4%± 6%/(100 nm), and 2014 YY49 has aredder slope of 28%± 8%/(100 nm).The very different derived albedos for 2013 NL24 and 2014
YY49 compel us to investigate whether these objects differfrom each other in any other ways. Because only two objectshave been measured here, we cannot address any meaningfulimplications of these results with respect to the bulk statistics ofthe Centaur population. Still, it is interesting to see where ourderived diameters, albedos, shapes, and colors fall within thebulk population to determine both whether these objects followany reported correlations and if these objects are outstanding inany way among Centaurs.Tegler et al. (2016) suggested a color–inclination relation
within the Centaur population, with red objects clustered atsmaller inclination angles than gray objects, which have abroader inclination distribution. Marsset et al. (2019) reportedthe same relation and indicated that this correlation extendsbeyond Centaurs to the general TNO population. Theimplication here is that, because the primary sources ofCentaurs are TNOs, either inclination is largely preserved as
Figure 12. Subset of light curves from the occultation by 2013 NL24 used in the analysis. The black circles are the light curve data points extracted from the RECONvideo data. Superimposed with open red squares are the model light curves generated using the nominal parameter values from Table 7.
16
The Planetary Science Journal, 2:22 (19pp), 2021 February Strauss et al.
TNOs are scattered out of the Kuiper Belt or high-inclinationCentaurs have a different origin than low-inclination Centaurs.Marsset et al. (2019) defined the “red” class of TNOs(including Centaurs) as those with a spectral slope greaterthan 20.6% 100 nm−1 and the “gray” class as those with a slopeless than 20.6% 100 nm−1. With a slope of 28%± 8%100 nm−1, 2014 YY49 falls within the red class. Likewise, 2013NL24, with a spectral slope of 4%± 5% 100 nm−1, is wellwithin the gray class. The objects have inclination angles of∼20° and ∼5°, respectively. Even with its more tightlyclustered inclination distribution, the red class has inclinationangles that extend beyond the 20° inclination of 2014 YY49.Because both Centaurs here have relatively low inclinationangles, all we can say is that their colors and inclinations are
consistent with the bulk statistics that have been observed inthis population.Stansberry et al. (2008), Bauer et al. (2013), and Lacerda
et al. (2014) noted a strong correlation between color andgeometric albedo, in which gray Centaurs tend to have lowergeometric albedos than red Centaurs. While a bimodality in thecolor distribution of Centaurs has become more poorly definedin recent years as the sample size has increased, this color–albedo relation still appears to hold. Based on the derivedalbedos and colors in this work, the objects measured here areconsistent with this correlation. The redder spectral slope andhigh albedo of ∼13% of 2014 YY49 contrast with the grayslope and low albedo of 2013 NL24. It is common to report thecolor of Centaurs as a B− R color index; so, to be able tocompare these derived colors to those of other Centaurs, aB− R was computed from the relative reflectance slope of eachobject. The reflectance from the fit was obtained at the centralwavelength of the B and R filter, respectively, and thesereflectance values were transformed back into magnitude space.These magnitude values are offset from the absolute values asan artifact of the normalization in flux space, but this offset isfixed, so it is not of concern for a color determination. Themagnitude of the Sun in B and R (again from Willmer 2018)was folded into the offset Centaur magnitudes, and the B− Rcolor index was computed from the difference between these
Figure 13. Posteriors for the radius of 2014 YY49 using power-law priorsq = 0 (blue dotted line), 3.5 (black solid line), and 7 (red dashed line).
Figure 14. Posteriors for the radius of 2013 NL24 using power-law priors q = 0(blue dotted line), 3.5 (black solid line), and 7 (red dashed line).
Figure 15. Color photometry and derived spectral slopes, normalized at550 nm for 2014 YY49 and 2013 NL24. Spectral slopes for (5145) Pholus (top)and (2060) Chiron (bottom) have been overplotted for comparison. Anarbitrary offset has been applied to each curve for visibility.
17
The Planetary Science Journal, 2:22 (19pp), 2021 February Strauss et al.
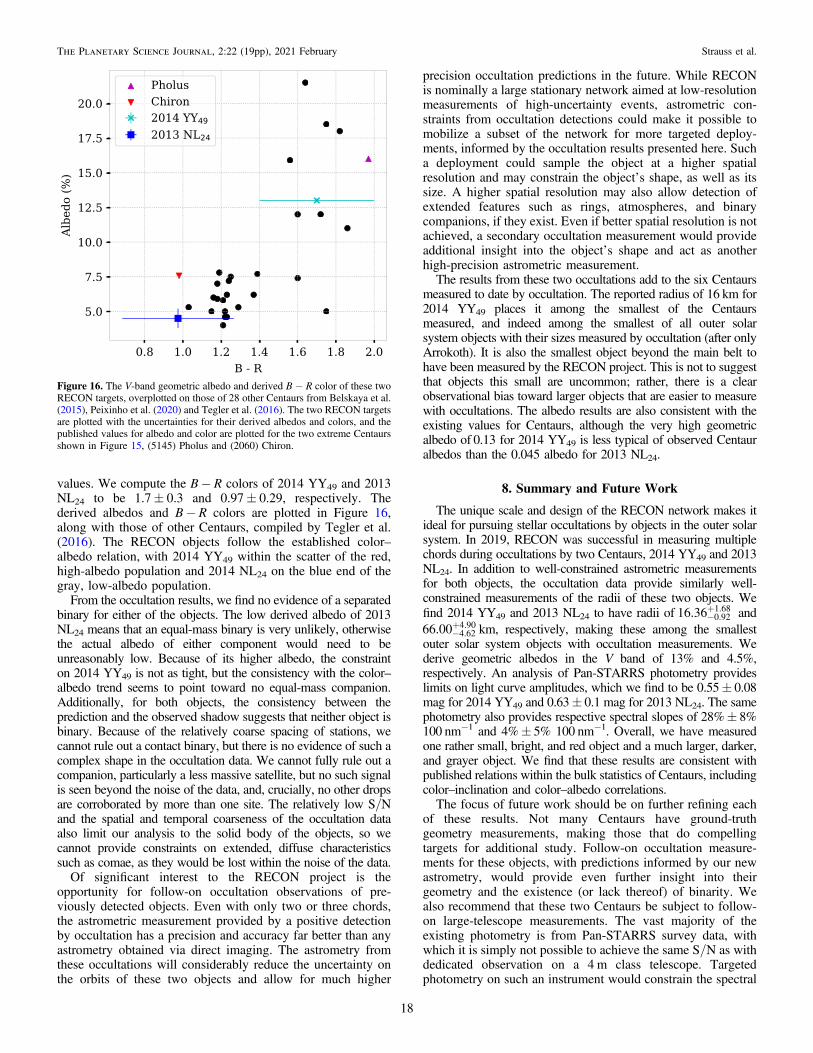
values. We compute the B− R colors of 2014 YY49 and 2013NL24 to be 1.7± 0.3 and 0.97± 0.29, respectively. Thederived albedos and B− R colors are plotted in Figure 16,along with those of other Centaurs, compiled by Tegler et al.(2016). The RECON objects follow the established color–albedo relation, with 2014 YY49 within the scatter of the red,high-albedo population and 2014 NL24 on the blue end of thegray, low-albedo population.
From the occultation results, we find no evidence of a separatedbinary for either of the objects. The low derived albedo of 2013NL24 means that an equal-mass binary is very unlikely, otherwisethe actual albedo of either component would need to beunreasonably low. Because of its higher albedo, the constrainton 2014 YY49 is not as tight, but the consistency with the color–albedo trend seems to point toward no equal-mass companion.Additionally, for both objects, the consistency between theprediction and the observed shadow suggests that neither object isbinary. Because of the relatively coarse spacing of stations, wecannot rule out a contact binary, but there is no evidence of such acomplex shape in the occultation data. We cannot fully rule out acompanion, particularly a less massive satellite, but no such signalis seen beyond the noise of the data, and, crucially, no other dropsare corroborated by more than one site. The relatively low S/Nand the spatial and temporal coarseness of the occultation dataalso limit our analysis to the solid body of the objects, so wecannot provide constraints on extended, diffuse characteristicssuch as comae, as they would be lost within the noise of the data.
Of significant interest to the RECON project is theopportunity for follow-on occultation observations of pre-viously detected objects. Even with only two or three chords,the astrometric measurement provided by a positive detectionby occultation has a precision and accuracy far better than anyastrometry obtained via direct imaging. The astrometry fromthese occultations will considerably reduce the uncertainty onthe orbits of these two objects and allow for much higher
precision occultation predictions in the future. While RECONis nominally a large stationary network aimed at low-resolutionmeasurements of high-uncertainty events, astrometric con-straints from occultation detections could make it possible tomobilize a subset of the network for more targeted deploy-ments, informed by the occultation results presented here. Sucha deployment could sample the object at a higher spatialresolution and may constrain the object’s shape, as well as itssize. A higher spatial resolution may also allow detection ofextended features such as rings, atmospheres, and binarycompanions, if they exist. Even if better spatial resolution is notachieved, a secondary occultation measurement would provideadditional insight into the object’s shape and act as anotherhigh-precision astrometric measurement.The results from these two occultations add to the six Centaurs
measured to date by occultation. The reported radius of 16 km for2014 YY49 places it among the smallest of the Centaursmeasured, and indeed among the smallest of all outer solarsystem objects with their sizes measured by occultation (after onlyArrokoth). It is also the smallest object beyond the main belt tohave been measured by the RECON project. This is not to suggestthat objects this small are uncommon; rather, there is a clearobservational bias toward larger objects that are easier to measurewith occultations. The albedo results are also consistent with theexisting values for Centaurs, although the very high geometricalbedo of 0.13 for 2014 YY49 is less typical of observed Centauralbedos than the 0.045 albedo for 2013 NL24.
8. Summary and Future Work
The unique scale and design of the RECON network makes itideal for pursuing stellar occultations by objects in the outer solarsystem. In 2019, RECON was successful in measuring multiplechords during occultations by two Centaurs, 2014 YY49 and 2013NL24. In addition to well-constrained astrometric measurementsfor both objects, the occultation data provide similarly well-constrained measurements of the radii of these two objects. Wefind 2014 YY49 and 2013 NL24 to have radii of -
+16.36 0.921.68 and
-+66.00 4.62
4.90 km, respectively, making these among the smallestouter solar system objects with occultation measurements. Wederive geometric albedos in the V band of 13% and 4.5%,respectively. An analysis of Pan-STARRS photometry provideslimits on light curve amplitudes, which we find to be 0.55± 0.08mag for 2014 YY49 and 0.63± 0.1 mag for 2013 NL24. The samephotometry also provides respective spectral slopes of 28%± 8%100 nm−1 and 4%± 5% 100 nm−1. Overall, we have measuredone rather small, bright, and red object and a much larger, darker,and grayer object. We find that these results are consistent withpublished relations within the bulk statistics of Centaurs, includingcolor–inclination and color–albedo correlations.The focus of future work should be on further refining each
of these results. Not many Centaurs have ground-truthgeometry measurements, making those that do compellingtargets for additional study. Follow-on occultation measure-ments for these objects, with predictions informed by our newastrometry, would provide even further insight into theirgeometry and the existence (or lack thereof) of binarity. Wealso recommend that these two Centaurs be subject to follow-on large-telescope measurements. The vast majority of theexisting photometry is from Pan-STARRS survey data, withwhich it is simply not possible to achieve the same S/N as withdedicated observation on a 4 m class telescope. Targetedphotometry on such an instrument would constrain the spectral
Figure 16. The V-band geometric albedo and derived B − R color of these twoRECON targets, overplotted on those of 28 other Centaurs from Belskaya et al.(2015), Peixinho et al. (2020) and Tegler et al. (2016). The two RECON targetsare plotted with the uncertainties for their derived albedos and colors, and thepublished values for albedo and color are plotted for the two extreme Centaursshown in Figure 15, (5145) Pholus and (2060) Chiron.
18
The Planetary Science Journal, 2:22 (19pp), 2021 February Strauss et al.
slopes much more than the Pan-STARRS survey photometrycan and would make it clearer whether these objects,particularly 2014 YY49, fall within the “red” class of Centaurs.Photometry at a high cadence would better constrain the lightcurve amplitudes beyond our estimates here, as well as therotational periods of these two objects. A more precisemeasurement of light curve amplitude would provide insightinto the shapes of these objects and, in tandem with theseoccultation results, begin to provide well-characterized three-dimensional shapes.
All occultation data reported on in this work were obtained bythe citizen scientist observers who make up the RECON network.Among these team members are: Jesse Ballesteros; Jesus Bustos;Michelle, Mark, and Cody Callahan; Philip Cappadona Jr.; Peterand Debra Ceravolo (Anarchist Mt. Observatory); Jose SanchezCervantes; Michael Chase; Jeff Cheeseman; Matthew Christensen;Ken Conway; Michelle Dean; Mari Echols; Anne-Marie Eklund;Cassandra Fallscheer; Zachary French; Isaura Valeria Garcia; R.G. Gartz; John Gombar; James A. Hammond; Jeff Hashimoto;John W. Heller; Amy Hills; Todd C. Hunt; Russell Jones; BabakKhodarahmi; Nadia Lee; Nels Lund; Deanna Marshall; JeffMartin; Andrew E. McCandless; Kourtney McClellan; LexiMiller; Terry R. Miller; Cody Nelson; Nidhi R. Patel, Ph.D.;Lauren-Elizabeth Pope; Glen Ryan; Adelaide Seemiller (Heidi);Nicholas Service; Angel Singleton; Joe Slovacek; Eric Smith;James T. Sowell III; Abby Teigen; Brian Thomas; RonThorkildson; Ihsan Turk; Dorey W.Conway; Jared T. White Jr.;Charlene Wiesenborn; and Peter Zencak. Prediction efforts for thiswork were partly based on observations obtained with the ApachePoint Observatory 3.5m telescope, which is owned and operatedby the Astrophysical Research Consortium. This research hasmade use of data and/or services provided by the InternationalAstronomical Union’s Minor Planet Center. Useful feedback fromtwo anonymous reviewers was incorporated into this work.Funding for RECON was provided by a grant from NSF AST-1413287, AST-1413072, AST-1848621, and AST-1212159.
ORCID iDs
Ryder H. Strauss https://orcid.org/0000-0001-6350-807XRodrigo Leiva https://orcid.org/0000-0002-6477-1360John M. Keller https://orcid.org/0000-0002-0915-4861Marc W. Buie https://orcid.org/0000-0003-0854-745XRobert J. Weryk https://orcid.org/0000-0002-0439-9341JJ Kavelaars https://orcid.org/0000-0001-7032-5255Lawrence H. Wasserman https://orcid.org/0000-0001-5769-0979David E. Trilling https://orcid.org/0000-0003-4580-3790
References
Bauer, J. M., Grav, T., Blauvelt, E., et al. 2013, ApJ, 773, 22Belskaya, I. N., Barucci, M. A., Fulchignoni, M., & Dovgopol, A. N. 2015,
Icar, 250, 482Benedetti-Rossi, G., Sicardy, B., Buie, M. W., et al. 2016, AJ, 152, 156Boley, A. C., Bridges, T., Hickson, P., et al. 2019, Canadian Long Range Plan
for Astronony and Astrophysics White Papers, 2020, 13, doi:10.5281/zenodo.3756119
Braga-Ribas, F., Crispim, A., Vieira-Martins, R., et al. 2019, JPhCS, 1365,012024
Buie, M. W., & Keller, J. M. 2016, AJ, 151, 73Buie, M. W., Leiva, R., Keller, J. M., et al. 2020a, AJ, 159, 230Buie, M. W., Olkin, C. B., Merline, W. J., et al. 2015, AJ, 149, 113Buie, M. W., Porter, S. B., Tamblyn, P., et al. 2020b, AJ, 159, 130Chambers, K. C., Magnier, E. A., Metcalfe, N., et al. 2016, arXiv:1612.05560Di Sisto, R. P., & Brunini, A. 2007, Icar, 190, 224Di Sisto, R. P., Brunini, A., & de Elía, G. C. 2010, A&A, 519, A112Di Sisto, R. P., Ramos, X. S., & Gallardo, T. 2019, Icar, 319, 828Di Sisto, R. P., & Rossignoli, N. L. 2020, CeMDA, 132, 36Fink, U., Hoffmann, M., Grundy, W., Hicks, M., & Sears, W. 1992, Icar,
97, 145Folkner, W. M., Williams, J. G., Boggs, D. H., Park, R. S., & Kuchynka, P.
2014, IPNPR, 42–196, 1Foreman-Mackey, D., Hogg, D. W., Lang, D., & Goodman, J. 2013, PASP,
125, 306Fraser, W. C., Brown, M. E., Morbidelli, A., Parker, A., & Batygin, K. 2014,
ApJ, 782, 100Fuentes, C. I., & Holman, M. J. 2008, AJ, 136, 83Goodman, J., & Weare, J. 2010, Communications in Applied Mathematics and
Computational Science, 5, 65Grundy, W. M., Noll, K. S., Buie, M. W., et al. 2019, Icar, 334, 30Horner, J., Evans, N. W., & Bailey, M. E. 2004, MNRAS, 354, 798Horner, J., & Lykawka, P. S. 2010, MNRAS, 402, 13Lacerda, P., Fornasier, S., Lellouch, E., et al. 2014, ApJL, 793, L2Leiva, R., Buie, M. W., Keller, J. M., et al. 2020, PSJ, 1, 48Lindegren, L., Hernández, J., Bombrun, A., et al. 2018, A&A, 616, A2Luu, J. X. 1993, Icar, 104, 138Marsset, M., Fraser, W. C., Pike, R. E., et al. 2019, AJ, 157, 94Morbidelli, A. 1997, Icar, 127, 1Müller, T. G., Lellouch, E., Böhnhardt, H., et al. 2009, EM&P, 105, 209Peixinho, N., Delsanti, A., Guilbert-Lepoutre, A., Gafeira, R., & Lacerda, P.
2012, A&A, 546, A86Peixinho, N., Thirouin, A., Tegler, S. C., et al. 2020, in The Trans-Neptunian
Solar System, ed. D. Prialnik, M. A. Barucci, & L. Young (Amsterdam:Elsevier), 307
Schlichting, H. E., Fuentes, C. I., & Trilling, D. E. 2013, AJ, 146, 36Smart, W. M. 1977, Textbook on Spherical Astronomy (6th ed.; Cambridge:
Cambridge Univ. Press)Souami, D., Braga-Ribas, F., Sicardy, B., et al. 2020, A&A, 643, A125Spencer, J. R., Stern, S. A., Moore, J. M., et al. 2020, Sci, 367, aay3999Stansberry, J., Grundy, W., Brown, M., et al. 2008, in The Solar System
Beyond Neptune, ed. M. A. Barucci et al. (Tucson, AZ: Univ. ArizonaPress), 161
Stansberry, J. A., Van Cleve, J., Reach, W. T., et al. 2004, ApJS, 154, 463Stern, S. A., Weaver, H. A., Spencer, J. R., et al. 2019, Sci, 364, aaw9771Tegler, S. C., Romanishin, W., Consolmagno, G. J., & J., S. 2016, AJ, 152, 210Volk, K., & Malhotra, R. 2008, ApJ, 687, 714Willmer, C. N. A. 2018, ApJS, 236, 47
19
The Planetary Science Journal, 2:22 (19pp), 2021 February Strauss et al.