Embed Size (px)
Citation preview
Human BiologyVolume 85Issue 1 Special Issue on Revisiting the "Negrito"Hypothesis
Article 4
2013
The Skeletal Phenotype of "Negritos" from theAndaman Islands and Philippines Relative toGlobal Variation among Hunter-GatherersJay T. StockDepartment of Archaeology and Anthropology, University of Cambridge, Cambridge, UK, [email protected]
Follow this and additional works at: http://digitalcommons.wayne.edu/humbiol
Part of the Biological and Physical Anthropology Commons
Recommended CitationStock, Jay T. (2013) "The Skeletal Phenotype of "Negritos" from the Andaman Islands and Philippines Relative to Global Variationamong Hunter-Gatherers," Human Biology: Vol. 85: Iss. 1, Article 4.Available at: http://digitalcommons.wayne.edu/humbiol/vol85/iss1/4
The Skeletal Phenotype of "Negritos" from the Andaman Islands andPhilippines Relative to Global Variation among Hunter-Gatherers
AbstractThe "negrito hypothesis" suggests that populations of small-bodied foragers in South and Southeast Asia whoshare common phenotypic characteristics may also share a common, ancient origin. The key definingcharacteristics of the "negrito" phenotype, small body size, dark skin, and tightly curled hair, have beeninterpreted as linking these populations to sub-Saharan Africans. The underlying assumption of thisinterpretation is that the observed phenotypic similarities likely reflect shared ancestry rather than phenotypicconvergence. Current genetic evidence is inconclusive, as it both demonstrates that negrito populations havegenetic affinities with neighboring populations but also rare and ancient variation that suggests considerableisolation. This study investigates the skeletal phenotype of Andaman Islanders and Aeta foragers from thePhilippines in the context of the phenotypic variation among other hunter-gatherers globally, to test whetherthey show a common, unique physique apart from small body size. Particular emphasis is placed on thecomparison of negrito phenotypes to African, Asian, and Australian hunter-gatherer diversity to investigatephenotypic similarities to other populations globally. The results demonstrate that despite sharing small adultstature, the Andaman Islanders and Aeta show variation in body dimensions. In particular, the AndamanIslanders share a pattern of narrow bi-iliac breadth and short upper limbs with the Khoisan (Later Stone AgeSouthern Africans), whereas the Aeta and Efé show broader bi-iliac breadths relative to lower limb lengths.Although general similarities in size and proportions remain between the Andamanese and Aeta, differencesin humero-femoral indices and arm length between these groups and the Efé demonstrate that there is not ageneric "pygmy" phenotype. Our interpretations of negrito origins and adaptation must account for thisphenotypic variation.
KeywordsBody Proportions, Phenotypic Variation, Human Adaptation, Plasticity
This open access article is available in Human Biology: http://digitalcommons.wayne.edu/humbiol/vol85/iss1/4
1Phenotypic Adaptability, Variation and Evolution Research Group, Department of Archaeology and An-thropology, University of Cambridge, Cambridge CB2 3DF, UK. E-mail: [email protected].
Human Biology, February–June 2013, v. 85, no. 1–3, pp. 67–94.Copyright © 2013 Wayne State University Press, Detroit, Michigan 48201-1309
KEY WORDS: BODY PROPORTIONS, PHENOTYPIC VARIATION, HUMAN ADAPTATION, PLASTICITY.
The Skeletal Phenotype of “Negritos” from the Andaman Islands and Philippines Relative to Global Variation among Hunter-Gatherers
JAY T. STOCK1
Abstract The “negrito hypothesis” suggests that populations of small-bodied foragers in South and Southeast Asia who share common phenotypic characteristics may also share a common, ancient origin. The key defining characteristics of the “negrito” phenotype, small body size, dark skin, and tightly curled hair, have been interpreted as linking these populations to sub-Saharan Africans. The underlying assumption of this interpretation is that the observed phenotypic similarities likely reflect shared ancestry rather than phenotypic convergence. Current genetic evidence is inconclusive, as it both demonstrates that negrito populations have genetic affinities with neighboring populations but also rare and ancient variation that suggests considerable isolation. This study investigates the skeletal phenotype of Andaman Island-ers and Aeta foragers from the Philippines in the context of the phenotypic variation among other hunter-gatherers globally, to test whether they show a common, unique physique apart from small body size. Particular emphasis is placed on the comparison of negrito phenotypes to African, Asian, and Australian hunter-gatherer diversity to investigate phenotypic similarities to other populations globally. The results demonstrate that despite sharing small adult stature, the Andaman Islanders and Aeta show variation in body dimen-sions. In particular, the Andaman Islanders share a pattern of narrow bi-iliac breadth and short upper limbs with the Khoisan (Later Stone Age Southern Africans), whereas the Aeta and Efé show broader bi-iliac breadths relative to lower limb lengths. Although general similarities in size and proportions remain between the Andamanese and Aeta, differences in humero-femoral indices and arm length between these groups and the Efé demonstrate that there is not a generic “pygmy” phenotype. Our interpretations of negrito origins and adaptation must account for this phenotypic variation.
68 / STOCK
The indigenous inhabitants of the Andaman Islands, the Agta, Aeta, Mamanwa, and Zambales of the Philippines, and the Semang of the Malay Peninsula have frequently been considered to be “negrito,” due to their short stature, dark skin, and “frizzy” hair (Barrows 1910; Banerjee et al. 1984; Hanihara 1989; Bhasin et al. 1994). These phenotypic similarities among negrito hunter-gatherer popula-tions of Southeast Asia have led to a long-standing speculation that these groups share a common, ancient ancestry. Although these populations are separated by considerable geographic distance, they share common physical features that are often presumed to be the result of common ancestry.
The negrito populations are characterized by small body size, dark skin, and tightly curled hair that is unusual within the context of phenotypic variation within Southeast Asia. Early genetic research in the 1980s linked these groups closely to other Asian populations and suggested that they were not closely related to Africans (Omoto 1984). Subsequent research using mitochondrial DNA (mtDNA) variation provided evidence for a link between negrito groups of the Andaman Islands and sub-Saharan African foragers (Mukerjee 1999). More recent research has enhanced our understanding of the genetics of this group, suggesting that genetic variation among the Andaman Islanders may reflect considerable isolation of this population following initial dispersal out of Africa (Thangaraj et al. 2003, 2006; Thangaraj and Chaubey 2005). Although this plausibly fits an interpretive framework where the Andaman Islanders and other negrito populations represent relict populations of this early dispersal, recent evidence suggests that genetic variation among negritos is complex (Reich et al. 2009). The genetic evidence for negrito origins now illustrates the complex population histories of these popula-tions, which at once show that they share genetic variation with other populations in their immediate surroundings while possessing more “ancient” genetic variants that attest to some level of long-term isolation (Barik et al. 2008; Chaubey and Endicott this issue).
Although future genetic research will further clarify the relationships between these South and Southeast Asian populations, the phenotypic similarities of negritos remain a question of interest. The “negrito hypothesis” was initially formulated to explain observed phenotypic similarities: small body size, dark skin, and tightly curled hair. However, the majority of research has used genetic ap-proaches without reconsidering whether the phenotypic basis for the hypothesized links among negrito groups is more systematic than similarities in body size, skin color, and characteristics of hair. In recent years our understanding of the mechanisms influencing human phenotypic variation has improved considerably, with evidence for both genetically conservative variation and phenotypic plasticity in expression of traits (for reviews, see Stock 2012; Wells and Stock 2007, 2011). This article provides the first comparison of human postcranial skeletal variation to test whether two negrito populations, the Andaman Islanders and the Aeta of the Philippines, show a pattern of skeletal variation that is unique among small-bodied hunter-gatherers, thus providing evidence of a distinctive postcranial skeletal phenotype. Here, Andaman Islander and Aeta postcranial osteometric data are
The Skeletal Phenotype of “Negritos” / 69
compared with a globally representative range of hunter-gatherer populations to investigate whether there are common features of the negrito phenotype beyond small body size.
Negrito Populations and Their Origins. There are several plausible models to account for the origins of the negritos. A classic anthropological interpreta-tion suggests that negritos are the only surviving descendants of the first human occupants of southern Asia (Bhasin et al. 1994; Myka 1993). This model, based initially upon the physical similarities between the negritos and African “pyg-mies” and Bushmen (Howells 1973), suggests that the negritos are the direct de-scendants of African populations who were replaced in most areas by subsequent migrations into Southeast Asia (Carey 1976). This would likely place the origin of the negritos prior to occupation of Melanesia and Australia, around 5 kya. In an earlier model, Coon (1965) proposed that the negritos were a subpopulation of his “Australoid” population, which inhabited much of Southeast Asia during the last glaciation. He suggested that the phenotypic similarities of the negritos to sub-Saharan Africans were the result of adaptation to similar environments. It is also possible that the negritos are descended from other Southeast Asian or Oceanic populations, with distinctive characteristics evolving in the past several thousand years through isolation and convergent adaptation in response to similar environmental conditions and subsistence strategies (tropical rain forest hunter-gatherers), thus leading to similarities with small-bodied African populations.
However, archaeological evidence for the early occupation of the Andaman and other Southeast Asian Islands is lacking, due to the poor conditions for organic preservation in tropical rain forests. Although several authors have argued for the great antiquity of occupation in the Andaman Islands (Radcliffe-Brown 1964; Cipriani 1962; Dutta 1963), the oldest radiocarbon date from an archaeological context is 2,280 ± 90 years ago (Cooper 1993). This does not necessarily refute the possibility of earlier settlement, but it provides no empirical support of it. Regardless of the approach taken to test these models, results are confounded by the recent history and small size of these populations. Among the Andaman Islanders, the Great Andaman tribe has approximately 30 remaining individuals, the Onge fewer than 100, and the Jarawa approximately 200 (Myka 1993; Stock and Migliano 2009). The populations of the Semang and Aeta are larger, but so is the potential for recent gene flow from surrounding populations.
Despite and perhaps in light of these caveats, the genetic evidence for the origins of the negrito groups is suggestive of both ancient lineages and uniqueness of these populations, but also of closer relationships with neighboring populations than would be expected of an “isolation” model. Early analyses of Aeta mtDNA demonstrated that their maternal genetic diversity is broadly similar to that of other Asian groups but is distinct on the basis of several morphs, with low affinity to African populations (Harihara et al. 1988). Later work suggested that the presence of a 9-base-pair (9-bp) deletion in high frequencies among the Aeta is suggestive of a genetic relationship with the populations of Polynesia and Micronesia (Harihara et
70 / STOCK
al. 1992). This variability supports a model in which the early original inhabitants of Melanesia and Australia arrived at least 40 kya without the 9-bp deletion, with a migration of individuals carrying the 9-bp deletion through Melanesia sometime in the last 5,000 years (Hagelberg et al. 1999). However the 9-bp deletion is highly variable in frequency and occurs on different haplogroup backgrounds to haplogroup B, which contains the dominant Polynesian mtDNA, suggesting that interpretations should be made with extreme caution (Watkins et al. 1999). Matsumoto et al. (1999) found that three distinct Gm haplotypes among the Aeta and Zambales of the Philippines link these groups to Asian populations, although one specific haplotype was found to be prevalent among these groups and those of Africa, New Guinea, and North Australia populations. A study of HLA antigens among the Aeta and Mamanwa found similarities with other Asian groups and differences in specific antigens compared with Europeans and Africans (Horai et al. 1981). Further variation in red cell enzymes (CA1, AK, and ESD) and serum proteins among the Aeta and Mamanwa have demonstrated rare variants among these populations (Omoto et al. 1978; Omoto 1980; Mitsui et al. 1992), although the interpretation of this variation is challenging.
There is some evidence that genetic variation among the Andaman Islanders may reflect considerable isolation following initial dispersal out of Africa (Kashyap et al. 2003; Thangaraj et al. 2003, 2006; Thangaraj and Chaubey 2005). Although this plausibly fits an interpretive framework where the Andaman Islanders and other negrito populations represent relict populations of this early dispersal, recent evidence suggests that genetic variation among these populations is much more complex than previously thought (Reich et al. 2009). Current genetic evidence is beginning to highlight more recent relationships between negrito populations and other, non-negrito populations in the same region, while maintaining some evidence for deeper genetic roots of these populations (Barik et al. 2008; Chaubey and Endicott this issue). These deep lineages may not reflect a common ancestry concurrent with the dispersal out of Africa, as predicted by the negrito hypothesis, but a degree of long-term genetic isolation from neighboring populations. The first study to integrate genotype and phenotype data of a negrito population (Migliano et al. this issue) suggests that, based on genetic variation, the Aeta, Batak, and Agta cluster with other South Asian populations and that their small body size evolved independently of other pygmy populations in Africa or Papua New Guinea.
The different models of negrito origins have implications for our understand-ing of phenotypic variation. An early and common ancestry of these groups implies a very long period of morphological stasis characterized by the negrito and African pygmy/bushman pattern of small body size and dark skin. Genetic similarities would have to be accounted for by founder effect and long-term canalization of phenotypic traits, or convergent evolution occurring over tens of thousands of years. Recent convergence from local populations would predict relatively rapid morphological change of either the Polynesians, from a “negrito-like” ancestor, or the negritos, from a morphologically Polynesian ancestor. Morphological similarities among Polynesians, combined with relative genetic homogeneity, suggest that the recent
The Skeletal Phenotype of “Negritos” / 71
origin model of the negritos must account for their distinctive phenotype through convergence, based upon one of two different models: (a) recent natural selection among the negritos in their respective environments or (b) phenotypic plasticity and relatively rapid change in the phenotypic characteristics in question.
Skeletal and Dental Morphology. Several studies have investigated morpho-logical affinities of negrito populations on the basis of dental morphometrics and crown morphology, which are under tight genetic control. Hanihara (1989, 1990, 1992) demonstrates that the Aeta are similar to the Semang negritos and share the Sundadont dental pattern that is closely related to other Asian populations (Hani-hara 1989). He later suggested that their crown morphology is specifically “proto-Sundadont” and shared with the Australians, which he interpreted as indicative of common ancestry (Hanihara 1992). This research is contradicted somewhat by a study of the crown morphology of living Andamanese (Pal 1987), which sug-gests that their dental morphology was intermediate between that of African and Asian populations; however, the emerging evidence suggests that Andamanese dental morphology most closely resembles variation within South Asia (Bulbeck this issue). Research on dental nonmetric traits of the Batak place this population within the Southeast Asian “Sundadont” pattern (Turner and Eder 2006).
Early craniometric studies of the Aeta, Semang, and Andamanese have illustrated a closer affinity of the negritos with Southeast Asian populations rather than Australian Aborigines (Hanihara 1993). A recent investigation of South Asian craniofacial variation within the context of global diversity revealed a relatively unique position of the Andaman Islanders (Stock et al. 2007), who were morphologically distinct from other South Asian populations, including the Vedda, while still situated broadly within the range of variation found within the Indian subcontinent. This would seem to suggest that the Andamanese morphology is best interpreted as linked to the genetic history of South Asia. A more recent and systematic analyses of craniofacial variation among negrito populations suggests that the Andaman Islanders share closer affinities to African populations than they do to Asian (Bulbeck this issue). Although these studies differ in aims, methods, analyses, and interpretations, neither directly support a model of common, ancient ancestry between the Andaman Islanders and other negritos.
Variation in Human Phenotype, and among Negrito Populations. Rela-tionships between climate and mammalian body form, such as those described by Bergmann’s (1847) and Allen’s (1877) rules, are relatively consistent among all mammals. Both Bergmann’s and Allen’s rules refer to the relationship between surface area and body mass, which tends to be higher in species inhabiting hot climates and lower in species from cold climates. Within humans, stature, limb lengths, body mass, and body linearity show approximate clinal distributions, varying with mean annual temperatures (Roberts 1978; Eveleth and Tanner 1990; Katzmarzyk and Leonard 1998). Human body mass and the ratio of sit-ting height to stature appear to be negatively correlated with mean temperatures
72 / STOCK
(Roberts 1978). Although there is variability in human stature within different climates, body breadth appears to be more tightly correlated with temperature. Body breadth is an important factor in human adaptation to climate, due to the relationship between body breadth and the surface-to-volume ratio (Ruff 1991, 1994). Using a cylindrical model to approximate human surface area and volume, the ratio of surface area to volume stays the same for a given breadth, regardless of the height of the cylinder (Ruff 1991, 1994). This trend is highlighted by the observation that tropical populations may have either tall or short stature, but this is generally accompanied by narrow pelves (Hiernaux 1975) as variation in body breadth has much greater effect on surface-area-to-volume ratios than does varia-tion in stature (Ruff 1994). Despite this apparent relationship to climate, there is emerging evidence that bi-iliac breadth (BIB) (Auerbach 2012) and other aspects of pelvic morphology (Betti et al. 2013) are relatively canalized and refl ective of population history. This suggests that pelvic morphology may track either neutral genetic history (Auerbach 2012; Betti et al. 2013) or previous adaptation (Auer-bach 2012).
Limb proportions, approximated by brachial and crural indices, also correlate with mean annual temperatures. High brachial and crural indices indicate longer distal limb segments of the arm and leg, respectively. They tend to be higher in people of the tropics, where there is a higher mean annual temperature (Trinkaus 1981), a trend that has most commonly been interpreted in relation to Allen’s (1877) rule and thermoregulatory constraints. The small physique of modern pygmies and negritos is less linear than the that of Nilotic Africans, and the limb lengths are relatively shorter, but small body size also results in a high surface-area-to-mass ratio, as well as lower metabolic rates and heat production. This suggests that both may be adaptations to heat stress, but in humid and dry environments, among pygmies and Nilotic Africans, respectively.
There is considerable global variation in human body size and proportions, some of which has been interpreted as phylogenetically conservative and heritable (Holliday 1997; Holliday and Falsetti 1999; Pearson 2000; Holliday and Ruff 2001), thus providing information about long-term adaptation to environmental variation. Most recent analyses continue to interpret variation in human limb proportions as being adaptive in response to environmental stress (Temple et al. 2008) and relatively stable throughout development (Cowgill et al. 2012). This sits somewhat at odds with evidence for plasticity of human body size and limb proportions (Tanner et al. 1982; Bogin et al. 2002), and evidence that environmental plasticity of many phenotypic characteristics can influence heritability estimates (Wells and Stock 2011). A comparison of variation in physique among the Andaman Islanders and Later Stone Age (LSA) Southern Africans (Khoisan) demonstrates that these populations share small body size and adaptations characteristic of other low-latitude populations (Kurki et al. 2008); however, it is unclear whether other negrito populations share these phenotypic characteristics. There is evidence that the very first humans to occupy Southeast Asia had very small adult body size (Détroit et al. this issue). This underscores the importance of our understanding of
The Skeletal Phenotype of “Negritos” / 73
the mechanisms that drive body size variation within our species and the extent to which size correlates with other phenotypic characteristics.
Phenotypic similarities between specific groups inspired the negrito hy-pothesis, yet much of this variation can be seen to be relatively superficial: dark skin and hair pigmentation, tightly curled or peppercorn hair, and small body size. These characteristics may reflect common ancestry, but they may also be evolutionarily convergent; phenotypically “plastic” and hence convergent due to recent environmental similarities; or morphologically “integrated” as pleiotropic effects acting upon other traits (Wells and Stock 2011). Research by Bulbeck (this issue) suggests that there is phenotypic variation among negritos. However, testing hypotheses about negrito variation is complicated by several factors: (a) very few studies have provided new original phenotypic data; (b) where data exist, it is very difficult to obtain comparable data from other negrito groups; and (c) we still know very little about the mechanisms that control the human phenotype, genetic or otherwise.
This study extends our understanding of phenotypic similarities among negrito populations, by comparing postcranial skeletal variation between Andaman Islanders and Aeta negritos from the Philippines with a globally representative range of hunter-gatherers. Of particular interest is the comparison of these groups with LSA foragers from Southern Africa (ancestral to Khoisan-speaking peoples), LSA populations from East Africa, Central African pygmies (Efé) from the Congo, and hunter-gatherers from Australia and Tasmania, as each of these regions has been invoked in models of negrito origins.
At present we know very little about the relationship between genetic varia-tion and human phenotypic variation. Genetic studies provide the best evidence for the population history of these groups; however, morphological data may either correlate strongly with genetic data where it tracks neutral variation (Betti et al. 2013) or differ where it tracks adaptation or plasticity (Stock 2006). In this context, it is premature to invoke a direct relationship between general phenotypic data and genetic phylogenies, as morphological similarities between negrito groups could reflect ancient common ancestry and neutral genetic variation combined with “canalization” of traits, recent convergent evolution in response to similar environmental stresses, or plasticity in response to environmental conditions over several generations or within the life span. In this context, this study does not directly address questions of population history; rather, it asks whether phenotypic similarities among negrito populations extend to general aspects of physique and limb proportions. In others words, are there more phenotypic similarities between negrito groups than body size?
Although small body size has been considered a central feature of the typical negrito phenotype, our current understanding of the mechanisms controlling body size is inconclusive. There is considerable evidence for genetic factors influencing the body size of pygmies (Becker et al. 2011), but human body size also shows considerable plasticity in response to environmental variation (Wells and Stock 2011; Stock 2012). Life history parameters appear to be involved in the mechanisms
74 / STOCK
that influence size variation (Migliano et al. 2007), and they may be a factor driving variation in size between generations of Andaman Islanders (Stock and Migliano 2009) and Barinneans. This study compares basic skeletal indicators of phenotype among a global range of hunter-gatherers to examine whether the Andaman Island-ers and Aeta show unique characteristics of body size compared with other modern human foragers. If consistent morphological similarities are found, it implies that similar biological mechanisms influence the human phenotype, whether they are canalized or plastic. The identification of variation among the negritos and other small-bodied foragers would suggest that their small size may be convergent and subject to developmental plasticity, or at least responsive to local conditions or population history.
Materials and Methods
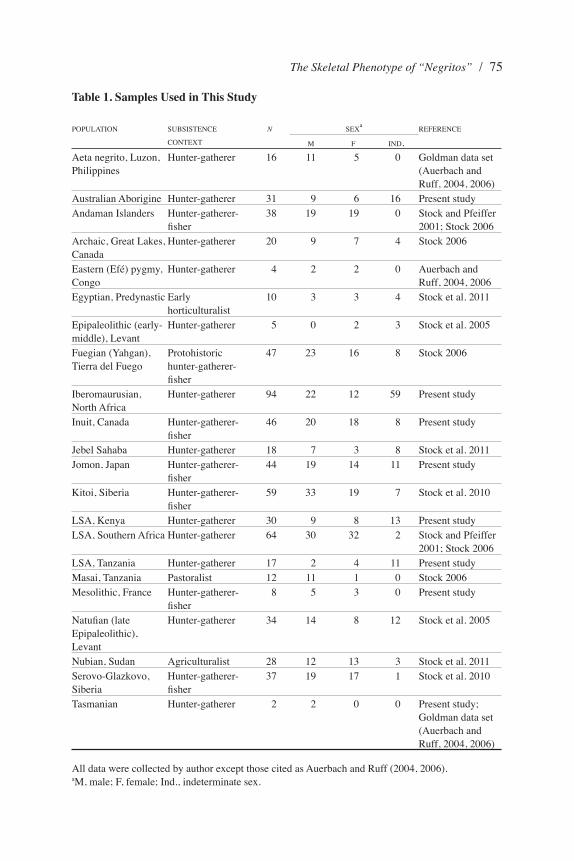
Osteometric data representing humeri, radii, ulnae, ossa coxae, femora, and tibiae were compared and used to calculate indices that represent commonly used body dimensions and ratios. Skeletal samples used in this study are presented in Table 1. Skeletal measurements of one Tasmanian, four “Eastern pygmies,” and 16 Philip-pine “negritos” were provided by Auerbach and Ruff (2004, 2006); the remainder were measured by the author. The pygmy samples most likely represent the Efé, based upon their geographical provenance, whereas the Philippine negritos were derived from southern Luzon (Genet-Varcin 1951) and most likely represent Aeta foragers. They will be referred to as the “Efé” and “Aeta” in the text, although these attributions should be treated with caution. Univariate measures of skeletal dimensions were first compared using analysis of variance, with Games-Howell post hoc tests for population level differences. This test, which does not assume equal variances, is useful because of the differences in sample sizes between populations. Many of the populations include individuals of indeterminate sex. Because sexual dimorphism is lower in magnitude than population-level differences, and relatively consistent across populations, the sexes have been pooled in univariate analyses to test for population-level differences. However, population-specific sex ratios were used to weight the data in all analyses, to ensure that uneven sex ratios did not bias the results. A Bonferroni correction was used to adjust the confidence intervals for multiple pairwise comparisons of populations. Box and scatter plots of individual variables by population, however, illustrate differences between sexes and those individuals of indeterminate sex, for each population. To investigate more general patterns of skeletal variation within the limbs, canonical variates analysis was used.
Results
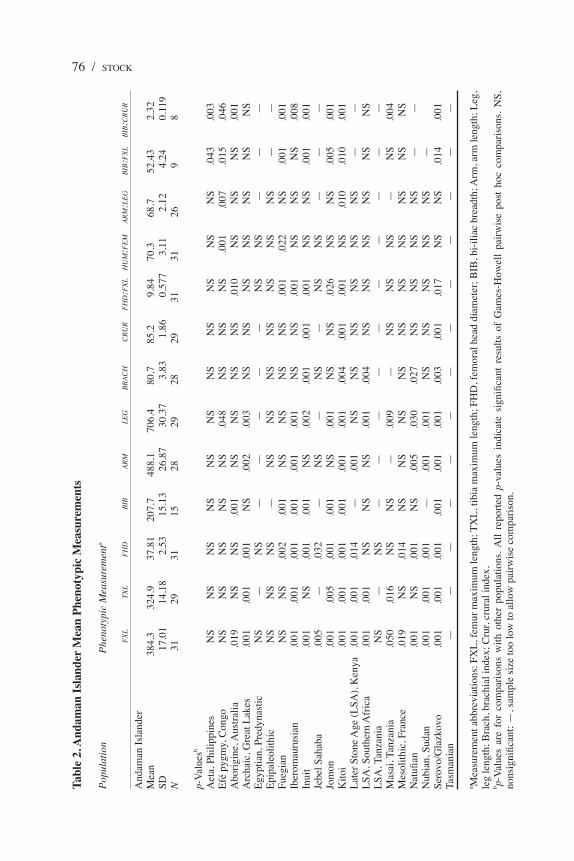
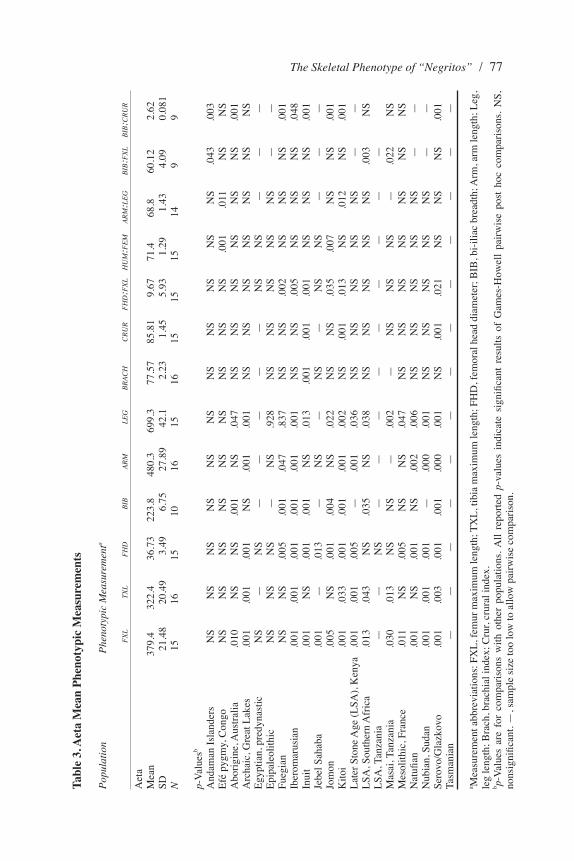
Initial comparisons are provided using analysis of variance and Games-Howell post hoc tests to explore variation in skeletal dimensions, which provides information about general variation in body size and form. Tables 2 and 3 summarize results of post hoc pairwise comparisons between Andaman Islanders and Aeta, respectively.
The Skeletal Phenotype of “Negritos” / 75
Table 1. Samples Used in This Study
POPULATION SUBSISTENCE CONTEXT
N SEXa
REFERENCE
M F IND.Aeta negrito, Luzon, Philippines
Hunter-gatherer 16 11 5 0 Goldman data set (Auerbach and Ruff, 2004, 2006)
Australian Aborigine Hunter-gatherer 31 9 6 16 Present studyAndaman Islanders Hunter-gatherer-
fisher38 19 19 0 Stock and Pfeiffer
2001; Stock 2006 Archaic, Great Lakes, Canada
Hunter-gatherer 20 9 7 4 Stock 2006
Eastern (Efé) pygmy, Congo
Hunter-gatherer 4 2 2 0 Auerbach and Ruff, 2004, 2006
Egyptian, Predynastic Early horticulturalist
10 3 3 4 Stock et al. 2011
Epipaleolithic (early-middle), Levant
Hunter-gatherer 5 0 2 3 Stock et al. 2005
Fuegian (Yahgan), Tierra del Fuego
Protohistoric hunter-gatherer-fisher
47 23 16 8 Stock 2006
Iberomaurusian, North Africa
Hunter-gatherer 94 22 12 59 Present study
Inuit, Canada Hunter-gatherer-fisher
46 20 18 8 Present study
Jebel Sahaba Hunter-gatherer 18 7 3 8 Stock et al. 2011Jomon, Japan Hunter-gatherer-
fisher44 19 14 11 Present study
Kitoi, Siberia Hunter-gatherer-fisher
59 33 19 7 Stock et al. 2010
LSA, Kenya Hunter-gatherer 30 9 8 13 Present studyLSA, Southern Africa Hunter-gatherer 64 30 32 2 Stock and Pfeiffer
2001; Stock 2006 LSA, Tanzania Hunter-gatherer 17 2 4 11 Present study Masai, Tanzania Pastoralist 12 11 1 0 Stock 2006 Mesolithic, France Hunter-gatherer-
fisher8 5 3 0 Present study
Natufian (late Epipaleolithic), Levant
Hunter-gatherer 34 14 8 12 Stock et al. 2005
Nubian, Sudan Agriculturalist 28 12 13 3 Stock et al. 2011Serovo-Glazkovo, Siberia
Hunter-gatherer-fisher
37 19 17 1 Stock et al. 2010
Tasmanian Hunter-gatherer 2 2 0 0 Present study; Goldman data set (Auerbach and Ruff, 2004, 2006)
All data were collected by author except those cited as Auerbach and Ruff (2004, 2006).aM, male; F, female; Ind., indeterminate sex.
76 / STOCKTa
ble
2. A
ndam
an I
slan
der
Mea
n P
heno
typi
c M
easu
rem
ents
Pop
ulat
ion
Phe
noty
pic
Mea
sure
men
ta
F
XL
TX
L
FH
D
BIB
A
RM
L
EG
B
RA
CH
C
RU
R
FH
D:F
XL
HU
M:F
EM
A
RM
:LE
G
BIB
:FX
L
BIB
:CR
UR
And
aman
Isl
ande
rM
ean
384.
3 32
4.9
37.8
1 20
7.7
488.
1 70
6.4
80.7
85
.2
9.84
70
.3
68.7
52
.43
2.32
SD
17.0
1 14
.18
2.53
15
.13
26.8
7 30
.37
3.83
1.
86
0.57
7 3.
11
2.12
4.
24
0.11
9N
31
29
31
15
28
29
28
29
31
31
26
9
8
p-V
alue
sb
Aet
a, P
hilip
pine
s N
S N
S N
S N
S N
S N
S N
S N
S N
S N
S N
S .0
43
.003
Efé
pyg
my,
Con
go
NS
NS
NS
NS
NS
.048
N
S N
S N
S .0
01
.007
.0
15
.046
Abo
rigi
ne, A
ustr
alia
.0
19
NS
NS
.001
N
S N
S N
S N
S .0
10
NS
NS
NS
.001
Arc
haic
, Gre
at L
akes
.0
01
.001
.0
01
NS
.002
.0
03
NS
NS
NS
NS
NS
NS
NS
Egy
ptia
n, P
redy
nast
ic
NS
—
NS
—
—
—
—
—
NS
NS
—
—
—E
pipa
leol
ithic
N
S N
S N
S —
N
S N
S N
S N
S N
S N
S N
S —
—
Fueg
ian
NS
NS
.002
.0
01
NS
NS
NS
NS
.001
.0
22
NS
.001
.0
01Ib
erom
auru
sian
.0
01
.001
.0
01
.001
.0
01
.001
N
S N
S .0
01
NS
NS
NS
.008
Inui
t .0
01
NS
.001
.0
01
NS
.002
.0
01
.001
.0
01
NS
NS
.001
.0
01Je
bel S
ahab
a .0
05
—
.032
—
N
S —
N
S —
N
S N
S —
—
—
Jom
on
.001
.0
05
.001
.0
01
NS
.001
N
S N
S .0
26
NS
NS
.005
.0
01K
itoi
.001
.0
01
.001
.0
01
.001
.0
01
.004
.0
01
.001
N
S .0
10
.010
.0
01L
ater
Sto
ne A
ge (
LSA
), K
enya
.0
01
.001
.0
14
—
.001
N
S N
S N
S N
S N
S N
S —
—
LSA
, Sou
ther
n A
fric
a .0
01
.001
N
S N
S N
S .0
01
.004
N
S N
S N
S N
S N
S N
SL
SA, T
anza
nia
NS
—
NS
—
—
—
—
—
—
—
—
—
—M
asai
, Tan
zani
a .0
50
.016
N
S N
S —
.0
09
—
NS
NS
NS
—
NS
.004
Mes
olith
ic, F
ranc
e .0
19
NS
.014
N
S N
S N
S N
S N
S N
S N
S N
S N
S N
SN
atufi
an
.001
N
S .0
01
NS
.005
.0
30
.027
N
S N
S N
S N
S —
—
Nub
ian,
Sud
an
.001
.0
01
.001
—
.0
01
.001
N
S N
S N
S N
S N
S —
Se
rovo
/Gla
zkov
o .0
01
.001
.0
01
.001
.0
01
.001
.0
03
.001
.0
17
NS
NS
.014
.0
01Ta
sman
ian
—
—
—
—
—
—
—
—
—
—
—
—
—
a Mea
sure
men
t abb
revi
atio
ns: F
XL
, fem
ur m
axim
um le
ngth
; TX
L, t
ibia
max
imum
leng
th; F
HD
, fem
oral
hea
d di
amet
er; B
IB, b
i-ili
ac b
read
th; A
rm, a
rm le
ngth
; Leg
, le
g le
ngth
; Bra
ch, b
rach
ial i
ndex
; Cru
r, cr
ural
inde
x.b p-
Val
ues
are
for
com
pari
sons
with
oth
er p
opul
atio
ns.
All
repo
rted
p-v
alue
s in
dica
te s
ignific
ant
resu
lts o
f G
ames
-How
ell
pair
wis
e po
st h
oc c
ompa
riso
ns.
NS,
no
nsig
nific
ant;
—, s
ampl
e si
ze to
o lo
w to
allo
w p
airw
ise
com
pari
son.
The Skeletal Phenotype of “Negritos” / 77Ta
ble
3. A
eta
Mea
n P
heno
typi
c M
easu
rem
ents
Pop
ulat
ion
Phe
noty
pic
Mea
sure
men
ta
F
XL
TX
L
FH
D
BIB
A
RM
L
EG
B
RA
CH
C
RU
R
FH
D:F
XL
HU
M:F
EM
A
RM
:LE
G
BIB
:FX
L
BIB
:CR
UR
Aet
aM
ean
379.
4 32
2.4
36.7
3 22
3.8
480.
3 69
9.3
77.5
7 85
.81
9.67
71
.4
68.8
60
.12
2.62
SD
21.4
8 20
.49
3.49
6.
75
27.8
9 42
.1
2.23
1.
45
5.93
1.
29
1.43
4.
09
0.08
1N
15
16
15
10
16
15
16
15
15
15
14
9
9
p-V
alue
sb
And
aman
Isl
ande
rs
NS
NS
NS
NS
NS
NS
NS
NS
NS
NS
NS
.043
.0
03E
fé p
ygm
y, C
ongo
N
S N
S N
S N
S N
S N
S N
S N
S N
S .0
01
.011
N
S N
SA
bori
gine
, Aus
tral
ia
.010
N
S N
S .0
01
NS
.047
N
S N
S N
S N
S N
S N
S .0
01A
rcha
ic, G
reat
Lak
es
.001
.0
01
.001
N
S .0
01
.001
N
S N
S N
S N
S N
S N
S N
SE
gypt
ian,
pre
dyna
stic
N
S —
N
S —
—
—
—
—
N
S N
S —
—
—
Epi
pale
olith
ic
NS
NS
NS
—
NS
.928
N
S N
S N
S N
S N
S —
—
Fueg
ian
NS
NS
.005
.0
01
.047
.8
37
NS
NS
.002
N
S N
S N
S .0
01Ib
erom
arus
ian
.001
.0
01
.001
.0
01
.001
.0
01
NS
NS
.005
N
S N
S N
S .0
48In
uit
.001
N
S .0
01
.001
N
S .0
13
.001
.0
01
.001
N
S N
S N
S .0
01Je
bel S
ahab
a .0
01
—
.013
—
N
S —
N
S —
N
S N
S —
—
—
Jom
on
.005
N
S .0
01
.004
N
S .0
22
NS
NS
.035
.0
07
NS
NS
.001
Kito
i .0
01
.033
.0
01
.001
.0
01
.002
N
S .0
01
.013
N
S .0
12
NS
.001
Lat
er S
tone
Age
(L
SA),
Ken
ya
.001
.0
01
.005
—
.0
01
.036
N
S N
S N
S N
S N
S —
—
LSA
, Sou
ther
n A
fric
a .0
13
.043
N
S .0
35
NS
.038
N
S N
S N
S N
S N
S .0
03
NS
LSA
, Tan
zani
a —
—
N
S —
—
—
—
—
—
—
—
—
M
asai
, Tan
zani
a .0
30
.013
N
S N
S —
.0
02
—
NS
NS
NS
—
.022
N
SM
esol
ithic
, Fra
nce
.011
N
S .0
05
NS
NS
.047
N
S N
S N
S N
S N
S N
S N
SN
atufi
an
.001
N
S .0
01
NS
.002
.0
06
NS
NS
NS
NS
NS
—
—N
ubia
n, S
udan
.0
01
.001
.0
01
—
.000
.0
01
NS
NS
NS
NS
NS
—
—Se
rovo
/Gla
zkov
o .0
01
.003
.0
01
.001
.0
00
.001
N
S .0
01
.021
N
S N
S N
S .0
01Ta
sman
ian
—
—
—
—
—
—
—
—
—
—
—
—
—
a Mea
sure
men
t abb
revi
atio
ns: F
XL
, fem
ur m
axim
um le
ngth
; TX
L, t
ibia
max
imum
leng
th; F
HD
, fem
oral
hea
d di
amet
er; B
IB, b
i-ili
ac b
read
th; A
rm, a
rm le
ngth
; Leg
, le
g le
ngth
; Bra
ch, b
rach
ial i
ndex
; Cru
r, cr
ural
inde
x.b p-
Val
ues
are
for
com
pari
sons
with
oth
er p
opul
atio
ns.
All
repo
rted
p-v
alue
s in
dica
te s
ignific
ant
resu
lts o
f G
ames
-How
ell
pair
wis
e po
st h
oc c
ompa
riso
ns.
NS,
no
nsig
nific
ant.
—, s
ampl
e si
ze to
o lo
w to
allo
w p
airw
ise
com
pari
son.
78 / STOCK
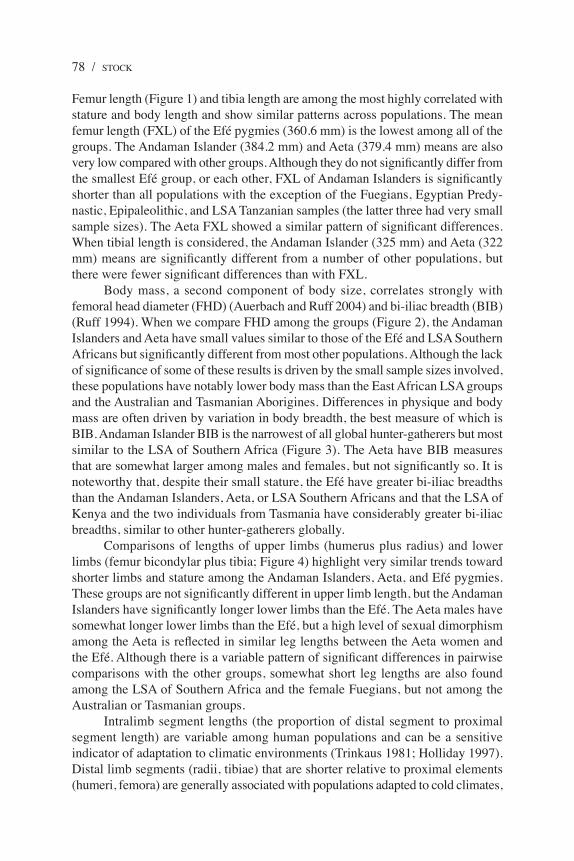
Femur length (Figure 1) and tibia length are among the most highly correlated with stature and body length and show similar patterns across populations. The mean femur length (FXL) of the Efé pygmies (360.6 mm) is the lowest among all of the groups. The Andaman Islander (384.2 mm) and Aeta (379.4 mm) means are also very low compared with other groups. Although they do not significantly differ from the smallest Efé group, or each other, FXL of Andaman Islanders is significantly shorter than all populations with the exception of the Fuegians, Egyptian Predy-nastic, Epipaleolithic, and LSA Tanzanian samples (the latter three had very small sample sizes). The Aeta FXL showed a similar pattern of significant differences. When tibial length is considered, the Andaman Islander (325 mm) and Aeta (322 mm) means are significantly different from a number of other populations, but there were fewer significant differences than with FXL.
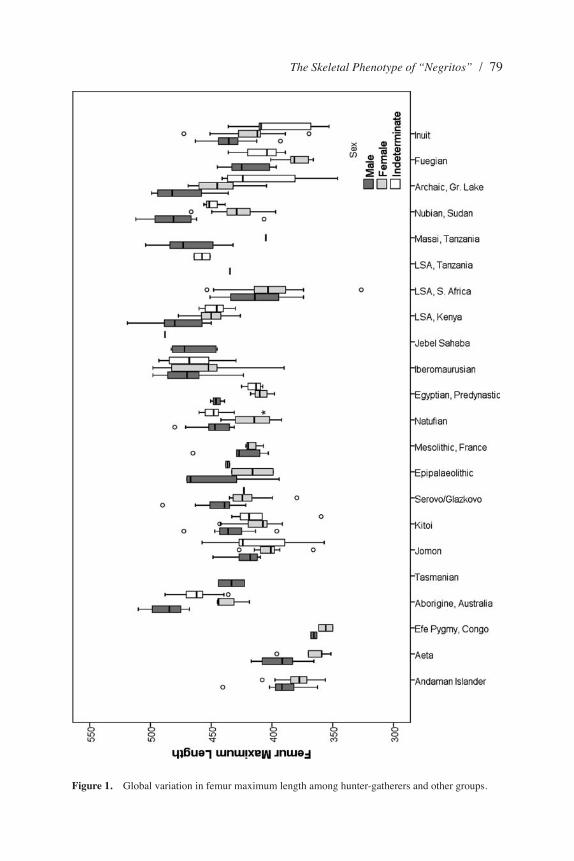
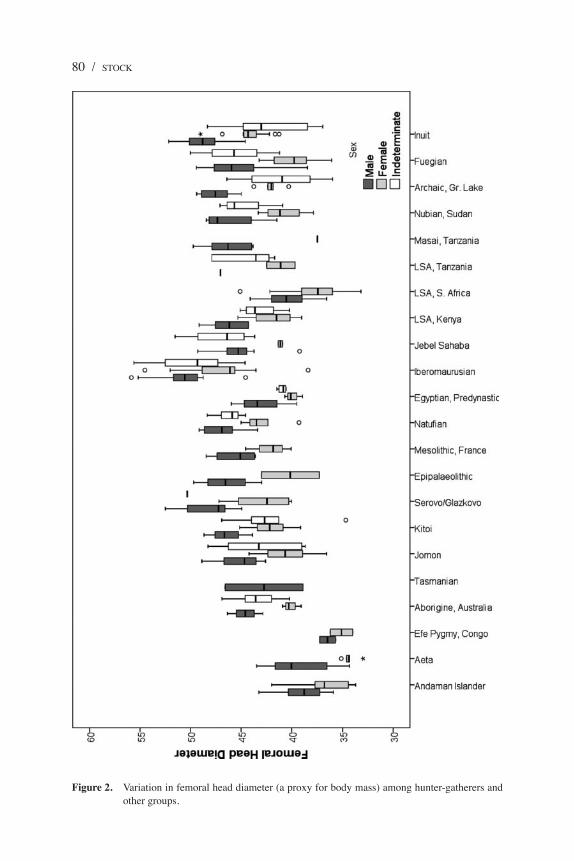
Body mass, a second component of body size, correlates strongly with femoral head diameter (FHD) (Auerbach and Ruff 2004) and bi-iliac breadth (BIB) (Ruff 1994). When we compare FHD among the groups (Figure 2), the Andaman Islanders and Aeta have small values similar to those of the Efé and LSA Southern Africans but significantly different from most other populations. Although the lack of significance of some of these results is driven by the small sample sizes involved, these populations have notably lower body mass than the East African LSA groups and the Australian and Tasmanian Aborigines. Differences in physique and body mass are often driven by variation in body breadth, the best measure of which is BIB. Andaman Islander BIB is the narrowest of all global hunter-gatherers but most similar to the LSA of Southern Africa (Figure 3). The Aeta have BIB measures that are somewhat larger among males and females, but not significantly so. It is noteworthy that, despite their small stature, the Efé have greater bi-iliac breadths than the Andaman Islanders, Aeta, or LSA Southern Africans and that the LSA of Kenya and the two individuals from Tasmania have considerably greater bi-iliac breadths, similar to other hunter-gatherers globally.
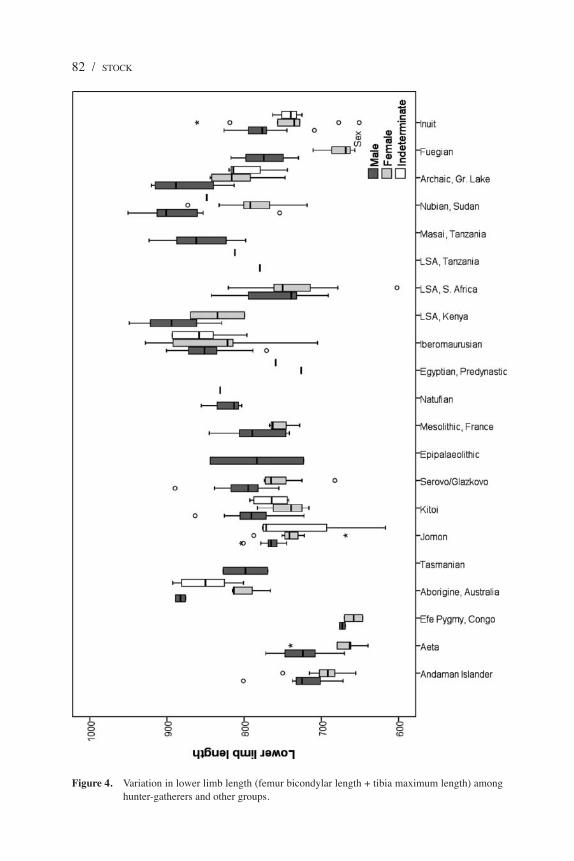
Comparisons of lengths of upper limbs (humerus plus radius) and lower limbs (femur bicondylar plus tibia; Figure 4) highlight very similar trends toward shorter limbs and stature among the Andaman Islanders, Aeta, and Efé pygmies. These groups are not significantly different in upper limb length, but the Andaman Islanders have significantly longer lower limbs than the Efé. The Aeta males have somewhat longer lower limbs than the Efé, but a high level of sexual dimorphism among the Aeta is reflected in similar leg lengths between the Aeta women and the Efé. Although there is a variable pattern of significant differences in pairwise comparisons with the other groups, somewhat short leg lengths are also found among the LSA of Southern Africa and the female Fuegians, but not among the Australian or Tasmanian groups.
Intralimb segment lengths (the proportion of distal segment to proximal segment length) are variable among human populations and can be a sensitive indicator of adaptation to climatic environments (Trinkaus 1981; Holliday 1997). Distal limb segments (radii, tibiae) that are shorter relative to proximal elements (humeri, femora) are generally associated with populations adapted to cold climates,
The Skeletal Phenotype of “Negritos” / 79
Figure 1. Global variation in femur maximum length among hunter-gatherers and other groups.
80 / STOCK
Figure 2. Variation in femoral head diameter (a proxy for body mass) among hunter-gatherers and other groups.
The Skeletal Phenotype of “Negritos” / 81
Figure 3. Variation in bi-iliac breadth among hunter-gatherers and other groups.
82 / STOCK
Figure 4. Variation in lower limb length (femur bicondylar length + tibia maximum length) among hunter-gatherers and other groups.
The Skeletal Phenotype of “Negritos” / 83
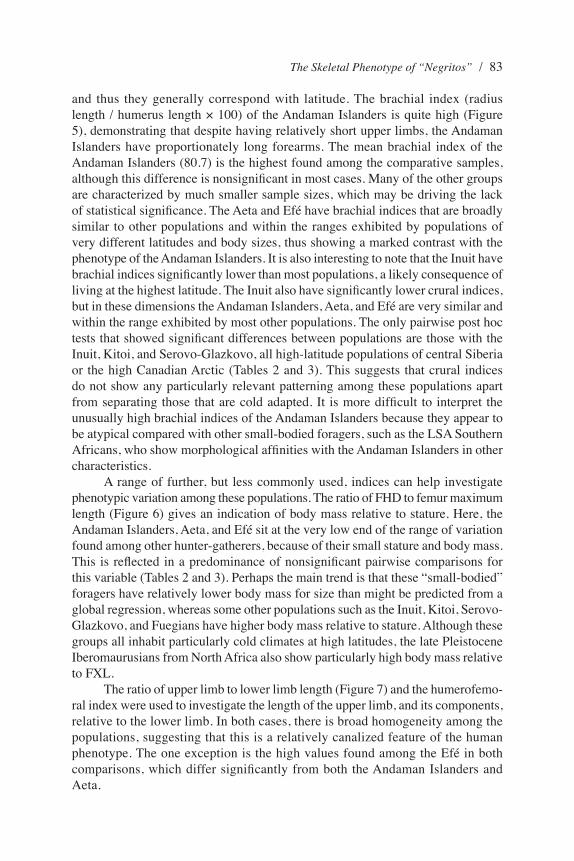
and thus they generally correspond with latitude. The brachial index (radius length / humerus length × 100) of the Andaman Islanders is quite high (Figure 5), demonstrating that despite having relatively short upper limbs, the Andaman Islanders have proportionately long forearms. The mean brachial index of the Andaman Islanders (80.7) is the highest found among the comparative samples, although this difference is nonsignificant in most cases. Many of the other groups are characterized by much smaller sample sizes, which may be driving the lack of statistical significance. The Aeta and Efé have brachial indices that are broadly similar to other populations and within the ranges exhibited by populations of very different latitudes and body sizes, thus showing a marked contrast with the phenotype of the Andaman Islanders. It is also interesting to note that the Inuit have brachial indices significantly lower than most populations, a likely consequence of living at the highest latitude. The Inuit also have significantly lower crural indices, but in these dimensions the Andaman Islanders, Aeta, and Efé are very similar and within the range exhibited by most other populations. The only pairwise post hoc tests that showed significant differences between populations are those with the Inuit, Kitoi, and Serovo-Glazkovo, all high-latitude populations of central Siberia or the high Canadian Arctic (Tables 2 and 3). This suggests that crural indices do not show any particularly relevant patterning among these populations apart from separating those that are cold adapted. It is more difficult to interpret the unusually high brachial indices of the Andaman Islanders because they appear to be atypical compared with other small-bodied foragers, such as the LSA Southern Africans, who show morphological affinities with the Andaman Islanders in other characteristics.
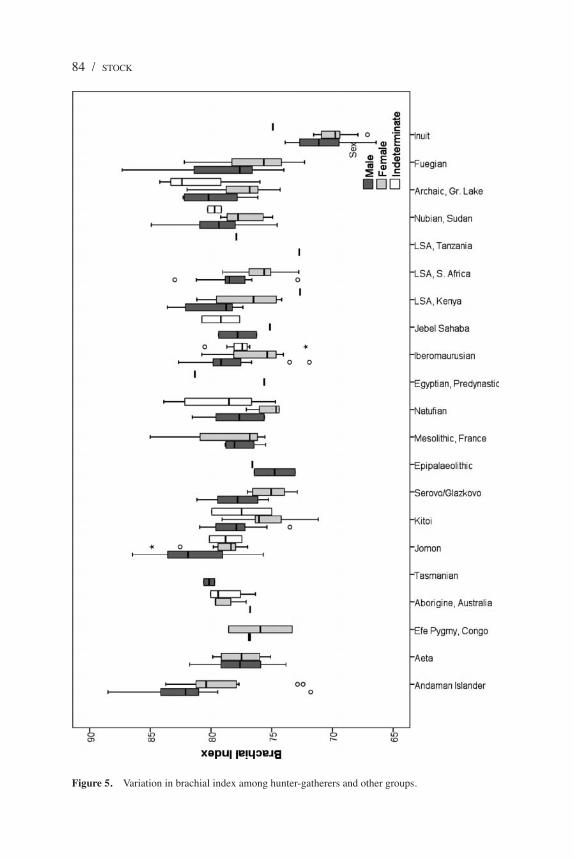
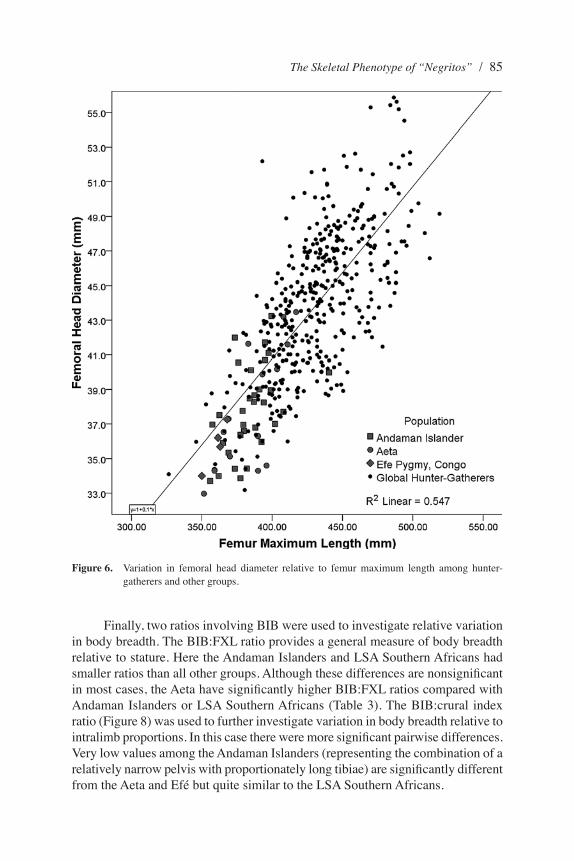
A range of further, but less commonly used, indices can help investigate phenotypic variation among these populations. The ratio of FHD to femur maximum length (Figure 6) gives an indication of body mass relative to stature. Here, the Andaman Islanders, Aeta, and Efé sit at the very low end of the range of variation found among other hunter-gatherers, because of their small stature and body mass. This is reflected in a predominance of nonsignificant pairwise comparisons for this variable (Tables 2 and 3). Perhaps the main trend is that these “small-bodied” foragers have relatively lower body mass for size than might be predicted from a global regression, whereas some other populations such as the Inuit, Kitoi, Serovo-Glazkovo, and Fuegians have higher body mass relative to stature. Although these groups all inhabit particularly cold climates at high latitudes, the late Pleistocene Iberomaurusians from North Africa also show particularly high body mass relative to FXL.
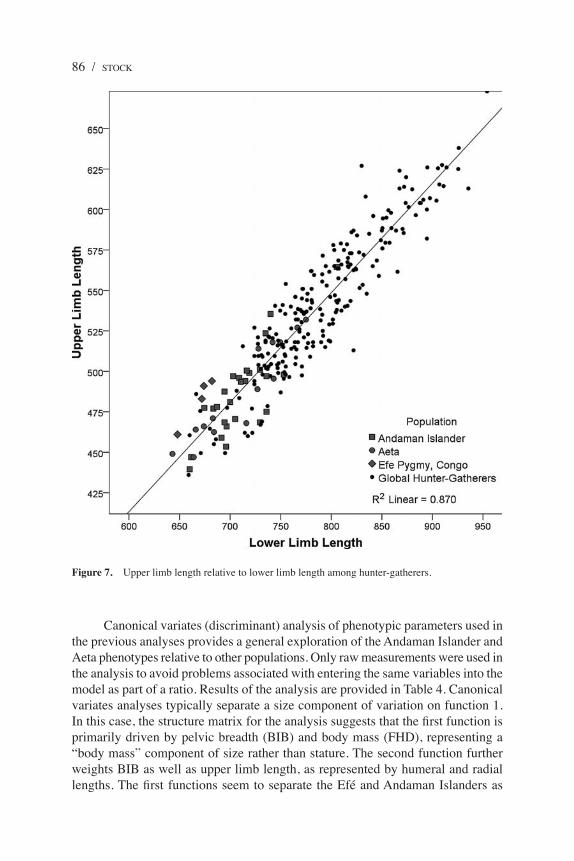
The ratio of upper limb to lower limb length (Figure 7) and the humerofemo-ral index were used to investigate the length of the upper limb, and its components, relative to the lower limb. In both cases, there is broad homogeneity among the populations, suggesting that this is a relatively canalized feature of the human phenotype. The one exception is the high values found among the Efé in both comparisons, which differ significantly from both the Andaman Islanders and Aeta.
84 / STOCK
Figure 5. Variation in brachial index among hunter-gatherers and other groups.
The Skeletal Phenotype of “Negritos” / 85
Figure 6. Variation in femoral head diameter relative to femur maximum length among hunter-gatherers and other groups.
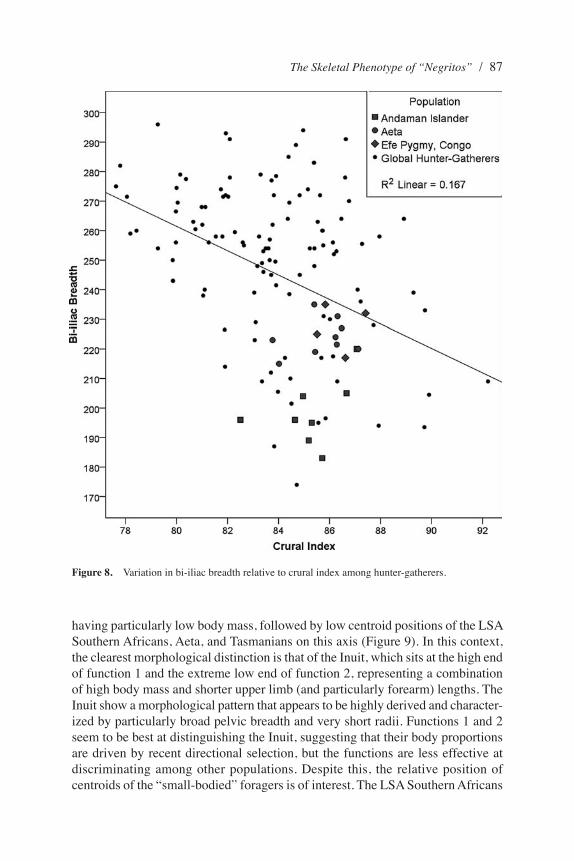
Finally, two ratios involving BIB were used to investigate relative variation in body breadth. The BIB:FXL ratio provides a general measure of body breadth relative to stature. Here the Andaman Islanders and LSA Southern Africans had smaller ratios than all other groups. Although these differences are nonsignificant in most cases, the Aeta have significantly higher BIB:FXL ratios compared with Andaman Islanders or LSA Southern Africans (Table 3). The BIB:crural index ratio (Figure 8) was used to further investigate variation in body breadth relative to intralimb proportions. In this case there were more significant pairwise differences. Very low values among the Andaman Islanders (representing the combination of a relatively narrow pelvis with proportionately long tibiae) are significantly different from the Aeta and Efé but quite similar to the LSA Southern Africans.
86 / STOCK
Figure 7. Upper limb length relative to lower limb length among hunter-gatherers.
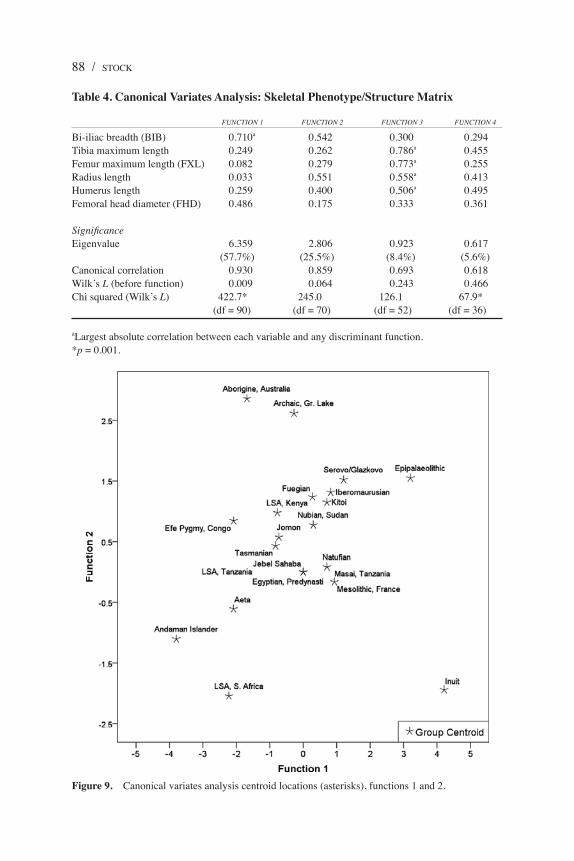
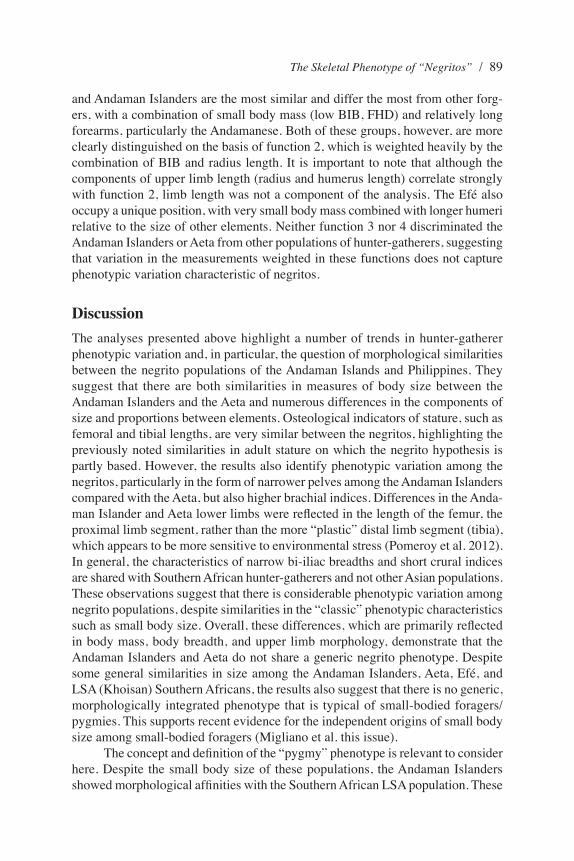
Canonical variates (discriminant) analysis of phenotypic parameters used in the previous analyses provides a general exploration of the Andaman Islander and Aeta phenotypes relative to other populations. Only raw measurements were used in the analysis to avoid problems associated with entering the same variables into the model as part of a ratio. Results of the analysis are provided in Table 4. Canonical variates analyses typically separate a size component of variation on function 1. In this case, the structure matrix for the analysis suggests that the first function is primarily driven by pelvic breadth (BIB) and body mass (FHD), representing a “body mass” component of size rather than stature. The second function further weights BIB as well as upper limb length, as represented by humeral and radial lengths. The first functions seem to separate the Efé and Andaman Islanders as
The Skeletal Phenotype of “Negritos” / 87
having particularly low body mass, followed by low centroid positions of the LSA Southern Africans, Aeta, and Tasmanians on this axis (Figure 9). In this context, the clearest morphological distinction is that of the Inuit, which sits at the high end of function 1 and the extreme low end of function 2, representing a combination of high body mass and shorter upper limb (and particularly forearm) lengths. The Inuit show a morphological pattern that appears to be highly derived and character-ized by particularly broad pelvic breadth and very short radii. Functions 1 and 2 seem to be best at distinguishing the Inuit, suggesting that their body proportions are driven by recent directional selection, but the functions are less effective at discriminating among other populations. Despite this, the relative position of centroids of the “small-bodied” foragers is of interest. The LSA Southern Africans
Figure 8. Variation in bi-iliac breadth relative to crural index among hunter-gatherers.
88 / STOCK
Figure 9. Canonical variates analysis centroid locations (asterisks), functions 1 and 2.
Table 4. Canonical Variates Analysis: Skeletal Phenotype/Structure Matrix
FUNCTION 1 FUNCTION 2 FUNCTION 3 FUNCTION 4
Bi-iliac breadth (BIB) 0.710a 0.542 0.300 0.294Tibia maximum length 0.249 0.262 0.786a 0.455Femur maximum length (FXL) 0.082 0.279 0.773a 0.255Radius length 0.033 0.551 0.558a 0.413Humerus length 0.259 0.400 0.506a 0.495Femoral head diameter (FHD) 0.486 0.175 0.333 0.361
Significance Eigenvalue 6.359 2.806 0.923 0.617 (57.7%) (25.5%) (8.4%) (5.6%)Canonical correlation 0.930 0.859 0.693 0.618Wilk’s L (before function) 0.009 0.064 0.243 0.466Chi squared (Wilk’s L) 422.7* 245.0 126.1 67.9* (df =.90) (df =.70) (df =.52) (df =.36)
aLargest absolute correlation between each variable and any discriminant function.*p = 0.001.
The Skeletal Phenotype of “Negritos” / 89
and Andaman Islanders are the most similar and differ the most from other forg-ers, with a combination of small body mass (low BIB, FHD) and relatively long forearms, particularly the Andamanese. Both of these groups, however, are more clearly distinguished on the basis of function 2, which is weighted heavily by the combination of BIB and radius length. It is important to note that although the components of upper limb length (radius and humerus length) correlate strongly with function 2, limb length was not a component of the analysis. The Efé also occupy a unique position, with very small body mass combined with longer humeri relative to the size of other elements. Neither function 3 nor 4 discriminated the Andaman Islanders or Aeta from other populations of hunter-gatherers, suggesting that variation in the measurements weighted in these functions does not capture phenotypic variation characteristic of negritos.
Discussion
The analyses presented above highlight a number of trends in hunter-gatherer phenotypic variation and, in particular, the question of morphological similarities between the negrito populations of the Andaman Islands and Philippines. They suggest that there are both similarities in measures of body size between the Andaman Islanders and the Aeta and numerous differences in the components of size and proportions between elements. Osteological indicators of stature, such as femoral and tibial lengths, are very similar between the negritos, highlighting the previously noted similarities in adult stature on which the negrito hypothesis is partly based. However, the results also identify phenotypic variation among the negritos, particularly in the form of narrower pelves among the Andaman Islanders compared with the Aeta, but also higher brachial indices. Differences in the Anda-man Islander and Aeta lower limbs were reflected in the length of the femur, the proximal limb segment, rather than the more “plastic” distal limb segment (tibia), which appears to be more sensitive to environmental stress (Pomeroy et al. 2012). In general, the characteristics of narrow bi-iliac breadths and short crural indices are shared with Southern African hunter-gatherers and not other Asian populations. These observations suggest that there is considerable phenotypic variation among negrito populations, despite similarities in the “classic” phenotypic characteristics such as small body size. Overall, these differences, which are primarily reflected in body mass, body breadth, and upper limb morphology, demonstrate that the Andaman Islanders and Aeta do not share a generic negrito phenotype. Despite some general similarities in size among the Andaman Islanders, Aeta, Efé, and LSA (Khoisan) Southern Africans, the results also suggest that there is no generic, morphologically integrated phenotype that is typical of small-bodied foragers/pygmies. This supports recent evidence for the independent origins of small body size among small-bodied foragers (Migliano et al. this issue).
The concept and definition of the “pygmy” phenotype is relevant to consider here. Despite the small body size of these populations, the Andaman Islanders showed morphological affinities with the Southern African LSA population. These
90 / STOCK
represent mid-Holocene hunter-gatherers along the southern and eastern capes of Southern Africa, the ancestors of the contemporary Khoisan who possess some of the most ancient genetic lineages yet identified. Although this cannot be interpreted as evidence for close common ancestry of these populations, it provides some phenotypic predictions that require testing among other negrito populations. It also supports analyses of cranial variation among the Andaman Islanders (Bulbeck this issue), which suggests that they show affinities to African groups; however, it is interesting to note that the postcranial affinities noted in this study are not shared with the East African or North African groups. In the present analyses, neither the Andaman Islanders nor Aeta show any particular morphological similarities with either Asian foragers such as the Jomon or Australian or Tasmanian populations.
The differences highlighted by these analyses suggest that consideration of hypotheses of negrito origins needs to go beyond stature as phenotypic indicator. This study has highlighted considerable variation in phenotype among “small-bodied” hunter-gatherers; however, it is worth considering the extent to which phenotypic characteristics are canalized or plastic in response to environmental variation (Stock and Buck 2010). Human paleontologists often make assumptions about the genetic basis for skeletal traits, and hence their evolutionary stability, but the interpretation of skeletal variation is confounded by aspects of developmental and environmental plasticity (Stock 2012). The variables used in this study relate to stature and body mass, aspects of physique that can be both highly heritable and susceptible to intergenerational plasticity (Wells and Stock 2011). The Andaman Islanders exhibit a very narrow pelvis (BIB) similar to the Khoisan, which is both absolutely narrow and narrow relative to limb lengths. Previous studies have investigated the narrow pelvic dimensions of the Andaman Islanders and Khoisan/LSA Southern Africans (Kurki 2007, 2011) but it is somewhat surprising that this characteristic is not shared with other small-bodied foragers such as the Aeta. Pelvic dimensions have recently been shown to carry phylogenetic information relevant to human population history (Betti et al. 2012, 2013); however, we know very little about the mechanisms controlling other skeletal dimensions. Pelvic dimen-sions, for example, may vary with ecological parameters, diet, and other aspects of phenotype (Wells et al. 2012). In addition, lower limb length, in particular, the dimensions of the tibia, appears to be relatively sensitive to environmental variation (Trinkaus 1981; Holliday 1997; Stock 2012). It remains to be determined whether the morphology of the upper limb is as sensitive to the environment as is that of the lower limb, or is more genetically stable.
Although we cannot directly test the ancestry of negrito populations using postcranial morphology, any theory attempting to explain the phenotypic character-istics of these populations needs to account for their phenotypic variation, through mechanisms of either long-term natural selection or shorter-term plasticity. Future research is required to understand the mechanisms controlling this variation in the human phenotype. This will ultimately help us to resolve our understanding of the phenotypic characteristics that form the basis of the negrito hypothesis.
The Skeletal Phenotype of “Negritos” / 91
Acknowledgments The author would like to thank the many curators who provided ac-cess to the skeletal material measured for this study; Ben Auerbach for making data from the Aeta, Efé, and one of the Tasmanian skeletons available; and two anonymous reviewers whose comments greatly improved this work. Finally, thanks to Philip Endicott for inviting me to participate in this workshop and for further comments and discussions that improved this study.
Received 20 September 2012; revision accepted for publication 7 March 2013.
Literature CitedAllen, J. A. 1877. The influence of physical conditions in the genesis of species. Radical Rev. 1:108–
140.Auerbach, B. M. 2012. Skeletal variation among early Holocene North American humans: Implica-
tions for origins and diversity in the Americas. Am. J. Phys. Anthropol. 149:525–536.Auerbach, B. M., and C. B. Ruff. 2004. Human body mass estimation: A comparison of “morphomet-
ric” and “mechanical” methods. Am. J. Phys. Anthropol. 125:331–342.Auerbach, B. M., and C. B. Ruff. 2006. Limb bone bilateral asymmetry: Variability and commonality
among modern humans. J. Hum. Evol. 50:203–218.Banerjee, A. R., S. Banerjee, and D. K. Majhi. 1984. Hair characteristics of the Great Andamanese of
Andaman Islands. Indian J. Phys. Anthropol. Hum. Genet. 10:130–141.Barik, S. S., R. Sahani, B. V. R. Prasad et al. 2008. Detailed mtDNa genotypes permit a reassessment
of the settlement and population structure of the Andaman Islands. Am. J. Phys. Anthropol. 136:19–27.
Barrows, D. P. 1910. The negrito and allied types in the Philippines. Am. Anthropol. 12:358–377.Becker, N. S. A., P. Verdu, A. Froment et al. 2011. Indirect evidence for the genetic determination of
short stature in African pygmies. Am. J. Phys. Anthropol. 145:390–401.Bergmann, C. 1847. Über die Verhältnisse der Wärmeökonomie der Tiere zu ihrer Grösse. Göttinger
Stud. 3:595–708.Betti, L., N. von Cramon-Taubadel, and S. J. Lycett. 2012. Human pelvis and long bones reveal dif-
ferential preservation of ancient population history and migration out of Africa. Hum. Biol. 84:139–152.
Betti, L., N. von Cramon-Taubadel, A. Manica et al. 2013. Global geometric morphometric analyses of the human pelvis reveal substantial neutral population history effects, even across sexes. PLoS ONE 8:e55909.
Bhasin, M. K., H. Walter, and H. Danker-Hopfe. 1994. People of India: An Investigation of Biological Variability in Ecological, Ethno-economic, and Linguistic Groups. Delhi: Kamla-Raj Enter-prises.
Bogin, B., P. K. Smith, A. B. Orden et al. 2002. Rapid change in height and body proportions of Maya American children. Am. J. Hum. Biol. 14:753–761.
Bulbeck, D. 2013. Craniodental affinities of Southeast Asia’s “negritos” and the concordance with their genetic affinities. Hum. Biol. 85:95–134.
Carey, I. 1976. Orang Asli: The Aboriginal Tribes of Peninsular Malaysia. Kuala Lumpur: Oxford University Press.
Chaubey, G., and P. Endicott. 2013. The Andaman Islanders in a regional genetic context: Reex-amining the evidence for an early peopling of the archipelago from South Asia. Hum. Biol. 85:153–172.
Cipriani, L. 1962. Recent anthropological work in Little Andaman. Curr. Anthropol. 2:208–209.Coon, C. S. 1965. The Living Races of Man. New York: Knopf.
92 / STOCK
Cooper, Z. 1993. The origins of the Andaman Islanders: Local myth and archeological evidence. Antiquity 67:394–399.
Cowgill, L. W., C. D. Eleazer, B. M. Auerbach et al. 2012. Developmental variation in ecogeographic body proportions. Am. J. Phys. Anthropol. 148:557–570.
Détroit, F., J. Corny, E. Z. Dizon, and A. S. Mijares. 2013. “Small size” in the Philippine human fossil record: Is it meaningful for a better understanding of the evolutionary history of the negritos? Hum. Biol. 85:45–66.
Dutta, P. C. 1963. Recent research on kitchen-middens in the Andamans. Curr. Anthropol. 4:356.Eveleth, P. B., and J. M. Tanner. 1990. Worldwide Variation in Human Growth. New York: Cambridge
University Press.Genet-Varcin, E. 1951. Les Négritos de L’île de Luçon (Philippines). Paris: Masson et Cie.Hagelberg, E., N. Goldman, P. Lió et al. 1999. Evidence for mitochondrial DNA recombination in a
human population of island Melanesia. Proc. R. Soc. Lond. B Biol. Sci. 266:485–492.Hanihara, T. 1989. Affinities of the Philippine negritos as viewed from dental characters: A prelimi-
nary report. J. Anthropol. Soc. Nippon 97:327–329.Hanihara, T. 1990. Affinities of the Philippine negritos with Japanese and Pacific populations based
on dental measurements: The basic populations in East Asia, I. J. Anthropol. Soc. Nippon 98:13–27.
Hanihara, T. 1992. Negritos, Australian Aborigines and the “proto-Sundadont” dental pattern: The basic populations in East Asia, V. Am. J. Phys. Anthropol. 88:183–196.
Hanihara, T. 1993. Cranial morphological contrasts between negritos, Australians, and neighboring populations. Anthropol. Sci. 101:389–404.
Harihara, S., M. Hirai, Y. Suutou et al. 1992. Frequency of a 9-bp deletion in the mitochondrial DNA among Asian populations. Hum. Biol. 64:161–166.
Harihara, S., N. Saitou, M. Hirai et al. 1988. Mitochondrial DNA polymorphism among five Asian populations. Am. J. Hum. Genet. 43:134–143.
Hiernaux, J. 1975. The People of Africa. New York: Scribner.Holliday, T. W. 1997. Body proportions in Late Pleistocene Europe and modern human origins. J.
Hum. Evol. 32:423–447.Holliday, T. W., and A. B. Falsetti. 1999. A new method for discriminating African-American from
European-American skeletons using postcranial osteometrics reflective of body shape. J. Fo-rensic Sci. 44:926–930.
Holliday, T. W., and C. B. Ruff. 2001. Relative variation in human proximal and distal limb segments. Am. J. Phys. Anthropol. 116:26–33.
Horai, S., K. Omoto, T. Juji et al. 1981. The HLA antigens of two negrito populations in the Philip-pines. Tissue Antigens 17:343–348.
Howells, W. W. 1973. Cranial Variation in Man: A Study by Multivariate Analysis of Patterns of Difference among Recent Human Populations. Papers of the Peabody Museum of Archaeology and Ethnology 67. Cambridge, MA: Harvard University.
Kashyap, V. K., T. Sitalaximi, B. N. Sarkar et al. 2003. Molecular relatedness of the aboriginal groups of Andaman and Nicobar Islands with similar ethnic populations. Int. J. Hum. Genet. 3:5–11.
Katzmarzyk, P. T., and W. R. Leonard. 1998. Climatic influences on human body size and proportions: Ecological adaptations and secular trends. Am. J. Phys. Anthropol. 106:483–503.
Kurki, H. K. 2007. Protection of obstetric dimensions in a small-bodied human sample. Am. J. Phys. Anthropol. 133:1,152–1,165.
Kurki H. K. 2011. Pelvic dimorphism in relation to body size and body size dimorphism in humans. J. Hum. Evol. 61:631–643.
Kurki, H. K., J. K. Ginter, J. T. Stock et al. 2008. Adult proportionality in small-bodied foragers: A test of ecogeographic expectations. Am. J. Phys. Anthropol. 136:28–38.
Matsumoto, H., T. Miyazaki, K. Omoto et al. 1999. Population genetic studies of the Philippine negri-tos. II Gm and Km allotypes of three population groups. Am. J. Hum. Genet. 31:70–76.
The Skeletal Phenotype of “Negritos” / 93
Migliano, A. B., I. G. Romero, M. Mespalu et al. 2013. Evolution of the pygmy phenotype: Evidence of positive selection from genome-wide scans in African, Asian, and Melanesian pygmies. Hum. Biol. 85:251–284.
Migliano, A. B., L. Vinicius, and M. Mirazón Lahr. 2007. Life-history trade-offs explain the evolution of human pygmies. Proc. Natl. Acad. Sci. USA 54:20,216–20,219.
Mitsui, H., T. Juji., Sonozaki, H., et al. 1992. HLA in the negrito. Arthritis Rheum. 24:977–978.Mukerjee, M. 1999. Out of Africa, into Asia: Controversial DNA studies link Asian hunter-gatherers
to African pygmies. Sci. Am. 280:24.Myka, F. P. 1993. Decline of Indigenous Populations: The Case of the Andaman Islanders. Jaipur:
Rawat Publications.Omoto, K. 1980. Genetic variants of red cell enzymes as potential anthropological markers in the
Western Pacific. Hemoglobin 4:755–760.Omoto, K. 1984. The negritos: Genetic origins and microevolution. Acta Anthropogenet. 8:137–147.Omoto, K., S. Misawa, S. Harada et al. 1978. Population genetic studies of the Philippine negritos. I.
A pilot survey of red cell enzyme and serum protein groups. Am. J. Hum. Genet. 30:190–201.Pal, A. 1987. Dental morphology of the Andaman negritos. Hum. Sci. 34:327–345.Pearson, O. M. 2000. Postcranial remains and the origin of modern humans. Evol. Anthropol. 9:229–
247.Pomeroy, E., J. T. Stock, S. Stanojevic et al. 2012. Trade-offs in relative limb length among Peruvian
children: Extending the thrifty phenotype hypothesis to limb proportions. PLoS ONE 7:e51795.Radcliffe-Brown, A. R. 1964. The Andaman Islanders. New York: Free Press.Reich, D., K. Thangaraj, N. Patterson et al. 2009. Reconstructing Indian population history. Nature
461:489–494.Roberts, D. F. 1978. Climate and Human Variability. Menlo Park, CA: Cummings.Ruff, C. B. 1991. Climate and body shape in hominid evolution. J. Hum. Evol. 21:81–105.Ruff, C. B. 1994. Morphological adaptation to climate in modern and fossil hominids. Yrbk. Phys.
Anthropol. 37:65–107.Stock, J. T. 2006. Hunter-gatherer postcranial robusticity relative to patterns of mobility, climatic
adaptation and selection for tissue economy. Am. J. Phys. Anthropol. 131:194–204.Stock, J. T. 2012. Human evolution after the origin of our species: Bridging the gap between palaeo-
anthropology and bioarchaeology. In Proceedings of the 12th Annual Conference of the British Association for Biological Anthropology and Osteoarchaeology (BABAO), P. Mitchell and J. Buckberry, eds. Oxford: Archaeopress, 3–15.
Stock, J. T., V. I. Bazaliiskii, O. I. Goriunova et al. 2010. Skeletal morphology, climatic adaptation and habitual behaviour among the mid-Holocene populations of the Cis-Baikal, relative to other hunter-gatherers. In Prehistoric Hunter-Gatherers of the Baikal Region, Siberia: Bioarchaeo-logical Studies of Past Lifeways, A. Weber, M. A. Katzenberg, and T. Schurr, eds. Philadelphia: University of Pennsylvania Museum of Archaeology and Anthropology, 193–216.
Stock, J. T., and L. Buck. 2010. Canalization and plasticity in humans and primates: Implications for interpreting the fossil record. In 150 años después de Darwin: Evolución, future o crisis? Lecciones sobre evolución humana, A. Perote Alejandre and A. Mateos Cachorro, eds. Madrid: Instituto Tomás Pascual Sanz/Centro Nacional de Investigación sobre la Evolución Humana, 91–101.
Stock, J. T., and A. B. Migliano. 2009. Stature, mortality, and life history among indigenous popula-tions of the Andaman Islands, 1871–1986. Curr. Anthropol. 50:713–725.
Stock, J. T., M. Mirazón-Lahr, and S. Kulatilake. 2007. Cranial diversity in South Asia, relative to human dispersals and global patterns of human variation. In The Evolution and History of Human Populations in South Asia: Inter-disciplinary studies in Archaeology, Biological An-thropology, Linguistics and Genetics, M. D. Petraglia and B. Allchin, eds. Dordrecht: Springer/Kluwer, 245–268.
Stock, J. T., M. O’Neill, C. B. Ruff et al. 2011. Body size, skeletal biomechanics, mobility and habitual activity from the Late Palaeolithic to mid-Dynastic Nile Valley. In Human Bioarchaeology of
94 / STOCK
the Transition to Agriculture, R. Pinhasi and J. T. Stock, eds. Chichester, UK: Wiley-Blackwell, 347–370.
Stock, J. T., and S. Pfeiffer. 2001. Linking structural variability in long bone diaphyses to habitual behavior: Foragers from the Southern African Later Stone Age and the Andaman Islands. Am. J. Phys. Anthropol. 115:337–334.
Stock, J. T., S. Pfeiffer, M. Chazan et al. 2005. The F-81 skeleton from Wadi Mataha, Jordan, and its bearing on human variability in the Epipaleolithic of the Levant. Am. J. Phys. Anthropol. 128:453–465.
Tanner, J. M., T. Hayashi, M. A. Preece et al. 1982. Increase in length of leg relative to trunk in Japanese children and adults from 1957 to 1977: Comparison with British and with Japanese Americans. Ann. Hum. Biol. 9:411–423.
Temple, D. H., B. M. Auerbach, M. Nakatsukasa et al. 2008. Variation in limb proportions between Jomon foragers and Yayoi agriculturalists from prehistoric Japan. Am. J. Phys. Anthropol. 137:164–174.
Thangaraj, K., and G. Chaubey. 2005. Reconstructing the origin of Andaman Islanders. Science 308:996.
Thangaraj, K., G. Chaubey, and A. G. Reddy. 2006. Unique origin of Andaman Islanders: Insight from autosomal loci. J. Hum. Genet. 51:800–804.
Thangaraj, K., L. Singh, A. G. Reddy et al. 2003. Genetic affinities of the Andaman Islanders, a vanishing human population. Curr. Biol. 13:86–93.
Trinkaus, E. 1981. Neanderthal limb proportions and cold adaptation. In Aspects of Human Evolution, C. B. Stringer, ed. London: Taylor and Francis, 187–224.
Turner, C. G., and J. F. Eder. 2006. Dentition of the Batak people of Palawan Island, the Philippines: Southeast Asian negrito origins. In Bioarchaeology of Southeast Asia, M. Oxenham and N. Tayles, eds. New York: Cambridge University Press, 172–187.
Watkins, W. S., M. Bamshad, M. E. Dixon et al. 1999. Multiple origins of the mtDNA 9-bp deletion in populations of South India. Am. J. Phys. Anthropol. 109:147–158.
Wells, J. C. K., J. M. DeSilva, and J. T. Stock. 2012. The obstetric dilemma: An ancient game of Russian roulette, or a variable dilemma sensitive to ecology? Yrbk. Phys. Anthropol. 55:40–71.
Wells, J. C. K., and J. T. Stock. 2007. The biology of the colonizing ape. Yrbk. Phys. Anthropol. 50:191–222.
Wells, J. C. K., and J. T. Stock. 2011. Re-examining heritability: Genetics, life history and plasticity.
Trends Endocrinol. Metabol. 22:421–428.