Embed Size (px)
Citation preview
14The Specialised Differences of Cities Matter in Today’sGlobal Economy
Saskia Sassen
209
There is no such entity as ‘the’ global economy in the sense of aseamless economy with clear hierarchies. The reality is a vastnumber of highly particular global circuits. Some of these arespecialised and others are not. Some are worldwide circuits,others are regional. Different circuits contain different groups ofcountries and cities. For instance, a city like Mumbai is today on aglobal circuit for real estate development investment that includesfirms from cities as diverse as London and Bogota. Globalcommodity trading in coffee includes as major hubs New York andSao Paulo. London, along with a dozen other cities, is on anunusually large number of these inter-city global circuits.
Viewed this way, the global economy is not seamless. It islumpy. It becomes concrete and specific. Cities located on many or
a few global circuits become part of distinct, often highlyspecialised inter-city geographies. Not only global economicforces feed this proliferation of inter-city geographies. Globalmigration, cultural work, international art and design annualfairs, civil society struggles around global issues; these and othersalso feed the formation and development of these geographies.These emergent inter-city geographies begin to function as aninfrastructure for multiple forms of globalisation. The other sideof these trends is an increasing urbanising of global networks.
Detailed research from the perspective of a given city makeslegible the diversity and specificity of a city’s location on some ormany of these circuits, and makes legible what are the other citieson each of these circuits. The mix of cities and circuits for a givencity partly depends and at the same time feeds the particularstrengths of a city. And so will the groups of cities on each circuit.This often brings out particular specialised differences of cities. Wenow know that these specialised differences matter. This alsomeans that there is less competition among cities and more of aglobal/regional division of functions than is commonly recognised.
In what follows the focus is on the economic urban dimen-sions.1 I focus particularly on the strengths and weaknesses ofLondon as a global city. It is worth noting that there is no perfectglobal city: in a globally networked economy, no city today canfunction like the imperial capitals of older periods. While Londonis in a group of cities that do extremely well, it also has somenotable weaknesses.
The deep economic history of a city matters
There is an interesting discovery that comes out of recognising thevalue of the specialised differences of cities and urban regions intoday’s global economy. It is that the deep economic history of a
Reforming the City
210
place matters for the type of knowledge economy a city or a city-region winds up developing. This goes against the common viewthat globalisation homogenises urban economies. How much thisdeep economic history matters varies, partly depending on theparticulars of a city’s or a region’s economy. But it matters morethan is commonly assumed, and it matters in ways that are notgenerally recognised. What globalisation homogenises is stan-dards: among these standards are the much noticed financialreporting and accounting standards. To this I add standards forbuilding state of the art office districts, spaces of consumption andhigh-end residential districts. It is these standards for the builtenvironment that often create the impression that urbaneconomies are being homogenised by globalisation. But globalisa-tion also rests and depends on diverse specialised economiccapabilities. In that regard I argue that the state of the officedistrict is today more akin to an infrastructure – necessary butindeterminate. In this indeterminacy, then, lies the possibility thatsimilarly built state of the art office districts, or financial centres,are producing rather diverse specialised components of the globalknowledge economy, including different types of financial activi-ties. London, with its long history of developing capabilities tomanage vast imperial geographies has, not surprisingly, becomethe leading global city in the world today. It has long known how tohandle complex cross-border transactions and tensions.
The capabilities needed to trade, finance, service, and investglobally need to be produced. Such capabilities are not simply afunction of the power of multinational firms and telecommunica-tions advances. The global city is a platform for producing thesetypes of global capabilities, even when it requires large numbers offoreign firms, as is the case in cities as diverse as Beijing andBuenos Aires. Each of the 70 plus major and minor global cities inthe world contributes to produce that capability in its homecountry and thereby to function as a bridge between its national
The Specialised Differences of Cities Matter in Today’s Global Economy
211
economy and the global economy. In this networked, multi-citygeography, most of the 250,000 plus multinational corporationsin the world have kept their headquarters in their home countries,no matter the thousands of affiliates, subsidiaries and offshoresourcing sites that they may have around the globe.
Within a vast and diverse region such as Europe it has nowbecome clear that several cities function as key hubs, each repre-senting a distinctive mix of strengths. In a top tier we findLondon, Paris, and Frankfurt. In the top ten we have besides thesethree: Amsterdam, Madrid, Copenhagen, Stockholm, Zurich,Milan, and Berlin. This points to the fact of an increasingly multi-sited platform for the global operations of firms and exchanges.As some of the data discussed next shows, a city like Copenhagenhas become a sort of Dubai for Europe: a platform from which todo European-level operations. Firms do not locate there only toinvest in the country.
The other side of this dynamic is that for a firm to go global ithas to put down its feet in multiple cities that function as entrypoints into national and/or regional economies. This bridgingcapacity is critical: the multiple circuits connecting major andminor global cities are the live infrastructure of the globaleconomy. It indicates that cities do not simply compete with eachother, as is so often asserted. A global firm does not want oneglobal city, even if it is the best in the world. Depending what a firmmakes or sells, different groups of cities will be desirable, and theywill go to these cities even if they have some serious negatives.
This contributes to explaining why the number of globalcities has kept growing since the 1980s when this phase began,and why none of them is dying, not even with the financial crisis.What the crisis has done is to destroy a number of firms and toreduce the overall capital of firms and markets –besides thelarger macroeconomic effects and a sharp rise in unemployment.Particular specialised sectors have clearly been hurt (or disci-
Reforming the City
212
plined!) more than others. I return to this in the last section ofthe chapter.
There is no perfect global city
A large study of 75 cities, using over 60 measures provides twocritical sets of measures. One is the growing strength of Europeancities. The second is that not even the most powerful global cities,such as London and New York, rank at the top in all measures.
On the first point, very briefly, the rise of European citiespoints to the larger story of the rise of a multipolar world. The lossof position of US cities is part of this shift: Los Angeles fell fromthe 10th to the 17th rank, and Boston from the 12th to the 23rd,while European and Asian cities moved in the top ranks, notablyMadrid going from 17th to 11th.2 It is not that the US is suddenlypoorer, it is that other regions of the world are rising and thatthere are multiple forces feeding the multi-sited character ofeconomic, political, and cultural globalisation.
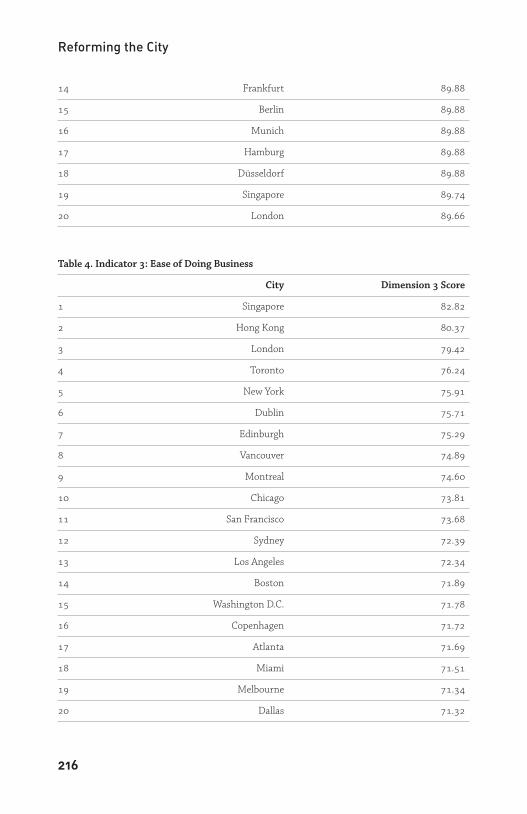
On the second point, it is important to emphasise that no onecity ranks at the top in all of these.3 London and New York, thetwo leading global cities, rank low in several aspects – neither is inthe top ten when it comes to starting a business, or closing a busi-ness, for example. If we consider some of the sub-indicators in theEase of Doing Business indicator in the study, such as ‘Ease ofEntry and Exit,’ London ranks 43rd and New York ranks 56th.Perhaps even more surprising, London ranks 37th on contractenforcement and 21st on investor protection. It is Singapore thatranks number one in all three variables. Perhaps less surprising,New York ranks 34th on one of the sub-indicators for Livability:‘Health and Safety’. In the Global South, cities like Mumbai andSao Paulo are in the top twenty when it comes to sub-indicatorssuch as financial and economic services, but are brought down in
The Specialised Differences of Cities Matter in Today’s Global Economy
213
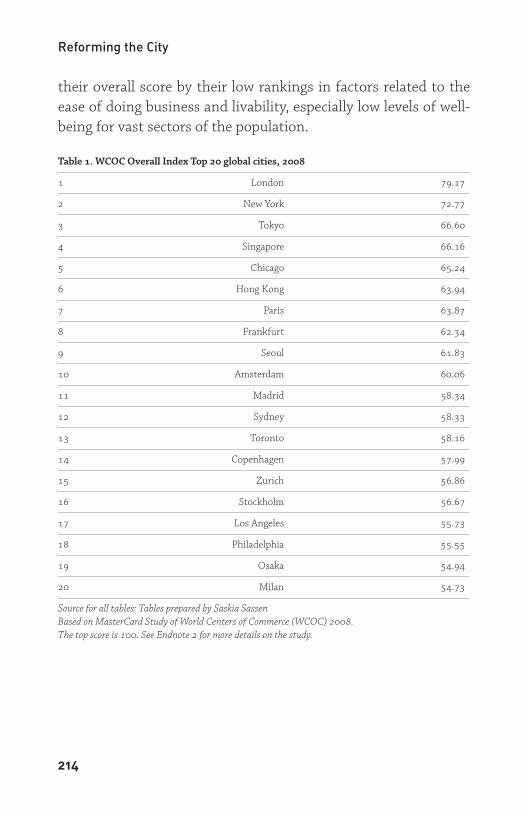
their overall score by their low rankings in factors related to theease of doing business and livability, especially low levels of well-being for vast sectors of the population.
Table 1. WCOC Overall Index Top 20 global cities, 2008
1 London 79.17
2 New York 72.77
3 Tokyo 66.60
4 Singapore 66.16
5 Chicago 65.24
6 Hong Kong 63.94
7 Paris 63.87
8 Frankfurt 62.34
9 Seoul 61.83
10 Amsterdam 60.06
11 Madrid 58.34
12 Sydney 58.33
13 Toronto 58.16
14 Copenhagen 57.99
15 Zurich 56.86
16 Stockholm 56.67
17 Los Angeles 55.73
18 Philadelphia 55.55
19 Osaka 54.94
20 Milan 54.73
Source for all tables: Tables prepared by Saskia SassenBased on MasterCard Study of World Centers of Commerce (WCOC) 2008. The top score is 100. See Endnote 2 for more details on the study.
Reforming the City
214
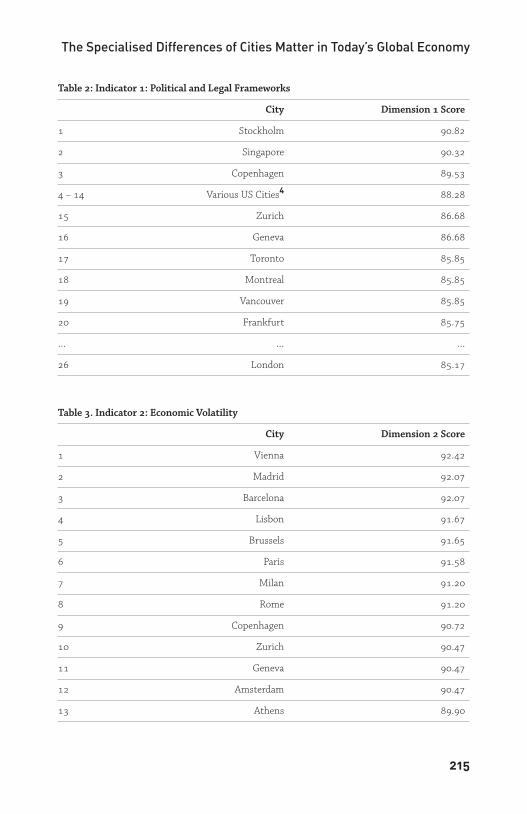
Table 2: Indicator 1: Political and Legal Frameworks
City Dimension 1 Score
1 Stockholm 90.82
2 Singapore 90.32
3 Copenhagen 89.53
4 – 14 Various US Cities4 88.28
15 Zurich 86.68
16 Geneva 86.68
17 Toronto 85.85
18 Montreal 85.85
19 Vancouver 85.85
20 Frankfurt 85.75
… … …
26 London 85.17
Table 3. Indicator 2: Economic Volatility
City Dimension 2 Score
1 Vienna 92.42
2 Madrid 92.07
3 Barcelona 92.07
4 Lisbon 91.67
5 Brussels 91.65
6 Paris 91.58
7 Milan 91.20
8 Rome 91.20
9 Copenhagen 90.72
10 Zurich 90.47
11 Geneva 90.47
12 Amsterdam 90.47
13 Athens 89.90
The Specialised Differences of Cities Matter in Today’s Global Economy
215
14 Frankfurt 89.88
15 Berlin 89.88
16 Munich 89.88
17 Hamburg 89.88
18 Düsseldorf 89.88
19 Singapore 89.74
20 London 89.66
Table 4. Indicator 3: Ease of Doing Business
City Dimension 3 Score
1 Singapore 82.82
2 Hong Kong 80.37
3 London 79.42
4 Toronto 76.24
5 New York 75.91
6 Dublin 75.71
7 Edinburgh 75.29
8 Vancouver 74.89
9 Montreal 74.60
10 Chicago 73.81
11 San Francisco 73.68
12 Sydney 72.39
13 Los Angeles 72.34
14 Boston 71.89
15 Washington D.C. 71.78
16 Copenhagen 71.72
17 Atlanta 71.69
18 Miami 71.51
19 Melbourne 71.34
20 Dallas 71.32
Reforming the City
216
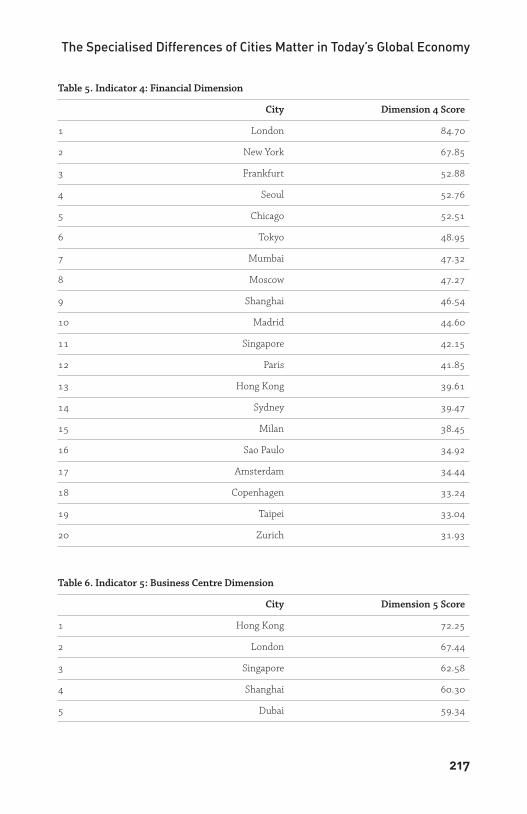
Table 5. Indicator 4: Financial Dimension
City Dimension 4 Score
1 London 84.70
2 New York 67.85
3 Frankfurt 52.88
4 Seoul 52.76
5 Chicago 52.51
6 Tokyo 48.95
7 Mumbai 47.32
8 Moscow 47.27
9 Shanghai 46.54
10 Madrid 44.60
11 Singapore 42.15
12 Paris 41.85
13 Hong Kong 39.61
14 Sydney 39.47
15 Milan 38.45
16 Sao Paulo 34.92
17 Amsterdam 34.44
18 Copenhagen 33.24
19 Taipei 33.04
20 Zurich 31.93
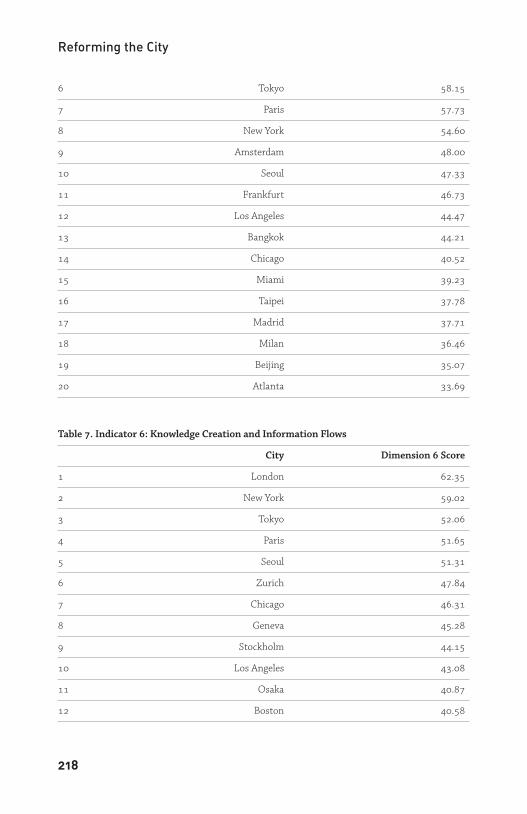
Table 6. Indicator 5: Business Centre Dimension
City Dimension 5 Score
1 Hong Kong 72.25
2 London 67.44
3 Singapore 62.58
4 Shanghai 60.30
5 Dubai 59.34
The Specialised Differences of Cities Matter in Today’s Global Economy
217
6 Tokyo 58.15
7 Paris 57.73
8 New York 54.60
9 Amsterdam 48.00
10 Seoul 47.33
11 Frankfurt 46.73
12 Los Angeles 44.47
13 Bangkok 44.21
14 Chicago 40.52
15 Miami 39.23
16 Taipei 37.78
17 Madrid 37.71
18 Milan 36.46
19 Beijing 35.07
20 Atlanta 33.69
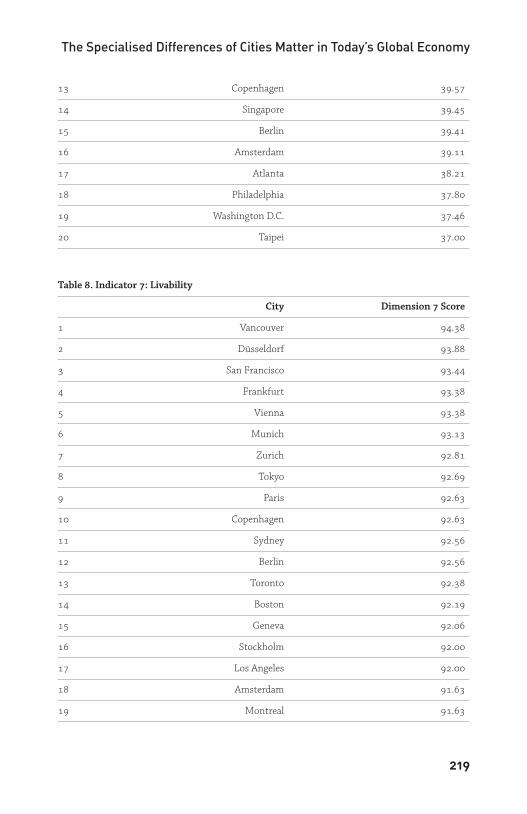
Table 7. Indicator 6: Knowledge Creation and Information Flows
City Dimension 6 Score
1 London 62.35
2 New York 59.02
3 Tokyo 52.06
4 Paris 51.65
5 Seoul 51.31
6 Zurich 47.84
7 Chicago 46.31
8 Geneva 45.28
9 Stockholm 44.15
10 Los Angeles 43.08
11 Osaka 40.87
12 Boston 40.58
Reforming the City
218
13 Copenhagen 39.57
14 Singapore 39.45
15 Berlin 39.41
16 Amsterdam 39.11
17 Atlanta 38.21
18 Philadelphia 37.80
19 Washington D.C. 37.46
20 Taipei 37.00
Table 8. Indicator 7: Livability
City Dimension 7 Score
1 Vancouver 94.38
2 Düsseldorf 93.88
3 San Francisco 93.44
4 Frankfurt 93.38
5 Vienna 93.38
6 Munich 93.13
7 Zurich 92.81
8 Tokyo 92.69
9 Paris 92.63
10 Copenhagen 92.63
11 Sydney 92.56
12 Berlin 92.56
13 Toronto 92.38
14 Boston 92.19
15 Geneva 92.06
16 Stockholm 92.00
17 Los Angeles 92.00
18 Amsterdam 91.63
19 Montreal 91.63
The Specialised Differences of Cities Matter in Today’s Global Economy
219
20 Melbourne 91.63
… … …
24 London 79.17
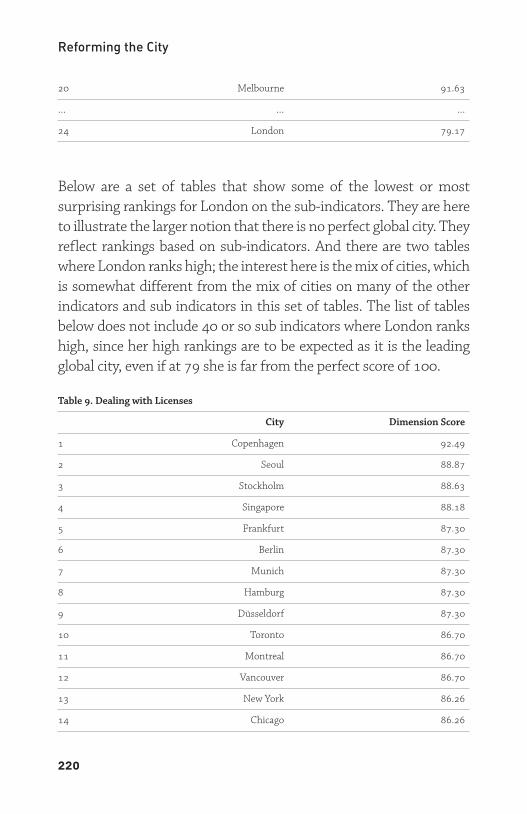
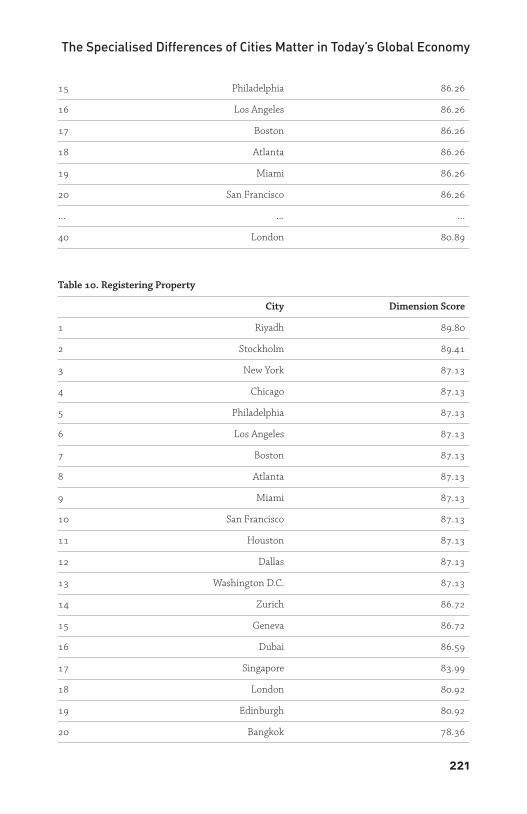
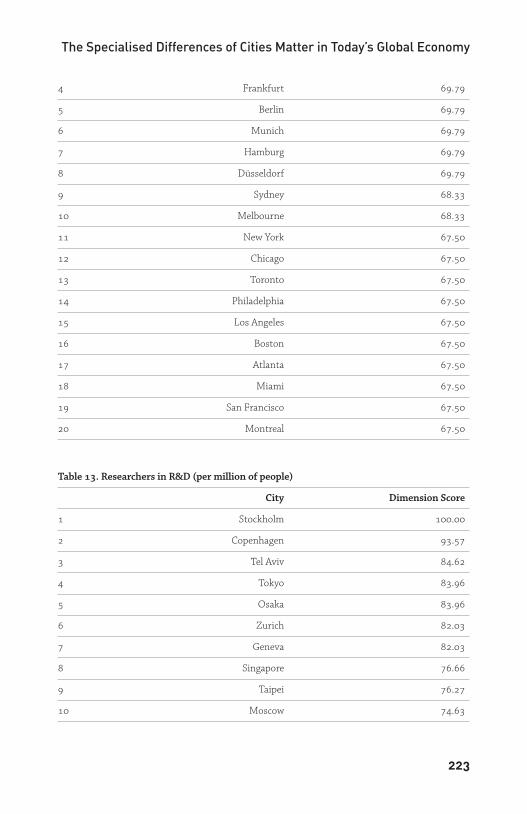
Below are a set of tables that show some of the lowest or mostsurprising rankings for London on the sub-indicators. They are hereto illustrate the larger notion that there is no perfect global city. Theyreflect rankings based on sub-indicators. And there are two tableswhere London ranks high; the interest here is the mix of cities, whichis somewhat different from the mix of cities on many of the otherindicators and sub indicators in this set of tables. The list of tablesbelow does not include 40 or so sub indicators where London rankshigh, since her high rankings are to be expected as it is the leadingglobal city, even if at 79 she is far from the perfect score of 100.
Table 9. Dealing with Licenses
City Dimension Score
1 Copenhagen 92.49
2 Seoul 88.87
3 Stockholm 88.63
4 Singapore 88.18
5 Frankfurt 87.30
6 Berlin 87.30
7 Munich 87.30
8 Hamburg 87.30
9 Düsseldorf 87.30
10 Toronto 86.70
11 Montreal 86.70
12 Vancouver 86.70
13 New York 86.26
14 Chicago 86.26
Reforming the City
220
15 Philadelphia 86.26
16 Los Angeles 86.26
17 Boston 86.26
18 Atlanta 86.26
19 Miami 86.26
20 San Francisco 86.26
… … …
40 London 80.89
Table 10. Registering Property
City Dimension Score
1 Riyadh 89.80
2 Stockholm 89.41
3 New York 87.13
4 Chicago 87.13
5 Philadelphia 87.13
6 Los Angeles 87.13
7 Boston 87.13
8 Atlanta 87.13
9 Miami 87.13
10 San Francisco 87.13
11 Houston 87.13
12 Dallas 87.13
13 Washington D.C. 87.13
14 Zurich 86.72
15 Geneva 86.72
16 Dubai 86.59
17 Singapore 83.99
18 London 80.92
19 Edinburgh 80.92
20 Bangkok 78.36
The Specialised Differences of Cities Matter in Today’s Global Economy
221
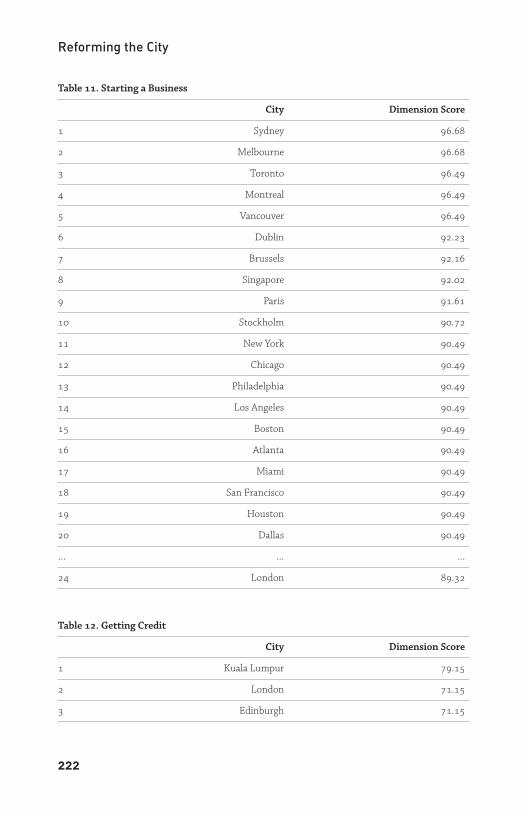
Table 11. Starting a Business
City Dimension Score
1 Sydney 96.68
2 Melbourne 96.68
3 Toronto 96.49
4 Montreal 96.49
5 Vancouver 96.49
6 Dublin 92.23
7 Brussels 92.16
8 Singapore 92.02
9 Paris 91.61
10 Stockholm 90.72
11 New York 90.49
12 Chicago 90.49
13 Philadelphia 90.49
14 Los Angeles 90.49
15 Boston 90.49
16 Atlanta 90.49
17 Miami 90.49
18 San Francisco 90.49
19 Houston 90.49
20 Dallas 90.49
… … …
24 London 89.32
Table 12. Getting Credit
City Dimension Score
1 Kuala Lumpur 79.15
2 London 71.15
3 Edinburgh 71.15
Reforming the City
222
4 Frankfurt 69.79
5 Berlin 69.79
6 Munich 69.79
7 Hamburg 69.79
8 Düsseldorf 69.79
9 Sydney 68.33
10 Melbourne 68.33
11 New York 67.50
12 Chicago 67.50
13 Toronto 67.50
14 Philadelphia 67.50
15 Los Angeles 67.50
16 Boston 67.50
17 Atlanta 67.50
18 Miami 67.50
19 San Francisco 67.50
20 Montreal 67.50
Table 13. Researchers in R&D (per million of people)
City Dimension Score
1 Stockholm 100.00
2 Copenhagen 93.57
3 Tel Aviv 84.62
4 Tokyo 83.96
5 Osaka 83.96
6 Zurich 82.03
7 Geneva 82.03
8 Singapore 76.66
9 Taipei 76.27
10 Moscow 74.63
The Specialised Differences of Cities Matter in Today’s Global Economy
223
11 St. Petersburg 74.63
12 Toronto 73.99
13 Montreal 73.99
14 Vancouver 73.99
15 Sydney 70.66
16 Melbourne 70.66
17 Paris 68.44
18 Amsterdam 67.60
19 Frankfurt 66.65
20 Berlin 66.65
… … …
46 London 32.75
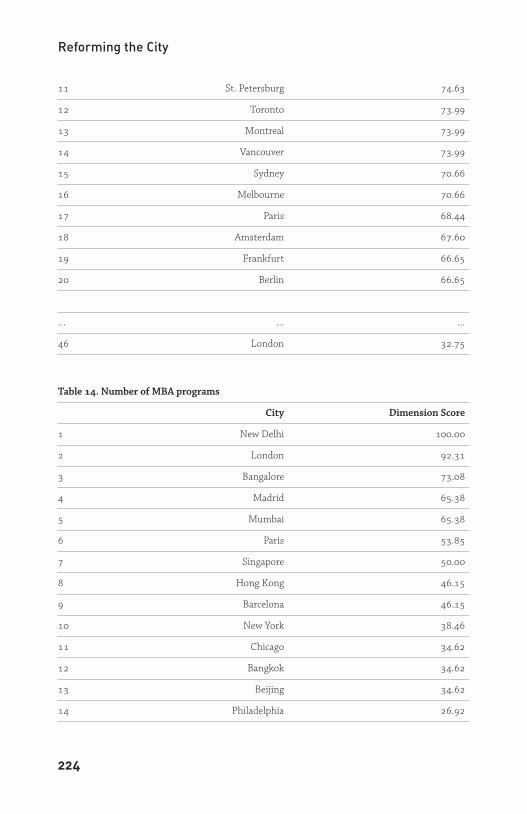
Table 14. Number of MBA programs
City Dimension Score
1 New Delhi 100.00
2 London 92.31
3 Bangalore 73.08
4 Madrid 65.38
5 Mumbai 65.38
6 Paris 53.85
7 Singapore 50.00
8 Hong Kong 46.15
9 Barcelona 46.15
10 New York 38.46
11 Chicago 34.62
12 Bangkok 34.62
13 Beijing 34.62
14 Philadelphia 26.92
Reforming the City
224
15 Boston 26.92
16 Vienna 26.92
17 Dublin 26.92
18 Washington D.C. 26.92
19 Buenos Aires 26.92
20 Tokyo 23.08
The consequences of the current financial crisis
To what extent can the current financial crisis alter the basicfeatures of this globally networked inter-city urban geography?Here I want to examine briefly the particularity of the financialcrisis that erupted in September 2008 from the perspective ofthis question. This is a lens that brings to the fore a few distinc-tive trends and potentials because a city is much more than afinancial centre.
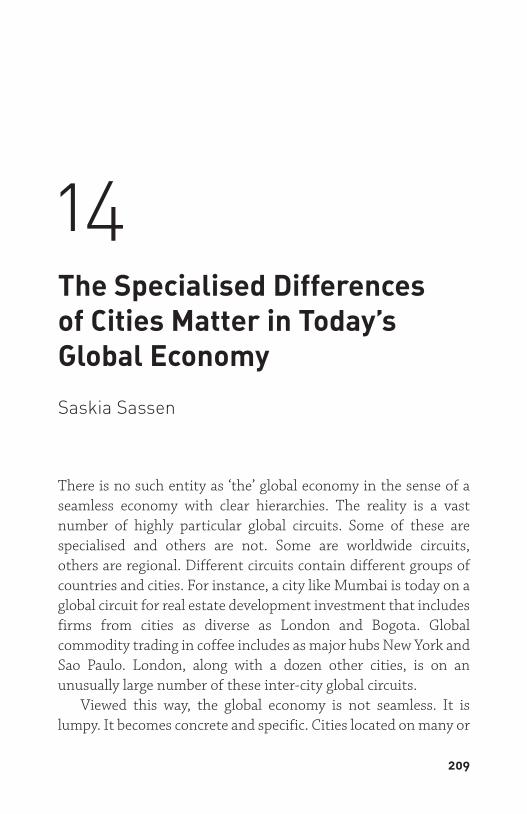
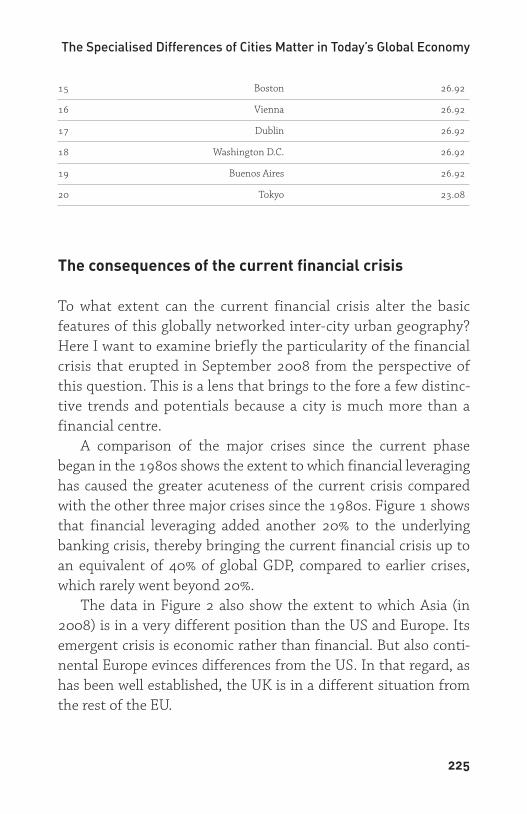
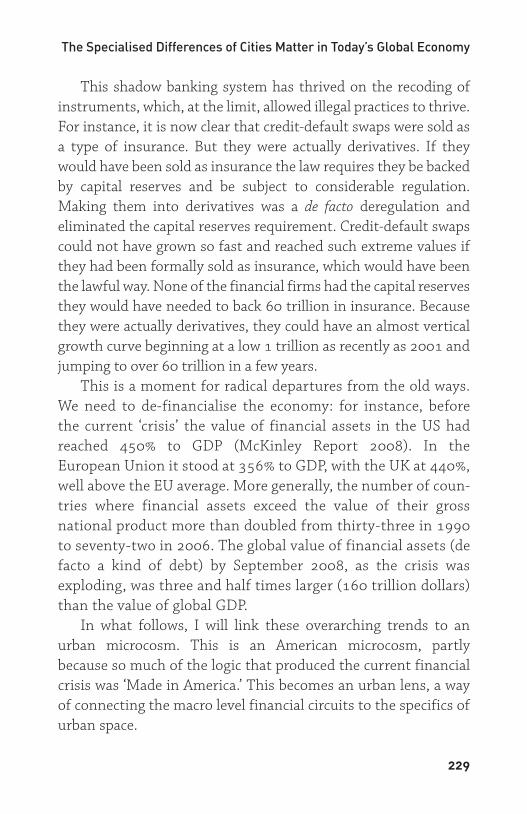
A comparison of the major crises since the current phasebegan in the 1980s shows the extent to which financial leveraginghas caused the greater acuteness of the current crisis comparedwith the other three major crises since the 1980s. Figure 1 showsthat financial leveraging added another 20% to the underlyingbanking crisis, thereby bringing the current financial crisis up toan equivalent of 40% of global GDP, compared to earlier crises,which rarely went beyond 20%.
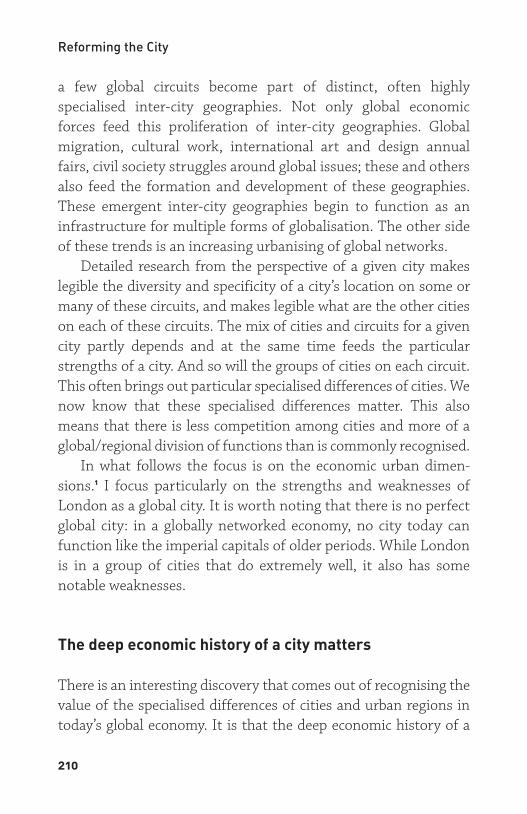
The data in Figure 2 also show the extent to which Asia (in2008) is in a very different position than the US and Europe. Itsemergent crisis is economic rather than financial. But also conti-nental Europe evinces differences from the US. In that regard, ashas been well established, the UK is in a different situation fromthe rest of the EU.
The Specialised Differences of Cities Matter in Today’s Global Economy
225
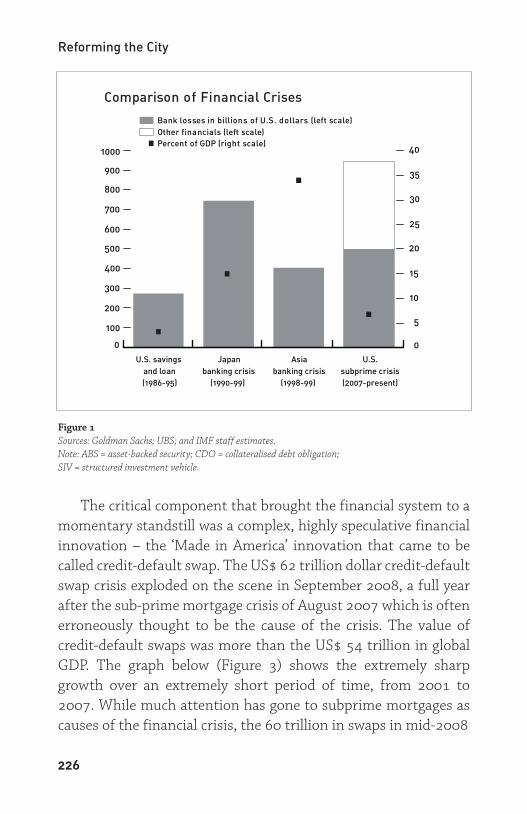
Figure 1Sources: Goldman Sachs; UBS; and IMF staff estimates.Note: ABS = asset-backed security; CDO = collateralised debt obligation; SIV = structured investment vehicle.
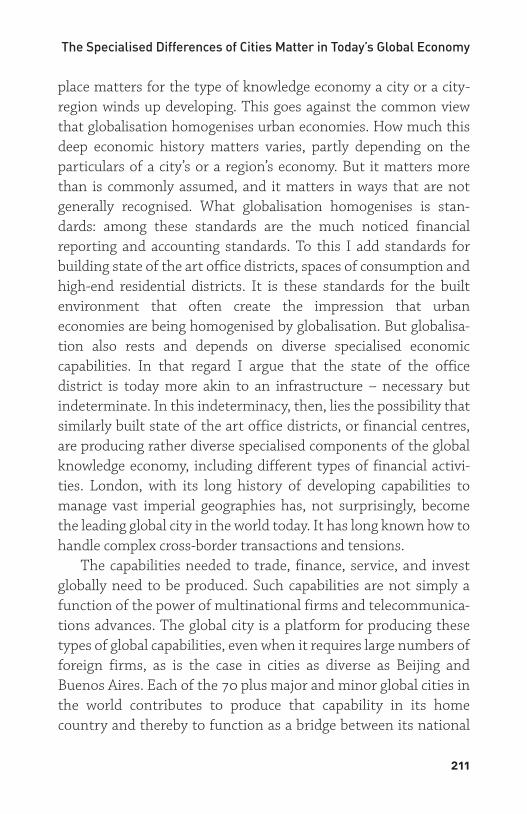
The critical component that brought the financial system to amomentary standstill was a complex, highly speculative financialinnovation – the ‘Made in America’ innovation that came to becalled credit-default swap. The US$ 62 trillion dollar credit-defaultswap crisis exploded on the scene in September 2008, a full yearafter the sub-prime mortgage crisis of August 2007 which is oftenerroneously thought to be the cause of the crisis. The value ofcredit-default swaps was more than the US$ 54 trillion in globalGDP. The graph below (Figure 3) shows the extremely sharpgrowth over an extremely short period of time, from 2001 to2007. While much attention has gone to subprime mortgages ascauses of the financial crisis, the 60 trillion in swaps in mid-2008
Reforming the City
226
Comparison of Financial Crises
Bank losses in billions of U.S. dollars (left scale) Other financials (left scale)
Percent of GDP (right scale) 401000
900 35
800 30
700
25600
20 500
400 15
300 10
200
5 100
00
U.S. savings Japan Asia U.S. and loan banking crisis banking crisis subprime crisis (1986-95) (1990-99) (1998-99) (2007-present)
Figure 2Sources: World Bank; and IMF staff estimates, Global Financial Stability Report, Oct 2008.Note: U.S. subprime costs represent staff estimates of losses on banks and other financial institutions. All costs are in real 2007 dollars. Asia includes Indonesia, Korea, the Philippines, and Thailand.
is what really got the financial crisis going. The decline in houseprices, the high rate of mortgage foreclosures, the declines inglobal trade, the growth of unemployment, all alerted investorsthat something was not right. This in turn led those who hadbought credit-default swaps as a sort of ‘insurance’ to want to cashin on their swaps. But the sellers of these swaps had not expectedthis downturn or the demand to cash in from those to whom theyhad sold these credit-swaps. They were not ready, and this cata-pulted much of the financial sector into crisis. Not everybody lost:investors such as George Soros, made large profits by goingagainst the trend.
The Specialised Differences of Cities Matter in Today’s Global Economy
227
Expected Bank Losses as of March 2008 (In billions of U.S. dollars)
160 Conduits/SIVs ABS CDOs ABS Subprime loans
140
120
100
80
60
40
20
0United States Europe Asia
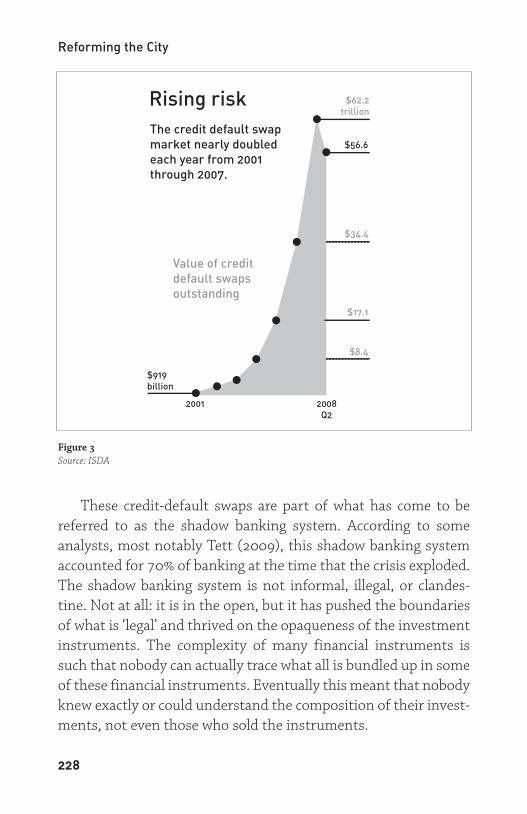
Figure 3Source: ISDA
These credit-default swaps are part of what has come to bereferred to as the shadow banking system. According to someanalysts, most notably Tett (2009), this shadow banking systemaccounted for 70% of banking at the time that the crisis exploded.The shadow banking system is not informal, illegal, or clandes-tine. Not at all: it is in the open, but it has pushed the boundariesof what is ‘legal’ and thrived on the opaqueness of the investmentinstruments. The complexity of many financial instruments issuch that nobody can actually trace what all is bundled up in someof these financial instruments. Eventually this meant that nobodyknew exactly or could understand the composition of their invest-ments, not even those who sold the instruments.
Reforming the City
228
Rising risk $62.2trillion
The credit default swapmarket nearly doubledeach year from 2001through 2007.
Value of creditdefault swapsoutstanding
$56.6
$34.4
$17.1
$8.4
2001 2008Q2
$919billion
This shadow banking system has thrived on the recoding ofinstruments, which, at the limit, allowed illegal practices to thrive.For instance, it is now clear that credit-default swaps were sold asa type of insurance. But they were actually derivatives. If theywould have been sold as insurance the law requires they be backedby capital reserves and be subject to considerable regulation.Making them into derivatives was a de facto deregulation andeliminated the capital reserves requirement. Credit-default swapscould not have grown so fast and reached such extreme values ifthey had been formally sold as insurance, which would have beenthe lawful way. None of the financial firms had the capital reservesthey would have needed to back 60 trillion in insurance. Becausethey were actually derivatives, they could have an almost verticalgrowth curve beginning at a low 1 trillion as recently as 2001 andjumping to over 60 trillion in a few years.
This is a moment for radical departures from the old ways.We need to de-financialise the economy: for instance, beforethe current ‘crisis’ the value of financial assets in the US hadreached 450% to GDP (McKinley Report 2008). In theEuropean Union it stood at 356% to GDP, with the UK at 440%,well above the EU average. More generally, the number of coun-tries where financial assets exceed the value of their grossnational product more than doubled from thirty-three in 1990to seventy-two in 2006. The global value of financial assets (defacto a kind of debt) by September 2008, as the crisis wasexploding, was three and half times larger (160 trillion dollars)than the value of global GDP.
In what follows, I will link these overarching trends to anurban microcosm. This is an American microcosm, partlybecause so much of the logic that produced the current financialcrisis was ‘Made in America.’ This becomes an urban lens, a wayof connecting the macro level financial circuits to the specifics ofurban space.
The Specialised Differences of Cities Matter in Today’s Global Economy
229
When the financial crisis hits urban land
Much has been made, especially in the US media, of thesubprime mortgage crisis as a source of the larger crisis. Modest-income families unable to pay their mortgage were oftenrepresented as irresponsible for having taken on these mort-gages and thereby leading to the crisis. But the facts showanother pattern. The overall value of the subprime mortgagelosses was too small to bring this powerful financial systemdown. But the interlinking of financial markets means that evena ‘small market’ crisis, such as the subprime market, can produceripples. In this case the ripple was a crisis of confidence amonglarge investors. The key was the growing demand for asset-backed securities by investors in a market where theoutstanding value of derivatives was US$ 600 trillion, more thanten times the value of global GDP. To address this demand, evensub-prime mortgage debt could be used as an asset. But the lowquality of this debt meant slicing it into multiple tiny tranchesand mixing these up with high-grade debt. The result was anenormously complex instrument that was also enormouslyopaque: nobody could trace what was contained within it. Whenthe total number of foreclosures moved into the millions in2007, investors had a crisis of confidence: it was impossible totell what was the toxic component in their investments andwhich of their investments might be 'contaminated'.
Sub-prime mortgages can be valuable instruments to enablemodest-income households to buy a house. But what happened inthe US over the last few years was an abuse of the concept. Thesmall savings, future earnings, or already fully paid houses ofmodest-income households were used to develop a financialinstrument that could make profits for investors even if thosehouseholds in the end could not pay for the primary or secondarymortgages they were often pushed to take. The result was the loss
Reforming the City
230
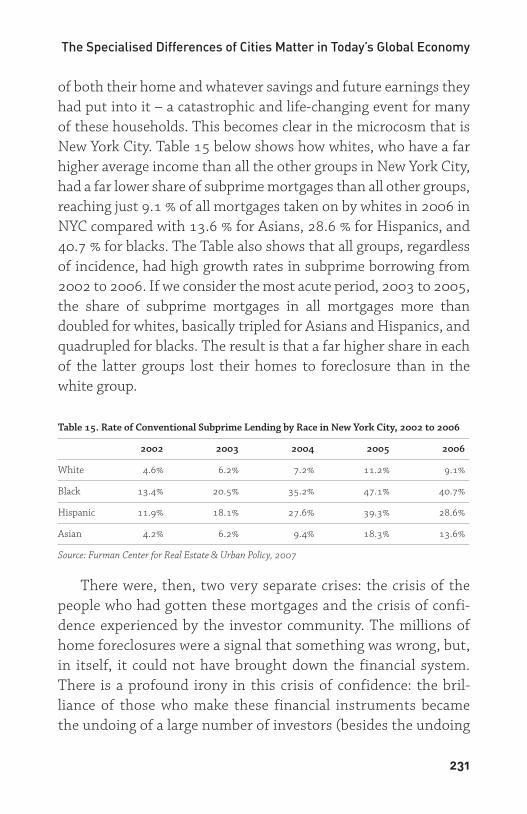
of both their home and whatever savings and future earnings theyhad put into it – a catastrophic and life-changing event for manyof these households. This becomes clear in the microcosm that isNew York City. Table 15 below shows how whites, who have a farhigher average income than all the other groups in New York City,had a far lower share of subprime mortgages than all other groups,reaching just 9.1 % of all mortgages taken on by whites in 2006 inNYC compared with 13.6 % for Asians, 28.6 % for Hispanics, and40.7 % for blacks. The Table also shows that all groups, regardlessof incidence, had high growth rates in subprime borrowing from2002 to 2006. If we consider the most acute period, 2003 to 2005,the share of subprime mortgages in all mortgages more thandoubled for whites, basically tripled for Asians and Hispanics, andquadrupled for blacks. The result is that a far higher share in eachof the latter groups lost their homes to foreclosure than in thewhite group.
Table 15. Rate of Conventional Subprime Lending by Race in New York City, 2002 to 2006
2002 2003 2004 2005 2006
White 4.6% 6.2% 7.2% 11.2% 9.1%
Black 13.4% 20.5% 35.2% 47.1% 40.7%
Hispanic 11.9% 18.1% 27.6% 39.3% 28.6%
Asian 4.2% 6.2% 9.4% 18.3% 13.6%
Source: Furman Center for Real Estate & Urban Policy, 2007
There were, then, two very separate crises: the crisis of thepeople who had gotten these mortgages and the crisis of confi-dence experienced by the investor community. The millions ofhome foreclosures were a signal that something was wrong, but,in itself, it could not have brought down the financial system.There is a profound irony in this crisis of confidence: the bril-liance of those who make these financial instruments becamethe undoing of a large number of investors (besides the undoing
The Specialised Differences of Cities Matter in Today’s Global Economy
231
of the modest-income families who had been sold these mort-gages). The toxic link for modest-income households was thatfor these mortgages to work as assets for investors, the aim wasto sell as many mortgages as possible (at least 500 were neces-sary to work into an asset-backed security), regardless ofwhether the home-buyers could pay their monthly fee. Thefaster these mortgages could be sold, the faster they could bebundled into investment instruments and sold off to investors.This secured the fees for the sub-prime mortgage sellers andreduced the effects of mortgage default on the profits of the sub-prime sellers. In fact, those sub-prime sellers that did not sell offthese mortgages as part of investment instruments went bank-rupt eventually, but not before having secured considerableprofits in fees.
In brief, the financial sector invented some of its mostcomplicated financial instruments to extract whatever were themeagre savings or assets of modest households by offering sub-prime mortgages and promising the possibility of owning ahouse or getting a second mortgage on a fully paid for house. Thecomplexity of the financial innovation was a series of productsthat de-linked subprime sellers and investors’ profits from thecreditworthiness of consumer home mortgage-buyers. Whetherthe mortgage is paid matters less than securing a certain numberof loans that can be bundled up into ‘investment products’. Thecrisis of homebuyers was not a crisis for financial investors, eventhough millions of middle- and working-class families in the UShave lost everything, and many now live in tents. For finance itwas a crisis of confidence. But it showed the importance of thesystems of trust that make possible the speed and orders ofmagnitude of this financial system. The crisis of home-owners(valued at a few hundred billion dollars) was the little tail thatdented the enormous dog of trust in the financial system. Inother words, this type of financial system has more of the social
Reforming the City
232
in it than is suggested by the technical complexity of its instru-ments and electronic platforms.
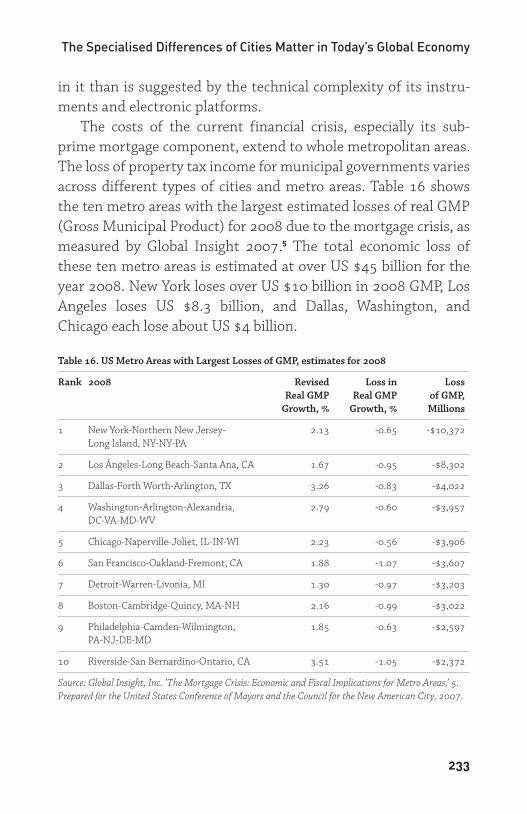
The costs of the current financial crisis, especially its sub-prime mortgage component, extend to whole metropolitan areas.The loss of property tax income for municipal governments variesacross different types of cities and metro areas. Table 16 showsthe ten metro areas with the largest estimated losses of real GMP(Gross Municipal Product) for 2008 due to the mortgage crisis, asmeasured by Global Insight 2007.5 The total economic loss ofthese ten metro areas is estimated at over US $45 billion for theyear 2008. New York loses over US $10 billion in 2008 GMP, LosAngeles loses US $8.3 billion, and Dallas, Washington, andChicago each lose about US $4 billion.
Table 16. US Metro Areas with Largest Losses of GMP, estimates for 2008
Rank 2008 Revised Loss in Loss Real GMP Real GMP of GMP,
Growth, % Growth, % Millions
1 New York-Northern New Jersey- 2.13 -0.65 -$10,372Long Island, NY-NY-PA
2 Los Ángeles-Long Beach-Santa Ana, CA 1.67 -0.95 -$8,302
3 Dallas-Forth Worth-Arlington, TX 3.26 -0.83 -$4,022
4 Washington-Arlington-Alexandria, 2.79 -0.60 -$3,957DC-VA-MD-WV
5 Chicago-Naperville-Joliet, IL-IN-WI 2.23 -0.56 -$3,906
6 San Francisco-Oakland-Fremont, CA 1.88 -1.07 -$3,607
7 Detroit-Warren-Livonia, MI 1.30 -0.97 -$3,203
8 Boston-Cambridge-Quincy, MA-NH 2.16 -0.99 -$3,022
9 Philadelphia-Camden-Wilmington, 1.85 -0.63 -$2,597PA-NJ-DE-MD
10 Riverside-San Bernardino-Ontario, CA 3.51 -1.05 -$2,372
Source: Global Insight, Inc. ‘The Mortgage Crisis: Economic and Fiscal Implications for Metro Areas,’ 5.Prepared for the United States Conference of Mayors and the Council for the New American City, 2007.
The Specialised Differences of Cities Matter in Today’s Global Economy
233
Conclusion
While much has been said about the global economyhomogenising national economies, the urban trends discussedhere actually point in the opposite direction: different cities havedifferent strengths. Global firms and markets, but also culturalenterprises, want many global cities because each of these citiesexpands the global platform for operations and because each is abridge between the global and the particularities of nationaleconomies and societies. This also brings to the fore that globalcities are built, developed, made.
The rebuilding of central areas that began to take place in the1980s and accelerated in the 1990s and onwards is part of thisnew economic role. It amounts to rebuilding key parts of thesecities as platforms for a rapidly growing range of globalised activ-ities and flows, from economic to cultural and political. This alsoexplains why architecture, urban design and urban planning haveall become more important and visible in the last two decades.And it explains the emergence of strong competition for spaceand the development of a new type of politics claiming the rightto the city.
The costs to cities of this mode of economic growth have beenhigh. Massive displacements of low-income households and low-profit firms have been evident in all these cities. And the financialcrisis has brought its own specific costs, increasingly naked anddirect. This has been an economic urban dynamism charged withsocial costs. It needs to be said that the fact that global firms needcities, and, indeed groups of cities, should enable the political,corporate and civic leadership in cities to negotiate for a bettershare of the benefits. This could lead to overall positive outcomesif the governing classes can see that these global economic func-tions will grow better in a context of a strong and prosperousmiddle class rather than sharp inequality and inmiseration of a
Reforming the City
234
growing share of households. European global cities have donebetter than US global cities precisely for this reason.
It is to the advantage of cities to have more distributedgrowth. The types of differences that characterise even the mostpowerful global cities suggest that there is less competition in theglobal system and more specialised differences. In this context thefinancial crisis and the ensuing economic crisis should be an occa-sion to resist the extreme competition that leads towards massiveconcentration of advantages. The leadership of a city like London,whether civic, corporate or political, should resist the notion thatthe City will go under if these extreme trends towards concentra-tion of economic advantage are not enabled. The City of Londonis part of a globally networked financial system. No city can be thebest in everything in a complex economic system. And no finan-cial centre can thrive if it allows the rest of the city within which itis embedded to have growing inequality, unemployment andsocial decay. That is clear from the fact that cities such as SaoPaolo and Mumbai which have some of the most powerful finan-cial centres are brought down sharply by the larger socialdevastation within which they exist.
Notes
1 For an examination of the political and cultural dimensions see
the author’s Territory, Authority, Rights: Part 3 (Princeton University
Press, 2008).
2 These earlier numbers come from the first version of the MasterCard
study (2006) using 2005 data.
3 It is the recently released 2008 MasterCard Study of Centers of Global
Commerce, for which the author was one of eight experts. The 63 variables
cover a very wide range of conditions – from macro level factors such as
political/legal frameworks to the particulars of cities, such as how easy it is
The Specialised Differences of Cities Matter in Today’s Global Economy
235
to execute an import/export operation, how many days it takes to open
and to close a firm, and on to livability factors and global recognition.
4 New York, Chicago, Philadelphia, Los Angeles, Boston, Atlanta, Miami,
San Francisco, Houston, Dallas and Washington D.C. all score 88.28 on
Dimension 1 because it is a macro-level variable.
5 The report contains a full list of GMP estimated losses for all 361 metros
in the US (Appendix, Table A2, pages 8-16.). The report states that 128
metros will see slow real GMP growth of less than 2% in 2008, and that
growth is cut by more than a third in 65 metros, and by more than a
quarter in 143 metros.
Reforming the City
236