Embed Size (px)
Citation preview
JULY 2015 I 1
THE STaTE of aUSTraLIa’S BIrdS 2015
Headline TRendS foR TeRReSTRial BiRdS
JULY 2015 I 32 I STaTE of aUSTraLIa’S BIrdS STaTEofBIrdS.org.aU
Why an australian Bird index?
introducing australian Bird indicescontents
Why an australian Bird index? 2
introducing australian Bird indices 3
Building australian Bird indices 4
interpreting Bird indices 5
Birds of the eastern Mallee 6
Birds of the arid Zone 8
Birds of the east coast 10
Birds of the south-eastern Mainland 11
the Work of citiZen scientists 12
regional trends in Widespread species 14
the red list index 15
In 2013, the Wentworth Group, an independent body of scientists, economists and business leaders, noted that “National Environment Accounts need to be built on scientific measurement, just as our national economic accounting system is based on measurable financial information.” They suggested that birds were an ideal metric for determining the health of the natural environment as they are present in all habitats, are easily counted, and there is a huge volunteer base of reliable observers capable of providing massive amounts of data.
That same year, the Australian Government’s Department of the Environment commissioned a collaborative project to develop innovative and robust methods for regularly reporting on the state of Australia’s bird populations.
BirdLife Australia, in partnership with Charles Darwin University, the Environmental Resources Information Network (ERIN) and with support from the National Environmental Research Program, has used data collected across the nation over the last 15 years as the basis for this reporting.
This collaboration has given birth to the Australian Bird Index (ABI), a ground-breaking project that provides the first quantitative set of indicators for a major component of Australia’s biodiversity.
This State of Australia’s Birds (SOAB) report launches the first Australian Bird Indices for terrestrial birds and introduces Australia’s Red List Index (RLI), a means of tracking trends in the status of Australia’s most threatened bird groups. A comprehensive SOAB report, to be released in early 2016, aims to include indices for all of Australia’s bioregions along with trends for a wide range of terrestrial species. It will also provide an evaluation of the monitoring that has been conducted to date in order to highlight the gaps in our knowledge and suggest strategies for filling them.
The long-term goal of this project is to establish a set of bird indices for all major Australian bird groups, so that future SOAB reports can also report on indices for shorebirds, waterbirds and seabirds.
We hope that these reports will form a call to action: for enthusiastic volunteers to contribute to strategic and structured monitoring of Australia’s birds; for decision makers to embrace ABIs as key measures of the state of the environment; and for urgent action to be taken to protect Australia’s beautiful birds.
Birds are powerful indicators of environmental health.Many bird species sit at the top of the food chain, allowing an insight into the status of other flora and fauna. They are also often the most conspicuous type of wildlife in the landscape so can be easily observed and monitored.
If we are to track our progress towards environmental goals we need regular, quantitative measures of the state of our environment. Australian Bird Indices provide a way of quantifying the overall health of the environment and acting as an early-warning system for detecting changes in our bird populations.
An Australian Bird Index can be thought of in similar terms to a stock market index such as the ASX, where the share prices of a number of corporations are chosen to be representative of the stock market as a whole. While there may be variation in the trends in share prices across individual corporations—some will increase, others will decrease—the composite ASX index powerfully captures the overall trend.
Stock market indices are also divided into several classes which provide more specialised information, such as the All Ordinaries and ASX 300 Metals and Mining, which are themselves logically grouped subsets of corporations. In the same way, each Australian Bird Index is made up of trends for several species, grouped and combined in such a way that it can reflect the general trend of that bird group. These indices can capture major environmental signals—using birds as the barometer—and provide a powerful basis for making informed decisions about our natural environment.
Australia is a broad and varied continent, home to a diverse range of birds. As a result, populations of birds or groups of species often show different trends in different regions. This environmental variability is why we are developing separate indices for nine major terrestrial bioregions covering continental Australia.
While these bioregions have been developed in order to report on the state of bird populations on a national scale, the methods developed for this project are robust enough to be applied to any region of interest—States, Territories, Natural Resource Management regions, Local Government Areas and even individual reserves, given sufficient data is available.
Through continued monitoring and the active involvement of specialists from a range of knowledge bases we can continue to fill the gaps in our understanding of Australia’s bird populations and allocate precious resources to the areas most in need of our attention.
• Using birds as barometers for the health of our environment
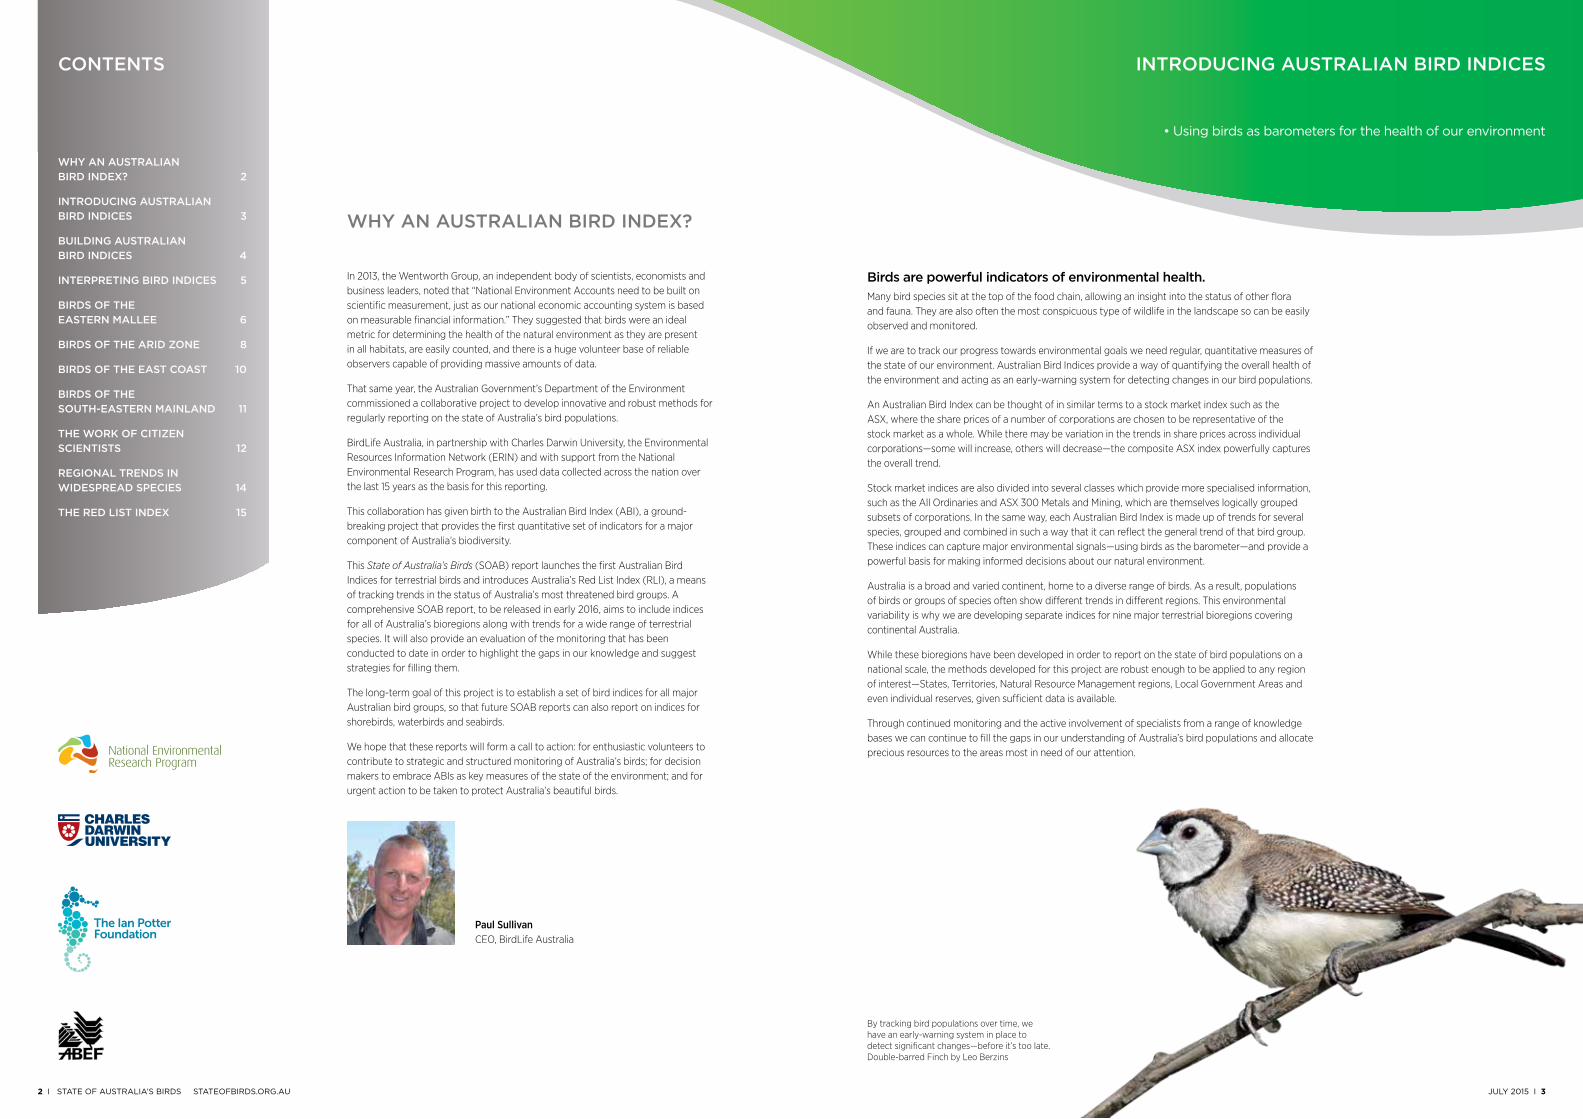
By tracking bird populations over time, we have an early-warning system in place to detect significant changes—before it’s too late. Double-barred Finch by Leo Berzins
Paul Sullivan CEO, BirdLife Australia
JULY 2015 I 54 I STaTE of aUSTraLIa’S BIrdS STaTEofBIrdS.org.aU
Arid Zone
Brigalow Belt
East Coast
Eastern Mallee
North-east Coast
South-east Mainland
South-west
Tasmania
Tropical Savanna
Main index trend
Con�dence intervals
Time - monthly units Spring in year shown on axis
Baseline
Estimated mean reporting rate values
Aerial insectivoresCarnivoresCommon speciesGround nestersHollow nestersMallee woodland dependants
Ind
ex
Year (spring of year)
Co
mp
osi
te In
dex
Rep
ort
ing
Rat
e (%
)
Species a Species b Species c
Building australian Bird indices: the Basic steps
interpreting Bird indices
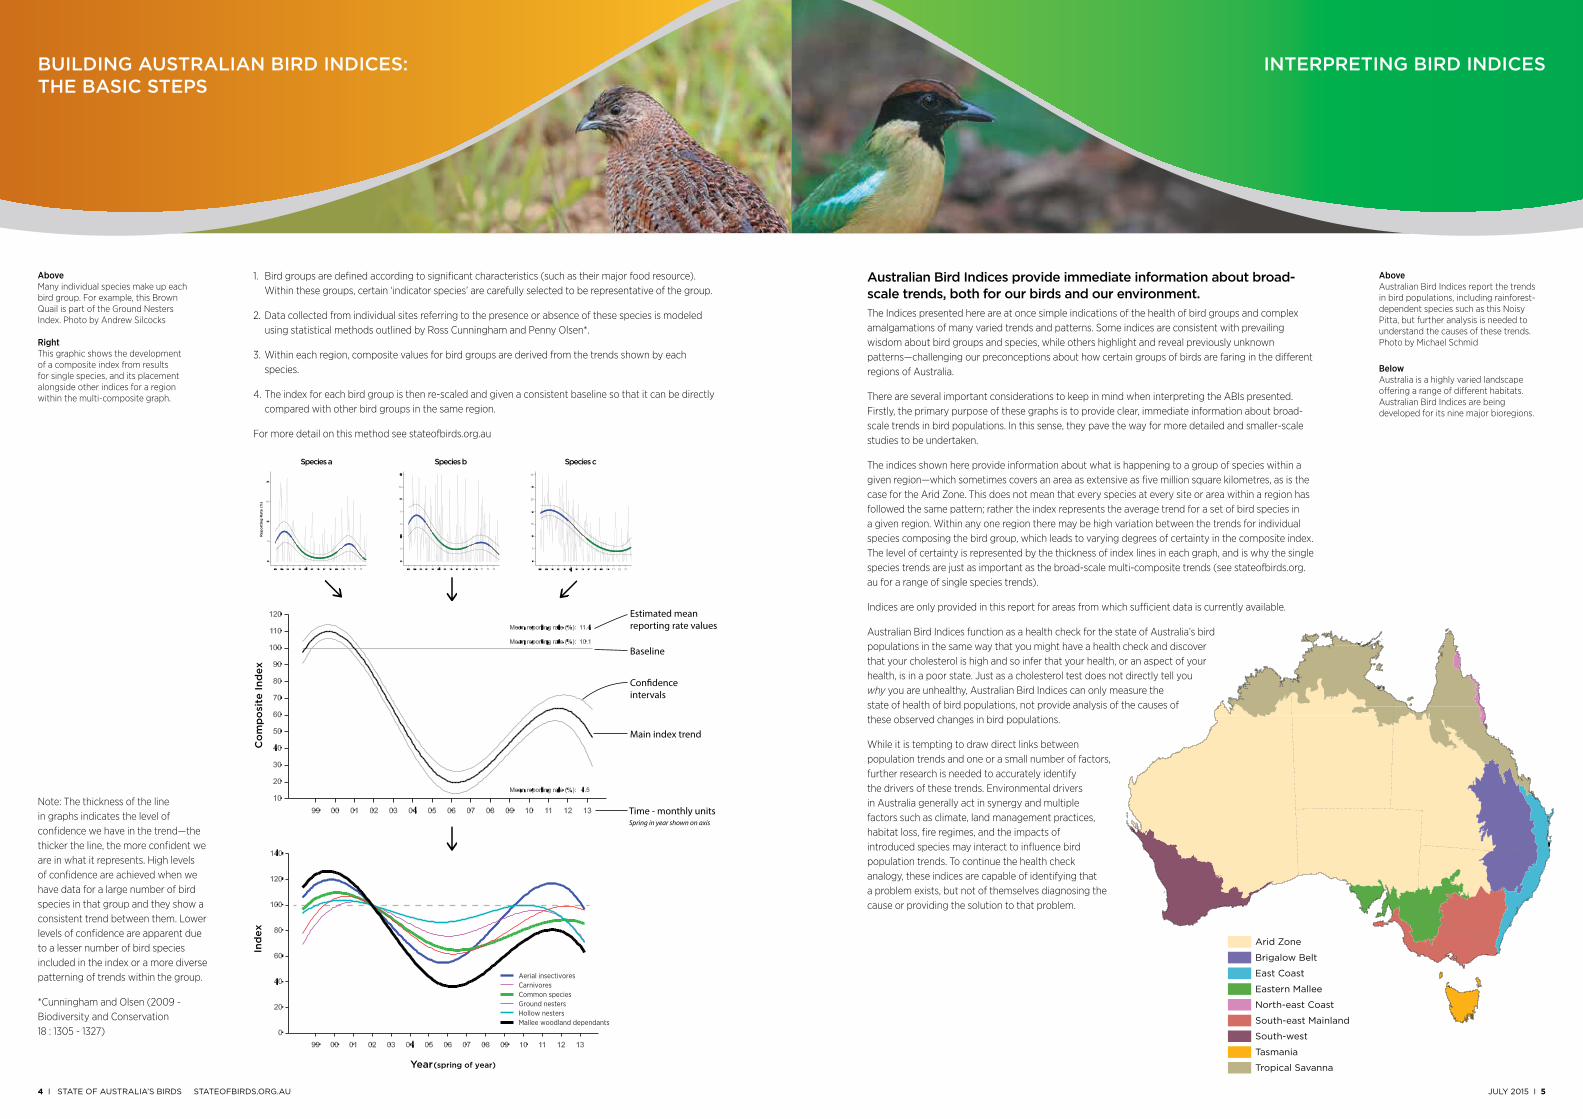
1. Bird groups are defined according to significant characteristics (such as their major food resource). Within these groups, certain ‘indicator species’ are carefully selected to be representative of the group.
2. Data collected from individual sites referring to the presence or absence of these species is modeled using statistical methods outlined by Ross Cunningham and Penny Olsen*.
3. Within each region, composite values for bird groups are derived from the trends shown by each species.
4. The index for each bird group is then re-scaled and given a consistent baseline so that it can be directly compared with other bird groups in the same region.
For more detail on this method see stateofbirds.org.au
Note: The thickness of the line in graphs indicates the level of confidence we have in the trend—the thicker the line, the more confident we are in what it represents. High levels of confidence are achieved when we have data for a large number of bird species in that group and they show a consistent trend between them. Lower levels of confidence are apparent due to a lesser number of bird species included in the index or a more diverse patterning of trends within the group.
*Cunningham and Olsen (2009 - Biodiversity and Conservation 18 : 1305 - 1327)
australian Bird indices provide immediate information about broad-scale trends, both for our birds and our environment.The Indices presented here are at once simple indications of the health of bird groups and complex amalgamations of many varied trends and patterns. Some indices are consistent with prevailing wisdom about bird groups and species, while others highlight and reveal previously unknown patterns—challenging our preconceptions about how certain groups of birds are faring in the different regions of Australia.
There are several important considerations to keep in mind when interpreting the ABIs presented. Firstly, the primary purpose of these graphs is to provide clear, immediate information about broad-scale trends in bird populations. In this sense, they pave the way for more detailed and smaller-scale studies to be undertaken.
The indices shown here provide information about what is happening to a group of species within a given region—which sometimes covers an area as extensive as five million square kilometres, as is the case for the Arid Zone. This does not mean that every species at every site or area within a region has followed the same pattern; rather the index represents the average trend for a set of bird species in a given region. Within any one region there may be high variation between the trends for individual species composing the bird group, which leads to varying degrees of certainty in the composite index. The level of certainty is represented by the thickness of index lines in each graph, and is why the single species trends are just as important as the broad-scale multi-composite trends (see stateofbirds.org.au for a range of single species trends).
Indices are only provided in this report for areas from which sufficient data is currently available.
Australian Bird Indices function as a health check for the state of Australia’s bird populations in the same way that you might have a health check and discover that your cholesterol is high and so infer that your health, or an aspect of your health, is in a poor state. Just as a cholesterol test does not directly tell you why you are unhealthy, Australian Bird Indices can only measure the state of health of bird populations, not provide analysis of the causes of these observed changes in bird populations.
While it is tempting to draw direct links between population trends and one or a small number of factors, further research is needed to accurately identify the drivers of these trends. Environmental drivers in Australia generally act in synergy and multiple factors such as climate, land management practices, habitat loss, fire regimes, and the impacts of introduced species may interact to influence bird population trends. To continue the health check analogy, these indices are capable of identifying that a problem exists, but not of themselves diagnosing the cause or providing the solution to that problem.
Above Many individual species make up each bird group. For example, this Brown Quail is part of the Ground Nesters Index. Photo by Andrew Silcocks Right This graphic shows the development of a composite index from results for single species, and its placement alongside other indices for a region within the multi-composite graph.
Above Australian Bird Indices report the trends in bird populations, including rainforest-dependent species such as this Noisy Pitta, but further analysis is needed to understand the causes of these trends. Photo by Michael Schmid
Below Australia is a highly varied landscape offering a range of different habitats. Australian Bird Indices are being developed for its nine major bioregions.
Arid Zone
Brigalow Belt
East Coast
Eastern Mallee
North-east Coast
South-east Mainland
South-west
Tasmania
Tropical Savanna
JULY 2015 I 76 I STaTE of aUSTraLIa’S BIrdS STaTEofBIrdS.org.aU
eastern Mallee regionThe Eastern Mallee region covers a range of habitats across three states in south-eastern Australia. The climate ranges from Mediterranean in the south to semi-arid in the north and as a result of extensive clearing for agriculture, only 10 per cent of the original fertile, non-mallee woodland remains in the Eastern Mallee. Large blocks of mallee woodland and shrubland habitat, including a number of large public and private conservation reserves on less fertile land, provide important habitat for endemic mallee species such as the Mallee Emu-wren and Black-eared Miner.
Bird trends in the eastern MalleeSome of the most consistent and widespread bird monitoring in Australia has been undertaken in the Eastern Mallee, with more than 36,000 standardised surveys conducted across 1,862 sites since 1999.
Indices across all bird groups declined significantly between 2001 and 2006, followed by varying degrees of recovery. By 2013, indices for Common Species, Hollow Nesters and Mallee Woodland-dependent groups all remained significantly below the baseline levels.
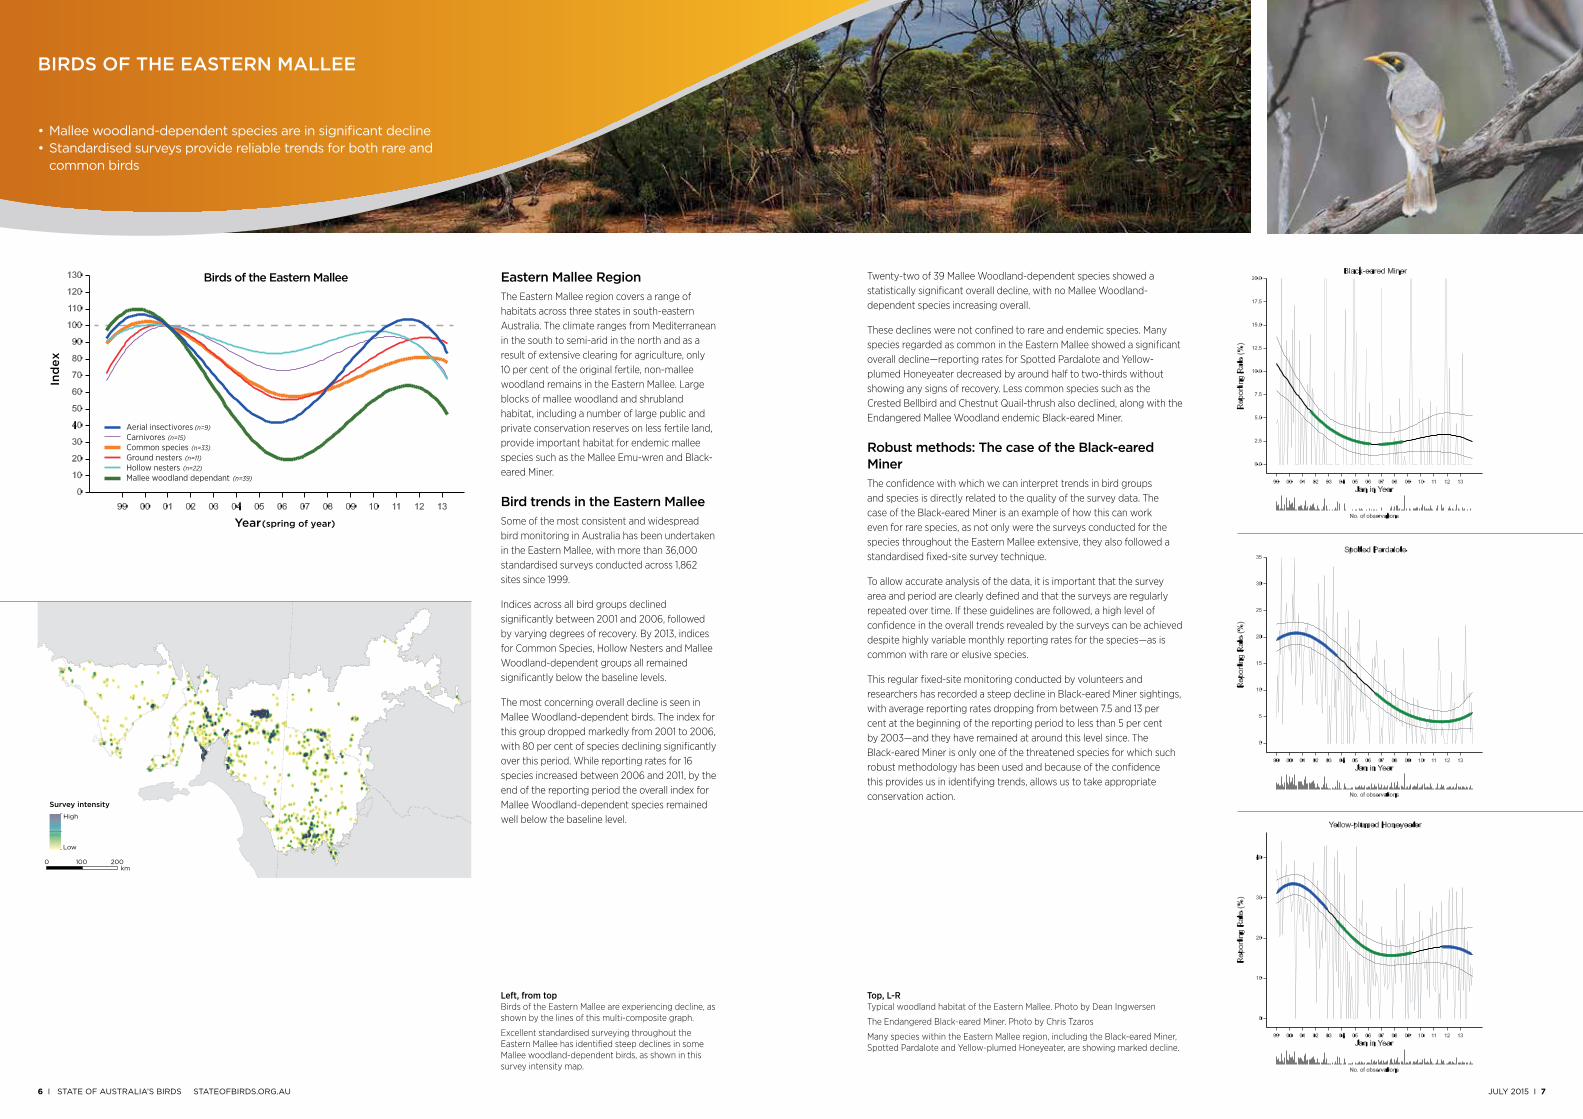
The most concerning overall decline is seen in Mallee Woodland-dependent birds. The index for this group dropped markedly from 2001 to 2006, with 80 per cent of species declining significantly over this period. While reporting rates for 16 species increased between 2006 and 2011, by the end of the reporting period the overall index for Mallee Woodland-dependent species remained well below the baseline level.
Birds of the eastern Mallee
• Mallee woodland-dependent species are in significant decline • Standardised surveys provide reliable trends for both rare and
common birds
Ind
ex
Year
Birds of the Eastern Mallee
(spring of year)
Aerial insectivores (n=9)Carnivores (n=15)Common species (n=33)Ground nesters (n=11)Hollow nesters (n=22)Mallee woodland dependant (n=39)
0 100 200km
Survey intensity
High
Low
Twenty-two of 39 Mallee Woodland-dependent species showed a statistically significant overall decline, with no Mallee Woodland-dependent species increasing overall.
These declines were not confined to rare and endemic species. Many species regarded as common in the Eastern Mallee showed a significant overall decline—reporting rates for Spotted Pardalote and Yellow-plumed Honeyeater decreased by around half to two-thirds without showing any signs of recovery. Less common species such as the Crested Bellbird and Chestnut Quail-thrush also declined, along with the Endangered Mallee Woodland endemic Black-eared Miner.
robust methods: the case of the Black-eared MinerThe confidence with which we can interpret trends in bird groups and species is directly related to the quality of the survey data. The case of the Black-eared Miner is an example of how this can work even for rare species, as not only were the surveys conducted for the species throughout the Eastern Mallee extensive, they also followed a standardised fixed-site survey technique.
To allow accurate analysis of the data, it is important that the survey area and period are clearly defined and that the surveys are regularly repeated over time. If these guidelines are followed, a high level of confidence in the overall trends revealed by the surveys can be achieved despite highly variable monthly reporting rates for the species—as is common with rare or elusive species.
This regular fixed-site monitoring conducted by volunteers and researchers has recorded a steep decline in Black-eared Miner sightings, with average reporting rates dropping from between 7.5 and 13 per cent at the beginning of the reporting period to less than 5 per cent by 2003—and they have remained at around this level since. The Black-eared Miner is only one of the threatened species for which such robust methodology has been used and because of the confidence this provides us in identifying trends, allows us to take appropriate conservation action.
Left, from top Birds of the Eastern Mallee are experiencing decline, as shown by the lines of this multi-composite graph.
Excellent standardised surveying throughout the Eastern Mallee has identified steep declines in some Mallee woodland-dependent birds, as shown in this survey intensity map.
Top, L-R Typical woodland habitat of the Eastern Mallee. Photo by Dean Ingwersen
The Endangered Black-eared Miner. Photo by Chris Tzaros
Many species within the Eastern Mallee region, including the Black-eared Miner, Spotted Pardalote and Yellow-plumed Honeyeater, are showing marked decline.
JULY 2015 I 98 I STaTE of aUSTraLIa’S BIrdS STaTEofBIrdS.org.aU
Re
po
rtin
g R
ate
(%
)
Jan in Year
No. of observations
Budgerigar
Birds of the arid Zone
Rep
ort
ing
Rat
e (%
)
Jan in Year
No. of observations
Southern Boobook
Aerial insectivores (n=11)Carnivores (n=20)Common species (n=39)Ground nesters (n=16)Hollow nesters (n=19)Arid woodland/shrubland dependants (n=90)
Ind
ex
Year (spring of year)
Birds of the Arid Zone
0 250 500km
Survey intensityHigh
Low
Rep
ort
ing
Rat
e (%
)
Jan in Year
No. of observations
Blue-winged Kookaburra
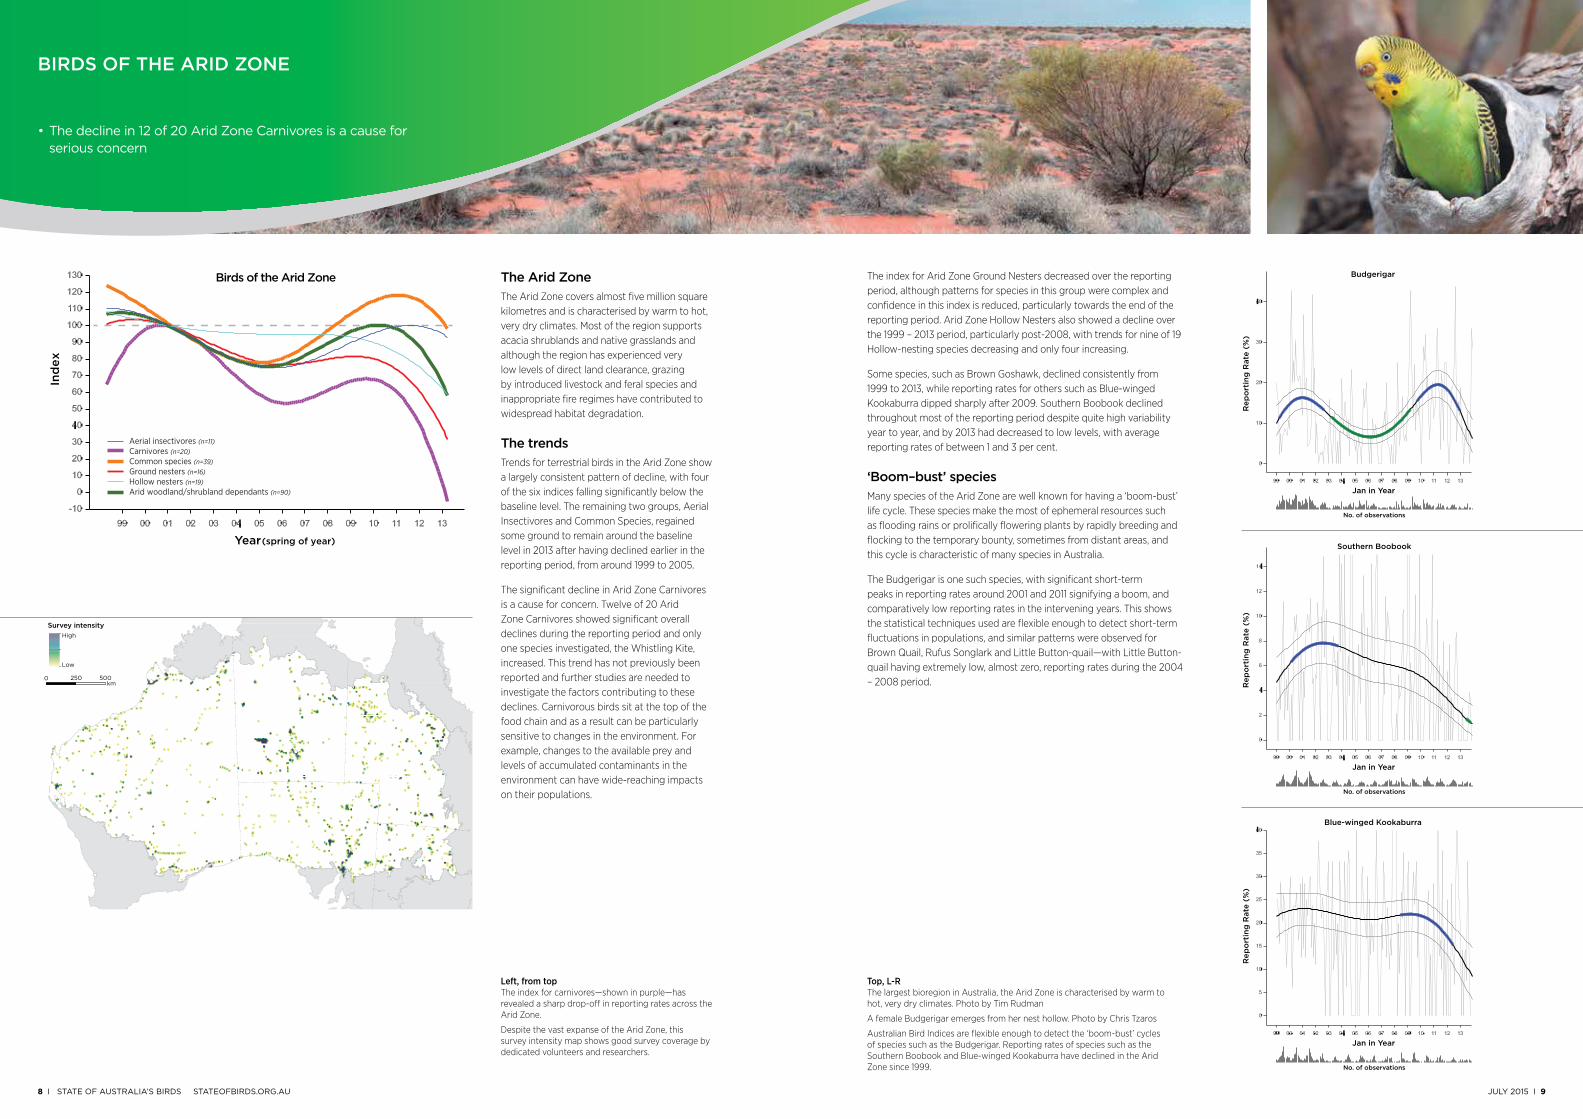
• The decline in 12 of 20 Arid Zone Carnivores is a cause for serious concern
the arid ZoneThe Arid Zone covers almost five million square kilometres and is characterised by warm to hot, very dry climates. Most of the region supports acacia shrublands and native grasslands and although the region has experienced very low levels of direct land clearance, grazing by introduced livestock and feral species and inappropriate fire regimes have contributed to widespread habitat degradation.
the trendsTrends for terrestrial birds in the Arid Zone show a largely consistent pattern of decline, with four of the six indices falling significantly below the baseline level. The remaining two groups, Aerial Insectivores and Common Species, regained some ground to remain around the baseline level in 2013 after having declined earlier in the reporting period, from around 1999 to 2005.
The significant decline in Arid Zone Carnivores is a cause for concern. Twelve of 20 Arid Zone Carnivores showed significant overall declines during the reporting period and only one species investigated, the Whistling Kite, increased. This trend has not previously been reported and further studies are needed to investigate the factors contributing to these declines. Carnivorous birds sit at the top of the food chain and as a result can be particularly sensitive to changes in the environment. For example, changes to the available prey and levels of accumulated contaminants in the environment can have wide-reaching impacts on their populations.
The index for Arid Zone Ground Nesters decreased over the reporting period, although patterns for species in this group were complex and confidence in this index is reduced, particularly towards the end of the reporting period. Arid Zone Hollow Nesters also showed a decline over the 1999 – 2013 period, particularly post-2008, with trends for nine of 19 Hollow-nesting species decreasing and only four increasing.
Some species, such as Brown Goshawk, declined consistently from 1999 to 2013, while reporting rates for others such as Blue-winged Kookaburra dipped sharply after 2009. Southern Boobook declined throughout most of the reporting period despite quite high variability year to year, and by 2013 had decreased to low levels, with average reporting rates of between 1 and 3 per cent.
‘Boom–bust’ speciesMany species of the Arid Zone are well known for having a ‘boom-bust’ life cycle. These species make the most of ephemeral resources such as flooding rains or prolifically flowering plants by rapidly breeding and flocking to the temporary bounty, sometimes from distant areas, and this cycle is characteristic of many species in Australia.
The Budgerigar is one such species, with significant short-term peaks in reporting rates around 2001 and 2011 signifying a boom, and comparatively low reporting rates in the intervening years. This shows the statistical techniques used are flexible enough to detect short-term fluctuations in populations, and similar patterns were observed for Brown Quail, Rufus Songlark and Little Button-quail—with Little Button-quail having extremely low, almost zero, reporting rates during the 2004 – 2008 period.
Left, from top The index for carnivores—shown in purple—has revealed a sharp drop-off in reporting rates across the Arid Zone.
Despite the vast expanse of the Arid Zone, this survey intensity map shows good survey coverage by dedicated volunteers and researchers.
Top, L-R The largest bioregion in Australia, the Arid Zone is characterised by warm to hot, very dry climates. Photo by Tim Rudman
A female Budgerigar emerges from her nest hollow. Photo by Chris Tzaros
Australian Bird Indices are flexible enough to detect the ‘boom-bust’ cycles of species such as the Budgerigar. Reporting rates of species such as the Southern Boobook and Blue-winged Kookaburra have declined in the Arid Zone since 1999.
JULY 2015 I 1110 I STaTE of aUSTraLIa’S BIrdS STaTEofBIrdS.org.aU
Dry sclerophyll woodland/forest dependants (n=86)Aerial insectivores (n=7)Carnivores (n=17)Common species (n=39)Ground nesters (n=7)Hollow nesters (n=27)
Ind
ex
Year (spring of year)
Birds of the South-eastern Mainland
Birds of the east coast Birds of the south-eastern Mainland
Aerial insectivores (n=8)Carnivores (n=15)Common species (n=52)Ground nesters (n=11)Hollow nesters (n=24)Dry sclerophyll woodland/forest dependants (n=82)Wet Sclerophyll Forest dependants (n=12)Rainforest dependant (n=13)
Ind
ex
Year (spring of year)
Birds of the East Coast
Re
po
rtin
g R
ate
(%
)
Jan in Year
No. of observations
Purple-crowned Lorikeet
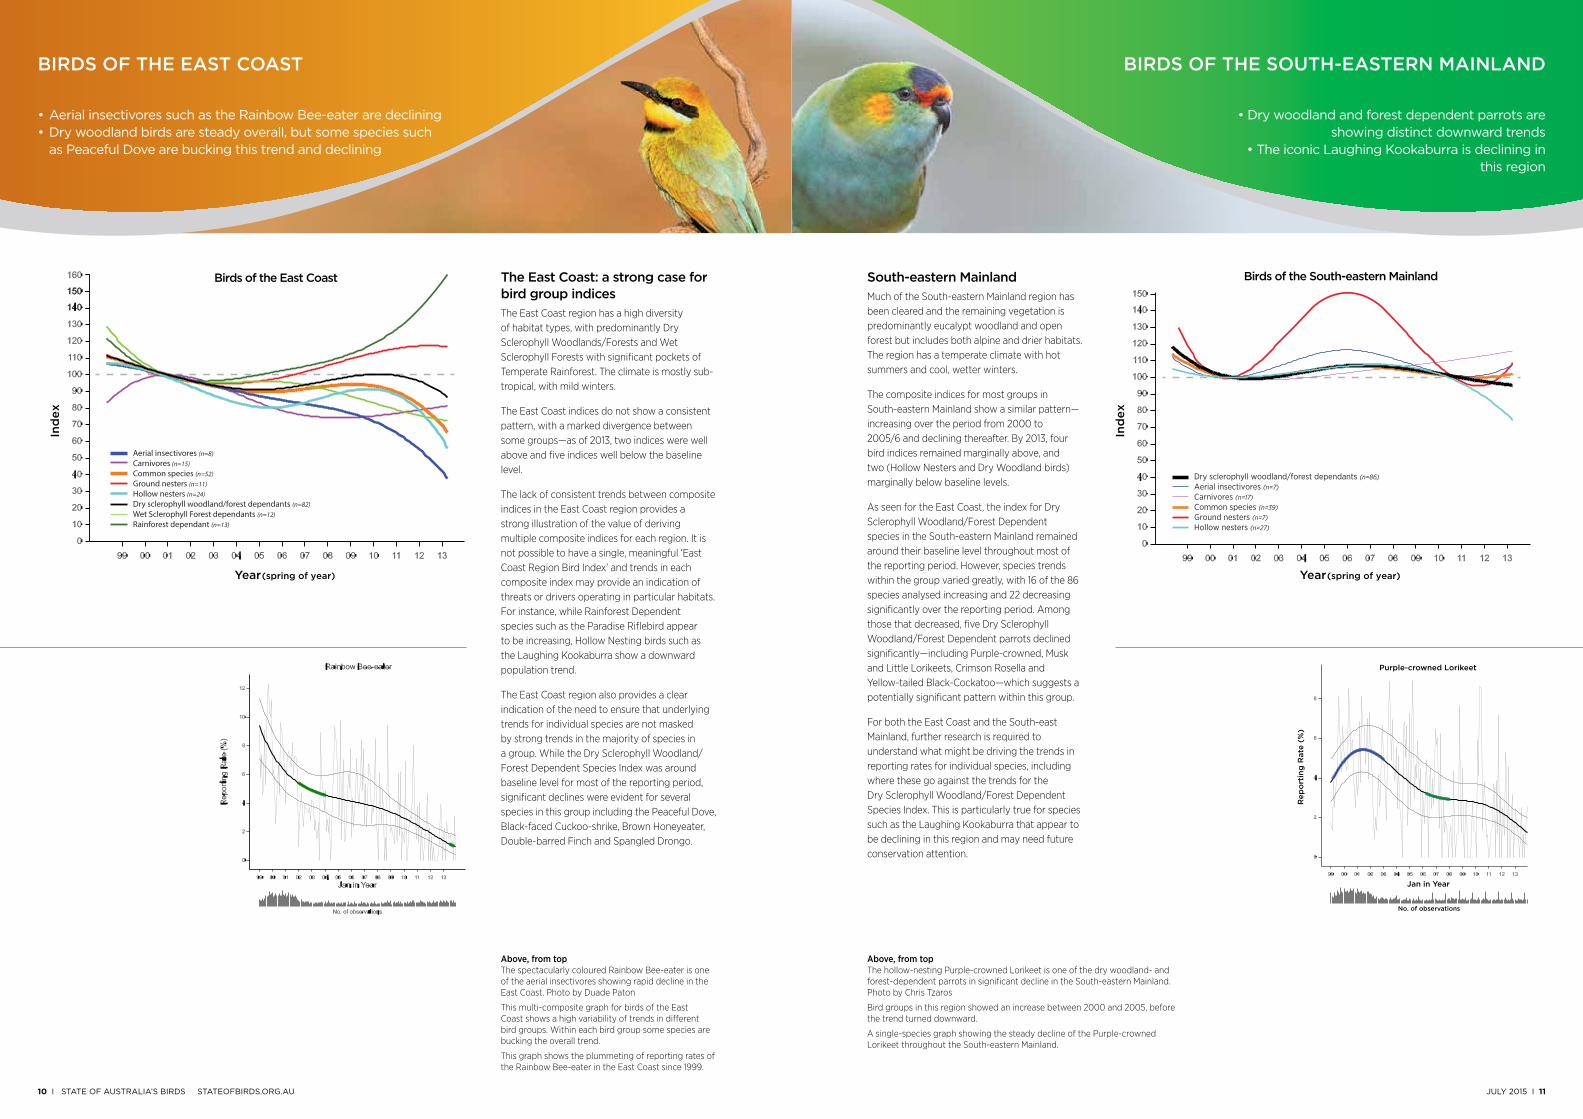
• Aerial insectivores such as the Rainbow Bee-eater are declining • Dry woodland birds are steady overall, but some species such
as Peaceful Dove are bucking this trend and declining
• Dry woodland and forest dependent parrots are showing distinct downward trends
• The iconic Laughing Kookaburra is declining in this region
the east coast: a strong case for bird group indicesThe East Coast region has a high diversity of habitat types, with predominantly Dry Sclerophyll Woodlands/Forests and Wet Sclerophyll Forests with significant pockets of Temperate Rainforest. The climate is mostly sub-tropical, with mild winters.
The East Coast indices do not show a consistent pattern, with a marked divergence between some groups—as of 2013, two indices were well above and five indices well below the baseline level.
The lack of consistent trends between composite indices in the East Coast region provides a strong illustration of the value of deriving multiple composite indices for each region. It is not possible to have a single, meaningful ‘East Coast Region Bird Index’ and trends in each composite index may provide an indication of threats or drivers operating in particular habitats. For instance, while Rainforest Dependent species such as the Paradise Riflebird appear to be increasing, Hollow Nesting birds such as the Laughing Kookaburra show a downward population trend.
The East Coast region also provides a clear indication of the need to ensure that underlying trends for individual species are not masked by strong trends in the majority of species in a group. While the Dry Sclerophyll Woodland/Forest Dependent Species Index was around baseline level for most of the reporting period, significant declines were evident for several species in this group including the Peaceful Dove, Black-faced Cuckoo-shrike, Brown Honeyeater, Double-barred Finch and Spangled Drongo.
south-eastern MainlandMuch of the South-eastern Mainland region has been cleared and the remaining vegetation is predominantly eucalypt woodland and open forest but includes both alpine and drier habitats. The region has a temperate climate with hot summers and cool, wetter winters.
The composite indices for most groups in South-eastern Mainland show a similar pattern— increasing over the period from 2000 to 2005/6 and declining thereafter. By 2013, four bird indices remained marginally above, and two (Hollow Nesters and Dry Woodland birds) marginally below baseline levels.
As seen for the East Coast, the index for Dry Sclerophyll Woodland/Forest Dependent species in the South-eastern Mainland remained around their baseline level throughout most of the reporting period. However, species trends within the group varied greatly, with 16 of the 86 species analysed increasing and 22 decreasing significantly over the reporting period. Among those that decreased, five Dry Sclerophyll Woodland/Forest Dependent parrots declined significantly—including Purple-crowned, Musk and Little Lorikeets, Crimson Rosella and Yellow-tailed Black-Cockatoo—which suggests a potentially significant pattern within this group.
For both the East Coast and the South-east Mainland, further research is required to understand what might be driving the trends in reporting rates for individual species, including where these go against the trends for the Dry Sclerophyll Woodland/Forest Dependent Species Index. This is particularly true for species such as the Laughing Kookaburra that appear to be declining in this region and may need future conservation attention.
Above, from top The spectacularly coloured Rainbow Bee-eater is one of the aerial insectivores showing rapid decline in the East Coast. Photo by Duade Paton
This multi-composite graph for birds of the East Coast shows a high variability of trends in different bird groups. Within each bird group some species are bucking the overall trend.
This graph shows the plummeting of reporting rates of the Rainbow Bee-eater in the East Coast since 1999.
Above, from top The hollow-nesting Purple-crowned Lorikeet is one of the dry woodland- and forest-dependent parrots in significant decline in the South-eastern Mainland. Photo by Chris Tzaros
Bird groups in this region showed an increase between 2000 and 2005, before the trend turned downward.
A single-species graph showing the steady decline of the Purple-crowned Lorikeet throughout the South-eastern Mainland.
JULY 2015 I 1312 I STaTE of aUSTraLIa’S BIrdS STaTEofBIrdS.org.aU
citiZen science: the key to australian Bird indices
• Further robust monitoring is essential to complete the picture
The development of Australian Bird Indices has only been possible because of the remarkable efforts of thousands of citizen scientists and researchers across Australia over the last 17 years. Over 427,325 standardised bird surveys were used to generate the indices, which represents a total of more than 304,264 hours or 34.7 years of surveying—no mean feat!
This effort is all the more impressive as the data used was limited to those surveys that used fixed-site surveying to provide us with the highest possible confidence in results. All together, data was collected for a total of 1,174 species and subspecies across nine regions. Needless to say, the analyses presented in this report are just the tip of the iceberg! For comprehensive coverage of the results the data produced, see stateofbirds.org.au
We salute the efforts of all volunteers involved in bird monitoring, much of which involves travelling vast distances into remote areas and challenging conditions, and we encourage more to join us. By undertaking structured monitoring we can produce high quality, robust indices for all bird groups across the vast Australian continent. This is a significant challenge for a country of such great proportions and varied landscapes—but one that is well worth the effort. Filling the current gaps in our knowledge of the health of Australian birds will provide us with a solid base from which to make the most powerful conservation decisions into the future.
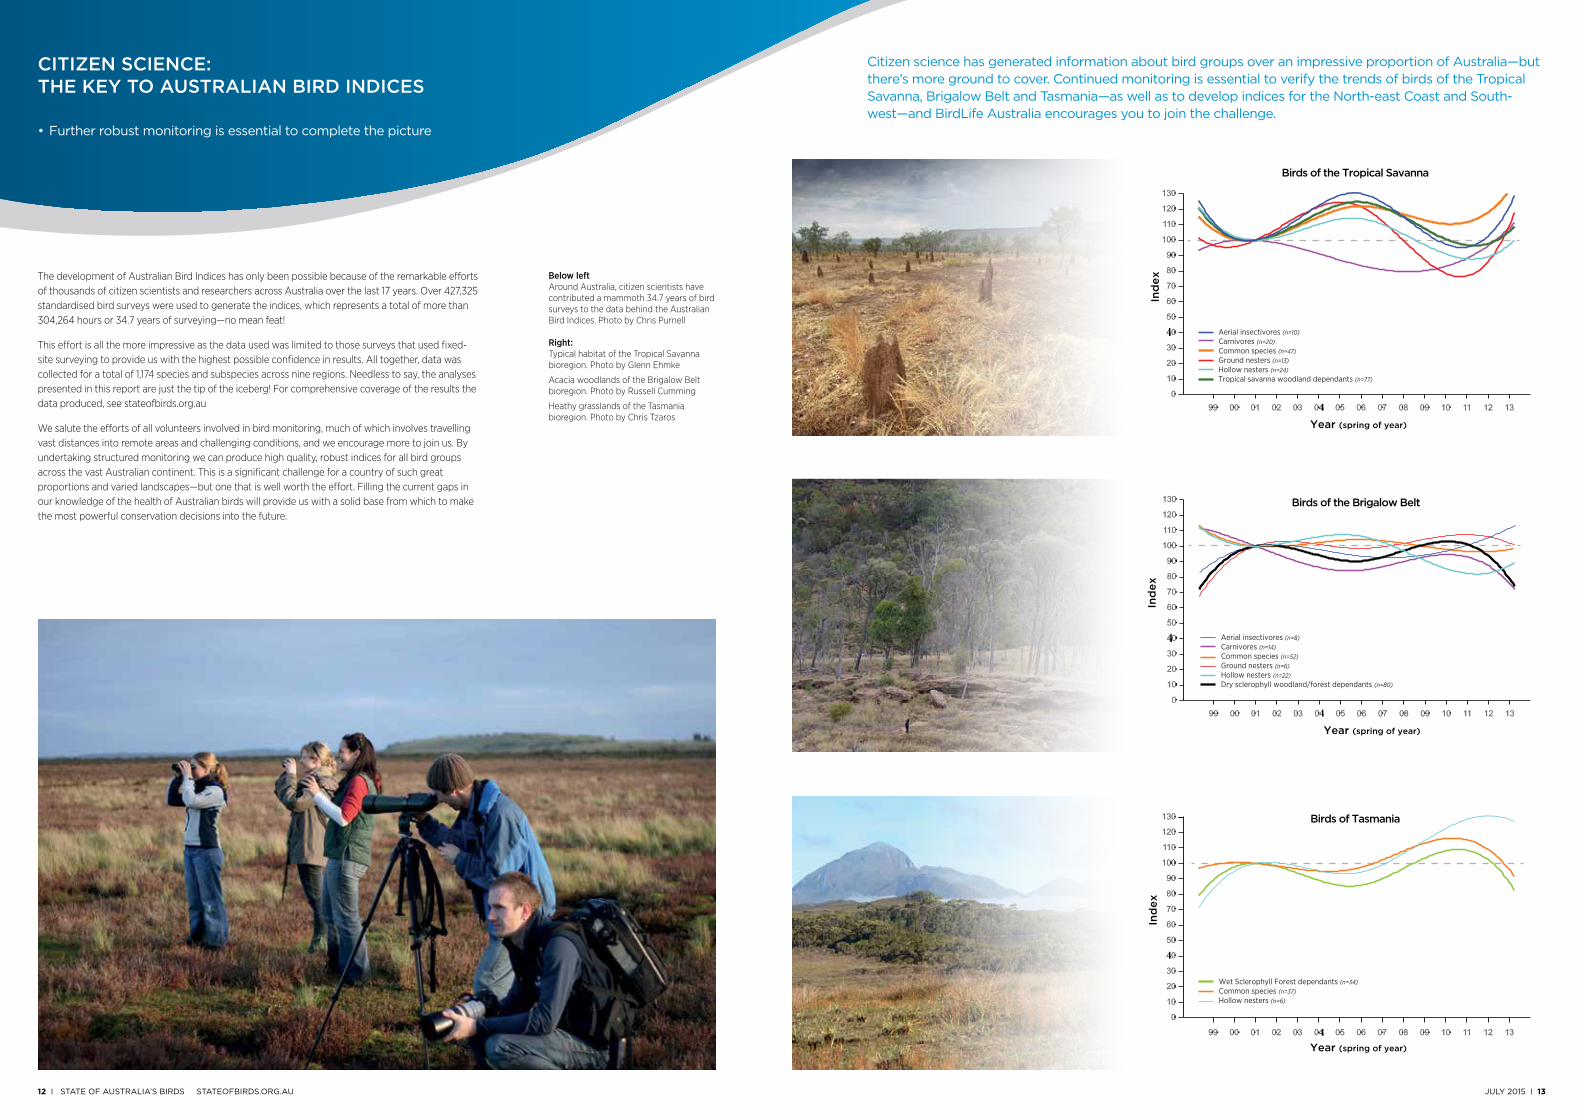
Citizen science has generated information about bird groups over an impressive proportion of Australia—but there’s more ground to cover. Continued monitoring is essential to verify the trends of birds of the Tropical Savanna, Brigalow Belt and Tasmania—as well as to develop indices for the North-east Coast and South-west—and BirdLife Australia encourages you to join the challenge.
Below left Around Australia, citizen scientists have contributed a mammoth 34.7 years of bird surveys to the data behind the Australian Bird Indices. Photo by Chris Purnell Right: Typical habitat of the Tropical Savanna bioregion. Photo by Glenn Ehmke
Acacia woodlands of the Brigalow Belt bioregion. Photo by Russell Cumming
Heathy grasslands of the Tasmania bioregion. Photo by Chris Tzaros
Ind
ex
Year (spring of year)
Wet Sclerophyll Forest dependants (n=34)Common species (n=37)Hollow nesters (n=6)
Birds of Tasmania
Ind
ex
Year (spring of year)
Aerial insectivores (n=8)Carnivores (n=14)Common species (n=52)Ground nesters (n=6)Hollow nesters (n=22)Dry sclerophyll woodland/forest dependants (n=80)
Birds of the Brigalow Belt
Ind
ex
Year (spring of year)
Aerial insectivores (n=10)Carnivores (n=20)Common species (n=47)Ground nesters (n=13)Hollow nesters (n=24)Tropical savanna woodland dependants (n=77)
Birds of the Tropical Savanna
JULY 2015 I 1514 I STaTE of aUSTraLIa’S BIrdS STaTEofBIrdS.org.aU
red list indexregional trends in Widespread species
SpeciesTrend
1999-2013Trend
2001-2006Trend
2006-2011
High variability across regions
Australian Magpie; Arid Zone + +
Australian Magpie; Brigalow Belt -
Australian Magpie; East Coast - - -
Australian Magpie; Eastern Mallee + +
Australian Magpie; South-eastern Mainland - - +
Australian Magpie; Tasmania + +
Australian Magpie; Tropical Savanna + -
Consistent overall declines across regions
Southern Boobook; Arid Zone - -
Southern Boobook; Brigalow Belt - -
Southern Boobook; East Coast - -
Southern Boobook; Eastern Mallee
Southern Boobook; South-eastern Mainland -
Southern Boobook; Tropical Savanna - -
Consistent overall increases across regions
Rufous Songlark; Arid Zone + - +
Rufous Songlark; Brigalow Belt + +
Rufous Songlark; Eastern Mallee + - +
Rufous Songlark; South-eastern Mainland + + +
Status 1990 2000 2010 2015
Critically Endangered (Possibly Extinct) 1 4 4 4
Critically Endangered 17 13 15 18
Endangered 46 49 66 63
Vulnerable 59 67 62 63
Near Threatened 56 63 62 62
Least Concern 1062 1046 1036 1035
• Alarm bells are ringing for species such as Southern Boobooks, which show marked decline across all regions
The factors that influence Australia’s bird populations—such as climate, fire regimes, human threats and their management—vary greatly across the continent. It is therefore important to take into account the trends for a species throughout all the regions in which they occur.
Significantly different trends can be observed for many Australian birds within separate regions—of the 137 terrestrial species which occur over three of more regions, only 10.2 per cent showed a consistent overall trend.
The variation in trends across regions is exemplified by two of Australia’s most familiar terrestrial birds, the Australian Magpie and Willie Wagtail. Both species occur across most of the continent and show a mix of increases, decreases, variability and stability in different regions. It is notable that of these two species, only the Australian Magpie showed a consistent pattern over time in one region—its reporting rate declined significantly in the East Coast during each time period.
A small number of widespread species show consistent trends across the regions in which they occur, which would indicate that they are doing well—or poorly—overall. For example the Southern Boobook and Tawny Frogmouth both show significant overall declines in all but one of the regions in which they occur. This is cause for concern and further investigation is needed to understand the factors that are driving this consistent decline across regions.
Above The Southern Boobook is declining across all but one of the regions it inhabits. Photo by Richard Jackson
Below This table shows the trends for a single species across different bioregions within set periods of monitoring.
Above The Eastern Curlew, a migratory shorebird that has recently been declared Critically Endangered. Photo by Dean Ingwersen Below While this report highlights major trends for terrestrial birds, the Red List Index makes it clear that shorebirds and seabirds are also in urgent need of conservation action.
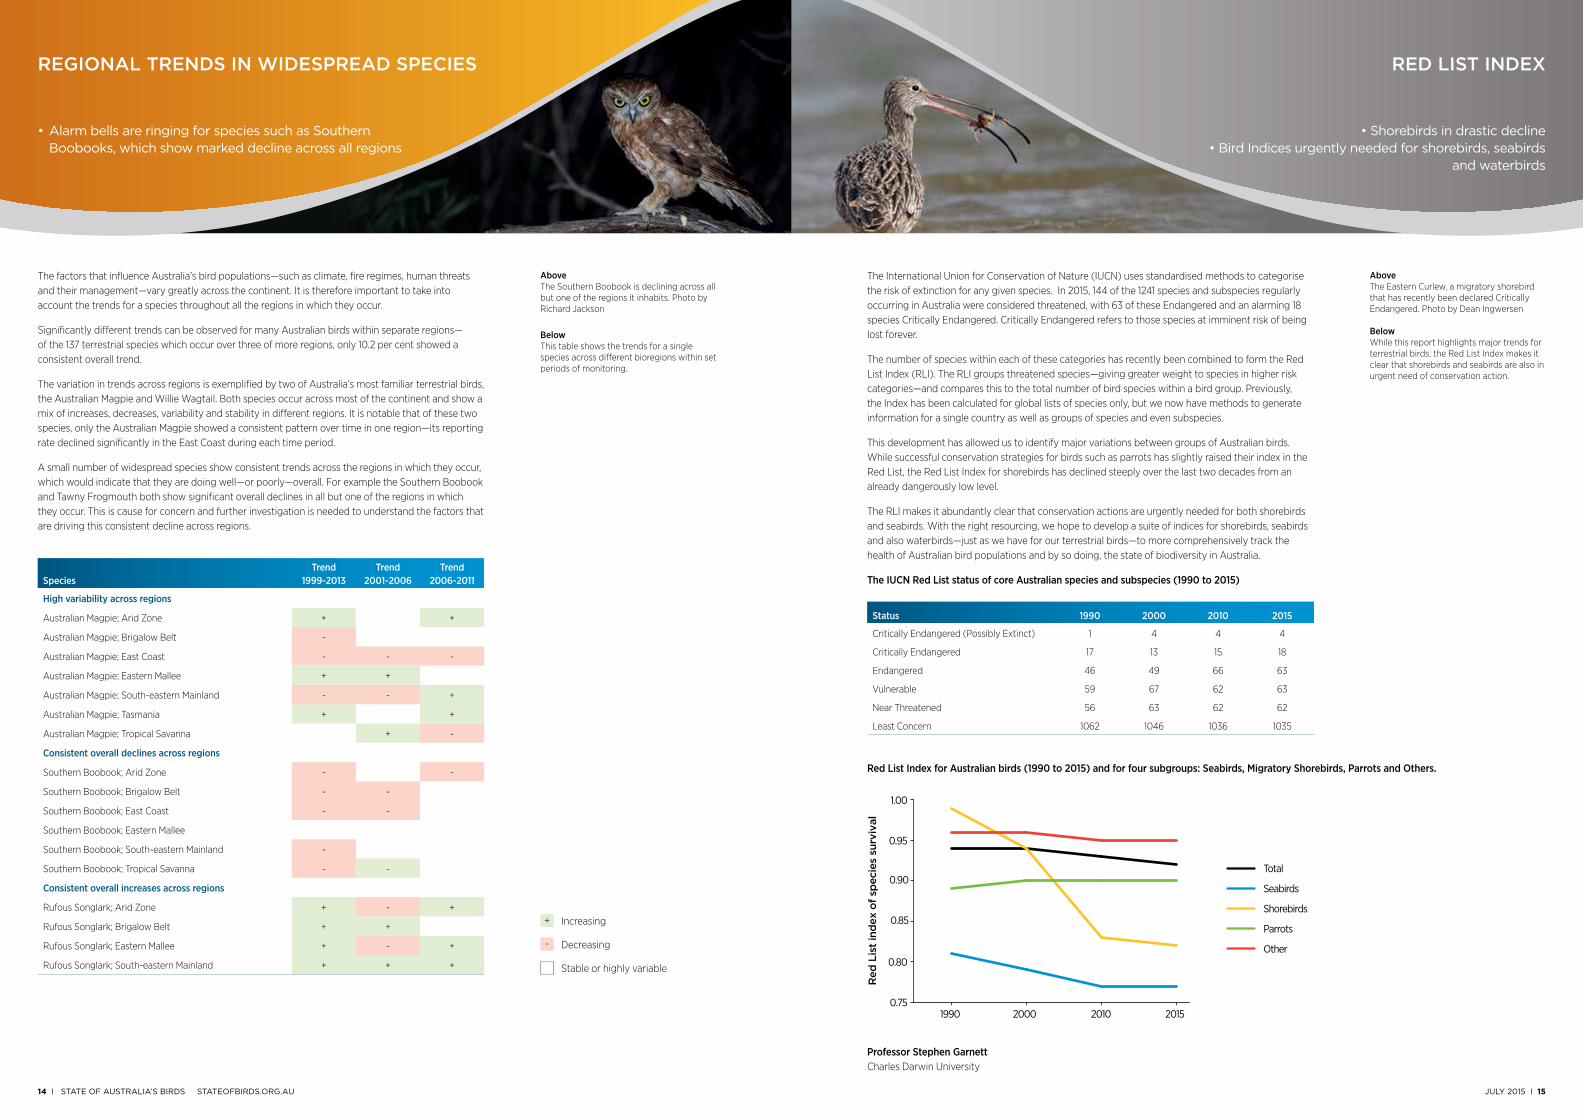
• Shorebirds in drastic decline • Bird Indices urgently needed for shorebirds, seabirds
and waterbirds
The International Union for Conservation of Nature (IUCN) uses standardised methods to categorise the risk of extinction for any given species. In 2015, 144 of the 1241 species and subspecies regularly occurring in Australia were considered threatened, with 63 of these Endangered and an alarming 18 species Critically Endangered. Critically Endangered refers to those species at imminent risk of being lost forever.
The number of species within each of these categories has recently been combined to form the Red List Index (RLI). The RLI groups threatened species—giving greater weight to species in higher risk categories—and compares this to the total number of bird species within a bird group. Previously, the Index has been calculated for global lists of species only, but we now have methods to generate information for a single country as well as groups of species and even subspecies.
This development has allowed us to identify major variations between groups of Australian birds. While successful conservation strategies for birds such as parrots has slightly raised their index in the Red List, the Red List Index for shorebirds has declined steeply over the last two decades from an already dangerously low level.
The RLI makes it abundantly clear that conservation actions are urgently needed for both shorebirds and seabirds. With the right resourcing, we hope to develop a suite of indices for shorebirds, seabirds and also waterbirds—just as we have for our terrestrial birds—to more comprehensively track the health of Australian bird populations and by so doing, the state of biodiversity in Australia.
The IUCN Red List status of core Australian species and subspecies (1990 to 2015)
Red List Index for Australian birds (1990 to 2015) and for four subgroups: Seabirds, Migratory Shorebirds, Parrots and Others.
Red
Lis
t in
dex
of s
pec
ies
surv
ival
0.75
0.80
0.85
0.90
0.95
1.00
1990 2000 2010 2015
Total
Seabirds
Shorebirds
Parrots
Other
Increasing
Decreasing
Stable or highly variable
Professor Stephen Garnett Charles Darwin University
16 I STaTE of aUSTraLIa’S BIrdS STaTEofBIrdS.org.aU
BirdLife Australia is committed to the conservation of Australia’s birds and their habitats, recognising that conservation decisions and actions must be grounded the best possible science. To support this mission, BirdLife Australia produces State of Australia’s Birds reports to summarise current knowledge on the health of the birds that call Australia home.
This report presents headline trends from the first State of Australia’s Birds report to include Australian Bird Indices. A first for the Southern Hemisphere, these indices allow us to track the health of Australian terrestrial bird populations as a powerful way of understanding the current state of diversity in Australia. The preliminary findings for a subset of regions are included within this report, with extensive results and resources available online at stateofbirds.org.au. A comprehensive State of Australia’s Birds is planned for release in early 2016.
With the necessary support, BirdLife Australia hopes to develop three more suites of indices to represent the other major bird groups in Australia: shorebirds, seabirds and waterbirds. Together these Australian Bird Indices form a powerful base for working towards a bright future for Australia’s birds.
Acknowledgments This report would not have been possible without the support of our many partners: the Australian Government’s Department of Environment, the National Environment Research Program, Charles Darwin University, the Environmental Resources Information Network and the Australian Bird Environment Foundation and Ian Potter Foundation, who generously funded the production and launch of this Headline report.
BirdLife Australia would like to acknowledge the authors and editors of the report: Glenn Ehmke, Ross Cunningham, James O’Connor, Stephen Garnett, Jenny Lau and Kerryn Herman and the Production Editor, Bronwyn James. Thanks also to the many photographers who generously contributed their photos, Glenn Ehmke for producing all the multi-composite and species graphs and to Sean Dooley and John Peter for their editorial support. A full list of contributors is available online.
Indigenous knowledge of native Australian birds, their life cycles and habitat needs has made a substantial contribution to the scientific study of birds in this country. BirdLife Australia wishes to acknowledge this contribution and facilitate the further engagement of Indigenous Australians in research and conservation of our native birds.
Cover: The magnificent Wedge-tailed Eagle. Photo by Tim Rudman
More information available online at stateofbirds.org.au
ISSN: 2205-1597
Copyright: Reproduction in whole or in part may only occur with the written permission of the Editors
Printed on recycled FSC paper
Australia’s voice for birds since 1901
BirdLife Australia is dedicated to achieving outstanding conservation results for our native birds and their habitats.
With our specialised knowledge and the commitment of an Australia-wide network of volunteers and supporters, we are creating a bright future for Australia’s birds.
Suite 2-05 60 Leicester Street, Carlton VIC 3053
birdlife.org.au stateofbirds.org.au
Add your voice
enjoy the rewards of membership, making a real difference for
our native birds
join us
help us create positive outcomes
for birds and their habitats
donate
contributing your time is one of the
most effective ways to help
volunteer