Embed Size (px)
Citation preview
The State of Higher Education
DECEMBER 2013
Blacks in
in California
The persistent opportunity gap
2
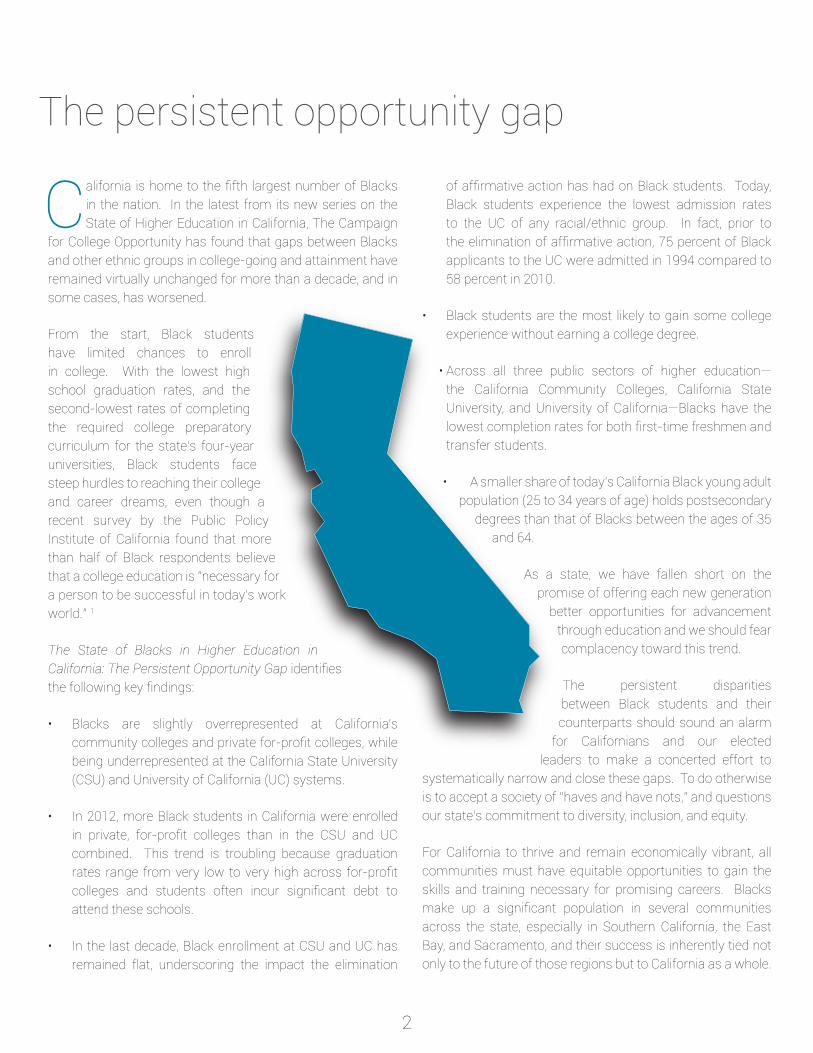
California is home to the fifth largest number of Blacks in the nation. In the latest from its new series on the State of Higher Education in California, The Campaign
for College Opportunity has found that gaps between Blacks and other ethnic groups in college-going and attainment have remained virtually unchanged for more than a decade, and in some cases, has worsened.
From the start, Black students have limited chances to enroll in college. With the lowest high school graduation rates, and the second-lowest rates of completing the required college preparatory curriculum for the state’s four-year universities, Black students face steep hurdles to reaching their college and career dreams, even though a recent survey by the Public Policy Institute of California found that more than half of Black respondents believe that a college education is “necessary for a person to be successful in today’s work world.” 1
The State of Blacks in Higher Education in California: The Persistent Opportunity Gap identifies the following key findings:
• Blacks are slightly overrepresented at California’s community colleges and private for-profit colleges, while being underrepresented at the California State University (CSU) and University of California (UC) systems.
• In 2012, more Black students in California were enrolled in private, for-profit colleges than in the CSU and UC combined. This trend is troubling because graduation rates range from very low to very high across for-profit colleges and students often incur significant debt to attend these schools.
• In the last decade, Black enrollment at CSU and UC has remained flat, underscoring the impact the elimination
of affirmative action has had on Black students. Today, Black students experience the lowest admission rates to the UC of any racial/ethnic group. In fact, prior to the elimination of affirmative action, 75 percent of Black applicants to the UC were admitted in 1994 compared to 58 percent in 2010.
• Black students are the most likely to gain some college experience without earning a college degree.
• Across all three public sectors of higher education—the California Community Colleges, California State University, and University of California—Blacks have the lowest completion rates for both first-time freshmen and transfer students.
• A smaller share of today’s California Black young adult population (25 to 34 years of age) holds postsecondary
degrees than that of Blacks between the ages of 35 and 64.
As a state, we have fallen short on the promise of offering each new generation
better opportunities for advancement through education and we should fear complacency toward this trend.
The persistent disparities between Black students and their counterparts should sound an alarm
for Californians and our elected leaders to make a concerted effort to
systematically narrow and close these gaps. To do otherwise is to accept a society of “haves and have nots,” and questions our state’s commitment to diversity, inclusion, and equity.
For California to thrive and remain economically vibrant, all communities must have equitable opportunities to gain the skills and training necessary for promising careers. Blacks make up a significant population in several communities across the state, especially in Southern California, the East Bay, and Sacramento, and their success is inherently tied not only to the future of those regions but to California as a whole.
The persistent opportunity gap
3
Recommendations
This report offers a demographic overview of the Black population in California and an analysis of key education indicators over time. The Campaign for College Opportunity proposes the following six recommendations for policymakers, college leaders, and families so that we secure California’s economic future by significantly increasing completion rates in order to reduce the opportunity gap for Black residents in our state.
1. Create a statewide plan for higher education
• Establish statewide goals for improving high school graduation rates of Black students, including successful preparation and completion of the A-G curriculum.
• Establish statewide and college-by-college benchmarks for increasing Black completion rates and decreasing the number of students and amount of time spent in pre-college level courses.
• Prioritize resources for colleges to examine performance problems and identify solutions to improve success for all students.
• Monitor progress toward benchmarks and completion goals in a public and transparent way.
2. Expand college knowledge
• Scale proven and successful efforts to improve college knowledge among Black students. Efforts should include incorporating college knowledge education, comprehensive information about financial aid, college eligibility criteria, the differences among colleges, and the college application process for students and their parents as early as middle school.
3. Invest in services students need to succeed
• New and existing financial resources should be prioritized for proven student success services such as orientation, counseling, advising, and peer learning opportunities, especially at California Community Colleges.
4. Fund colleges for both enrollment and success
• Increase funding for higher education to ensure all eligible students have a spot in college.
• Establish a new funding mechanism that creates incentives beyond just college enrollment funding and holds colleges and universities accountable for increasing underrepresented minority graduation and completion rates.
5. Strengthen financial support options for students
• Ensure that all eligible students apply and receive federal and California student aid for which they qualify.
• Expand financial aid for students attending community colleges through the Cal Grant program.
6. Encourage colleges and universities to reach out and re- enroll students who are close to completing a degree
• Because a growing number of Black adults have had some college but no degree, colleges and universities should make efforts to contact those students who are very close to graduating in order to encourage and incentivize re-enrollment and completion.
4
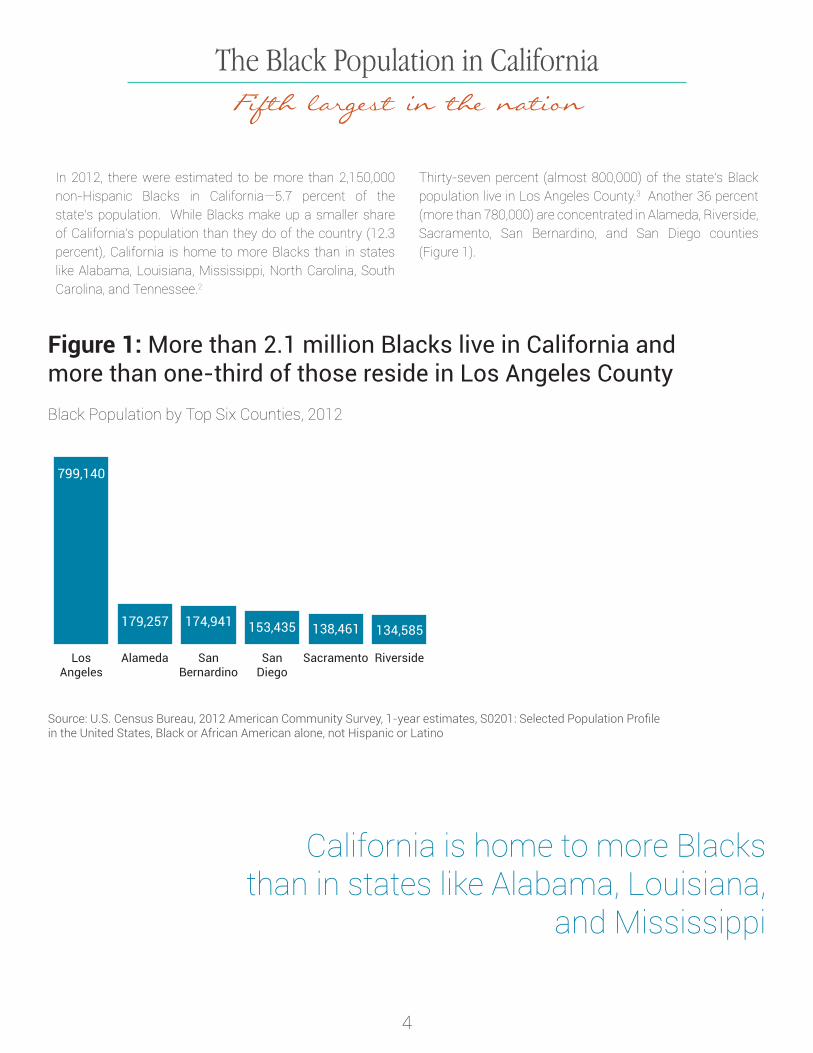
In 2012, there were estimated to be more than 2,150,000 non-Hispanic Blacks in California—5.7 percent of the state’s population. While Blacks make up a smaller share of California’s population than they do of the country (12.3 percent), California is home to more Blacks than in states like Alabama, Louisiana, Mississippi, North Carolina, South Carolina, and Tennessee.2
Thirty-seven percent (almost 800,000) of the state’s Black population live in Los Angeles County.3 Another 36 percent (more than 780,000) are concentrated in Alameda, Riverside, Sacramento, San Bernardino, and San Diego counties (Figure 1).
Source: U.S. Census Bureau, 2012 American Community Survey, 1-year estimates, S0201: Selected Population Profile in the United States, Black or African American alone, not Hispanic or Latino
The Black Population in CaliforniaFifth largest in the nation
Figure 1: More than 2.1 million Blacks live in California and more than one-third of those reside in Los Angeles County Black Population by Top Six Counties, 2012
RiversideSacramentoSanDiego
SanBernardino
AlamedaLosAngeles
799,140
179,257 174,941 153,435 138,461 134,585
California is home to more Blacks than in states like Alabama, Louisiana,
and Mississippi
5
Educational AttainmentThe persistent gap
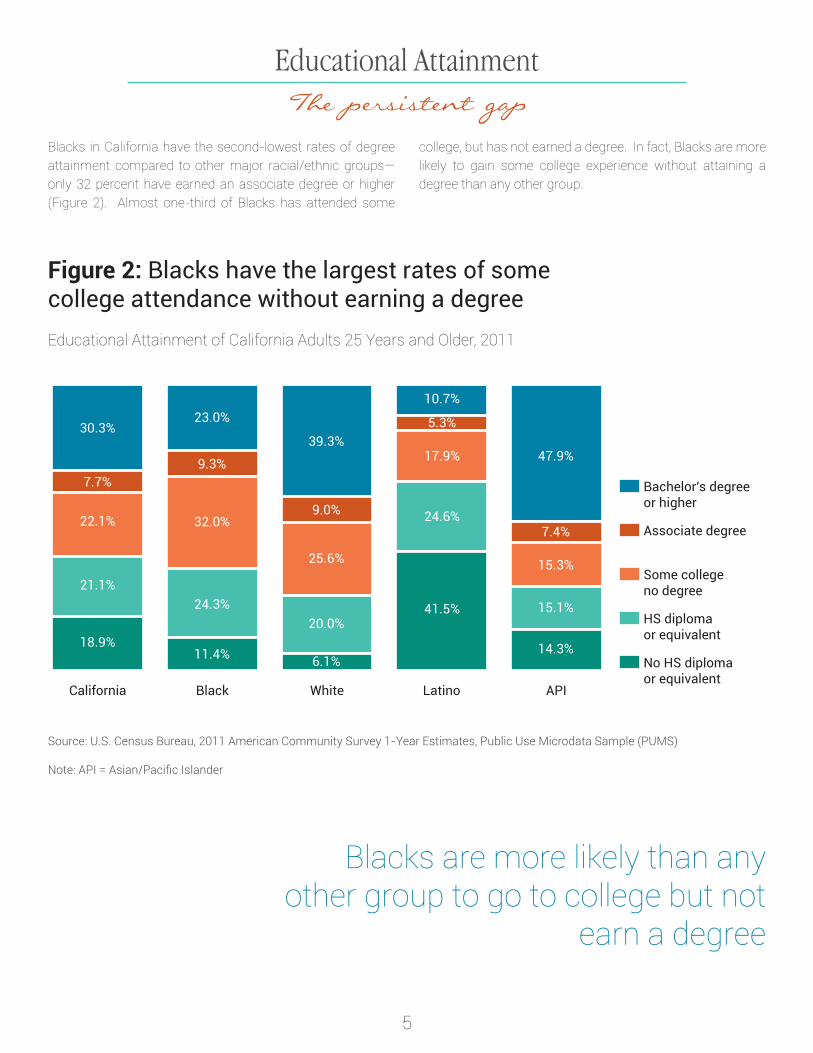
Blacks in California have the second-lowest rates of degree attainment compared to other major racial/ethnic groups—only 32 percent have earned an associate degree or higher (Figure 2). Almost one-third of Blacks has attended some
college, but has not earned a degree. In fact, Blacks are more likely to gain some college experience without attaining a degree than any other group.
Figure 2: Blacks have the largest rates of some college attendance without earning a degreeEducational Attainment of California Adults 25 Years and Older, 2011
Source: U.S. Census Bureau, 2011 American Community Survey 1-Year Estimates, Public Use Microdata Sample (PUMS)
Note: API = Asian/Pacific Islander
Blacks are more likely than any other group to go to college but not
earn a degree
APILatinoWhiteBlackCalifornia
18.9%
21.1%
22.1%
7.7%
30.3%
10.7%
5.3%
17.9%
24.6%
41.5%
39.3%47.9%
9.0%
25.6%
20.0%
6.1%
23.0%
9.3%
32.0%
24.3%
11.4%
7.4%
15.3%
15.1%
14.3%
Bachelor's degreeor higher
Associate degree
Some collegeno degree
HS diplomaor equivalent
No HS diplomaor equivalent
6
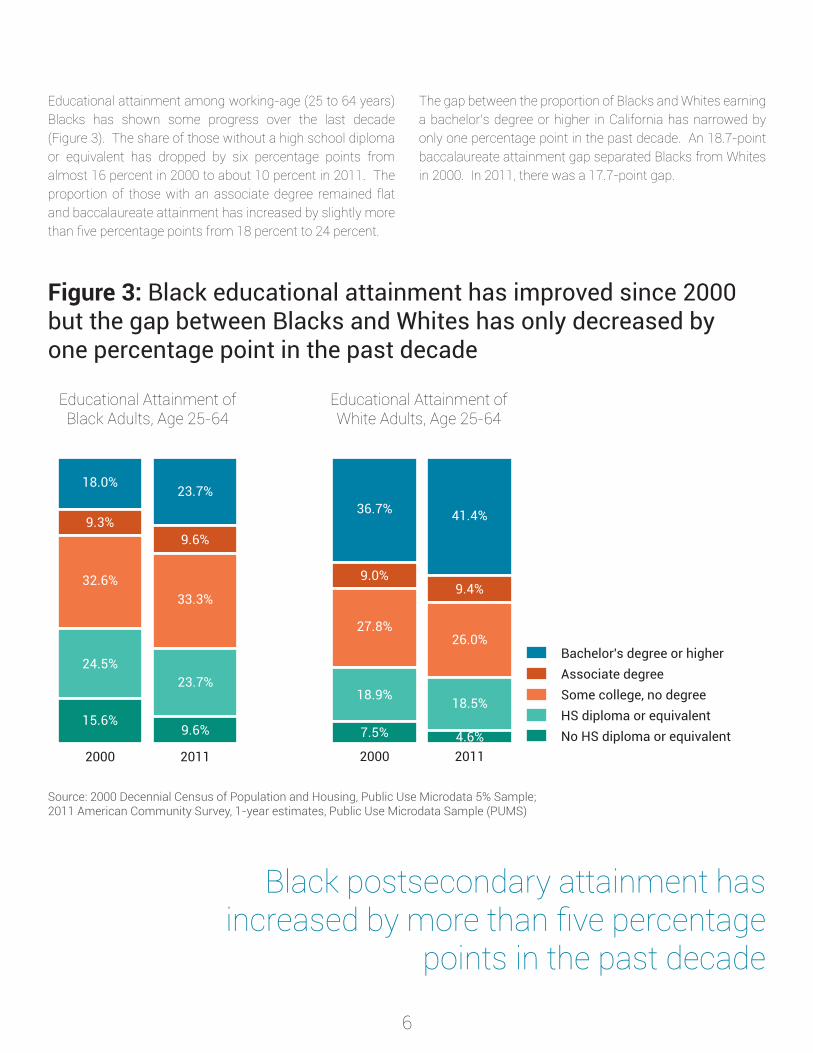
Educational attainment among working-age (25 to 64 years) Blacks has shown some progress over the last decade (Figure 3). The share of those without a high school diploma or equivalent has dropped by six percentage points from almost 16 percent in 2000 to about 10 percent in 2011. The proportion of those with an associate degree remained flat and baccalaureate attainment has increased by slightly more than five percentage points from 18 percent to 24 percent.
The gap between the proportion of Blacks and Whites earning a bachelor’s degree or higher in California has narrowed by only one percentage point in the past decade. An 18.7-point baccalaureate attainment gap separated Blacks from Whites in 2000. In 2011, there was a 17.7-point gap.
Figure 3: Black educational attainment has improved since 2000 but the gap between Blacks and Whites has only decreased by one percentage point in the past decade
Source: 2000 Decennial Census of Population and Housing, Public Use Microdata 5% Sample; 2011 American Community Survey, 1-year estimates, Public Use Microdata Sample (PUMS)
Black postsecondary attainment has increased by more than five percentage
points in the past decade
Educational Attainment of Black Adults, Age 25-64
Educational Attainment of White Adults, Age 25-64
20112000
18.0%
9.3%
32.6%
24.5%
15.6%9.6%
23.7%
33.3%
9.6%
23.7%
20112000
Bachelor's degree or higherAssociate degreeSome college, no degreeHS diploma or equivalentNo HS diploma or equivalent
36.7%
9.0%
27.8%
18.9%
7.5% 4.6%
18.5%
26.0%
9.4%
41.4%
7
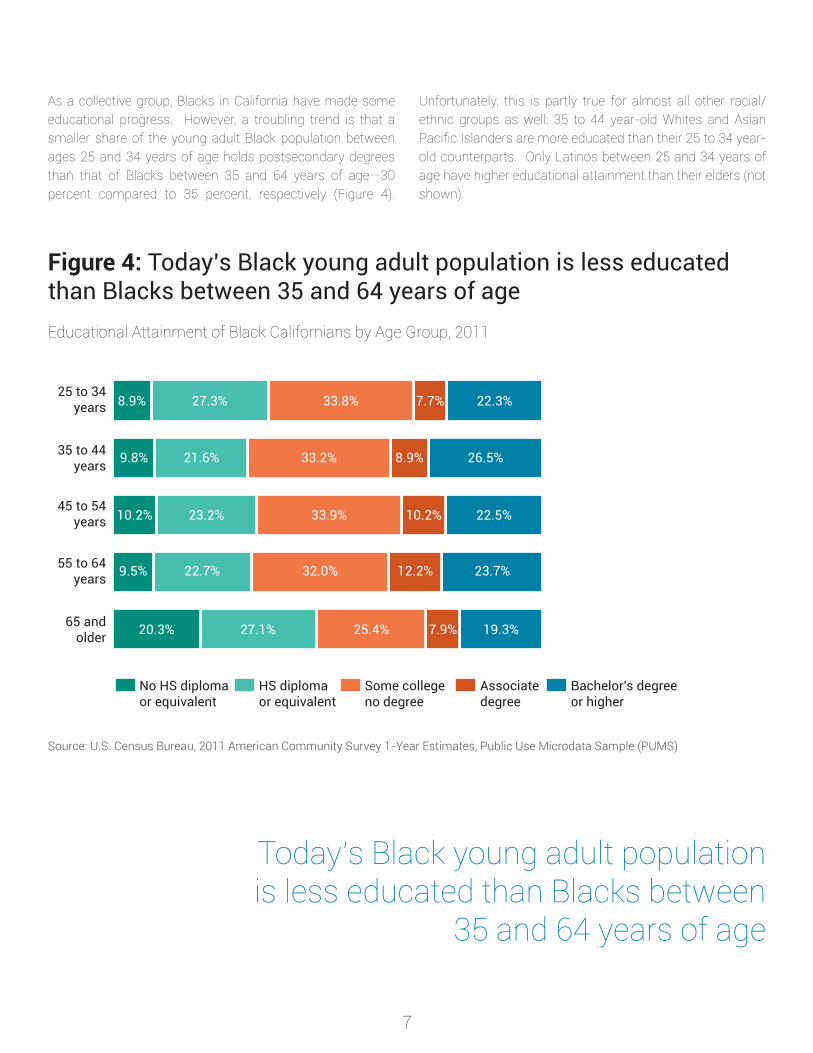
As a collective group, Blacks in California have made some educational progress. However, a troubling trend is that a smaller share of the young adult Black population between ages 25 and 34 years of age holds postsecondary degrees than that of Blacks between 35 and 64 years of age—30 percent compared to 35 percent, respectively (Figure 4).
Unfortunately, this is partly true for almost all other racial/ethnic groups as well: 35 to 44 year-old Whites and Asian Pacific Islanders are more educated than their 25 to 34 year-old counterparts. Only Latinos between 25 and 34 years of age have higher educational attainment than their elders (not shown).
Figure 4: Today’s Black young adult population is less educated than Blacks between 35 and 64 years of ageEducational Attainment of Black Californians by Age Group, 2011
Source: U.S. Census Bureau, 2011 American Community Survey 1-Year Estimates, Public Use Microdata Sample (PUMS)
Today’s Black young adult population is less educated than Blacks between
35 and 64 years of age
Bachelor's degreeor higher
Associate degree
Some collegeno degree
HS diplomaor equivalent
No HS diplomaor equivalent
65 andolder
55 to 64years
45 to 54years
35 to 44years
25 to 34years
20.3% 27.1% 25.4% 7.9% 19.3%
23.7%12.2%32.0%22.7%9.5%
10.2% 23.2% 33.9% 10.2% 22.5%
26.5%8.9%33.2%21.6%9.8%
8.9% 27.3% 33.8% 7.7% 22.3%
8
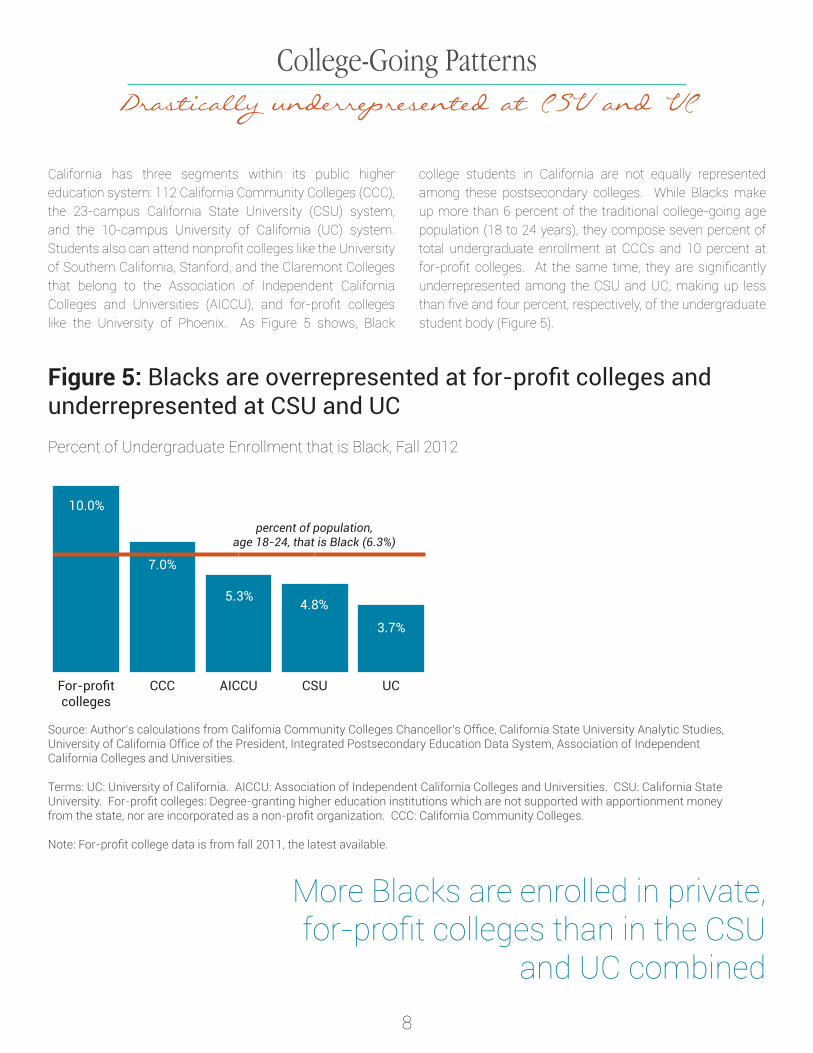
California has three segments within its public higher education system: 112 California Community Colleges (CCC), the 23-campus California State University (CSU) system, and the 10-campus University of California (UC) system. Students also can attend nonprofit colleges like the University of Southern California, Stanford, and the Claremont Colleges that belong to the Association of Independent California Colleges and Universities (AICCU), and for-profit colleges like the University of Phoenix. As Figure 5 shows, Black
college students in California are not equally represented among these postsecondary colleges. While Blacks make up more than 6 percent of the traditional college-going age population (18 to 24 years), they compose seven percent of total undergraduate enrollment at CCCs and 10 percent at for-profit colleges. At the same time, they are significantly underrepresented among the CSU and UC, making up less than five and four percent, respectively, of the undergraduate student body (Figure 5).
Figure 5: Blacks are overrepresented at for-profit colleges and underrepresented at CSU and UCPercent of Undergraduate Enrollment that is Black, Fall 2012
Source: Author’s calculations from California Community Colleges Chancellor’s Office, California State University Analytic Studies, University of California Office of the President, Integrated Postsecondary Education Data System, Association of Independent California Colleges and Universities.
Terms: UC: University of California. AICCU: Association of Independent California Colleges and Universities. CSU: California State University. For-profit colleges: Degree-granting higher education institutions which are not supported with apportionment money from the state, nor are incorporated as a non-profit organization. CCC: California Community Colleges.
Note: For-profit college data is from fall 2011, the latest available.
College-Going PatternsDrastically underrepresented at CSU and UC
UCCSUAICCUCCCFor-profitcolleges
7.0%
4.8%
10.0%
3.7%
5.3%
percent of population,age 18-24, that is Black (6.3%)
More Blacks are enrolled in private, for-profit colleges than in the CSU
and UC combined
9
Growing Number of Black Students Enroll in For-Profit Colleges
More Californians enroll in for-profit colleges than residents of any other state.4 However, enrollment is not distributed across all races and ethnicities equally. Latino and Black students enroll in for-profit colleges at a much higher rate than Whites and Asian Pacific Islanders (API). In fact, API students are eight times as likely to enroll in a CSU or UC as a first-time freshman than in a for-profit college, while Blacks are just as likely to enroll in a CSU or UC as they are in a for-profit college.5 Nationally, between 2004 and 2009, Black enrollment in for-profit college bachelor’s programs increased by 218 percent, compared to a 24 percent increase in Black enrollment in public four-year university programs.6
While 60 percent of for-profit colleges award no more than a certificate for students with specialized objectives, others offer a variety of degree programs. A majority of these colleges are located in larger metropolitan areas and allow both full- and part-time enrollment. Students who enroll in for-profit colleges tend to be older, financially independent, female, people of color, and first-generation college-going. For many of these students, for-profit colleges provide the benefits of convenient locations, increased online access, a specialized skill set with certification, and shorter time to completion to enter the workforce.7
For-profit colleges also can have downsides. Graduation and completion rates vary across the board, with some as low as five percent and others as high as 100 percent.8 Students who attend for-profit colleges are more likely to take out student loans and have higher amounts of debt. A recent report from the Public Policy Institute of California (PPIC) found that in 2010, 78 percent of first-year freshmen who enrolled in California for-profit colleges obtained loans, compared with 59 percent at nonprofit colleges and 39 percent at public four-year universities.9 The average amount of borrowing for first-time students at for-profit colleges in California also was the highest ($9,189) compared with $7,591 for students at private nonprofit universities and $5,289 for public four-year college students.10 Students who attend for-profit colleges also have higher student loan default rates (9.7 percent) than those who attend nonprofit colleges (4.7 percent) and public colleges (6.6 percent).11 Almost half of all students in loan default in California attended a private, for-profit college.12 Given the large number of Blacks who increasingly enroll in these colleges, this is particularly troubling. In fact, national data shows that Blacks have the highest rates of borrowing (81 percent) and the highest average amount of loans ($28,692). 13
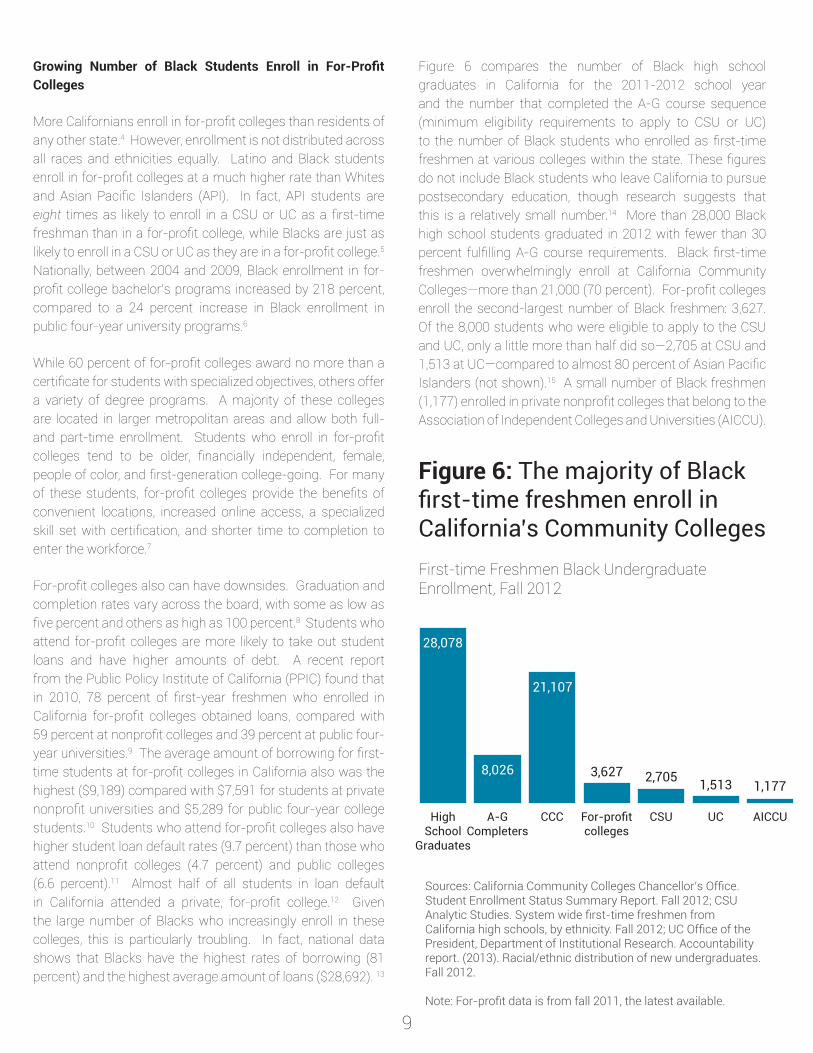
Figure 6 compares the number of Black high school graduates in California for the 2011-2012 school year and the number that completed the A-G course sequence (minimum eligibility requirements to apply to CSU or UC) to the number of Black students who enrolled as first-time freshmen at various colleges within the state. These figures do not include Black students who leave California to pursue postsecondary education, though research suggests that this is a relatively small number.14 More than 28,000 Black high school students graduated in 2012 with fewer than 30 percent fulfilling A-G course requirements. Black first-time freshmen overwhelmingly enroll at California Community Colleges—more than 21,000 (70 percent). For-profit colleges enroll the second-largest number of Black freshmen: 3,627. Of the 8,000 students who were eligible to apply to the CSU and UC, only a little more than half did so—2,705 at CSU and 1,513 at UC—compared to almost 80 percent of Asian Pacific Islanders (not shown).15 A small number of Black freshmen (1,177) enrolled in private nonprofit colleges that belong to the Association of Independent Colleges and Universities (AICCU).
Figure 6: The majority of Black first-time freshmen enroll in California’s Community CollegesFirst-time Freshmen Black Undergraduate Enrollment, Fall 2012
AICCUUCCSUFor-profitcolleges
CCCA-GCompleters
HighSchool
Graduates
28,078
8,026
21,107
3,627 2,705 1,513 1,177
Sources: California Community Colleges Chancellor’s Office. Student Enrollment Status Summary Report. Fall 2012; CSU Analytic Studies. System wide first-time freshmen from California high schools, by ethnicity. Fall 2012; UC Office of the President, Department of Institutional Research. Accountability report. (2013). Racial/ethnic distribution of new undergraduates. Fall 2012.
Note: For-profit data is from fall 2011, the latest available.
10
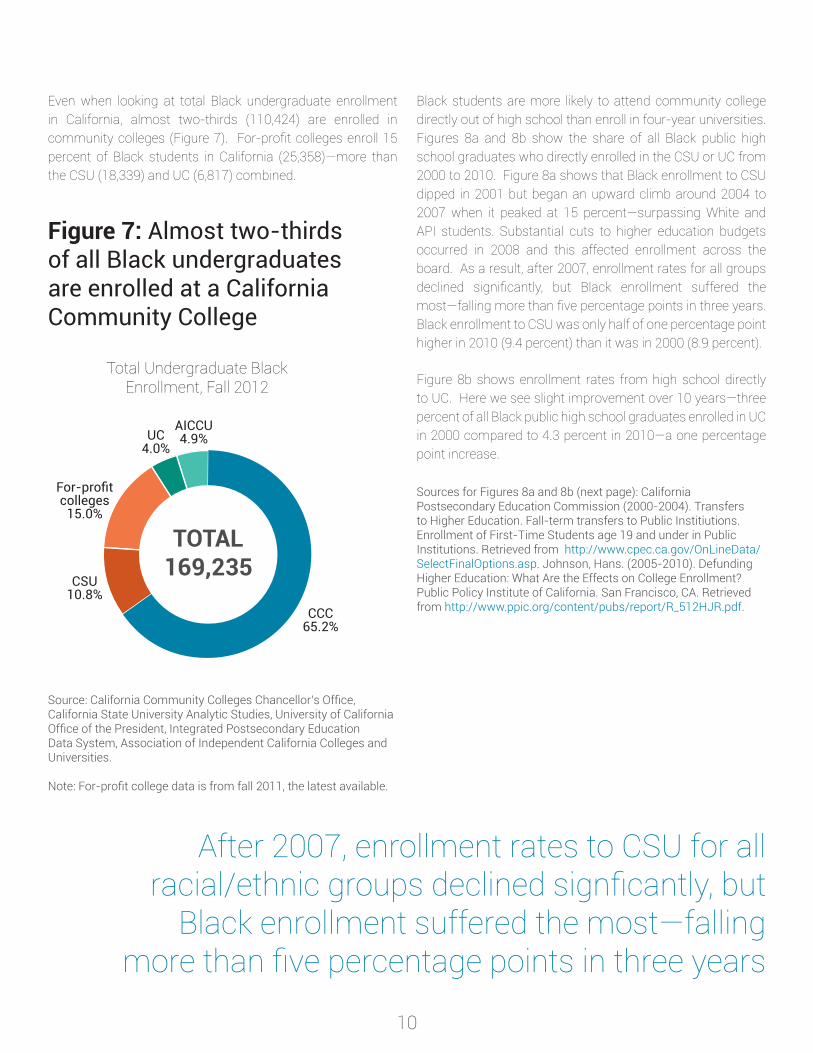
Even when looking at total Black undergraduate enrollment in California, almost two-thirds (110,424) are enrolled in community colleges (Figure 7). For-profit colleges enroll 15 percent of Black students in California (25,358)—more than the CSU (18,339) and UC (6,817) combined.
Figure 7: Almost two-thirds of all Black undergraduates are enrolled at a California Community College
Source: California Community Colleges Chancellor’s Office, California State University Analytic Studies, University of California Office of the President, Integrated Postsecondary Education Data System, Association of Independent California Colleges and Universities.
Note: For-profit college data is from fall 2011, the latest available.
Total Undergraduate Black Enrollment, Fall 2012
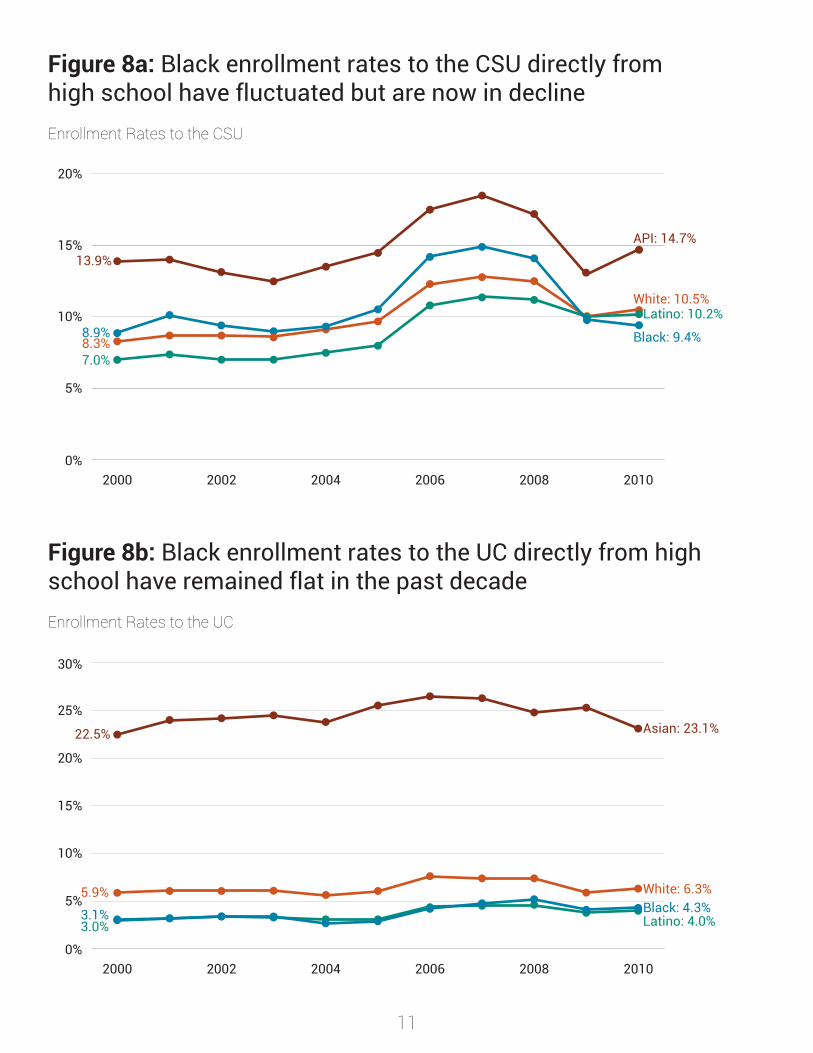
Black students are more likely to attend community college directly out of high school than enroll in four-year universities. Figures 8a and 8b show the share of all Black public high school graduates who directly enrolled in the CSU or UC from 2000 to 2010. Figure 8a shows that Black enrollment to CSU dipped in 2001 but began an upward climb around 2004 to 2007 when it peaked at 15 percent—surpassing White and API students. Substantial cuts to higher education budgets occurred in 2008 and this affected enrollment across the board. As a result, after 2007, enrollment rates for all groups declined significantly, but Black enrollment suffered the most—falling more than five percentage points in three years. Black enrollment to CSU was only half of one percentage point higher in 2010 (9.4 percent) than it was in 2000 (8.9 percent).
Figure 8b shows enrollment rates from high school directly to UC. Here we see slight improvement over 10 years—three percent of all Black public high school graduates enrolled in UC in 2000 compared to 4.3 percent in 2010—a one percentage point increase.
Sources for Figures 8a and 8b (next page): California Postsecondary Education Commission (2000-2004). Transfers to Higher Education. Fall-term transfers to Public Institiutions. Enrollment of First-Time Students age 19 and under in Public Institutions. Retrieved from http://www.cpec.ca.gov/OnLineData/SelectFinalOptions.asp. Johnson, Hans. (2005-2010). Defunding Higher Education: What Are the Effects on College Enrollment? Public Policy Institute of California. San Francisco, CA. Retrieved from http://www.ppic.org/content/pubs/report/R_512HJR.pdf.
After 2007, enrollment rates to CSU for all racial/ethnic groups declined signficantly, but
Black enrollment suffered the most—falling more than five percentage points in three years
CCC65.2%
CSU10.8%
For-profitcolleges
15.0%
UC4.0%
AICCU4.9%
TOTAL169,235
11
Figure 8a: Black enrollment rates to the CSU directly from high school have fluctuated but are now in declineEnrollment Rates to the CSU
Figure 8b: Black enrollment rates to the UC directly from high school have remained flat in the past decadeEnrollment Rates to the UC
0%
5%
10%
15%
20%
201020082006200420022000
API: 14.7%
White: 10.5%
Black: 9.4%
Latino: 10.2%
13.9%
8.9%8.3%7.0%
0%
5%
10%
15%
20%
25%
30%
201020082006200420022000
Asian: 23.1%
White: 6.3%Black: 4.3%Latino: 4.0%
22.5%
3.1%
5.9%
3.0%
12
Black participation in higher education is not distributed evenly across segments and colleges—the vast majority attends community colleges and for-profit colleges. A variety of factors contribute to Black underrepresentation at California’s more selective universities including low high school graduation rates, low eligibility rates, lack of information and college knowledge, low socioeconomic status, and declining admission rates.
High School Matters
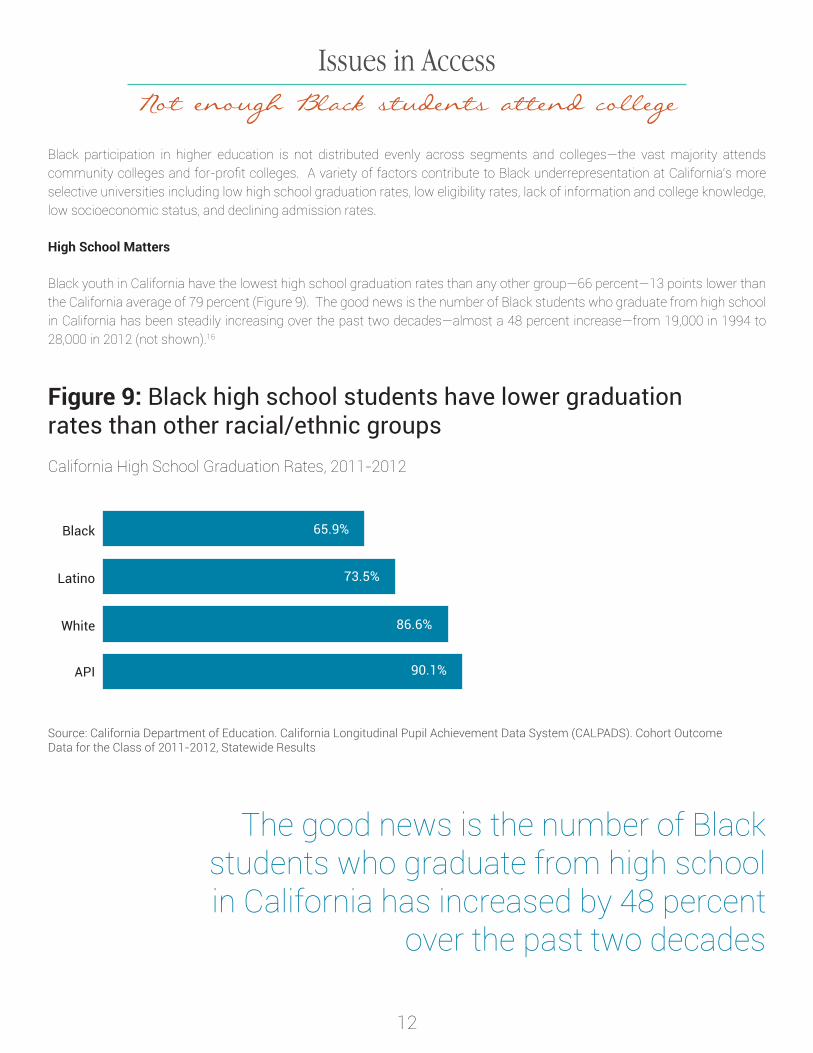
Black youth in California have the lowest high school graduation rates than any other group—66 percent—13 points lower than the California average of 79 percent (Figure 9). The good news is the number of Black students who graduate from high school in California has been steadily increasing over the past two decades—almost a 48 percent increase—from 19,000 in 1994 to 28,000 in 2012 (not shown).16
Issues in AccessNot enough Black students attend college
Figure 9: Black high school students have lower graduation rates than other racial/ethnic groupsCalifornia High School Graduation Rates, 2011-2012
Source: California Department of Education. California Longitudinal Pupil Achievement Data System (CALPADS). Cohort Outcome Data for the Class of 2011-2012, Statewide Results
The good news is the number of Black students who graduate from high school in California has increased by 48 percent
over the past two decades
API
White
Latino
Black 65.9%
73.5%
86.6%
90.1%
13
Eligibility Matters
The minimum requirements for eligibility to the California State University (CSU) or the University of California (UC) system is completion of the A-G curriculum, a set of courses students complete in their 9th through 12th grade years with grades of C or higher. The state of California does not require completion of the rigorous A-G course requirements for a high school diploma. Admission to the CSU and UC is then based on Grade Point Average (GPA), test scores, and the applicant’s overall profile. The A-G curriculum therefore acts as a gatekeeper—only those who have completed the curriculum can apply to the CSU and UC, and even then, they have no guarantee of admission.
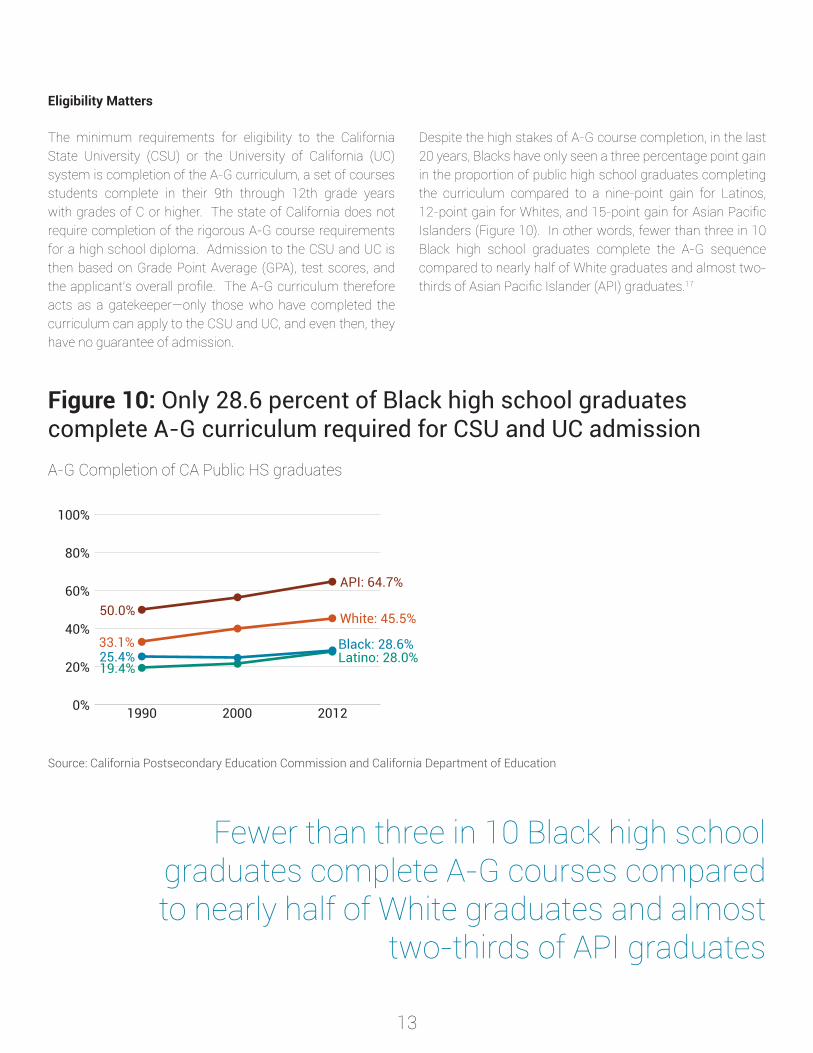
Despite the high stakes of A-G course completion, in the last 20 years, Blacks have only seen a three percentage point gain in the proportion of public high school graduates completing the curriculum compared to a nine-point gain for Latinos, 12-point gain for Whites, and 15-point gain for Asian Pacific Islanders (Figure 10). In other words, fewer than three in 10 Black high school graduates complete the A-G sequence compared to nearly half of White graduates and almost two-thirds of Asian Pacific Islander (API) graduates.17
Figure 10: Only 28.6 percent of Black high school graduates complete A-G curriculum required for CSU and UC admissionA-G Completion of CA Public HS graduates
Source: California Postsecondary Education Commission and California Department of Education
Fewer than three in 10 Black high school graduates complete A-G courses compared to nearly half of White graduates and almost
two-thirds of API graduates
0%
20%
40%
60%
80%
100%
201220001990
API: 64.7%
White: 45.5%
Black: 28.6%Latino: 28.0%
50.0%
33.1%25.4%19.4%
14
Information Matters
One explanation for low Black enrollment to the CSU and the UC is the low completion rate of A-G courses. However, that is not the whole story—even high achieving Black students overwhelmingly elect to attend a two-year college—a phenomenon known as undermatching. In 2010, 23 percent of Blacks who graduated from California’s top-performing high schools (ranked in the top 10 percent of Academic Performance Index scores) enrolled in a California Community College—a rate higher than that of their Asian (19 percent) counterparts.18 This undermatching matters because the more selective university one attends, the more likely that student is to graduate and to graduate on time, even when controlling for the student’s level of college readiness.19 Black students may choose community colleges over four-year schools for valid reasons related to price, proximity, and program choice, but there also are other factors at play. One study found that a critical determinant of undermatching was students’ and parents’ lack of information about differences among various colleges and universities, the admissions process, and financial aid. As a result, students do not apply to more selective universities for which they are eligible.20
Income Matters
Family income also has a significant effect on enrollment in four-year universities. Low-income students face a variety of obstacles such as financial uncertainty, expensive child care, simultaneous part- or full-time employment, and unreliable transportation on their pathway to higher education. Low-income students, regardless of race, are considerably underrepresented at four-year colleges. However, low-income Blacks are still much less likely to attend the most selective universities than low-income White students.21 Research has shown that robust support services such as high-quality financial advising, counseling, and strong academic support have been effective in improving rates of persistence and success among low-income students.22
Parental Education Matters
Parental education is one of the strongest contributors to four-year college enrollment regardless of race or ethnicity. Young adults with at least one parent who attended college are more likely to enroll in four-year universities—even when controlling for income. Low-income Californians between the ages of 18 and 26 with college-educated parents have a 24 percent chance of enrolling in a CSU or similarly ranked four-year university. The probability for those whose parents do not have a bachelor’s degree decreases to 13 percent.23 This correlation has implications for the economic success of future generations and compels us to increase college completion rates now. Helping first-generation youth and their parents access resources and networks to develop valuable college knowledge is critical to increasing rates of college-going and completion in the future.
High-quality financial advising, counseling,
and strong academic support are effective
methods of improving rates of undermatching,
persistence, and college completion
for low-income and underrepresented
students
15
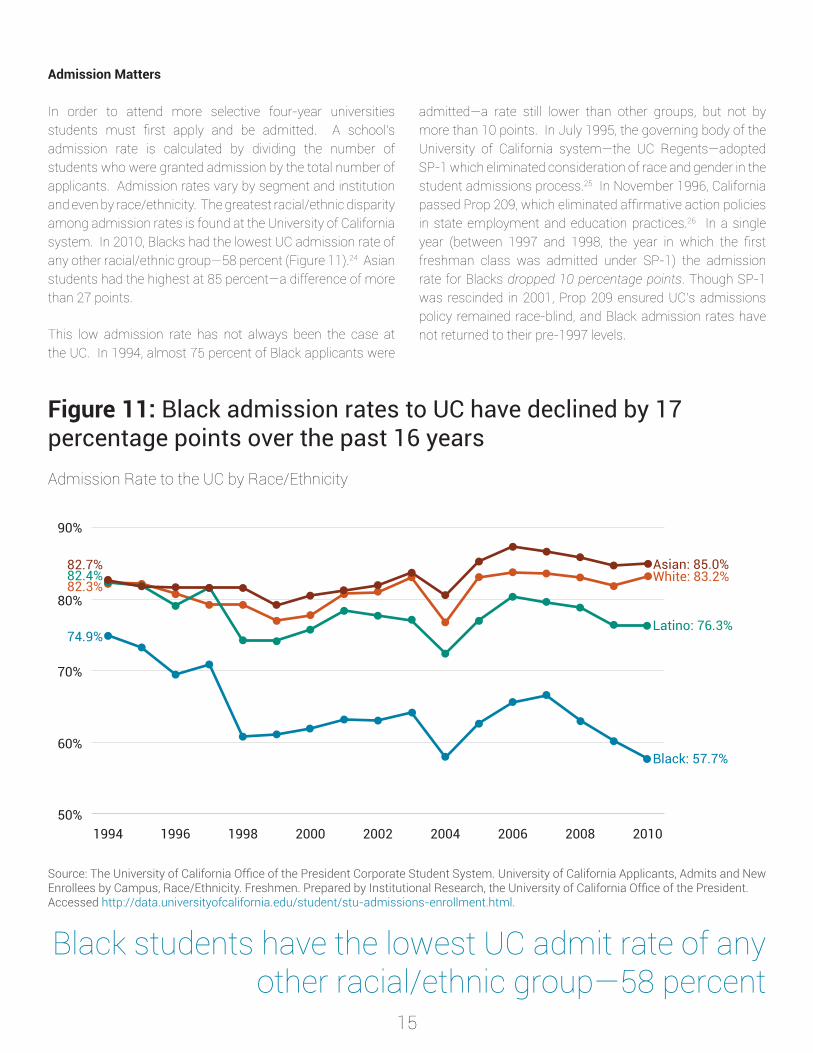
In order to attend more selective four-year universities students must first apply and be admitted. A school’s admission rate is calculated by dividing the number of students who were granted admission by the total number of applicants. Admission rates vary by segment and institution and even by race/ethnicity. The greatest racial/ethnic disparity among admission rates is found at the University of California system. In 2010, Blacks had the lowest UC admission rate of any other racial/ethnic group—58 percent (Figure 11).24 Asian students had the highest at 85 percent—a difference of more than 27 points.
This low admission rate has not always been the case at the UC. In 1994, almost 75 percent of Black applicants were
admitted—a rate still lower than other groups, but not by more than 10 points. In July 1995, the governing body of the University of California system—the UC Regents—adopted SP-1 which eliminated consideration of race and gender in the student admissions process.25 In November 1996, California passed Prop 209, which eliminated affirmative action policies in state employment and education practices.26 In a single year (between 1997 and 1998, the year in which the first freshman class was admitted under SP-1) the admission rate for Blacks dropped 10 percentage points. Though SP-1 was rescinded in 2001, Prop 209 ensured UC’s admissions policy remained race-blind, and Black admission rates have not returned to their pre-1997 levels.
Admission Matters
Figure 11: Black admission rates to UC have declined by 17 percentage points over the past 16 yearsAdmission Rate to the UC by Race/Ethnicity
Source: The University of California Office of the President Corporate Student System. University of California Applicants, Admits and New Enrollees by Campus, Race/Ethnicity. Freshmen. Prepared by Institutional Research, the University of California Office of the President. Accessed http://data.universityofcalifornia.edu/student/stu-admissions-enrollment.html.
Black students have the lowest UC admit rate of any other racial/ethnic group—58 percent
50%
60%
70%
80%
90%
201020082006200420022000199819961994
Asian: 85.0%White: 83.2%
Black: 57.7%
Latino: 76.3%
82.7%
74.9%
82.3%82.4%
16
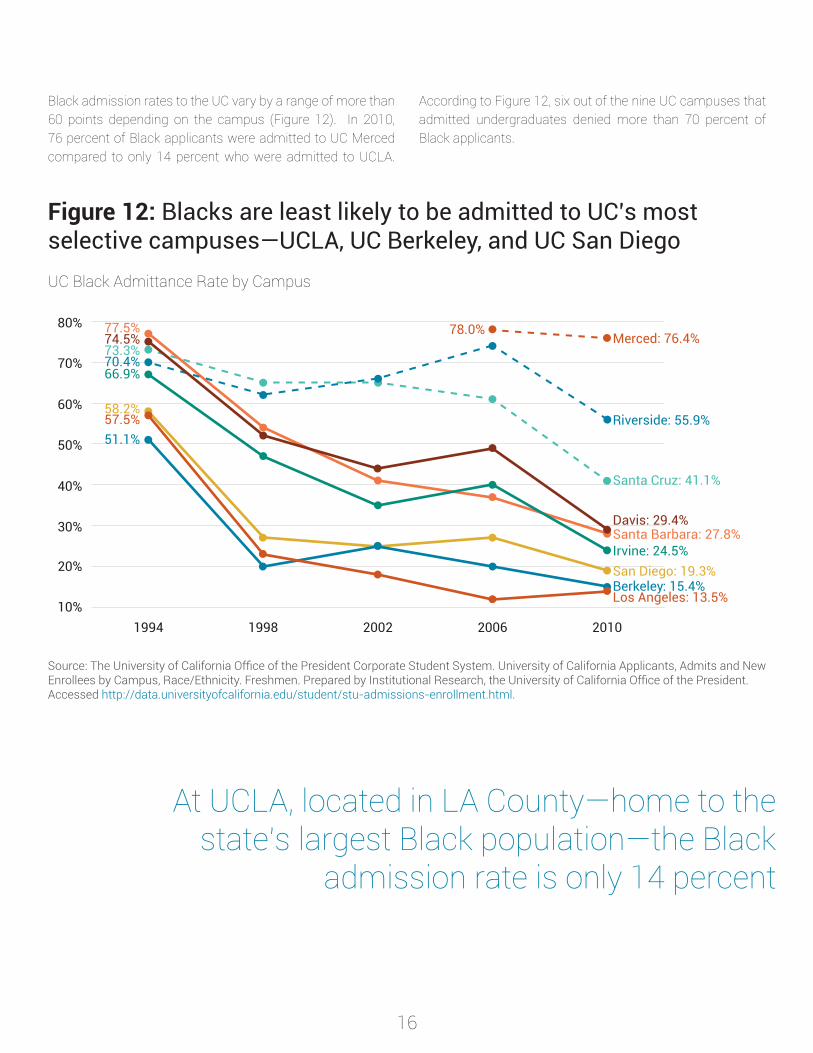
Black admission rates to the UC vary by a range of more than 60 points depending on the campus (Figure 12). In 2010, 76 percent of Black applicants were admitted to UC Merced compared to only 14 percent who were admitted to UCLA.
According to Figure 12, six out of the nine UC campuses that admitted undergraduates denied more than 70 percent of Black applicants.
Figure 12: Blacks are least likely to be admitted to UC’s most selective campuses—UCLA, UC Berkeley, and UC San DiegoUC Black Admittance Rate by Campus
Source: The University of California Office of the President Corporate Student System. University of California Applicants, Admits and New Enrollees by Campus, Race/Ethnicity. Freshmen. Prepared by Institutional Research, the University of California Office of the President. Accessed http://data.universityofcalifornia.edu/student/stu-admissions-enrollment.html.
At UCLA, located in LA County—home to the state’s largest Black population—the Black
admission rate is only 14 percent
10%
20%
30%
40%
50%
60%
70%
80%
20102006200219981994
Merced: 76.4%
Riverside: 55.9%
Santa Cruz: 41.1%
Davis: 29.4%Santa Barbara: 27.8%Irvine: 24.5%San Diego: 19.3%Berkeley: 15.4%Los Angeles: 13.5%
77.5%
70.4%
74.5%73.3%
66.9%
58.2%57.5%51.1%
78.0%
17
For California to meet the growing demands for a more educated workforce, both college-going and completion rates must significantly improve. To achieve this goal in our diverse state, all groups must have greater opportunity and access to improve their educational attainment. This change will provide greater mobility of Blacks into the middle class resulting in improved economic security, the results of which significantly impacts California’s cities with large populations of Blacks. Improved educational outcomes provide the state of California with a significant return on investment in terms of tax revenue from higher earnings and money saved from social services and incarceration costs.27 College completion rates for Black students are unacceptably low.
Black students have the lowest completion rates across all three segments of public higher education
Stuck in Pre-College Level Work
The number of students across the country requiring some level of remediation in math or English is staggering. Data reported by the CSU system to Complete College America found that nearly 60 percent of first-time freshmen entering the CSU enrolled in pre-college level courses. Black freshmen entering the CSU have the highest rates of pre-college level enrollment at 83 percent compared to 41 percent of Whites.28
In the California Community Colleges, 85 percent of incoming students are assessed to be unprepared for college-level math and 70 percent unprepared for college-level English.29 Studies have found that Blacks are more likely to be placed into, and required to complete, pre-college level courses before enrolling in collegiate-level courses.30 The large population of Blacks in community colleges, coupled with overrepresentation in pre-college level courses, spells trouble because research shows that only one out of five students in pre-college level courses ever complete a vocational certificate, associate degree, or transfers to a four-year university within six years of starting at a community college.31
Access To College Is Not Enough Not enough Black students complete college
Only one out of five students in pre-college level courses ever complete a vocational certificate, associate degree, or transfers to a four-year university within six years of starting at a community college
18
California Community Colleges
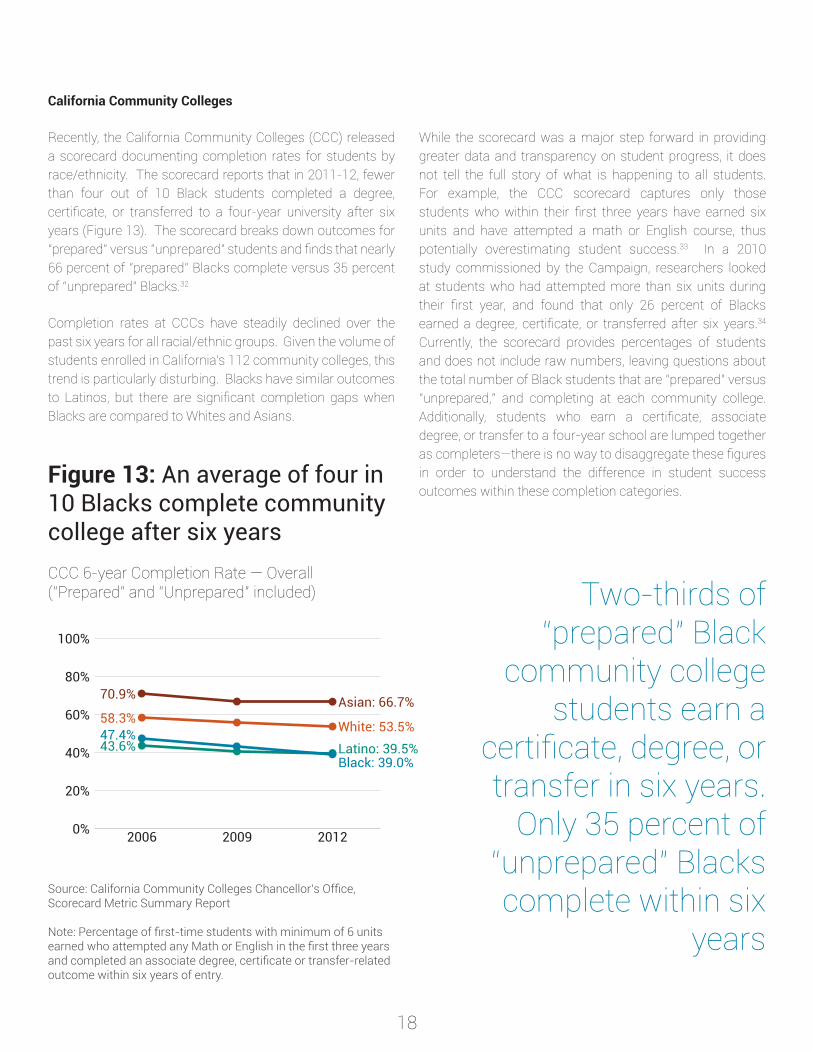
Recently, the California Community Colleges (CCC) released a scorecard documenting completion rates for students by race/ethnicity. The scorecard reports that in 2011-12, fewer than four out of 10 Black students completed a degree, certificate, or transferred to a four-year university after six years (Figure 13). The scorecard breaks down outcomes for “prepared” versus “unprepared” students and finds that nearly 66 percent of “prepared” Blacks complete versus 35 percent of “unprepared” Blacks.32
Completion rates at CCCs have steadily declined over the past six years for all racial/ethnic groups. Given the volume of students enrolled in California’s 112 community colleges, this trend is particularly disturbing. Blacks have similar outcomes to Latinos, but there are significant completion gaps when Blacks are compared to Whites and Asians.
While the scorecard was a major step forward in providing greater data and transparency on student progress, it does not tell the full story of what is happening to all students. For example, the CCC scorecard captures only those students who within their first three years have earned six units and have attempted a math or English course, thus potentially overestimating student success.33 In a 2010 study commissioned by the Campaign, researchers looked at students who had attempted more than six units during their first year, and found that only 26 percent of Blacks earned a degree, certificate, or transferred after six years.34 Currently, the scorecard provides percentages of students and does not include raw numbers, leaving questions about the total number of Black students that are “prepared” versus “unprepared,” and completing at each community college. Additionally, students who earn a certificate, associate degree, or transfer to a four-year school are lumped together as completers—there is no way to disaggregate these figures in order to understand the difference in student success outcomes within these completion categories.
Two-thirds of “prepared” Black
community college students earn a
certificate, degree, or transfer in six years.
Only 35 percent of “unprepared” Blacks complete within six
years
Figure 13: An average of four in 10 Blacks complete community college after six yearsCCC 6-year Completion Rate — Overall(“Prepared” and “Unprepared” included)
Source: California Community Colleges Chancellor’s Office, Scorecard Metric Summary Report
Note: Percentage of first-time students with minimum of 6 units earned who attempted any Math or English in the first three years and completed an associate degree, certificate or transfer-related outcome within six years of entry.
0%
20%
40%
60%
80%
100%
201220092006
Asian: 66.7%
White: 53.5%
Black: 39.0%Latino: 39.5%
70.9%
58.3%47.4%43.6%
19
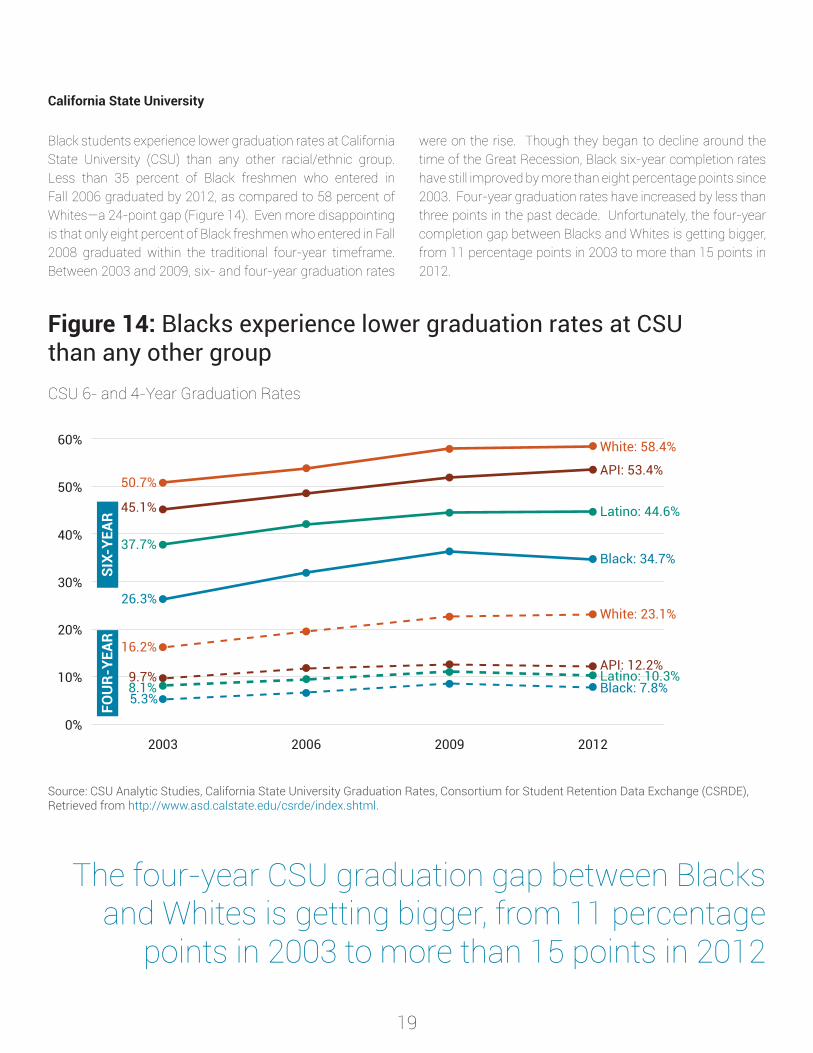
Black students experience lower graduation rates at California State University (CSU) than any other racial/ethnic group. Less than 35 percent of Black freshmen who entered in Fall 2006 graduated by 2012, as compared to 58 percent of Whites—a 24-point gap (Figure 14). Even more disappointing is that only eight percent of Black freshmen who entered in Fall 2008 graduated within the traditional four-year timeframe. Between 2003 and 2009, six- and four-year graduation rates
were on the rise. Though they began to decline around the time of the Great Recession, Black six-year completion rates have still improved by more than eight percentage points since 2003. Four-year graduation rates have increased by less than three points in the past decade. Unfortunately, the four-year completion gap between Blacks and Whites is getting bigger, from 11 percentage points in 2003 to more than 15 points in 2012.
California State University
Figure 14: Blacks experience lower graduation rates at CSU than any other groupCSU 6- and 4-Year Graduation Rates
Source: CSU Analytic Studies, California State University Graduation Rates, Consortium for Student Retention Data Exchange (CSRDE), Retrieved from http://www.asd.calstate.edu/csrde/index.shtml.
The four-year CSU graduation gap between Blacks and Whites is getting bigger, from 11 percentage
points in 2003 to more than 15 points in 2012
0%
10%
20%
30%
40%
50%
60%
2012200920062003
API: 53.4%
White: 58.4%
Black: 34.7%
Latino: 44.6%
White: 23.1%
Black: 7.8%Latino: 10.3%API: 12.2%
50.7%
45.1%
37.7%
26.3%
16.2%
9.7%8.1%5.3%
FOU
R-YE
ARSI
X-YE
AR
20
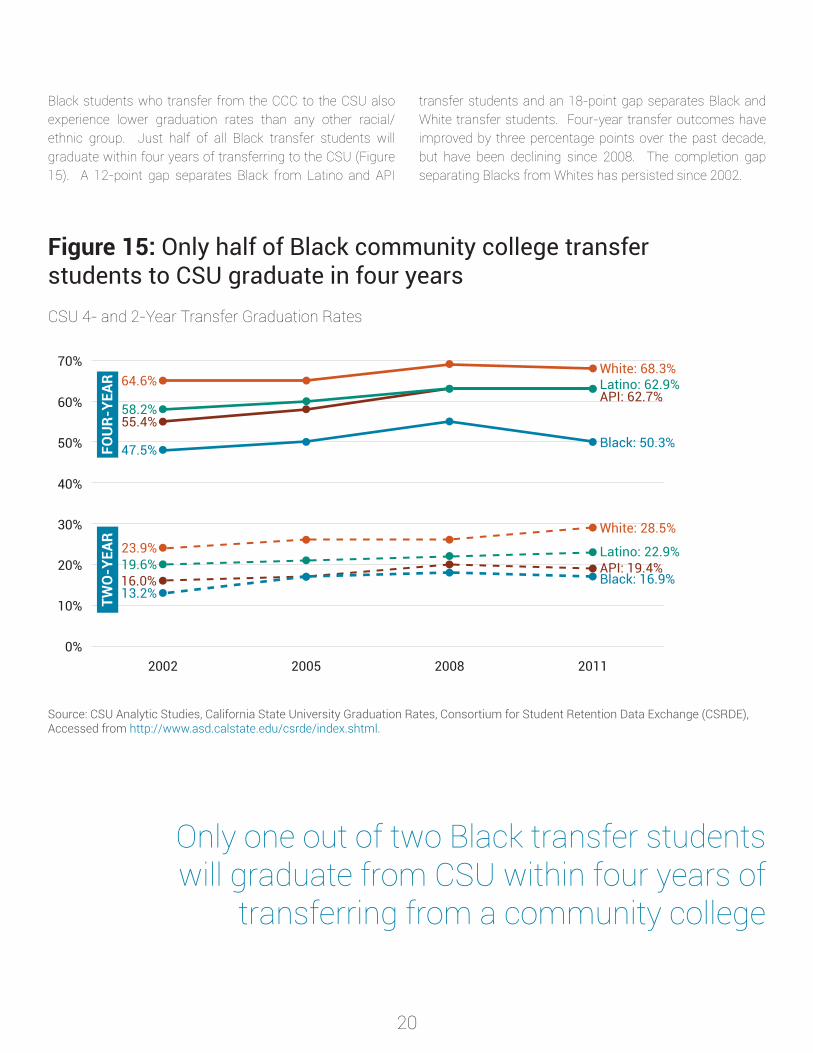
Black students who transfer from the CCC to the CSU also experience lower graduation rates than any other racial/ethnic group. Just half of all Black transfer students will graduate within four years of transferring to the CSU (Figure 15). A 12-point gap separates Black from Latino and API
transfer students and an 18-point gap separates Black and White transfer students. Four-year transfer outcomes have improved by three percentage points over the past decade, but have been declining since 2008. The completion gap separating Blacks from Whites has persisted since 2002.
Figure 15: Only half of Black community college transfer students to CSU graduate in four yearsCSU 4- and 2-Year Transfer Graduation Rates
Source: CSU Analytic Studies, California State University Graduation Rates, Consortium for Student Retention Data Exchange (CSRDE), Accessed from http://www.asd.calstate.edu/csrde/index.shtml.
Only one out of two Black transfer students will graduate from CSU within four years of
transferring from a community college
0%
10%
20%
30%
40%
50%
60%
70%
2011200820052002
API: 62.7%
White: 68.3%
Black: 50.3%
Latino: 62.9%
White: 28.5%
Black: 16.9%
Latino: 22.9%API: 19.4%
64.6%
58.2%55.4%
47.5%
23.9%19.6%16.0%13.2%
FOU
R-YE
ARTW
O-Y
EAR
21
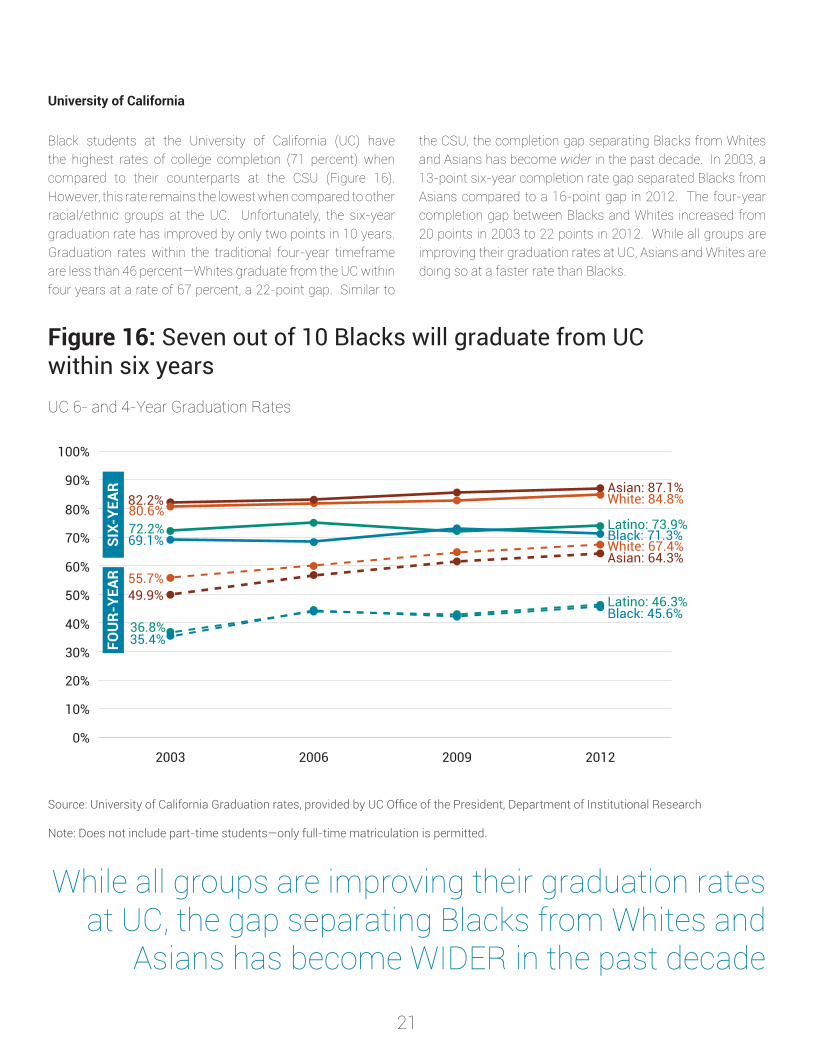
Black students at the University of California (UC) have the highest rates of college completion (71 percent) when compared to their counterparts at the CSU (Figure 16). However, this rate remains the lowest when compared to other racial/ethnic groups at the UC. Unfortunately, the six-year graduation rate has improved by only two points in 10 years. Graduation rates within the traditional four-year timeframe are less than 46 percent—Whites graduate from the UC within four years at a rate of 67 percent, a 22-point gap. Similar to
the CSU, the completion gap separating Blacks from Whites and Asians has become wider in the past decade. In 2003, a 13-point six-year completion rate gap separated Blacks from Asians compared to a 16-point gap in 2012. The four-year completion gap between Blacks and Whites increased from 20 points in 2003 to 22 points in 2012. While all groups are improving their graduation rates at UC, Asians and Whites are doing so at a faster rate than Blacks.
University of California
Figure 16: Seven out of 10 Blacks will graduate from UC within six yearsUC 6- and 4-Year Graduation Rates
Source: University of California Graduation rates, provided by UC Office of the President, Department of Institutional Research
Note: Does not include part-time students—only full-time matriculation is permitted.
While all groups are improving their graduation rates at UC, the gap separating Blacks from Whites and
Asians has become WIDER in the past decade
0%
10%
20%
30%
40%
50%
60%
70%
80%
90%
100%
2012200920062003
Asian: 87.1%White: 84.8%
Black: 71.3%Latino: 73.9%White: 67.4%
Black: 45.6%Latino: 46.3%
Asian: 64.3%
82.2%80.6%72.2%
55.7%49.9%
36.8%
FOU
R-YE
ARSI
X-YE
AR
69.1%
35.4%
22
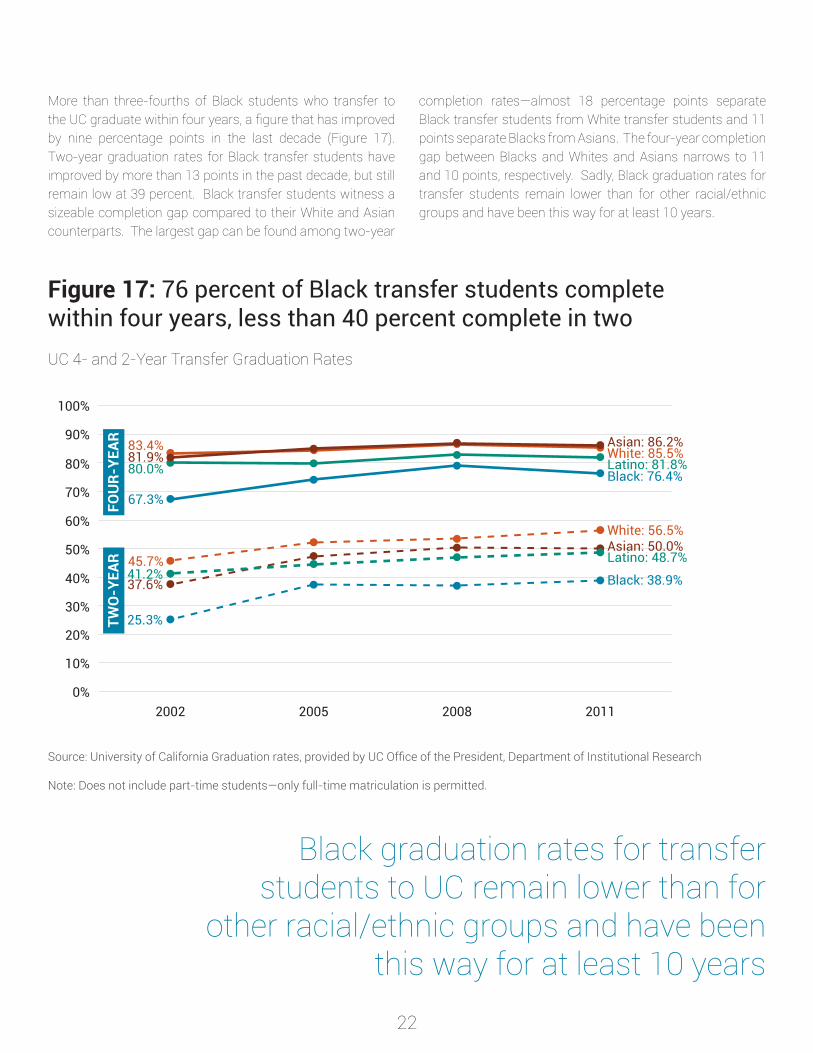
More than three-fourths of Black students who transfer to the UC graduate within four years, a figure that has improved by nine percentage points in the last decade (Figure 17). Two-year graduation rates for Black transfer students have improved by more than 13 points in the past decade, but still remain low at 39 percent. Black transfer students witness a sizeable completion gap compared to their White and Asian counterparts. The largest gap can be found among two-year
completion rates—almost 18 percentage points separate Black transfer students from White transfer students and 11 points separate Blacks from Asians. The four-year completion gap between Blacks and Whites and Asians narrows to 11 and 10 points, respectively. Sadly, Black graduation rates for transfer students remain lower than for other racial/ethnic groups and have been this way for at least 10 years.
Figure 17: 76 percent of Black transfer students complete within four years, less than 40 percent complete in twoUC 4- and 2-Year Transfer Graduation Rates
Source: University of California Graduation rates, provided by UC Office of the President, Department of Institutional Research
Note: Does not include part-time students—only full-time matriculation is permitted.
Black graduation rates for transfer students to UC remain lower than for
other racial/ethnic groups and have been this way for at least 10 years
0%
10%
20%
30%
40%
50%
60%
70%
80%
90%
100%
2011200820052002
Asian: 86.2%White: 85.5%
Black: 76.4%Latino: 81.8%
FOU
R-YE
AR
White: 56.5%
Black: 38.9%
Latino: 48.7%Asian: 50.0%
83.4%81.9%80.0%
67.3%
45.7%41.2%37.6%
25.3%TWO
-YEA
R
23
ConculsionThe persistent opportunity gap
The disparity in college degree completion among ethnic groups in California is clear. As this report shows, that gap is well-documented and persistent for Blacks in higher education. By all measures, it is unacceptable.
The data also suggests the lack of any coordinated, sustained effort to correct these inequities over the past decade or more. Many trend lines in Black higher education have been flat or show only marginal improvements since the 1990s. In some key measures—such as acceptance into the UC system and CCC college completion—they have been in decline. Without a comprehensive plan to encourage, support, and fund greater higher education participation and success, particularly among Blacks, we will continue to see the same results—which is a disservice to all Californians.
Change in policy is critical and can produce startlingly rapid results, both positively and negatively. The Black college-going population in California appears to be especially impacted by changes in public higher education policy and budget decisions. As demonstrated in the report, Black students experienced significant drops in college enrollment after the elimination of affirmative action in 1996, and another large decrease in enrollment during the state budget cuts of 2008–2011, especially at the CSU. While all students were impacted by these policy and budget changes, Black students were affected the most.
The recommendations in this report provide actions that California education officials, along with students and their families, can take starting now that can help close this education gap.
In addition to developing a comprehensive statewide higher education plan that would have long-range impacts, the plan must also be highly defined, action-oriented, and informed by research.
We need to give our students and their families more college knowledge about how to prepare for college, find the right one, and learn about enrollment and college completion. And we must ensure that all eligible students apply for and receive federal and California student aid for which they qualify.
Students need additional support services, especially financial, to help them stay in college and complete a degree. For Blacks who are going to college, the data shows that too many are not completing degrees. Our colleges and universities should re-engage former college students who are near completion to encourage and incentivize them to re-enroll and complete their degree.
Our colleges and universities need to be incentivized and held accountable for increasing the graduation and completion rates of underrepresented students. New funding mechanisms could reward institutions for efforts to support students through to degree completion and to close educational attainment gaps between groups.
Without a concerted, focused approach by our high school and college leaders to prepare, engage, and support underrepresented students, the state will fall short of producing the educated workforce it needs. There may be a cost for some of these recommendations, but the bigger cost facing California and key regions like Los Angeles, will be higher if a significant increase in the number of college-educated residents does not happen.
Recommendations
California education officials, along with students and their families, can take action—starting now—that will close this education gap and get our workforce growing in the right direction. The Campaign for College Opportunity offers the following recommendations:
1. Create a statewide plan for higher education;
2. Expand college knowledge;
3. Invest in services students need to succeed;
4. Fund colleges for both enrollment and success;
5. Strengthen financial support options for students; and
6. Encourage colleges and universities to reach out and re-enroll students who are close to completing a degree.
24
Sources
FIGURE 5California Community Colleges Chancellor’s Office, Annual/Term Student Count Report, Fall 2012 Accessed from CCC Data Mart http://datamart.cccco.edu/Students/Student_Term_Annual_Count.aspx.CSU Analytic Studies. Enrollment by Campus and Ethnic Group, Fall 2012, Table 1, Accessed from http://www.calstate.edu/as/stat_reports/2012-2013/feth01.htm.UC Accountability report. (2013). Racial/ethnic distribution of students, University wide and by campus, Fall 2012. Accessed http://accountability.universityofcalifornia.edu/index/8.1.1.Data provided by Director of Research & Publications from Association of Independent California Colleges and Universities (AICCU)U.S. Department of Education. Institute of Education Sciences, National Center for Education Statistics. (2012). Integrated Postsecondary Education Data System (IPEDS). Fall 2011 Enrollment: Race/ethnicity, gender, attendance status, and level of student (all undergraduates) at for Profits in California (less than 2-year, 2-year, and 4-year).
FIGURE 6California Community Colleges Chancellor’s Office, Student Enrollment Status Summary Report, Fall 2012 Accessed from CCC Data Mart http://datamart.cccco.edu/Students/Enrollment_Status.aspx.CSU Analytic Studies. First-Time Freshman Enrollment by Campus and Ethnicity, Fall 2012, Table 3 Accessed from http://www.calstate.edu/as/stat_reports/2012-2013/fnse03.htm.UC Accountability report. (2013). Racial/ethnic distribution of new undergraduates, Fall 2000 to 2012, Accessed http://accountability.universityofcalifornia.edu/index/8.2.Data provided by Director of Research & Publications from Association of Independent California Colleges and Universities (AICCU)U.S. Department of Education. Institute of Education Sciences, National Center for Education Statistics. (2011). Integrated Postsecondary Education Data System (IPEDS). First-time, full-time freshmen at For Profits in California (less than 2-year, 2-year, and 4-year) in Fall 2011.
FIGURE 7California Community Colleges Chancellor’s Office, Annual/Term Student Count Report, Fall 2012 Accessed from CCC Data Mart http://datamart.cccco.edu/Students/Student_Term_Annual_Count.aspx.CSU Analytic Studies. Enrollment by Campus and Ethnic Group, Fall 2012, Table 1, Accessed from http://www.calstate.edu/as/stat_reports/2012-2013/feth01.htm.UC Accountability report. (2013). Racial/ethnic distribution of students, University wide and by campus, Fall 2012. Accessed http://accountability.universityofcalifornia.edu/index/8.1.1.Data provided by Director of Research & Publications from Association of Independent California Colleges and Universities (AICCU)U.S. Department of Education. Institute of Education Sciences, National Center for Education Statistics. (2012). Integrated Postsecondary Education Data System (IPEDS). Fall 2011 Enrollment: Race/ethnicity, gender, attendance status, and level of student (all undergraduates) at for Profits in California (less than 2-year, 2-year, and 4-year).
25
Endnotes
1 Baldassare, Mark, Dean Bonner, Sonja Petek, and Jui Shrestha. (2011). PPIC Statewide Survey: Californians and Higher Education. Public Policy Institute of California. San Francisco, CA. Retrieved from http://www.ppic.org/main/publication.asp?i=999.2 U.S. Census Bureau, 2012 American Community Survey, 1-year estimates, S0201: Selected Population Profile in the United States, Black or African American alone, not Hispanic or Latino.3 Ibid.4 Institute for Higher Education Policy. (2012). A New Classification Scheme for For-profit Institutions. Washington, D.C. Retrieved from http://www.ihep.org/assets/files/publications/a-f/(Report)_For-Profits_Classification_July_2012.pdf.5 Author’s calculations from first-time freshman enrollment data collected for fall 2011 from the California State University Analytic Studies Department, the University of California Office of the President, and the National Center for Education Statistics via the Integrated Postsecondary Education Data System (IPEDS).6 Hing, Julianne. (July 17, 2012). Here’s How Students of Color Fit into Higher Ed’s Shifting Ecosystem. Colorlines. Retrieved from http://colorlines.com/archives/2012/07/the_shifting_higher_education_ecosystem_and_how_students_of_color_fit.html.7 Institute for Higher Education Policy. (2012). A New Classification Scheme for For-profit Institutions. Washington, D.C. Retrieved from http://www.ihep.org/assets/files/publications/a-f/(Report)_For-Profits_Classification_July_2012.pdf.8 Ibid.9 Johnson, Hans, Marisol Cuellar Mejia and David Ezekiel. (2013). Student Debt and the Value of a College Degree. Public Policy Institute of California. San Francisco, CA. Retrieved from http://www.ppic.org/content/pubs/report/R_613HJR.pdf.10 Ibid.11 Ibid.12 Ibid.13 Eaton, Charlie and Brian Stewart. (2013). Wall Street and California’s Student Debt Crisis. Center on Culture, Organizations and Politics at the Institute for Research on Labor and Employment at the University of California at Berkeley. Retrieved from http://www.irle.berkeley.edu/culture/papers/wall_street_ca_student_debt_crisis.pdf.14 Johnson, Hans. (2012). Defunding Higher Education: What are the effects on college enrollment? Public Policy Institute of California. San Francisco, CA. Retrieved from http://www.ppic.org/main/publication.asp?i=988.15 Author’s calculations from California Department of Education, the California State University Analytic Studies Department, and the University of California Office of the President.16 Data from the California Department of Education, 12th Grade Graduates Completing all Courses Required for U.C. and/or C.S.U. Entrance from 1993/1994 – 2011/2012 via DataQuest.17 1990 data from California Postsecondary Education Commission, First-Time Students at Public Institutions/College Going Counts by race/ethnicity; 2000 & 2012 data from California Department of Education. 12th grade Graduates Completing all Courses Required for UC/CSU Entrance, all students. Retrieved from http://data1.cde.ca.gov/dataquest/.18 Malcom-Piqueux, Lindsey. (2013). Addressing Latino Outcomes at California’s Hispanic-Serving Institutions: Latino and Latino High School Graduates are Disproportionately Enrolled in Community Colleges. USC Tomas Rivera Policy Institute. Los Angeles, CA. Retrieved from http://trpi.uscmediacurator.com/cc-enrollment/.19 Carnevale, Anthony and Jeff Strohl. (2013). Separate and Unequal: How Higher Education Reinforces the Intergenerational Reproduction of White Racial Privilege. Georgetown University – Center on Education and Workforce. Washington, D.C. Retrieved from http://www9.georgetown.edu/grad/gppi/hpi/cew/pdfs/Separate&Unequal.FR.pdf.20 Dillon, Eleanor and Jeffrey Smith. (2013). The Determinants of Mismatch Between Students and Colleges. Working paper 19286 Retrieved from http://www.nber.org/papers/w19286.21 Reardon, Sean F., Baker, Rachel, and Klasik, Daniel. (2012). Race, income, and enrollment patterns in highly selective colleges 1982-2004. Center for Education Policy Analysis, Stanford University. Retrieved from http://cepa.stanford.edu/content/race-income-and-enrollment-patterns-highly-selective-colleges-1982-2004.22 Solorzano, Daniel, Amanda Datnow, Vicki Park, and Tara Watford. (2013). Pathways to Postsecondary Success: Maximizing opportunities for youth in poverty. UC ACCORD. Retrieved from http://pathways.gseis.ucla.edu/publications/PathwaysReport.pdf.
26
23 Terriquez, Veronica and Sandra Florian. (2013). Socioeconomic Inequalities in the Postsecondary Enrollment, Employment, and Civic Engagement of California’s Youth (Policy Report No. 8). UCLA All Campus Consortium on Research for Diversity (UC/ACCORD) – Pathways to Postsecondary Success initiative. Retrieved from http://pathways.gseis.ucla.edu/publications/2013_07SocioeconomicPR.pdf24 The University of California Office of the President Corporate Student System. University of California Applicants, Admits and New Enrollees by Campus, Race/Ethnicity. Freshmen. Prepared by Institutional Research, the University of California Office of the President. Accessed http://data.universityofcalifornia.edu/student/stu-admissions-enrollment.html.25 University of California Office of the President. (May 16, 2001). Question and Answer: SP-1 and SP-2. Meeting Minutes. Retrieved from http://www.ucop.edu/news/access/qasp12.htm.26 California Legislative Analyst Office (November 1996). Proposition 209: Prohibition Against Discrimination or Preferential Treatment by State and Other Public Entities. Retrieved from http://www.lao.ca.gov/ballot/1996/prop209_11_1996.html.27 In 2005 California’s return on investing in higher education was $3.00. Stiles, Jon, Michael Hout, and Henry Brady. (2005). Return on Investment: Educational Choices and Demographic Change in California’s Future. Berkeley, CA. Retrieved http://www.collegecampaign.org/resource-library/our-publications/.28 Complete College America (2011). Higher Education’s Bridge to Nowhere. Washington, D.C. Retrieved from http://www.completecollege.org/docs/California_remediation.pdf.29 California Legislative Analyst’s Office. (2011). Are Entering Freshmen Prepared For College-Level Work? Sacramento, CA. Retrieved from http://www.lao.ca.gov/sections/higher_ed/FAQs/Higher_Education_ Issue_02.pdf.30 Perry, Mary; Matthew Rosin; Kathryn Woodward. (2010). Course-taking patterns, policies, and practices in developmental education in the California Community Colleges. Mountain View, CA. Retrieved from http://www.edsource.org/assets/files/ccstudy/FULL-CC-DevelopmentalCoursetaking.pdf.31 California Budget Project. (2011). Gateway to a Better Future: Creating a Basic Skills System for California. Sacramento, CA. Retrieved from http://www.cbp.org/pdfs/2011/110506_Basic_Skills_Gateway.pdf.
In 2012 the return on investment was calculated at $4.80. Stiles, Jon, Michael Hout, and Henry Brady. (2012). California’s Economic Payoff: Investing in College Access & Completion. Berkeley, CA. Retrieved http://www.collegecampaign.org/resource-library/our-publications/.32 “Prepared” is defined as degree and/or transfer-seeking students whose lowest course attempted in Math and/or English was college level. “Unprepared” is defined as degree and/or transfer-seeking students whose lowest course attempted in Math and/or English was remedial level.33 The scorecard includes students who attempt math and English courses as a proxy for all students who aim to earn a degree and/or transfer to a four-year school. However, the reality is that many students would like to earn a degree or transfer but cannot access these courses in the first place.34 Moore, Colleen and Nancy Shulock. Institute for Higher Education Leadership & Policy. (2010). Divided We Fail: Improving Completion and Closing Racial Gaps in California’s Community Colleges. Sacramento, CA. Retrieved from http://www.collegecampaign.org/resource-library/our-publications/divided-we-fail/.
27
About This Report
The Campaign for College Opportunity conducted this in-depth profile of Blacks and California’s public higher education system in the hopes of illuminating the current demographic, educational attainment, and college participation landscape of this key population. Most importantly, this report recommends actions for improving Black college completion rates through public policy and utilizing a number of strategies.
This is the second report in our new series: The State of Higher Education in California.
Methodology
Data for this report were collected from a variety of sources. Primarily, demographic and social characteristics were collected from the 1990 and 2000 Decennial Census and the American Community Survey (ACS). The ACS, annually published by the U.S. Census Bureau, provides a detailed socioeconomic and demographic profile of the U.S. population. The ACS replaces the “long form” of the Decennial Census; the advantage of the ACS is annual collection, as opposed to collection once every ten years through the Decennial Census. Since 2000, the ACS is conducted nationwide with an annual sample of 3 million households. Data indicators are based on the 2011 and 2012 ACS one-year estimates collected and analyzed through tools provided by the U.S. Census Bureau: Factfinder and DataFerrett using Public Use Microdata Sample (PUMS) data sets. Data for Hispanic/Latino includes those of any race. Data for White, Asian Pacific Islander, and Black/African American excludes persons of Hispanic origin and multiple races. In some cases data for Asians is reported and in other cases, Asian Pacific Islander. This reflects the difference in data provided by the different segments.
Data was also collected through the Integrated Postsecondary Education Data System (IPED) database, available at the National Center for Education Statistics (NCES) website, the California Postsecondary Education Commission (CPEC), the California Department of Education (CDE), the California Community Colleges Chancellor’s Office, the California State University Division of Analytic Studies, the University of California’s Office of the President, and the Association of Independent California Colleges and Universities (AICCU).
Acknowledgments
A special thanks to our principal funders for this project: the Kresge Foundation, the Lumina Foundation, and the Evelyn & Walter Haas Jr. Fund. Their commitment and dedication to increasing opportunity for all Americans in higher education is to be admired. We would also like to thank the additional funders who make our work possible including: the California Education Policy Fund, the College Access Foundation of California, and the California Wellness Foundation.
The Campaign is grateful to the members of our Senior Faculty Advisory Body for providing valuable expertise and feedback as this report was being drafted: Estela Mara Bensimon (University of Southern California), Darla M. Cooper (The RP Group), Michelle A. Cooper (Institute for Higher Education Policy), Robert Gabriner (San Francisco State University), Carrie Hahnel (The Education Trust-West), Hans Johnson (Public Policy Institute of California), John Rogers (University of California, Los Angeles), Nancy Shulock (Institute for Higher Education and Leadership Policy), William G. Tierney (University of Southern California), and Jane V. Wellman (National Association of System Heads). Affiliation is provided for identification purposes only.
Nadia Valliani, Research and Policy Analyst with the Campaign for College Opportunity, was the principal researcher and author of this report, with significant contributions from Michele Siqueiros and Audrey Dow.
28
About The Campaign for College Opportunity
The Campaign for College Opportunity is a broad-based, bipartisan coalition, including business, education and labor leaders that is dedicated to ensuring the next generation of Californians has the opportunity to go to college and succeed. The Campaign works to create an environment of change and lead the state toward effective policy solutions. It is focused upon substantially increasing the number of students attending two- and four-year colleges in California so that we can produce the one million additional college graduates that our state needs.
For more information, visit: www.collegecampaign.org.
Board of Directors
David Wolf (Chair) Campaign for College Opportunity Co-Founder
Thomas A. Saenz (Vice Chair) President & General Counsel, Mexican American Legal Defense and Educational Fund (MALDEF)
Marcus A. Allen Partner, Englander Knabe & Allen
George Boggs Superintendent-President Emeritus, Palomar College; President & CEO Emeritus, American Association of Community Colleges
Camila Chavez Executive Director Dolores Huerta Foundation
Pamela H. David Executive Director, Walter & Elise Haas Fund
Gary K. Hart Former California Secretary of Education & State Senator
Bill Hauck Senior Advisor, Goddard Claussen/West Trustee, California State University
William G. McGinnis Trustee Butte-Glenn Community College District
Rory O’Sullivan Policy and Research Director Young Invincibles
Eloy Ortiz Oakley Superintendent-President Long Beach City College
Darline Robles Professor of Clinical Education USC Rossier School of Education
Frederick R. Ruiz Co-Founder & Chairman Emeritus, Ruiz Food Products; Regent, University of California
Lisa A. Smith Managing Director, Loop Capital Markets
Like our first report, The State of Latinos in Higher Education in California, we dedicate this publication to Steve Weiner, co-founder of the Campaign for College Opportunity, who passed away in April 2013. Steve loved California and understood the transformational power of education for individuals, especially low-income students and students of color. He knew that the promise of college opportunity had to be kept, not only to ensure better opportunities for those who benefited from earning a college degree, but to ensure the very economic and social security of our state. Steve’s vision for a better California is with us every single day.
Los Angeles Office714 W. Olympic Boulevard, Suite 745Los Angeles, CA 90015Tel: 213.744.9434Fax: 800.207.3560Executive Director: Michele Siqueiros
Sacramento Office1512 14th StreetSacramento, CA 95814Tel: 916.443.1681Fax: 916.443.1682Associate Director: Jessie Ryan
www.facebook.com/collegecampaign www.twitter.com/CollegeOpp
www.collegecampaign.org
Ensuring that the next generation has the opportunity to go to college, and that California produces an additional 2.3
million college graduates by 2025
and succeed