Embed Size (px)
Citation preview

The SustainableProperty AppraisalProject
The SustainableProperty AppraisalProject

property appraisal tools to assess building worth Developingin accordance with the triple bottom line. This is a collaborativeresearch programme combining the expertise and resources ofindustry, academe and the Government to apply principles ofsustainability in property investment practice.
The Sustainable Property Appraisal Projectby Louise Ellison and Sarah Sayce
SS(1236)B-SustainPAP08AW2 2/4/07 10:17 Page 1

Copyright © Kingston University 2006Published by Kingston UniversityISBN 0-9554744-0-XPrinted and bound in Great Britain by K&N Press
SS(1236)B-SustainPAP08AW2 2/4/07 10:17 Page 2
33
Acknowledgments
1 Introduction 5
2 Defining Sustainability 6
3 Sustainability Criteria for Commercial Property 8
4 Assessing Sustainability within the existing Commercial Property Stock 9
4.1 Applying the Future-Proofing Property Questionnaire 9
5 Linking Sustainability to Property Worth 11
5.1 Rental growth 115.2 Depreciation 115.3 Cashflow 125.4 Duration to sale 125.5 Duration to let 135.6 Summary 13
6 The Sustainability Appraisal Tool Parameters – estimating the impacton property worth variables 14
6.1 Energy efficiency 146.1.1 Estimating an impact on worth 146.1.2 Significance across property type 156.1.3 Additional drivers for energy efficiency 166.2 Climate control 166.2.1 Significance across property type 166.2.2 Estimating an impact on worth 166.3 Pollutants 176.3.1 Estimating an impact on worth 176.3.2 Significance of pollutants across property type 186.4 Adaptability 186.4.1 Significance of adaptability across property type 186.4.2 Estimating an impact on worth 196.5 Waste management 206.5.1 Significance across property type 206.5.2 Estimating an impact on worth 206.6 Water management 216.6.1 Significance across property type 216.6.2 Estimating an impact on worth 216.7 Accessibility 216.7.1 Impact across property type 226.7.2 Estimating an impact on worth 226.8 Contextual fit 246.9 Occupier 24
7 Applying the Sustainable Property Appraisal Tool 25
8 Conclusion 26
Appendices 27
References 37
Contents
SS(1236)B-SustainPAP08AW2 2/4/07 10:17 Page 3
This project has benefited from the support and expertise of a committedgroup of highly experienced and informed individuals, forming a WorkingGroup to whom the research team at Kingston University is particularlyindebted. It also benefited from the valuable input and advice of aconstructive and well informed Advisory Group. It is the generosity of suchindividuals and the organisations they work for that enabled the researchteam to ensure the outputs of this project reflect the sustainability agendawhilst remaining directly relevant to the property industry.
The Working GroupPaul McNamara PruPIMPhilip Parnell Drivers JonasIan Cullen IPDDavid Russell Universities Superannuation SchemeCharles Follows Investment Property ForumSally Uren Forum for the FutureAnna McCrea Davis Langdon Consulting (Representing DTI)
The Advisory GroupFrancis Salway (Chairman) Land SecuritiesDavid Stathers Boots Properties PlcMartin Hunt Forum for the FutureJulie Hirigoyen UpstreamEmma Griffiths Casella Group
The Research TeamSarah Sayce Kingston University School of SurveyingLouise Ellison Kingston University School of SurveyingJudy Smith Kingston University School of Surveying
The research team would also like to thank the following individuals andcompanies for their valuable contribution to this work:
Robert Baldwin King SturgeRichard Bartholomew Boots Properties PlcHelen Beckett Grosvenor GroupVernon Blunt Royal Sun AllianceMarcus Boret AkelerRupert de Barr Drivers JonasPhilip Clark Morley Fund ManagementMartin Francis Atis RealDavid Glinski Prudential PlcAnna Govier Johnson ControlsGraham Harvey Jones Lang La SalleChristoper Headley OPDPhilip Lowe PruPIMEdward Mackiness Prudential PlcRichard Moss CluttonsChris Perkins PruPIMGeoff Robotham Borders BooksSunil Shah Johnson ControlsRobert Sutton CBRETim Townsend Knight FrankHilary Unsworth Johnson ControlsPhilip Walker CBREHenry Watkinson Royal London Asset ManagementMikola Wilson Teesland Plc
This work was made possible by the generous financial support of the DTIthrough the Partners in Innovation scheme, PruPIM, Investment PropertyForum Education Trust and Boots Properties Plc.
Acknowledgments
SS(1236)B-SustainPAP08AW2 2/4/07 10:17 Page 4
5
The aim of the Sustainable Property AppraisalProject is to provide property investors andoccupiers with a system for reflecting sustainabilitywithin the appraisal of commercial property assets.The lack of such a system has contributed to therelatively slow response the property investmentindustry has made to the sustainability agenda incomparison with other investment sectors. Withno means to measure sustainability within thecommercial property stock or identify potentialimpact on property worth, the market has beenunable to discern a clear business case to generatedemand for property with positive sustainabilitycharacteristics. Whilst awareness of the significanceof the issue has increased amongst both occupiersand investors, information has not been availableto support the translation of that awareness intopolicy and practice.
The research has addressed this problem by askinghow those issues, commonly bundled together todescribe sustainability, are likely to impact on thefunctions of commercial property that contribute toproperty worth. The rationale for taking thisapproach is that it provides a means of engagingthe property investors with sustainability, in termsclearly relevant to their overriding business objective.Making the risks attached to unsustainable propertymore transparent provides a mechanism for:a) generating investor demand for more
sustainable property, andb) improving less sustainable property within
investment portfolios.
This report presents the outputs of the research.These constitute the first steps achieved in providinginvestors and occupiers with the means to generatequantifiable information on sustainability withinexisting commercial property assets and linking thisto the potential it has to impact on property worth.
The following tools have been developed that enablean assessment of a property’s sustainability to bereflected within an appraisal of its worth:• the Future-Proofing Property questionnaire,• the Sustainable Property Appraisal Tool,• a pilot framework and sample for a Sustainable
Property Investment Index.
The report sets out the terms of referenceadopted for the research, the methodologicalapproach taken to the development of theSustainable Property Appraisal Tool and thetheory and assumptions supporting the processof quantifying the sustainability criteria1. Eachelement is open to challenge and debate and thewhole is presented as a starting point from whichthe property industry can develop a practicalresponse to the sustainability agenda.
1 Introduction
1 Three further working papers are available
giving more detail on the developmental
stages of the research and outputs.
These can be downloaded from
www.sustainableproperty.ac.uk.
SS(1236)B-SustainPAP08AW2 2/4/07 10:17 Page 5
6
The triple bottom line approach to definingsustainability was adopted from the outset of thiswork and is reflected within all the outputs. Whilstit is acknowledged that this is only one of themany definitions of sustainability that have beendeveloped, it was considered the most appropriatefor this work and for the current market context.It enables the economic sustainability that isfundamental to property investment to remain atthe forefront of the appraisal process, whilst theenvironmental and social issues are linked in. Thishas enabled the research to bring sustainabilityissues to the centre of the property appraisalprocess by making a quantifiable connectionbetween sustainability and property worth. As theeconomic context changes and environmentalconcerns perhaps increase, the balance ofsignificance between the three elements willchange. However, a definition that acknowledgesthe role of economic sustainability enables thepolicy, regulatory and market responses that willhelp to address environmental and other problems,to be explicitly reflected in the economic drivers ofthe business response.
Three major components form the key buildingblocks in reflecting sustainability in property worth: a) a set of sustainability criteria that link the
functionality of commercial property with itsenvironmental and social impacts;
b) a system that measures property against thosecriteria;
c) a set of parameters that link performance underthose criteria through to a calculation ofproperty worth.
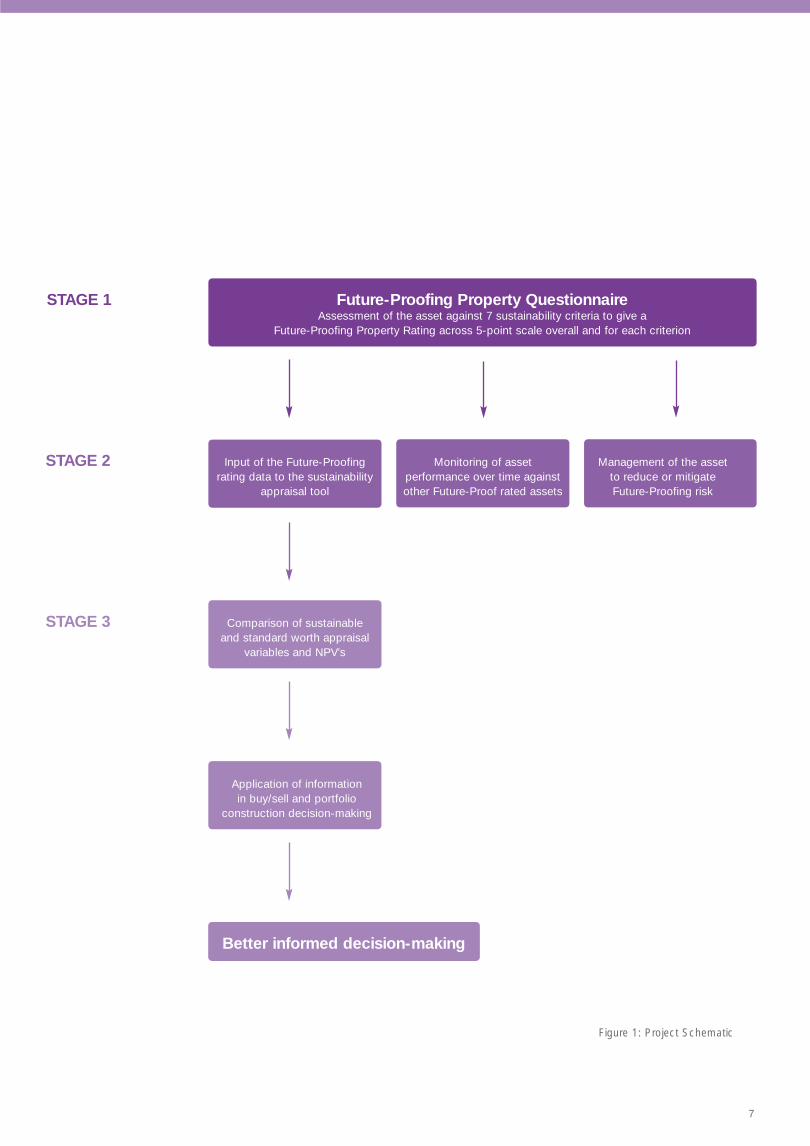
These three components are reflected through thethree stages of the sustainable property appraisalprocess: • measurement of a property’s performance against
the sustainability criteria using the Future-ProofingProperty Questionnaire;
• reflection of that measured performance withinthe appraisal process through the SustainableProperty Appraisal Tool;
• inclusion of the information this produces in theinvestment decision-making process (see Figure 1).
Application of the Future-Proofing PropertyQuestionnaire over whole portfolios over time willallow tracking of investment performance againstsustainability performance. Linking this data toIPD investment performance data will enable thedevelopment of a sustainable property investmentindex.
2 Defining Sustainability
SS(1236)B-SustainPAP08AW2 2/4/07 10:18 Page 6
7
STAGE 1
STAGE 2
STAGE 3
Figure 1: Project Schematic
Future-Proofing Property QuestionnaireAssessment of the asset against 7 sustainability criteria to give a
Future-Proofing Property Rating across 5-point scale overall and for each criterion
Input of the Future-Proofingrating data to the sustainability
appraisal tool
Monitoring of assetperformance over time againstother Future-Proof rated assets
Management of the asset to reduce or mitigate Future-Proofing risk
Comparison of sustainableand standard worth appraisal
variables and NPV’s
Application of informationin buy/sell and portfolio
construction decision-making
Better informed decision-making
SS(1236)B-SustainPAP08AW2 2/4/07 10:18 Page 7
8
3 Sustainability Criteria for Commercial Property
In establishing criteria for assessing thesustainability of commercial property, a set ofbasic characteristics were identified as a keyrequirement (Sayce and Ellison 2003a,b): • simplicity: they should be easy to understand,
transparent and accountable;• scope: they should cover economic,
environmental and social issues and overlap aslittle as possible;
• validity: they should have scientific or analyticalvalidity, including capacity to respond to change;
• robustness: they should be unambiguous andindependent of assumptions;
• focus: they should be limited in number;• relevance: they should relate to a reasonable
time horizon and to relevant spatial area;• availability: they should be readily available from
existing data collection system;• functionality: they should clearly link sustainability
with the primary functions of commercial property.
Having reviewed the wide range of existing indicatorsets available and consulted with environmentalspecialists and the occupier and investorcommunities, the following nine indicators wereselected as the most appropriate sustainabilitycriteria for the project:• energy efficiency,• pollution,• waste management,• water management,• climate control,• accessibility,• adaptability,• occupier,• contextual fit.
Common ground is shared between thesustainability agenda and property investmentperformance in assessing commercial propertyunder some of these criteria, such as energyefficiency and water consumption. Other criteriaare counter-intuitive to sustainability when viewedfrom the investor perspective; accessibility by carfor example. Accessibility of location underpinseconomic sustainability for property and in thecontext of current transport availability, accessibilityby car is often key to this.
Investment and sustainability performance is likelyto be enhanced by good public transport accessand local green travel plans in addition to caraccess, but, with the exception of some city-centrelocations, car access normally underpins occupierdemand and the economic viability of the asset.By adopting the triple bottom line, economic aswell as environmental and social impacts are takeninto account. This enables the sustainability criteriato be linked via an impact on the functionalperformance of the property through to performanceas an investment asset and hence to property worth.
The Sustainable Property Appraisal Tool and theFuture-Proofing Property Questionnaire that supportsit, attempt to make a realistic assessment of thesustainability of a property based on seven of thesenine criteria. Through the course of the research ithas not been possible to identify a quantifiable linkbetween the occupier and contextual fit criteriaand investment property worth. These are thereforeidentified as relevant and worthy of further research,but are not incorporated in either the Future-ProofingProperty Questionnaire or the Sustainable PropertyAppraisal Tool.
SS(1236)B-SustainPAP08AW2 2/4/07 10:18 Page 8
9
4 Assessing Sustainability within the existing Commercial Property Stock
4.1 Applying the Future-ProofingProperty Questionnaire
The selected sustainability criteria have beendeveloped within the research as a means ofassessing the sustainability of any existingcommercial property. This assessment ispremised on two points:a) that all commercial property can be rated in
terms of its ability to perform as an asset underthe changing demands generated by thesustainability agenda;
b) that from the investor perspective, only issuesspecific to the property and within the investor’srealistic control are relevant.
By assessing a property in this way, it is possibleto separate the assessment of the physical assetfrom any assessment of the behaviour of theoccupier, which the investor can not control.Once the sustainability assessment is focused onphysical characteristics, it is possible to ‘audit’ forthem; does the property have energy efficientlighting? If it does not, it is likely the investor willhave to install this over the next 5–10 years, andif it is not installed, the higher operational energycosts will strengthen a potential new occupier’snegotiating position on rent.
The Future-Proofing Property Questionnaire usesa series of similar questions to assess a property’ssustainability. It has been developed with theparticular objective of providing a useableassessment tool for the commercial propertymarket. The aim is to enable the bulk of thecommercial stock to be assessed. To do this thequestionnaire has to be capable of beingadministered quickly and cheaply by someonewith a managerial connection with a large numberof properties, for example a fund manager ormanaging agent. This crucially provides access tothe majority of commercial property held ininstitutional investment portfolios.
These requirements gave rise to the questionnaireneeding specific characteristics. It had to be:• short;• appropriate to a range of property types with
minimum change in format;
• capable of completion by someone with aworking knowledge of the property but withoutengineering or building surveying expertise;
• capable of generating sufficient relevant data tomake a useful assessment possible;
• capable of generating information useful to theportfolio manager and investor;
• easy to analyse;• capable of being linked to industry standard
investment performance measurement data.
Many valuable assessment tools are available, buttheir take-up has not penetrated the commercialproperty market very deeply. Not having beendeveloped for the investment sector they oftenincorporate occupier issues over which the investorhas no influence, or focus heavily on environmentalissues which do not reveal a complete picture ofcommercial property sustainability and can generateanomalous results in terms of investment worth.Usability is also often a major hurdle. Whilst morecomplex, sophisticated tools can give more detailedinformation, they are time consuming and oftenexpensive to complete. This provides a majordisincentive to them being adopted en masse bythe market. Unless assessments are made on asubstantially increased scale, sustainability willcontinue to fail to be addressed within thecommercial property stock.
Whilst these assessment tools are important, forthe purposes of a wide-scale assessment to bedriven by the investment sector, a less complexand more focused series of questions was required.
The Future-Proofing Property Questionnaire2
developed here consists of four questions thatidentify the property sector and type, followed bya series of tick-boxes under each of the sevensustainability criteria. Completion generates anoverall numerical score and qualitative label,supported by a further score and label under eachof the seven criteria. The scoring system thatunderpins it is specific to each sector and eachproperty type. This approach enables the impactof each sustainability criteria to be tailored fordifferent property sectors and for a range ofdifferent property types within each sector. Thisproduces a fully-flexible weighted scoring system.This can also be updated as the sustainabilityagenda changes over time.
2 The Future-Proofing Property
Questionnaire is included in full at
Appendix A.
SS(1236)B-SustainPAP08AW2 2/4/07 10:18 Page 9
10
The numerical scores that underpin thequestionnaire generate the qualitative labels foreach property. These are included for ease ofanalysis and cross referencing of performance withinand across portfolios. The scoring is based onconsultation and experimentation carried out duringthe course of the project. As the questionnaire ismore broadly piloted and analysed it is anticipatedthe scores will be updated. Inevitably as thesustainability agenda changes and as property isupdated the scores will have to be updated toreflect this.
The qualitative labels range across a five point scale:• very poor performers,• poor performers,• typical performers,• good performers,• very good performers.
Extensive piloting has demonstrated that thequestionnaire is capable of completion in 2–3minutes by a managing agent or fund managerwith a working knowledge of a portfolio. So farover 100 properties have been assessed,generating a database that can be analysed toshow performance overall and under eachcriterion. This can be used to identify differentlevels of sustainability performance across a seriesof portfolios, areas of weakness or strength in aparticular portfolio, or to identify properties thatrepresent a particular risk.
The Future-Proofing Property Questionnaire formsStage 1 of the Sustainable Property Appraisal Tool, and as a stand-alone tool also forms thefoundation of the framework for a pilot sustainableproperty index. As the number and range ofproperties assessed using the system increases, a useful measure of investment performance willbe developed.
The questionnaire will be made available for fundmanagers to use on the basis that anonymousdata on future-proofing performance will be suppliedback to the project team along with a referencenumber linked to IPD (where properties areincluded within the IPD Portfolio). This will enablerefinement of the tool and the generation of datafor the further development of the SustainableProperty Index. Over time, cross-examination offuture-proofing characteristics against investment
performance will provide valuable information fordecision-making.
The second function of the Future-Proofing PropertyQuestionnaire is its role within the SustainableProperty Appraisal Tool. It is on the basis of thenumerical scores generated by the questionnairethat the appraisal tool makes small changes to thevariables within the calculation of worth, enablingthe appraisal to explicitly reflect sustainability. Thenext section of this report sets out this processand the methodology whereby this research hasattempted for the first time to make an explicit andquantifiable link between sustainability andcommercial property investment worth.
SS(1236)B-SustainPAP08AW2 2/4/07 10:18 Page 10
11
The sustainability criteria are anticipated asimpacting on property worth through five mainavenues: • rental growth,• depreciation,• cashflow,• duration to let; and• duration to sale.
Within the investment appraisal process these factorswill impact on the cashflow or discount rate variables.
5.1 Rental growth
The parameters developed for rental growthassume a direct relationship between rent andoccupier costs; any increase in occupier costs willreduce the amount available for rent. Whilst this isa simplification of the bidding process and thecharacteristics that determine rent, it is essentiallytrue. Market factors dictate the rental level, butbusiness productivity ultimately dictates theoccupier's ability to pay. Basing the rental growthparameters on this premise suggests the impactwill be anywhere between a maximum of £1 andminimum of £0 reduction in rental growth for each£1 increase in costs. Transforming a change inoccupier costs into a percentage of current rentalvalue enables an adjustment to be made to therental growth figure (see Example 1 below).
This example assumes the impact on rentalgrowth is 100% of the increase in cost. Howeverthis may not be the case. Whilst occupier costsare likely to impact on rent, the true effect is likelyto be less than this given that costs in addition torent and rates are held as less significant byoccupiers (Gibson, 2001). This can be reflectedwithin the model by scaling down the impact onrental growth through a multiplier.
5 Linking Sustainability to Property Worth
Using Example 1 below, if the impact was estimatedas being closer to 25% of the increase in cost, theresultant impact on rental growth would be morelike .06% or a 6 basis points reduction.
Whatever view is taken, the potential impact onrental growth is a prediction and subject to theinaccuracies of any prediction. It is also thereforelikely to differ from investor to investor. The modeldeveloped here enables the user of the Tool to setthe parameter at whatever level of impact theyconsider most appropriate.
5.2 Depreciation
Rental depreciation is commonly used byappraisers to reflect refurbishment costs. It hastherefore been selected as the most appropriateconduit for reflecting any increase in refurbishmentcosts attributable to retro-fitting to a standardcompliant with stronger sustainability principles.The parameters set for adjusting the depreciationallowance are based on the increased costattached to refurbishing to such standards.
Depreciation is controlled through capital expenditureon refurbishment and upgrade. Research by IPDand Reading University (Baume et al. 2004) hasidentified the level of annual capital expenditureon a range of property types, as a proportion ofcapital value. It can be argued that an appraisalof a property that scores poorly in terms ofsustainability under criteria that can be addressedthrough refitting, for example climate control andwaste management, should reflect this bydepreciating the rent at a rate that allows for theadditional capital cost required to bring the propertyup to a higher sustainability standard. To do thisrequires some understanding of the additional cost(if any) this would require.
Example 1
Current Rent: £300 m2
Current Cost (energy for example): £15/m2 or 5% rent Predicted increase: 50%New cost: £22.50/m2 or 7.5% rentPotential rental growth reduction: 2.5% amortized over 10 years, say .247% per annum.
SS(1236)B-SustainPAP08AW2 2/4/07 10:18 Page 11
12
Research on refurbishment costs suggests thatrefurbishing to sustainability standards can generatea cost uplift of between 3% and 10%, (DavisLangdon and Everest and Mott Green Wall, 2003)although it must be noted that research in thisarea is scant. Recent research on cost increasesto achieve a higher BREEAM rating in a new-build(as opposed to retro-fitting) suggest a cost upliftof 7% to raise a typically located air conditionedoffice building from a pass to an excellent rating(BRE/Cyrill Sweet, 2005). The cost impact on anaturally ventilated office building is less at 3.4%,again in a typical location. The most up-to-dateresearch therefore gives some indication of theextra cost incurred for achieving highersustainability standards for new-build, but notretro-fitting, which tends to cost more. The figuresprovide a useful baseline, to which some upliftmust be added to allow for the extra cost ofretro-fitting. Working them through intodepreciation requires translating the uplift into anincrease in the annual capital expenditureestimate, which can then be annualised as apercentage of the rent. (See Example 2 below).
5.3 Cashflow
In some instances a sustainability factor mayimpact directly through the cashflow. This willnormally be due to a requirement for a one off orseries of cash payments to insure against ormitigate a potential risk. Where this is the case,assuming the cost can be accurately estimated, afigure can simply be deducted from the cashflowat the appropriate point.
5.4 Duration to sale
As awareness of sustainability factors rises withinthe property investment and occupier communities,properties that perform poorly under specificsustainability criteria may take longer to sell thanbetter performing assets within their class. Recentresearch has identified the median transactionperiod for commercial investment property to be190 days or approximately 6 months, although it isemphasised that there are significant variations tothis figure (Investment Property Forum, 2004). Thisresearch identified property-specific factors capableof delaying the sale of an asset but that are solvableover time, giving examples such as title problemsor disputes with tenants. This type of problem wouldlead to the price achievable in the market being“significantly below the perception of market valuewith the problem solved” (ibid:7) which woulddelay any transaction, thus extending the durationto sale until either market value catches up withperceived value or the problem has been resolved.
Poor performance under sustainability criteria wouldclearly fit into this category of ‘solvable problem’.The financial impact would be a function of the costof resolving the problem (i.e. improving performanceunder the sustainability criteria) and the opportunitycost of the return foregone for the period of theextended duration to sale. The latter woulddepend on whether the motivation for sale was:a) pressure to generate cash in which case an
alternative asset may have had to be sold, orb) because the asset does not conform to target
portfolio holdings in which case the targetedimprovement in portfolio performance would beforegone for a limited period. (ibid:25)
Example 2
According to recent IPD/Reading research (Baum et al 2004), offices in the south east of England incurrental depreciation of 0.7% p.a. and capital expenditure at a rate of 0.7% of capital value per annum.To refurbish to sustainability standards required to achieve an excellent BREEAM rating, the 0.7%capital expenditure will increase by anything between 3% and 7% for a new building. Allowing anincrease to reflect the extra cost of retro-fitting, the uplift could be conservatively estimated at between4% and 10% depending on the property type.
SS(1236)B-SustainPAP08AW2 2/4/07 10:18 Page 12

13
Focusing on the period up to final price agreement,the period most likely to be extended in thesecases, the IPF research again found wide variationin the data but approximately 60% of their sampletook up to 100 days (approximately 3 months) toachieve final price agreement. This gives a baseline from which any extension to the sale periodcould be calculated.
The potential for the transaction period to beextended as a result of a low sustainability ratingshould logically be reflected in the risk premiumfor the property. It is a specific risk and will reducethe present value of the capital sum eventuallyreceived by an amount equivalent to the appropriatediscount rate and time period of the delay. However,making an estimate of the possible extension ofduration to sale that might be attributable tosustainability factors would be extremely difficult,particularly once market conditions are taken intoaccount. For this reason the methodology is setout here as something that requires furtherinvestigation and analysis. It is not adopted withinthe model.
5.5 Duration to let
As sustainability issues become more high profile,property with a low sustainability rating is likely tobecome more difficult to let. This will increase thevoid period at lease end. Where a standardapproach may be to allow a 6-month void at leaseend, limited sustainability may increase this eitherby forcing early refurbishment or by reducing themarket for the property.
The issue is made more complex by the widevariation in terms and conditions negotiated ontaking a lease. For example agents within the Cityoffice market may be offering rent free periods ofup to 12 months in a slow market, reducing toperhaps 3 months in a more buoyant one.
However, it could be argued that, whatever themarket, a low sustainability rating will increase thevoid period at the end of the lease, beyond whatthe market is currently suggesting. If the currentvoid is 12 months, a property with a lowsustainability rating might be expected to take 15months to let by comparison to others in themarket. It is difficult to know whether this is the
case until market awareness of sustainabilityfactors increases and it is not possible tocalculate the potential impact on property worth,as yet. Consequently this variable is set out here ina similar way to ‘duration to sale’; it is likely thatsustainability characteristics will impact onproperty worth through duration to let, but furtherresearch is necessary for a clear methodology formodelling that impact to emerge.
5.6 Summary
These are the five conduits through whichsustainability is identified as potentially impactingon property worth. However, the difficulties setout above with regard to duration to sale andduration to let have led to attention being focusedon depreciation, rental growth and cashflow asthe main conduits for impact. The SustainableProperty Appraisal Tool uses these three variablesto estimate the impact of sustainabilitycharacteristics on property worth.
The discussion that follows explores eachsustainability criterion individually, identifyingappropriate, quantifiable links through to propertyworth. These are then translated into figures,which have been incorporated within theSustainable Property Appraisal Tool as a firstattempt to quantify the impact of sustainability onproperty worth.
SS(1236)B-SustainPAP08AW2 2/4/07 10:18 Page 13
14
6.1 Energy efficiency
Being concerned with future income and outgoingsrather than past matters, this work focuses onoperational energy efficiency and not embodied3
energy. Operational energy efficiency impacts onthe running costs of a property and therefore,potentially, on occupier demand. Indeed substantialresearch has been carried out in the USA to establishthe financial benefits of low energy property (see forexample USGBC 2003, The David and LucillePackard Foundation, 2002b).
However, the UK property market operatessignificantly differently from most others in that:a) the income accruing to the property investor
(owner) is not directly affected by the property’srunning costs4; and
b) rental levels and energy costs tend to be suchthat the latter form a very small proportion oftotal property costs, reducing the tenant’sincentive to reduce energy consumption5.
Thus the business case for energy efficient propertyhas so far been extremely hard to make in the UKand incentives for investing in energy efficientmanagement systems and plant and machineryscant. Recent work by the Association of EnergyConservation supports this view (Association forthe Conservation of Energy, 2004).
Where there has been investment in energy efficiencyit has largely been voluntary and as part of a rangeof measures seeking to achieve corporate socialresponsibility objectives rather than direct financialones. As such the development of properties toenergy efficient specification has been largelyconfined to the owner-occupier sector (Laing, 2003).
However this low energy-cost environment ischanging. Oil prices have risen some 30% sincethe beginning of 2004. Gas prices are also risingand the trend appears unlikely to change. Whilstthe oil price rise is due more to market uncertaintythan shortages of supply, this currently shows littlesign of abating and will exacerbate the impact ofthe 2/3 increase in demand for oil predictedbetween now and 2030 (Deloitte Research, 2004).
Such an increase in demand prompts anexamination of the supply infrastructure, both locallyand internationally. There is already evidence of the
local supply infrastructure in parts of London beingstretched to capacity and little in the way of strategyto increase capacity (Coull, 2004). In terms of theinternational supply infrastructure, research impliescurrent uncertainty over supply may well continueand worsen over the next 30–40 years (DeloitteResearch, 2004).
The cost reductions achieved through deregulationof the energy supply markets are likely to shift tocost increases as the economic reality of thesupply/demand equation takes effect. The impactwill be exacerbated if the markets continue toreflect an unstable political-economic context forthe energy supply industry.
As energy prices rise and awareness of thecontribution of property to CO2 emissions grows,it is anticipated that the operational energy efficiencyof a property will be increasingly significant tooccupiers and, ultimately, investor demand. This mayput pressure on owners to upgrade and retro-fitless energy efficient property to maintain demand.Changes to Building Regulations and the anticipatedintroduction of the EU Directive on Energy Efficiencyin Buildings (Commission of the EuropeanCommunities, 2002, ENDS 2004) are both leadingthe property market towards more energy efficientstandards. Over time, the investment performanceof less efficient property is expected to worsenunless and until it is upgraded.
6.1.1 Estimating an impact on worth
As an established element of occupier costs energyefficiency is reflected within the Sustainability PropertyAppraisal Tool through rental growth. This requiresthe basic assumption that an additional £x spent onoutgoings will translate into £x less available for rent.Taking this assumption as a starting point it is thena simple exercise to calculate the potential changein ability to pay rent that would flow from anincrease in energy costs. (See Example 3 overleaf).
Table 1 overleaf summarises estimated energy costs.It has to be treated with some caution given thevariability in rental levels and limited data availableon energy usage. Operational demand for energywill be higher per square metre within some sectors.For example retailing, and in particular food retail,has substantially higher operational energyestimates per square metre than other sectors.
6 The Sustainability Appraisal Tool Parameters – estimating the impact on
property worth variables
3 Embodied energy is that used in the
construction of the property. i.e. materials,
transportation of materials and
construction processes etc...4 It is accepted that prospective tenants are
wary of high service charges and other
outgoings, but the impact on the investor
flows through the tenants willingness to
pay rent rather than directly as would be
the case were outgoings netted off the
rental income. This inevitably reduces the
impact on rental income and thus the
investor’s concern with the operational
efficiency of the property.5 Research by the Energy Efficiency Best
Practice Programme identifies savings of
£6.50/m2 as achievable by improving
air-conditioned premium space from
typical energy use to good practice
(Action Energy, 2003).
SS(1236)B-SustainPAP08AW2 2/4/07 10:18 Page 14
15
Statistics published by Movement for Innovationbenchmark operational energy consumption forthe worst performing retail property at 320kgCO2/m2
(850 kgCO2/m2 for food retail) as opposed to 250kgCO2/m2 for offices (M4I, 2000).
6.1.2 Significance across propertytype
As the biggest user of energy within the usersanalysed here, the retail sector is clearly mostsensitive to price change. However, it is importantto note that the high variability in rental levelsclouds the issue. Whereas an average figure of 8%is supported by evidence from a retail portfolio of62 stores, this average hides a variation from <1%to 12% in different store types within that oneportfolio. Nonetheless, a substantial increase inenergy costs will affect all property types. Example3 uses an office building to set out how risingenergy costs are expected to affect rental growth.(See Example 3).
The issue of energy efficiency is fast moving.Better and more plentiful energy data will becomeavailable on individual buildings as the requirementfor energy certification takes effect. This willeventually generate data on a property byproperty basis and the Sustainable PropertyAppraisal Tool has been designed to incorporatethis. Forecasts of energy prices will change andinvestors using the Tool will make their owndecisions based on the available data and theirestimate of how significantly that is likely to impacton rental negotiations. The Tool is designed to
Table 1: Estimated Energy Costs (Source: Action Energy 2003, DTI, 2004, JLL Office OSCAR, 2004)
6 Based on observation of one corporate
portfolio of 60 outlets of varying sizes.
Figures for individual units vary
significantly. Energy use data for retail
property is scant.
Property type Typical energy use kwh/m2 p.a. Energy costs/m2
Office A/C prime 580 £16.50Office A/C standard 400 £11.50Office – naturally ventilated, open plan 230 £6.50Office – naturally ventilated cellular 210 £5.00Industrial <5000m2 (heating only) 96 £2.88 (electricity)
- £1.30 (gas)- £1.92 (oil)
Industrial>5000m2 (heating only) 92 £2.76 (electricity)- £1.24 (gas)- £1.84 (oil)
Retail (non food) - 8% 6
enable users to reflect these decisions andestimates within the parameterization process.
In essence, however, the more energy efficient thebuilding, the smaller the impact any increase inenergy costs on rental growth will be, and viceversa. Property that is efficient in terms ofoperational energy use is clearly a lower risk forboth investor and occupier, particularly where theenergy requirements of the occupier are high.
Example 3
• Prime office building with air-conditioning• Energy costs per square metre:
£16.50 (assumed)• Current estimated market rent per square
metre: £350.00• Energy costs as proportion of rent: 4.7%
Assuming a 100% increase in energy costs overthe next 5 years energy costs will increase by afurther 4.7% of current market rent.
Increased cost amortised over 10 years: 0.46% per annum.
Based on a 1:1 ratio between rental growth andenergy costs, rental growth would be reducedby 0.46% per annum.
Assuming a less significant relationship, thereduction in rental growth could be reduced bysay 50% to 0.23% per annum.
SS(1236)B-SustainPAP08AW2 2/4/07 10:18 Page 15
16
6.1.3 Additional drivers for energyefficiency
Having addressed energy efficiency as a basiccost issue it is also important to explore it from thecorporate responsibility (CR) perspective. Thetrend for CR reporting is making business energyconsumption more high profile, it is one of theitems regularly reported and for which targets canbe set (see for example Boots, Prudential, USSEnvironmental Accounts). This implies that propertyconsuming a higher than average level of energy inuse will begin to fail to support the owner’s and/oroccupier’s CR policies, particularly as new buildingregulations enforce greater energy efficiency in newand substantially refurbished property. Propertydeveloped or refurbished post enforcement of the2003 Building Regulations is likely to be more energyefficient than that built in preceding years. Likewiseproperty developed and substantially refurbishedpost the 2006 building regulations should again raisethe standard in this area if policy objectives are tobe achieved. The future introduction of energylabelling of commercial buildings will further heightenoccupier and investor awareness and data.
6.2 Climate control
Air-conditioning has a substantial impact in termsof energy use and thus carbon emissions. However,property that is not air-conditioned is likely toaccommodate fewer people and may provide apoorer working environment than property with aneffective climate control system, particularly intown-centre or city-centre locations. Propertywithout air-conditioning may perform better underthe environmental heading within the triple bottomline, but may perform poorly under the socialheading and begin to depreciate more rapidly astenant requirements change, under-performingeconomically. From the property investor andoccupier perspective this renders it lesssustainable over-all. Such properties are likely torequire air-conditioning to be retro-fitted in theshort- to medium-term in order to maintainoccupier demand and investor return.
It is important, however, to differentiate betweendifferent types of air-conditioning system. Oldersystems may be less effective and will be likely tohave a negative impact on operational energy
performance of a property. More modern systemsmay be more energy efficient and conform to currentbest practice standards but not allow sufficientflexibility for using more energy efficient systems oralternative technology as conditions allow.
Some property is fitted with both air-conditioning andmechanical ventilation or passive cooling to enablethe optimum solution to be selected depending onclimate. Some are designed to incorporate moreenergy efficient systems should the owner/occupierwant to install them. To perform well in terms ofsustainability, the climate control system should bemodern and appropriate for the property type, userand location. In some instances this will lead to aproperty with air-conditioning having a highersustainability rating for climate control than onewith only natural ventilation. Whilst this seemscounter-intuitive to sustainability principles, it reflectsthe three elements of the triple bottom line and theeconomic imperative that ultimately drives theproperty market.
6.2.1 Significance across propertytype
Whilst climate control is a requirement in someproperty types and locations, in others it isunnecessary. The Sustainable Property AppraisalTool will adjust for the most appropriate climatecontrol system according to property type andlocation. For example a city centre prime officebuilding has a clear need for climate control, likewisea similarly located shopping centre. If this functionis performed by a modern mechanical ventilationsystem and the building has been designed to allowfor passive cooling when possible, this is likely tobe the optimum solution in the current market. Anout of town property is likely to have less need forclimate control and an air-conditioning system willadd to the operational energy usage unnecessarily,potentially negatively affecting occupier demandover time and speeding up the requirement to refitto a more energy efficient specification.
6.2.2 Estimating an impact on worth
The increased likelihood of retro-fitting being requiredwhere a property under-performs in terms of climatecontrol suggests the depreciation rate should beincreased if it is to be reflected within an appraisalof worth. The extent of the increase in depreciation
SS(1236)B-SustainPAP08AW2 2/4/07 10:18 Page 16
17
7 Sevenoaks District Council v Circular
Facilities, Sevenoaks Magistrates Court,
June 2004.8 With thanks to Kevin Luckett at Ascent
Insurance Brokers for his assistance in
gathering the information in this table.
is based on the increased cost incurred, over andabove that normally accounted for.
6.3 Pollutants
The majority of commercial property enjoys arelatively low risk of creating a pollution incident.Industrial property is clearly most at risk particularlythat occupied by chemicals, metals or wastemanagement businesses. However, environmentalregulation affects all businesses and an investorneeds to be aware of the implications of any riskof a pollution incident.
The risk attached to owning a property that pollutesthe environment has increased in recent years intwo respects:a) The Environment Act 1995 establishes that in
pollution cases where the polluter can not befound or can not pay, responsibility can fall to a“Class B” person. In the case of industrialpremises, for example, this could easily be thelandlord who would find themselves bearing thecosts of clean-up and potential prosecution(Jayne and Skerrat, 2003);
b) the fines related to pollution are increasing. Whilstthe low level of fines is a common criticism ofcurrent pollution prevention policy, the level ofthe fine is normally dictated by the seriousnessof the incident and can in fact be substantial. In2003 companies were ordered to pay fines of£73,000, £98,000, £100,000 and £250,000 fora range of pollution incidents (ENDS, 2004).
Liability for a pollution incident rests on, amongstother things, being deemed to have ‘knowinglypermitted’ the incident. The first court decisionunder current contaminated land legislation7,suggests the courts are giving the term ‘knowinglypermit’ a broad meaning. To be considered tohave ‘knowingly permitted’ contamination of landone must: • have knowledge of the presence of the
contaminants;• power to prevent them from being there; and• the ability and reasonable opportunity to prevent
their presence or remove them (CameronMackenna, 2004, Circular 02/2000).
All of the above could reasonably apply to propertyinvestors rendering them potentially liable for anincident, suggesting the potential for liability hasincreased. A property’s propensity to host a pollutionincident should thus be reflected in a calculation ofits worth. The most effective way of doing this isthrough an assessment of clean-up costs or thecost of risk-transfer i.e. environmental insurance.
6.3.1 Estimating an impact on worth
The increased risk attached to pollution andcontamination combined with stronger legislationand environmental regulation has encouraged thedevelopment of an effective market in environmentalinsurance. The level of insurance premiums on suchpolicies provides a useful means of quantifying theimpact of pollution risk on property worth. It isdifficult to give average figures for such premiums,each property being assessed and underwrittenon its own merits. However, the data in Table 2(below) give some indication of the level of premiumthat might be expected for a site specific 10 yearPollution Legal Liability policy, to cover liabilitiesarising from new or unknown historic conditionsboth on and off-site. (See Figure below).
It must be reiterated that these figures are indicativeonly8. Each property would be assessed separatelyand in certain instances specific conditions will beexcluded from cover. However, the data enablesan estimate to be made of the additional outgoingsnecessary to reduce the risks attached to holdingproperty that performs poorly under the pollutioncriteria, by insuring against it. The different levelsof pollution risk attributable to different propertiesare reflected through the selection of the mostappropriate level of insurance cover, which is thenreflected through the premium. Reducing thecashflow by the amount of the premium over thelife of the cover effectively reflects the impact of
Table 2: Estimated Environmental Insurance Premiums
Risk category Limit of Liability Deductable Premiumof property
Medium £1m £25,000 £50,000–£60,000Medium £5m £25,000 £100,000Medium £10m £25,000 £130,000–£150,000High £10m £50,000–£100,000 £200,000–£250,000
SS(1236)B-SustainPAP08AW2 2/4/07 10:18 Page 17
18
b) adaptability across use – the ease with whicha property can be adapted to support therequirements of a new use type, for example aswitch from commercial to leisure or residential.
Occupier requirements change relativelyfrequently. Retail occupiers change store layouts,manufacturers introduce new technology andproduction systems, office occupiers changeworking styles and practices and all businessesincur fluctuations in staff numbers.
Owners of property that can not easily andeffectively accommodate change will have twooptions:a) to refit the property so that it can, orb) to accept a constrained letting potential and
thus higher risk of voids, relatively rapiddepreciation of the asset and thus reducedinvestment return.
The impact of changing occupier requirements islikely to be exacerbated by:• shorter leases leading to earlier renegotiations
or marketing of the property, and • higher levels of density achieved by new
working practices becoming more widespread.
6.4.1 Significance of adaptabilityacross property type
The Sustainable Property Appraisal Tool onlyreflects adaptability within use in the assessmentand appraisal of offices. The retail sector ischaracterised by frequent, regular refits of shopinteriors, to support a relatively stable operationalactivity. The basic functional requirements of retailunits remain relatively unchanging. The exceptionto this could be the development of show roomstores, particularly for large goods and kitchensfor example, where nothing is actually taken fromthe store itself, purchases being delivered from awarehouse. This changes the functionalrequirements of the store and, to some extent theactivity of the shopper, but not to the extent thatthe physical arrangement of the property will haveto change significantly.
The relatively low unit cost of manufacturing space,along with low worker/space ratios makes adaptabilityof space less of a business driver. Whilst spaceshould be able to accommodate changing business
pollution risk within the investment appraisalprocess. The decision to purchase the insurancethen lies with the investor.
6.3.2 Significance of pollutantsacross property type
Where a site has been developed on contaminatedland, potential liability for future pollution problemsand clean-up costs is likely to impact on the saleof the property particularly where developmentpotential is contributing to value. However, theserisks are now increasingly well understood and inmost cases this could now be mitigated throughinsurance, the cost of insurance thus equating tothe quantifiable impact on worth. This would holdtrue for all property types but insurance may bemore expensive for property perceived to be ahigher risk, for example industrial sites might beexpected to be more expensive to insure thanretail or office property.
For both retail and office property the mainpollution risks on large sites are likely to comefrom underground fuel storage tanks. If a propertyhas these, the risk of pollution is likely to be higherand environmental insurance may be required.Otherwise the main risk of pollution will be throughleaks from air-conditioning systems. The qualityand effectiveness of the air conditioning system isaddressed specifically through the climate controlcriteria, so does not need to be accounted foragain here and can be disregarded for appraisalpurposes at this point.
6.4 Adaptability
Adaptability reflects the potential for a property toadapt to fulfill the changing requirements of theexisting user, a new user or a different type of user.This will in turn reflect the physical constraints ofthe property, i.e. floor plate, construction type, m&e services, user requirements.
The Sustainable Property Appraisal Tool reflectstwo types of adaptability:a) adaptability within use – the extent to which a
property can support the needs of the existingoccupier group or type without requiring majoror frequent refurbishment and upgrading;
SS(1236)B-SustainPAP08AW2 2/4/07 10:18 Page 18
19
requirements lower internal specifications andrelatively simple building design should support this.
The office sector is the most significantly affectedby changing occupier requirements. This sectorincurs high costs for high spec. space that can beexpensive and complicated to retro-fit. Researchsuggests that this sector is experiencing relativelyrapid changes in user requirements as workingpractice innovations are adopted in a bid to makespace more cost effective (Warren, 2003, Vaander Voordt 2004).
The trend appears to be towards higher densitiesin use of office space being achieved through greateruse of flexible working techniques supported bytechnology. Bon et al’s 2003 survey of corporatereal estate practices identifies the incidence ofteleworking policies as increasing from 19% ofrespondents in 1993 to 80% in 2002. Desk sharingpolicies have also increased over this period, althoughincidence remains lower, 46% of organisations inthe survey have a desk sharing policy.
Space that is not easily able to support the variationin working practices now being adopted will besubject to costly refits in order to counteractfunctional obsolescence and maintain occupierdemand. Conversely property that is adaptable willsuffer less functional obsolescence, avoid the refitcosts, maintain better occupier demand and thusdemonstrate better sustainability.
This presents two ways of analysing the impact ofadaptability on worth:a) through the impact on rental growth as more
functional space can accommodate betterdensities;
b) through the extra burden of refits necessary tomaintain occupier demand in less adaptableproperty.
Research has found the majority of UK respondentsoccupying at 10–13 m2/employee (Warren, 2003).BCO currently suggest 14m2/person in their officefit-out guide (BCO, 2000). The highest densitieswere reported on business parks from which theresearch inferred higher efficiencies are beingachieved in the more modern space available atthese sites. The new work styles were found to beenabling density to be increased by as much as12% in the UK.
The financial benefits accruing from such efficiencieswill obviously increase with the level of rent andneed to be offset against the costs ofaccommodating this type of change. Research byVaan der Voordt, (2004) found that at rental levelsof £110/m2 (approximately £70/m2) a 24% reductionin space requirements was necessary to offset thecost of adapting space. However, this drops to 9%at a rental of £330/m2 (approximately £210/m2).Office occupiers paying upwards of £200/m2 foraccommodation and seeking to expand may findnew office organisation to be a more cost-effectivesolution. Space that does not enable them to dothis, or makes it prohibitively expensive will beginto represent poor value for money when comparedwith a more adaptable alternative. If occupiers canachieve 12% higher occupancy levels by adaptingtheir space, property that cannot accommodatethis effectively becomes 12% more expensive thanthe most efficient space, and rental levels for suchspace can be expected to adjust accordingly.
The occupiers most likely to be aware of andaffected by these changes are those with mobile,technology proficient personnel. Warren’s workidentified sales teams as achieving the highestoccupancy densities, which complies with thisanalysis. He also identified private sector businessand services and communications sectors asachieving higher densities than the industrial andpublic sector occupiers. This suggests theexpanding sectors of the UK economy are thosemost likely to be able to take advantage of thespace efficiencies reaped by new workingpractices and office organisation. Office propertythat cannot fulfil these requirements will requireearlier refurbishment and refitting than perhapsinitially anticipated. Where shorter lease structuresare in place the impact on cash flow could besignificant in the short- to medium-term.
6.4.2 Estimating an impact on worth
The upwards-only rent review inevitably protectsthe investor from mid-term negative fluctuationsin rent. However, with average lease lengthscurrently standing at approximately 11 years foroffices, the effect of the changes outlined aboveare already pertinent to investment returns. Officeaccommodation letting at more than £200/m2 willbe expected to be adaptable within the next10–15 years. Any that is not will suffer reduced
SS(1236)B-SustainPAP08AW2 2/4/07 10:18 Page 19
20
management and storage. This is likely to be moresignificant for industrial and manufacturing propertythan office and retail, but might be expected toimpact on rental growth in the long term.
The anticipated introduction of the EU Waste,Electrical and Electronic Directive may impactrapidly on retailers’ requirement for storage facilities,as they become responsible for the end-of-lifesafe disposal of electrical and electronic products(King Sturge, 2004). Property that fails to supportbusinesses in waste management throughinsufficient and/or inaccessible waste storage,minimisation and management facilities will becomeless attractive to some occupiers over time.
In functional terms, property needs to be capableof supporting the occupier’s waste managementpolicy. This will normally require appropriate andaccessible waste storage and management facilities,and a centralised recycling service (either privatelyor municipally run). From the investor perspectivethe extent to which the occupier makes use of suchfacilities is irrelevant (other than perhaps in CR terms).Sustainability of the property is thus assessed on thebasis of the existence of these facilities. Property thatperforms poorly in this area will, over time, becomeless attractive to occupiers, particularly as wastemanagement costs increase. This will have theeffect of increasing the depreciation rate of suchproperty, compared with similar but better servedproperty within its class. Remedying the situationmay require the allocation of space for recyclingstorage potentially reducing the net ‘lettable’ areaof the building and requiring capital expenditure.
6.5.2 Estimating an impact on worth
The extent to which depreciation will change canonly be estimated through the importance of wastemanagement to the occupier group. Wastemanagement is a more significant issue for retailers,particularly in shopping centres than for most officeoccupiers, for example, and this is reflected withinthe parameters of the Sustainable PropertyAppraisal Tool. More data is needed on thesignificance and financial implications of wastemanagement in order for the issue to be reflectedwith greater accuracy within the appraisal. It isanticipated that increased waste regulation andtaxation will focus further attention in this area.
rental levels or require refurbishment if it is tocontinue to compete at that level.
The parameters for adaptability within theSustainable Property Appraisal Tool are based onthis estimate of 12% efficiency gains and impacton any property let at more than £200/m2. TheSustainable Property Appraisal Tool is currentlyset to reflect a maximum change in rental growthof +/-6%, giving 12% across the full range ofperformance. The rent at which the property letswill not fall in nominal terms but some change isanticipated in the rate at which this rent grows. Ifthe property scores particularly well for adaptabilityits rental growth prospects may be better than forthe standard within its class.
This percentage adjustment is then amortised over10 years to give a maximum figure to apply to thenon-adjusted, market rental growth figure. Amultiplier is again applied to reflect the fact thatadaptability of space is less significant in terms ofoccupier requirements than locational and costissues. The impact on rental growth is again unlikelyto be £1:£1 so the figure is reduced to reflect this,the deduction from rental growth being subject toa multiplier of less than 1. It is possible for individualinvestors to adjust this multiplier according to theirown assessment of the potential impact of thecriteria on rental growth.
6.5 Waste management
Increasing regulatory pressure affecting wastemanagement is making waste a significant issue formany businesses. Landfill Tax on active waste iscurrently £18 per tonne and will rise by at least £3per annum until it reaches a ‘medium-to-long-termrate of £35 per tonne’ (HM Treasury, 2004). For manybusinesses this is a significant business cost andhas driven a move to recycling where possible.
6.5.1 Significance across propertytype
The prohibition of co-disposal of hazardous andnon-hazardous waste since August 2004 has alsoraised awareness of waste management as anissue. Waste must now be sorted before it leavesa facility, raising waste management costs andincreasing the space required for waste
SS(1236)B-SustainPAP08AW2 2/4/07 10:18 Page 20
21
9 Accessibility here refers to the ease with
which a property can be reached, as
opposed to ingress, egress and circulation
which is the subject of the Disability
Discrimination Act.
6.6 Water management
The relatively low unit cost of water in the UK,particularly in relation to other property costs, renderswater management a low priority for the majorityof office occupiers when reviewing occupancycosts. Recent figures for air-conditioned offices inthe City of London and West End estimate watercosts as 10p per square foot per annum (JonesLang LaSalle, 2004). Corporate Responsibility (CR)policies are consequently a much more significantdriver for water management facilities than cost atthe present time within the UK. This is manifestingitself through increasing interest in equipmentdesigned to reduce consumption, such as spraytaps, and the use of grey water and harvestedrainwater, particularly for maintenance oflandscaped areas.
6.6.1 Significance across property type
Being driven by CR policies makes watermanagement important for occupiers who publishCR reports and use their CR credentials withintheir marketing strategies. The types of propertymost likely to require water management systemsare consequently those likely to be owned oroccupied by these types of organisation: primeoffice buildings and major retail centres for example.Standard office buildings and smaller retail centresare still likely to be affected but less acutely.
6.6.2 Estimating an impact on worth
Prime property without water resource managementfacilities, particularly that designed for majorcorporate occupiers, will require upgrading in orderto maintain maximum occupier demand, mostlikely at the next point of refurbishment. This willincrease the cost of refurbishment and is mosteffectively reflected up until the point ofrefurbishment, within the depreciation rate. Whereproperty under-performs in comparison to otherswithin its class the depreciation rate should thereforebe increased by an amount reflecting the extra costincurred in installing water management equipment.These costs can be kept minimal, particularlywhere dual, low volume flush toilets and spraytaps are installed at refit. Installation of greywaterand rainwater recycling systems comes at greatercost but would not be appropriate for all property.
6.7 Accessibility9
Accessibility is fundamental to both propertyvalue and worth. It is currently reflected instandard valuation and appraisal processes.However, the extent to which the accessibility ofa property might be impacted by policy directedat changing transport patterns is not currentlyexplicitly reflected in the standard propertyappraisal process. The Sustainable PropertyAppraisal Tool addresses this by making anassessment of the impact reduced accessibilitymight have for a property.
Transport is increasingly subject to Governmentpolicy, regulation, subsidy and incentive. BothThe Transport Act, 2000 and PPG 13 seek moresustainable solutions to commuting as a meansof mitigating the environmental consequences ofincreased car travel. The Energy White Paper (DTI,2004) identifies “better vehicles and lower carbonfuels” (p12) as key to the reduction of carbonemissions over time.
Existing measures have yet to bring about muchchange in commuter behaviour. Across the UK,71.2% of commuters travel to work by privatevehicle. In London the figure is substantially lowerat 40.5% but this is still high given the masstransport alternatives of a substantial undergroundand bus network (ONS, 2002). The requirement foroccupiers to develop Green Travel Plans, particularlywhere expansion is planned, has been identified ashaving some success in reducing car use, (BCO,2004). However, the costs to business associatedwith achieving this are extremely variable and theeffect on productivity is as yet unmeasured.
This administrative and economic context makes itimperative that the accessibility characteristics of aproperty are considered carefully. The triple bottomline approach to sustainability adopted throughoutthis work requires the acceptance that whilst car-based travel may be environmentally damaging, itis an important form of access in both social andeconomic terms for a large proportion of theexisting property stock. It is clear that, whilst it maybe desirable in environmental terms for property tobe accessed by foot or public transport by its users,this is not possible for the majority of existing realestate in the UK. Furthermore, in terms of businessefficiency, restricting access to these transport
SS(1236)B-SustainPAP08AW2 2/4/07 10:18 Page 21
22
• employee retention,• customers visits.
It is likely that employee productivity is impactedby accessibility. However, so far, research hasfailed to produce a robust means of measuringchanges in employee productivity. Until this isdeveloped the potentially major impacts onproductivity made by different working environmentscan not be quantified and will not be reflected inproperty appraisals.
Employee recruitment does have measurableattributable costs. A property characteristic, forexample ease or difficulty of access, that causesan occupier’s recruitment or retention figures tomove away from the average for the organisation(either up or down) therefore has a quantifiablecost attached to it. However, this is only effectivefor office premises. Retail and industrial propertyhas a much lower worker/space ratio and wouldbe more affected by accessibility for customersand deliveries respectively.
Offices
The costs associated with employee recruitment(and therefore saved through employee retention)can be costed. They manifest themselves throughtangible expenses in the form of managementtime, administration and training, for example.According to the Chartered Institute of PersonnelDevelopment 2004, the average cost of recruitingmanagers and professionals is £7,000 including anamount attributable to loss of turn-over.
Research by Opportunity Now in a quite detailedbreakdown of administrative and managementcosts, estimate the replacement cost of a juniormanager earning £25,000 p.a. to be £21,930(Opportunity Now, 2001). These estimates providean initial foundation from which the impact oflimited or compromised accessibility might beassessed through increased staff recruitment costs.
Average staff turnover in the UK was 16% in 2003,stable since 2002 (CIPD, 2004). Recruitment andretention are significant issues for all businesses.Taking a mid point between the two estimates ofrecruitment cost, £14,465, and an average staffturnover of 16%, for each employee a businessmight spend £2,314.40 on recruitment. Assuming
modes may undermine productivity andcompromise employee recruitment and retention.
Fiscal and regulatory policies focused on transport,along with real increases in fuel costs make itcrucial to environmental, social and economicperformance that property is accessible via arange of transport forms. Ideally this shouldinclude public transport, local pedestrian access,private transport and adequate parking provisionwhere mass public transport is not available. Anyproperty accessible only or predominantly bycar/road will be increasingly vulnerable toregulatory change and rising fuel costs, which arelikely to impact business productivity and thereforeoccupier demand.
6.7.1 Impact across property type
For office property, proximity to good national andlocal rail networks can substantially improveaccessibility and reduce the risk attached touncertainty with regards transport policy andenergy prices. Research into commuting identifieslonger public transport journeys, particularly trainjourneys, as less stressful for commuters than longcar journeys and more popular (Junnila, 2004,McLennan and Bennet, 2003). Legal and GeneralProperty’s research into accessibility placed similarimportance on the availability of strong rail links(Legal and General Property, 2004).
Whilst many retail centres provide important localfacilities, many are also linked to and supported bya regional catchment area. This makes adequateparking provision and car accessibility forshoppers fundamental. Two points can be drawnfrom this. The first is that real increases in fuelcosts may impact on consumer travel patterns asthey search for economies; retail property locatedclose to other compatible functions may be lessvulnerable to falling trade. The second point is theimportance of the availability of at least one masspublic transport node for the continued success(economic sustainability) of retail centres.
6.7.2 Estimating an impact on worth
Four measures of the impact of accessibility onbusiness profitability have been identified:• employee productivity,• employee recruitment,
SS(1236)B-SustainPAP08AW2 2/4/07 10:18 Page 22
23
a density of 14m2/person (BCO 2000) this equatesto £165/m2 for office space. If lack of accessibilityincreases staff turnover from 16% to 17%recruitment costs will increase to £175/m2 anincrease of 9.4% or £10/m2. If an occupier suffersan increase in staff turnover as a result ofaccessibility, this will equate to an extra cost persquare meter of space that they will not bewilling/able to pay in rent. Conversely, a highlyaccessible property may reduce the level of staffturnover, contributing to business profitability byreducing recruitment costs in similar fashion.
Retail
The most important accessibility issue for retailproperty is for customers. Broad averages suggestthat for each shopping trip non-food spending pershopper group is £50 and food spending £80.Spend will inevitably differ considerably from centreto centre, but using these averages as a startingpoint it is possible to begin to estimate the impactof reduced shopper accessibility on retail property.
Focusing on non-food spending, every 1%change in number of visitors could impact turnoverby 50p per shopper. A non-food based shoppingcentre achieving say 10 million visitors per annumwith an average shopper group size of 4, might beexpected to achieve non-food spending ofapproximately £125m per annum:
10 million people2.5m shopper groups of 4 people x £50 non-foodspending per group£125mIf restricted accessibility reduces the number of
Example 5
1% reduction in shoppers = -£31.25/m2
As a proportion of an overall rent of (say)£500/m = 6.25%Amortized over 10 years = 0.625%Reduced by say 50% to reflect impact on rentalnegotiation = 0.3125%
In this example, the rental growth would bereduced by 31.25 basis points to reflect a lossof 1% in customer visits.
visitors by 1%, the impact on turnover would be50p x 2.5 million shopping groups; £1.25 millionper annum.
Given an estimate of the number of visitors to acentre and its area, it is possible to estimate theimpact in terms of spending, and therefore potentialimpact on rental growth, of a percentage changein the number of shoppers due to a change in aretail centre’s accessibility.
The parameters within the tool are based on anaverage footfall/m2/pa of 250 persons and 4 peoplein each shopper group. Based on the broadaverages of shopper spend outlined above, eachsquare meter generates:
250/4 x 50 = £3,125 per annum of spending.
If the number of shoppers falls by 1% the impactwould be to reduce retail spend by £31.25/m2 perannum. This can be translated into a potentialimpact on rental growth over time (see Example 5,bottom left).
Research by the Centre for Transport Studies atImperial College indicated a 5.52% reduction inbusiness at John Lewis’s Oxford Street store inthe 6 months following the introduction of thecongestion charge (Bell et al, 2004). Whilstresearch by Transport for London (TFL, 2004,2005) suggests the impact is much more limited,just a 1% reduction in business is clearly significantfor retailers and therefore ultimately for retail rentalgrowth in individual centres.
For a major destination shopping centre such asBluewater, for example, which has approximately27 million visitors each year, the impact would bescaled up substantially. It would ultimately feedthrough to rental growth as occupier demandbegan to reflect the poorer trading conditions.
Manufacturing / Industrial
Manufacturing and industrial occupiers rely heavilyon a labour force that must have good access toits property and the delivery and dispatch of rawmaterials and goods. In many instances the labourforce will require public transport access andclearly good road network access is necessary.However, increasing uncertainty over fuel prices
SS(1236)B-SustainPAP08AW2 2/4/07 10:18 Page 23

24
suggests manufacturing/industrial property that isonly accessible by road will subject its occupiersto increased haulage costs and either reducedlabour supply or higher labour costs. Whilst it isaccepted that changes to accessibility will impacton rental growth, it is not possible yet to price thesefor industrial and manufacturing space. It might bepossible to do this through haulage costs and theimpact of any anticipated increase in fuel costs.
6.8 Contextual fit
Contextual fit refers to the extent to which aproperty is appropriate for its surroundings andprovides a successful point of interaction with thelocal community. There are clearly instances wherethe presence of a particular property enhances ordegrades a location. The London Eye fits so wellwithin its environmental context or setting that itcould be described as having had a catalyst effect,triggering new and increased business activity andsocial activity in its neighbourhood.
In contrast, a property which does not ‘fit’ withinits local environmental context can deter socialand business activity in the area, or simply fail togenerate the level of activity anticipated atdevelopment stage.
These are subtle issues that in many instanceswill not be relevant to a calculation of worth.However, in some instances contextual fit canhave a significant impact on long-term investmentworth of a property. It is not currently possible tomake any realistic estimate of what this impactmight be in monetary terms. Contextual fit hastherefore not been developed as a parameter forthe Sustainable Property Appraisal Tool.
6.9 Occupier
This criteria examines the impact the reputationof the occupier might have on property worth. Atenant with a particularly high profile, poorreputation might reduce the liquidity of the assetby reducing demand from other investors.
Conversely a tenant with notable CSR credentialscould have the opposite affect. Some investors
already screen out particular occupiers suggestingan existing acceptance of the impact of occupieron asset value. Once public awareness andapprobation becomes focused on a particularorganisation the impact on property worth couldbe significant. It will be felt through an increasedyield on the subject property and reduced value ofany adjoining property as lettings become harderto achieve. It may also increase voids if theproperty is stigmatised by association.
Occupiers are increasingly aware of the risks thatneighbours can represent, particularly in multi-tenanted properties and schemes. Some occupiershave a clear understanding of who they do and donot want as neighbours. However, whilstunderstanding of this issue and the importance ofoccupier to risk and reputation is increasing, it isnot yet possible to quantify the impact this criteriamight have on property worth. No sufficiently robustlink has been established between the reputationof the occupier and the investment function ofproperty to be able to quantify it for the SustainableProperty Appraisal Tool.
SS(1236)B-SustainPAP08AW2 2/4/07 10:19 Page 24
25
The changes the Sustainable Property AppraisalTool makes to the calculation of worth variablesare the most complex element of this research.The rationale behind these parameters has beenset out above and the figures currentlyincorporated are based on this and a series ofconsultations and pilot studies. However there aretwo important points to note with regards theseparameters:a) this is the first step in producing anything that
so specifically links sustainability through toworth. Whilst the rationale has been carefullythought through, researched and discussed, it ispresented as a starting point for further debate.Better means of linking sustainability with worthwill be developed over time and we welcomesuch developments;
b) the parameters will change with the political-economic context and the tool must beconstantly monitored and updated to remaincurrent. The sustainability agenda itself is drivenboth by public and private sector policy, often inresponse to external stakeholder groups as wellas fundamental issues such as climate changeand resource depletion.
Appendix B contains a series of 8 case studyproperties that have been appraised using theFuture-Proofing Property Questionnaire and theSustainable Property Appraisal Tool. These includea range of different properties, including businessparks, shops, shopping centres and offices. Withone exception these are not properties wheresustainability was a design issue. They display arange of Future-Proofing labels from Poor Performerto Good Performer and reveal over and underestimates of worth; positive sustainabilitycharacteristics are ignored alongside negative onesin the standard appraisal process at present. Sofar the differential in net present value generatedusing the Sustainable Property Appraisal Tool, hasranged from -5% to +1.85%. But it must bereiterated, the sample of properties is very small (8).
Table 3 adjacent shows the Future-Proofing Ratingband for each property and the Net Present Values(NPV’s) generated using a standard appraisal anda sustainability appraisal. These results highlightsome interesting points. The overall Future-ProofRating is a useful tool that can be used to divideproperties into ‘bands’ of performance. Theseproperties range from Poor Performers through to
7 Applying the Sustainable Property Appraisal Tool
Good Performers, with the poorest performer interms of Future-Proof rating generating thebiggest negative difference in NPV when thesecharacteristics are taken into account.
The variations in the ratings and NPV’s highlighthow important it is to look at the scores achievedunder each sustainability criterion. This gives aclearer indication of where a property’svulnerabilities might lie in terms of sustainabilityand future investment return. For example the NPV of a retail property with a low score in energyefficiency will be more severely affected than anoffice or industrial property with a similar scorebecause energy costs, which drive the change, arenormally a higher proportion of retail rents. Similarlya high score in accessibility would outweigh theimpact of low scores in some other categories.
The results produced by the Sustainable PropertyAppraisal Tool are useful as a means of analysingthe implications a property’s future-proof ratingmight have in terms of worth. The spreadsheetgenerates different rental growth, depreciationand risk rates depending on the data input and aproperty’s scores under each category within theFuture-Proofing Property Questionnaire. It ishowever, only a tool. It is intended as an aid toanalysis, it does not attempt to provide a definitiveanswer to the risk issues raised by sustainability.As in the case of other multifarious risks andconsiderations affecting a property’s worth,individual investors will ultimately determine these.
Table 3: Pilot Study Results
Pilot Future-Proofing Standard Sustainability % Property Property Rating NPV explicit NPV change
Retail 1 Poor £81,941,626 £78,044,073 -4.99Retail 2 Typical £84,904,908 £81,377,074 -4.34Retail 3 Typical £6,578,254 £6,316,856 -4.14Retail 4 Typical £114,198,367 £110,767,540 -3.10Offices 1 Typical £73,768,044 £71,852,635 -2.67Retail 5 Typical £2,072,871 £2,041,604 -1.53Offices 2 Good £196,869,962 £197,727,958 0.43Offices 3 Good £11,372,296 £11,509,583 1.19Offices 4 Good £18,528,247 £18,876,900 1.85
SS(1236)B-SustainPAP08AW2 2/4/07 10:19 Page 25
26
8 Conclusion
Consultation with industry has indicated that theoutputs of this research project resonate withproperty investors’ desire for progress inunderstanding how sustainability might affectproperty worth. The tools enable analysts tointerrogate the implications sustainability has forproperty investment performance explicitly and theuse of a standardised set of criteria has beenwelcomed as delivering a potential robustness tothe process that was not available before. This inturn presents new opportunities to analyseperformance against particular sustainability criteriaand to identify key areas of vulnerability within theproperty stock.
Over time such analysis should drive demand forproperty that performs better under keysustainability criteria, as these assets will beexpected to perform better under standardinvestment criteria, impacting on worth. Increasingdemand for sustainability within commercialproperty assets is key to raising the sustainabilityof the property stock as a whole. Sustainabilitycriteria will become more commonly reflected inrefurbishment and refit programmes as theybecome recognised as providing an additionalmeans of ensuring long term investment return.The tool is available, on request, to the investmentcommunity for study and further feedback.
The parameters established through this projectare presented as work in progress and not as adefinitive answer to the link between sustainabilityand worth. It is key to developing a keenerunderstanding of sustainability and better, more
accurate parameters, that the industry continuesto work in this area. Establishing more data andclearer quantifiable links is fundamental todeveloping the industry’s understanding of thisarea of risk to potential investment return.
The research has also identified sustainabilitycriteria that are important to the sustainableperformance of property but that are as yet notpossible to quantify; no clear link can beestablished between two of the criteria identifiedwithin the research and a property function thatcan be priced. However, this does not mean thesecriteria will not impact on worth, simply that wecannot make any estimate of what this impactmight be yet. It is important the industry continuesto examine these criteria with a view to developinga means of quantifying that impact and therebyreducing the unknown risks attached to investingin property.
The Future-Proofing Property Questionnaire hasstrong potential to move the industry forward inassessing and analysing sustainability. Whilst thequestionnaire might be criticised as limited intechnical scope and detail, it is strong in terms ofrelevance to the property investment sector andhas been very favourably received by industry. Therelative speed and ease with which it can deliverdata on sustainability across a commercialproperty portfolio makes it particularly useful inaddressing sustainability within the broaderproperty stock as well as the small handful ofproperties that might be considered sustainableaccording to current thinking.
SS(1236)B-SustainPAP08AW2 2/4/07 10:19 Page 26
27
Appendices
Appendix A: The Future-Proofing Property Questionnaire (completed for a hypothetical property)
Appendix B: 8 Case Studies
SS(1236)B-SustainPAP08AW2 2/4/07 10:19 Page 27
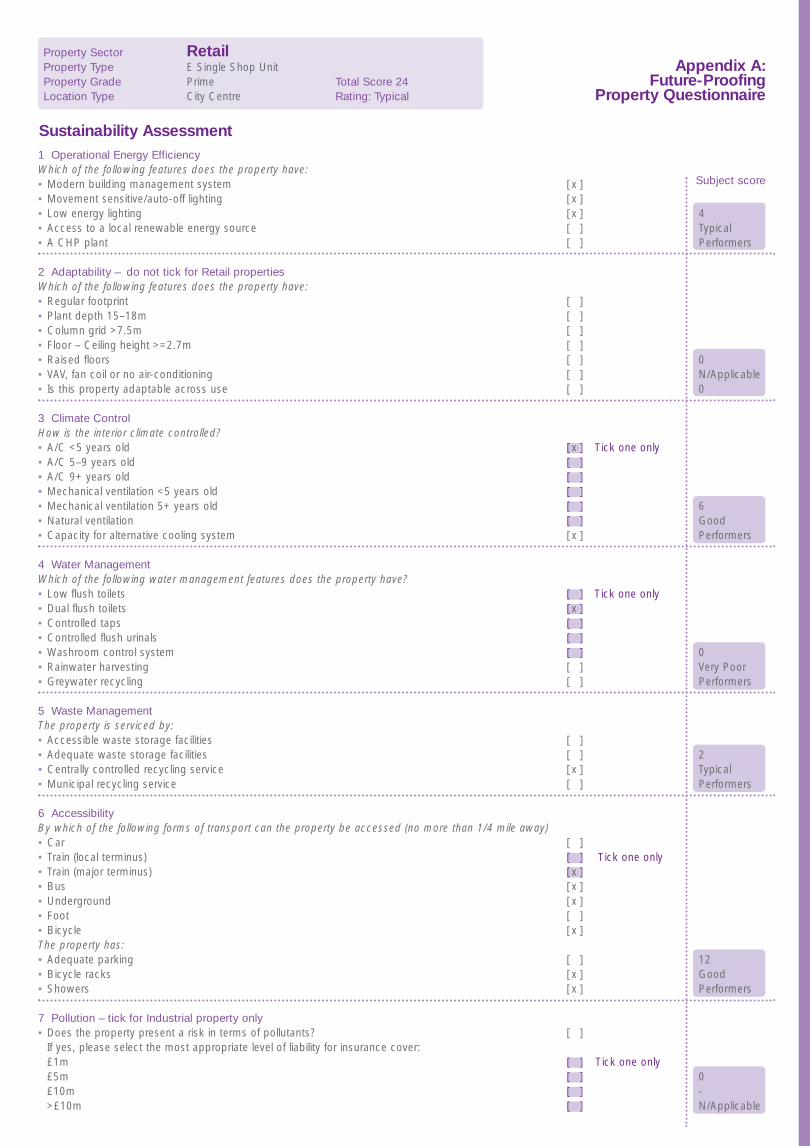
Appendix A:Future-Proofing
Property Questionnaire
Sustainability Assessment
Property Sector RetailProperty Type E Single Shop UnitProperty Grade Prime Total Score 24Location Type City Centre Rating: Typical
Tick one only
Tick one only
Tick one only
Tick one only
4TypicalPerformers
Subject score
0N/Applicable0
6GoodPerformers
0Very PoorPerformers
2TypicalPerformers
12GoodPerformers
0-N/Applicable
1 Operational Energy EfficiencyWhich of the following features does the property have:• Modern building management system [ ]• Movement sensitive/auto-off lighting [ ]• Low energy lighting [ ]• Access to a local renewable energy source [ ]• A CHP plant [ ]
2 Adaptability – do not tick for Retail propertiesWhich of the following features does the property have:• Regular footprint [ ]• Plant depth 15–18m [ ]• Column grid >7.5m [ ]• Floor – Ceiling height >=2.7m [ ]• Raised floors [ ]• VAV, fan coil or no air-conditioning [ ]• Is this property adaptable across use [ ]
3 Climate ControlHow is the interior climate controlled?• A/C <5 years old [ ]• A/C 5–9 years old [ ]• A/C 9+ years old [ ]• Mechanical ventilation <5 years old [ ]• Mechanical ventilation 5+ years old [ ]• Natural ventilation [ ]• Capacity for alternative cooling system [ ]
4 Water ManagementWhich of the following water management features does the property have?• Low flush toilets [ ]• Dual flush toilets [ ]• Controlled taps [ ]• Controlled flush urinals [ ]• Washroom control system [ ]• Rainwater harvesting [ ]• Greywater recycling [ ]
5 Waste ManagementThe property is serviced by:• Accessible waste storage facilities [ ]• Adequate waste storage facilities [ ]• Centrally controlled recycling service [ ]• Municipal recycling service [ ]
6 AccessibilityBy which of the following forms of transport can the property be accessed (no more than 1/4 mile away)• Car [ ]• Train (local terminus) [ ]• Train (major terminus) [ ]• Bus [ ]• Underground [ ]• Foot [ ]• Bicycle [ ]The property has:• Adequate parking [ ]• Bicycle racks [ ]• Showers [ ]
7 Pollution – tick for Industrial property only• Does the property present a risk in terms of pollutants? [ ]
If yes, please select the most appropriate level of liability for insurance cover:£1m [ ]£5m [ ]£10m [ ]>£10m [ ]
xxx
x
x
x
x
xxx
x
xx
SS(1236)B-SustainPAP08AW2 2/4/07 10:19 Page 28

Appendix B:Case Study 1
Basic Details:Property Sector OfficeProperty Type D Business ParkProperty Grade PrimeLocation Type Out of Town
Date of Valuation 25–Dec–04Tenure FreeholdPurchase Costs 5.75%
Sale Assumptions Standard Worth Sustainable WorthSale date 25–Dec–14Years to sale 10.00Exit yield 7.75% 7.26%Exit costs 1.00%ReturnDepreciation 1.00% 0.975%
Risk free rate 5.00% 5.00%Risk premium 3.75% 3.75%Discount rate 8.75% 8.75%Growth Rates Standard Rental Growth Sustainable Rental Growth Net Sustainable Rental GrowthYear 1 1.00% 1.49% 0.52%Year 2 1.50% 2.24% 1.26%Year 3 1.50% 2.24% 1.26%Year 4 1.25% 1.87% 0.89%Year 5 onwards 1.00% 1.49% 0.52%Market Rent per m2 £285.00Other FactorsRefurbishment costs: £0Building inflation 6%Other Costs – Fees & ManagementRent review fees 7.00%Management costs 0%Void service charge psq ft £0.00Rates per sq ft £0.00Inflation on costs 3%
Sustainability Factors Impact Line Office Energy RatingOperational Energy Use Rental growth A Office A/C Prime 2If energy cost is known enter Cost per sq m 4 Poor Performer
Property Type D Business parkScore from Questionnaire Total Score
Adaptability Rental growth 8 27Climate control Depreciation 3 3 TypicalWaste Depreciation 2 -Water Depreciation 0 -Accessibility Rental growth 12 -Industrial OnlyPollution – Environmental 1 PremiumInsurance Premiums <£60,000Pollutants Rental growth 0Contextual fit Rental growth -Occupier impact Risk premium -
Sustainable Criteria Sustainable Criteria Office Basis Points AdjustmentEnergy Use Rental growth 2 -0.82141Adaptability Rental growth 8 1.13973Pollutants Rental growth 0 0.00000Accessibility Rental growth 12 0.17407Contextual fit Rental growth 4 0.0000Occupier impact Risk premium 4 0.0000Climate control Depreciation 3 -0.10000Waste Depreciation 2 0.02500Water Depreciation 0 0.10000
Results Gross Net % ChangeStandard Worth £131,596,558 £124,441,190 -Sustainable Worth £135,567,399 £128,196,122 2.93
SS(1236)B-SustainPAP08AW2 2/4/07 10:19 Page 29
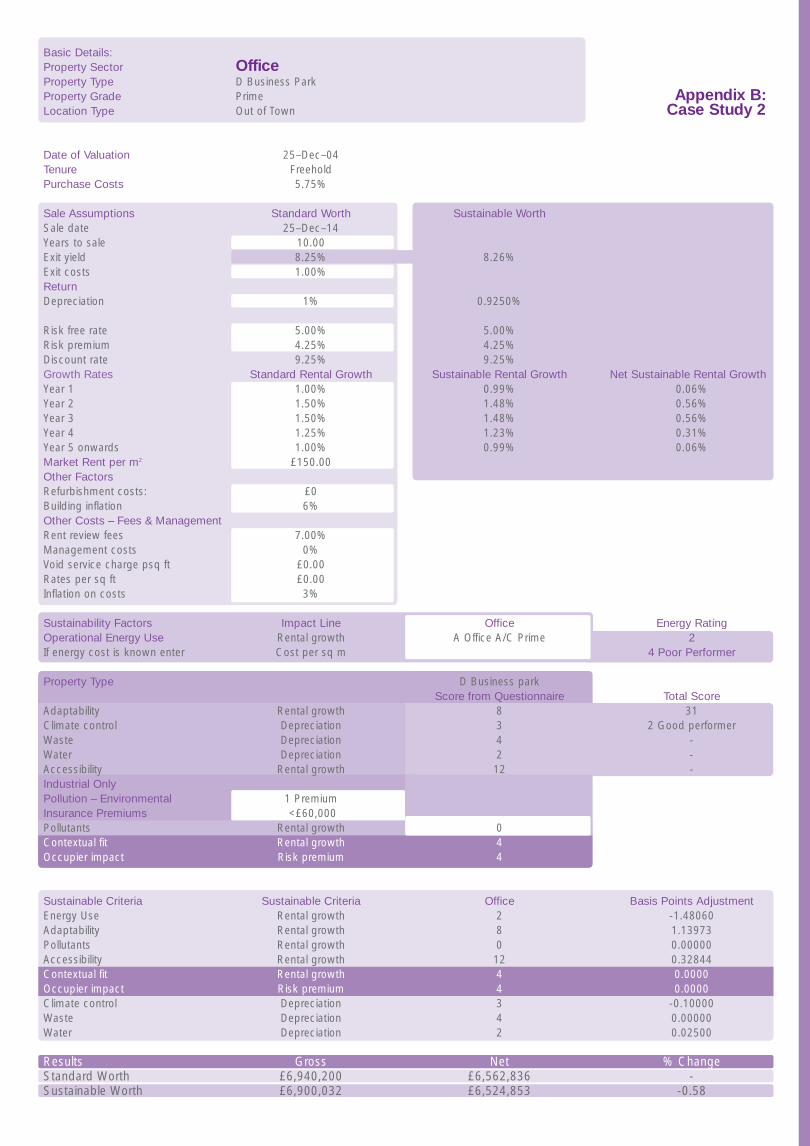
Basic Details:Property Sector OfficeProperty Type D Business ParkProperty Grade PrimeLocation Type Out of Town
Date of Valuation 25–Dec–04Tenure FreeholdPurchase Costs 5.75%
Sale Assumptions Standard Worth Sustainable WorthSale date 25–Dec–14Years to sale 10.00Exit yield 8.25% 8.26%Exit costs 1.00%ReturnDepreciation 1% 0.9250%
Risk free rate 5.00% 5.00%Risk premium 4.25% 4.25%Discount rate 9.25% 9.25%Growth Rates Standard Rental Growth Sustainable Rental Growth Net Sustainable Rental GrowthYear 1 1.00% 0.99% 0.06%Year 2 1.50% 1.48% 0.56%Year 3 1.50% 1.48% 0.56%Year 4 1.25% 1.23% 0.31%Year 5 onwards 1.00% 0.99% 0.06%Market Rent per m2 £150.00Other FactorsRefurbishment costs: £0Building inflation 6%Other Costs – Fees & ManagementRent review fees 7.00%Management costs 0%Void service charge psq ft £0.00Rates per sq ft £0.00Inflation on costs 3%
Sustainability Factors Impact Line Office Energy RatingOperational Energy Use Rental growth A Office A/C Prime 2If energy cost is known enter Cost per sq m 4 Poor Performer
Property Type D Business parkScore from Questionnaire Total Score
Adaptability Rental growth 8 31Climate control Depreciation 3 2 Good performerWaste Depreciation 4 -Water Depreciation 2 -Accessibility Rental growth 12 -Industrial OnlyPollution – Environmental 1 PremiumInsurance Premiums <£60,000Pollutants Rental growth 0Contextual fit Rental growth 4Occupier impact Risk premium 4
Sustainable Criteria Sustainable Criteria Office Basis Points AdjustmentEnergy Use Rental growth 2 -1.48060Adaptability Rental growth 8 1.13973Pollutants Rental growth 0 0.00000Accessibility Rental growth 12 0.32844Contextual fit Rental growth 4 0.0000Occupier impact Risk premium 4 0.0000Climate control Depreciation 3 -0.10000Waste Depreciation 4 0.00000Water Depreciation 2 0.02500
Results Gross Net % ChangeStandard Worth £6,940,200 £6,562,836 -Sustainable Worth £6,900,032 £6,524,853 -0.58
Appendix B:Case Study 2
SS(1236)B-SustainPAP08AW2 2/4/07 10:19 Page 30

Appendix B:Case Study 3
Basic Details:Property Sector OfficeProperty Type A Office City CentreProperty Grade PrimeLocation Type City Centre
Date of Valuation 25–Dec–04Tenure FreeholdPurchase Costs 5.75%
Sale Assumptions Standard Worth Sustainable WorthSale date 25–Dec–14Years to sale 10.00Exit yield 8.00% 8.50%Exit costs 1.00%ReturnDepreciation 1% 1.50%
Risk free rate 5.00% 5.00%Risk premium 4.00% 4.00%Discount rate 9.00% 9.00%Growth Rates Standard Rental Growth Sustainable Rental Growth Net Sustainable Rental GrowthYear 1 1.00% 0.50% -1.00%Year 2 1.50% 0.75% -0.75%Year 3 1.50% 0.75% -0.75%Year 4 1.25% 0.62% -0.88%Year 5 onwards 1.00% 0.50% -1.00%Market Rent per m2 £375.00Other FactorsRefurbishment costs: £0Building inflation 6%Other Costs – Fees & ManagementRent review fees 7.00%Management costs 0%Void service charge psq ft £0.00Rates per sq ft £0.00Inflation on costs 3%
Sustainability Factors Impact Line Office Energy RatingOperational Energy Use Rental growth A Office A/C Prime 2If energy cost is known enter Cost per sq m 4 Poor Performer
Property Type D Business parkScore from Questionnaire Total Score
Adaptability Rental growth 4 19Climate control Depreciation 0 4 Poor performerWaste Depreciation 0 -Water Depreciation 1 -Accessibility Rental growth 12 -Industrial OnlyPollution – Environmental 1 PremiumInsurance Premiums <£60,000Pollutants Rental growth 0Contextual fit Rental growth -Occupier impact Risk premium -
Sustainable Criteria Sustainable Criteria Office Basis Points AdjustmentEnergy Use Rental growth 2 -0.63371Adaptability Rental growth 4 0.00000Pollutants Rental growth 0 0.00000Accessibility Rental growth 12 0.13254Contextual fit Rental growth 4 0.0000Occupier impact Risk premium 4 0.0000Climate control Depreciation 0 0.50000Waste Depreciation 0 0.05000Water Depreciation 1 0.05000
Results Gross Net % ChangeStandard Worth £47,223,690 £44,655,971 -Sustainable Worth £45,447,466 £42,976,327 -3.91
SS(1236)B-SustainPAP08AW2 2/4/07 10:19 Page 31

Basic Details:Property Sector OfficeProperty Type B Office Town Centre Property Grade PrimeLocation Type Town Centre
Date of Valuation 25–Dec–04Tenure FreeholdPurchase Costs 5.75%
Sale Assumptions Standard Worth Sustainable WorthSale date 25–Dec–14Years to sale 10.00Exit yield 7.50% 7.25%Exit costs 1.00%ReturnDepreciation 1% 1.05%
Risk free rate 5.00% 5.00%Risk premium 3.50% 3.50%Discount rate 8.50% 8.50%Growth Rates Standard Rental Growth Sustainable Rental Growth Net Sustainable Rental GrowthYear 1 1.00% 1.25% 0.20%Year 2 1.50% 1.88% 0.83%Year 3 1.50% 1.88% 0.83%Year 4 1.25% 1.57% 0.52%Year 5 onwards 1.00% 1.25% 0.20%Market Rent per m2 £247.50Other FactorsRefurbishment costs: £0Building inflation 6%Other Costs – Fees & ManagementRent review fees 7.00%Management costs 0%Void service charge psq ft £0.00Rates per sq ft £0.00Inflation on costs 3%
Sustainability Factors Impact Line Office Energy RatingOperational Energy Use Rental growth A Office A/C Prime 2If energy cost is known enter Cost per sq m 4 Poor Performer
Property Type D Business parkScore from Questionnaire Total Score
Adaptability Rental growth 8 29Climate control Depreciation 2 3 TypicalWaste Depreciation 0 -Water Depreciation 1 -Accessibility Rental growth 16 -Industrial OnlyPollution – Environmental 1 PremiumInsurance Premiums <£60,000Pollutants Rental growth 0Contextual fit Rental growth -Occupier impact Risk premium -
Sustainable Criteria Sustainable Criteria Office Basis Points AdjustmentEnergy Use Rental growth 2 -0.93716Adaptability Rental growth 8 1.13973Pollutants Rental growth 0 0.00000Accessibility Rental growth 16 0.05005Contextual fit Rental growth 4 0.0000Occupier impact Risk premium 4 0.0000Climate control Depreciation 2 0.00000Waste Depreciation 0 0.00000Water Depreciation 1 0.05000
Results Gross Net % ChangeStandard Worth £13,123,557 £12,409,983 -Sustainable Worth £13,321,411 £12,597,079 1.49
Appendix B:Case Study 4
SS(1236)B-SustainPAP08AW2 2/4/07 10:19 Page 32
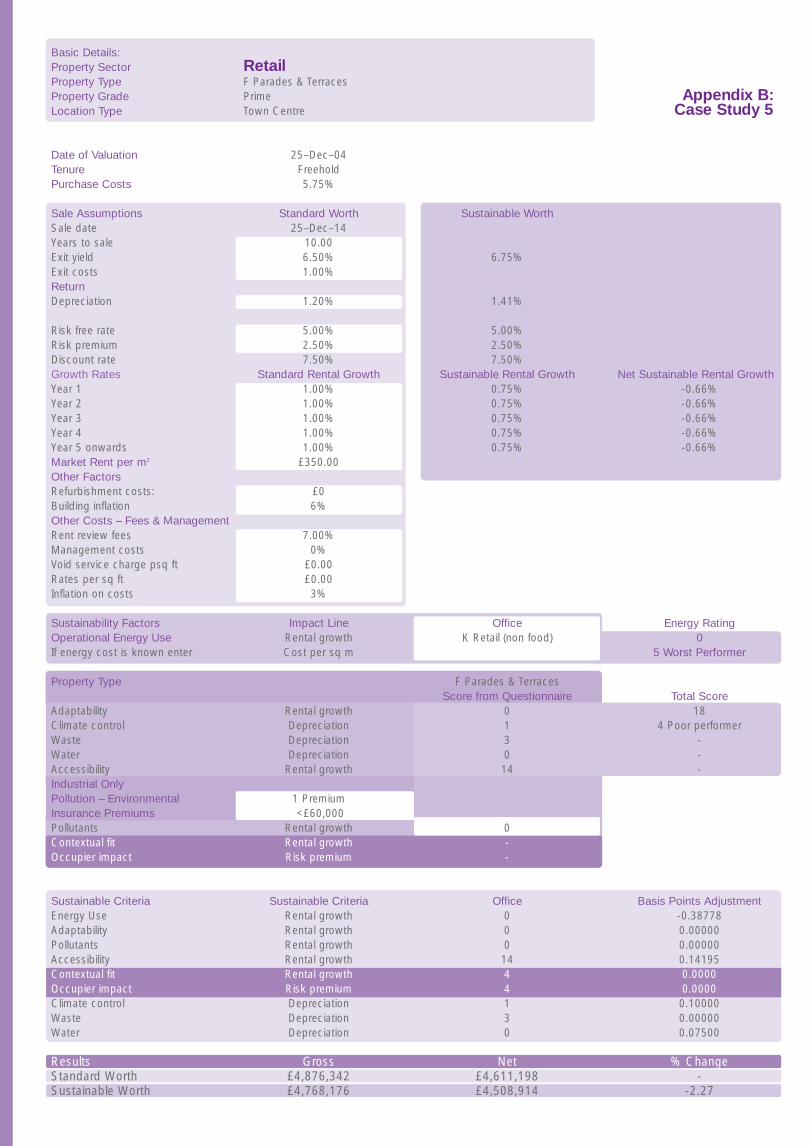
Basic Details:Property Sector RetailProperty Type F Parades & TerracesProperty Grade PrimeLocation Type Town Centre
Date of Valuation 25–Dec–04Tenure FreeholdPurchase Costs 5.75%
Sale Assumptions Standard Worth Sustainable WorthSale date 25–Dec–14Years to sale 10.00Exit yield 6.50% 6.75%Exit costs 1.00%ReturnDepreciation 1.20% 1.41%
Risk free rate 5.00% 5.00%Risk premium 2.50% 2.50%Discount rate 7.50% 7.50%Growth Rates Standard Rental Growth Sustainable Rental Growth Net Sustainable Rental GrowthYear 1 1.00% 0.75% -0.66%Year 2 1.00% 0.75% -0.66%Year 3 1.00% 0.75% -0.66%Year 4 1.00% 0.75% -0.66%Year 5 onwards 1.00% 0.75% -0.66%Market Rent per m2 £350.00Other FactorsRefurbishment costs: £0Building inflation 6%Other Costs – Fees & ManagementRent review fees 7.00%Management costs 0%Void service charge psq ft £0.00Rates per sq ft £0.00Inflation on costs 3%
Sustainability Factors Impact Line Office Energy RatingOperational Energy Use Rental growth K Retail (non food) 0If energy cost is known enter Cost per sq m 5 Worst Performer
Property Type F Parades & TerracesScore from Questionnaire Total Score
Adaptability Rental growth 0 18Climate control Depreciation 1 4 Poor performerWaste Depreciation 3 -Water Depreciation 0 -Accessibility Rental growth 14 -Industrial OnlyPollution – Environmental 1 PremiumInsurance Premiums <£60,000Pollutants Rental growth 0Contextual fit Rental growth -Occupier impact Risk premium -
Sustainable Criteria Sustainable Criteria Office Basis Points AdjustmentEnergy Use Rental growth 0 -0.38778Adaptability Rental growth 0 0.00000Pollutants Rental growth 0 0.00000Accessibility Rental growth 14 0.14195Contextual fit Rental growth 4 0.0000Occupier impact Risk premium 4 0.0000Climate control Depreciation 1 0.10000Waste Depreciation 3 0.00000Water Depreciation 0 0.07500
Results Gross Net % ChangeStandard Worth £4,876,342 £4,611,198 -Sustainable Worth £4,768,176 £4,508,914 -2.27
Appendix B:Case Study 5
SS(1236)B-SustainPAP08AW2 2/4/07 10:19 Page 33

Appendix B:Case Study 6
Basic Details:Property Sector RetailProperty Type F Parades & Terraces Property Grade TertiaryLocation Type Town Centre
Date of Valuation 25–Dec–04Tenure FreeholdPurchase Costs 5.75%
Sale Assumptions Standard Worth Sustainable WorthSale date 25–Dec–14Years to sale 10.00Exit yield 7.50% 7.77%Exit costs 1.00%ReturnDepreciation 0.50% 0.4875%
Risk free rate 5.00% 5.00%Risk premium 3.50% 3.50%Discount rate 8.50% 8.50%Growth Rates Standard Rental Growth Sustainable Rental Growth Net Sustainable Rental GrowthYear 1 1.00% 0.73% 0.24%Year 2 1.00% 0.73% 0.24%Year 3 1.00% 0.73% 0.24%Year 4 1.00% 0.73% 0.24%Year 5 onwards 1.00% 0.73% 0.24%Market Rent per m2 £440.00Other FactorsRefurbishment costs: £0Building inflation 6%Other Costs – Fees & ManagementRent review fees 7.00%Management costs 0%Void service charge psq ft £0.00Rates per sq ft £0.00Inflation on costs 3%
Sustainability Factors Impact Line Office Energy RatingOperational Energy Use Rental growth K Retail (non food) 1If energy cost is known enter Cost per sq m 5 Worst Performer
Property Type D Business parkScore from Questionnaire Total Score
Adaptability Rental growth 0 22Climate control Depreciation 3 3 TypicalWaste Depreciation 4 -Water Depreciation 0 -Accessibility Rental growth 14 -Industrial OnlyPollution – Environmental 1 PremiumInsurance Premiums <£60,000Pollutants Rental growth 0Contextual fit Rental growth -Occupier impact Risk premium -
Sustainable Criteria Sustainable Criteria Office Basis Points AdjustmentEnergy Use Rental growth 1 -0.38778Adaptability Rental growth 0 0.00000Pollutants Rental growth 0 0.00000Accessibility Rental growth 14 0.11306Contextual fit Rental growth 4 0.0000Occupier impact Risk premium 4 0.0000Climate control Depreciation 3 -0.10000Waste Depreciation 4 0.00000Water Depreciation 0 0.07500
Results Gross Net % ChangeStandard Worth £2,284,967 £2,160,725 -Sustainable Worth £2,237,353 £2,115,701 -0.98
SS(1236)B-SustainPAP08AW2 2/4/07 10:19 Page 34
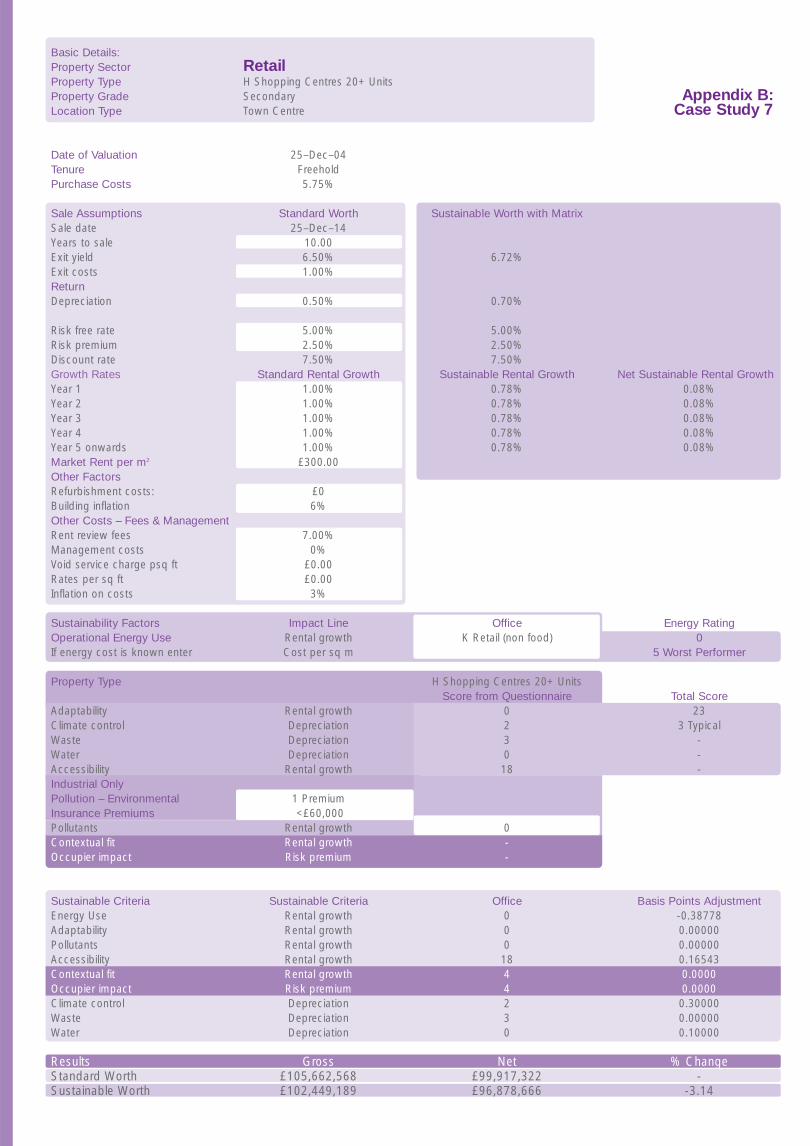
Basic Details:Property Sector RetailProperty Type H Shopping Centres 20+ Units Property Grade SecondaryLocation Type Town Centre
Date of Valuation 25–Dec–04Tenure FreeholdPurchase Costs 5.75%
Sale Assumptions Standard Worth Sustainable Worth with MatrixSale date 25–Dec–14Years to sale 10.00Exit yield 6.50% 6.72%Exit costs 1.00%ReturnDepreciation 0.50% 0.70%
Risk free rate 5.00% 5.00%Risk premium 2.50% 2.50%Discount rate 7.50% 7.50%Growth Rates Standard Rental Growth Sustainable Rental Growth Net Sustainable Rental GrowthYear 1 1.00% 0.78% 0.08%Year 2 1.00% 0.78% 0.08%Year 3 1.00% 0.78% 0.08%Year 4 1.00% 0.78% 0.08%Year 5 onwards 1.00% 0.78% 0.08%Market Rent per m2 £300.00Other FactorsRefurbishment costs: £0Building inflation 6%Other Costs – Fees & ManagementRent review fees 7.00%Management costs 0%Void service charge psq ft £0.00Rates per sq ft £0.00Inflation on costs 3%
Sustainability Factors Impact Line Office Energy RatingOperational Energy Use Rental growth K Retail (non food) 0If energy cost is known enter Cost per sq m 5 Worst Performer
Property Type H Shopping Centres 20+ UnitsScore from Questionnaire Total Score
Adaptability Rental growth 0 23Climate control Depreciation 2 3 TypicalWaste Depreciation 3 -Water Depreciation 0 -Accessibility Rental growth 18 -Industrial OnlyPollution – Environmental 1 PremiumInsurance Premiums <£60,000Pollutants Rental growth 0Contextual fit Rental growth -Occupier impact Risk premium -
Sustainable Criteria Sustainable Criteria Office Basis Points AdjustmentEnergy Use Rental growth 0 -0.38778Adaptability Rental growth 0 0.00000Pollutants Rental growth 0 0.00000Accessibility Rental growth 18 0.16543Contextual fit Rental growth 4 0.0000Occupier impact Risk premium 4 0.0000Climate control Depreciation 2 0.30000Waste Depreciation 3 0.00000Water Depreciation 0 0.10000
Results Gross Net % ChangeStandard Worth £105,662,568 £99,917,322 -Sustainable Worth £102,449,189 £96,878,666 -3.14
Appendix B:Case Study 7
SS(1236)B-SustainPAP08AW2 2/4/07 10:19 Page 35
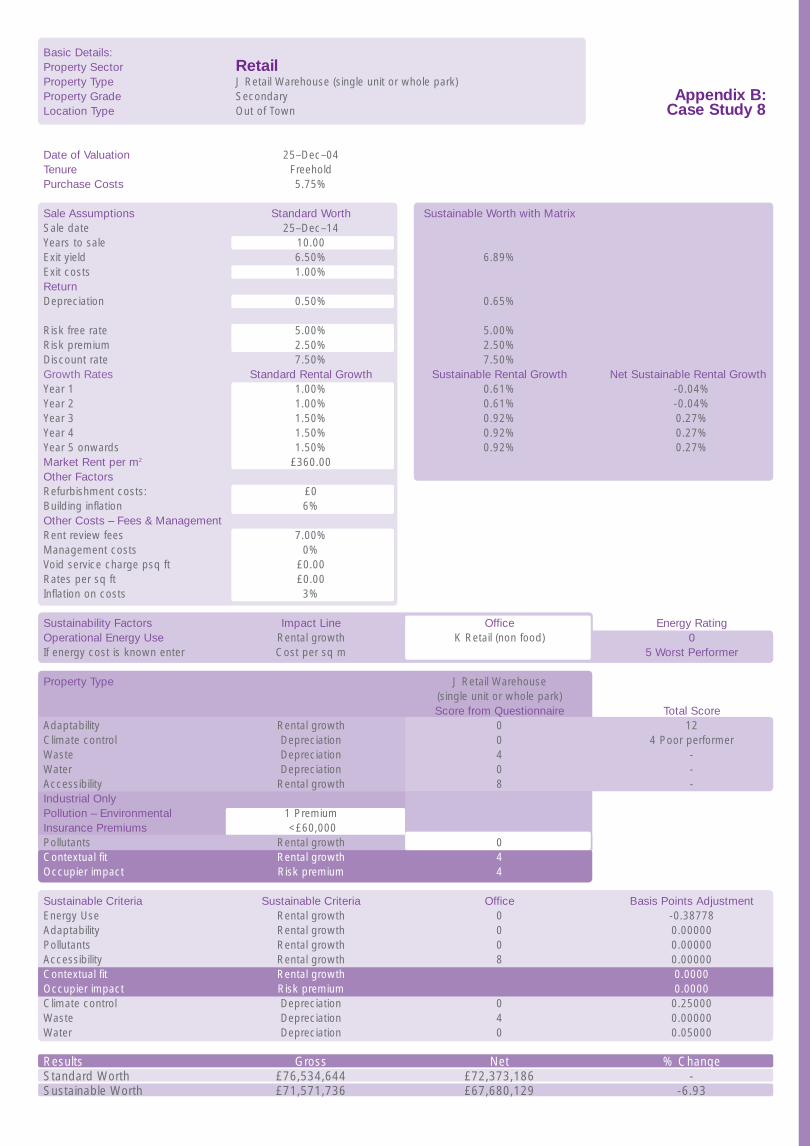
Basic Details:Property Sector RetailProperty Type J Retail Warehouse (single unit or whole park) Property Grade SecondaryLocation Type Out of Town
Date of Valuation 25–Dec–04Tenure FreeholdPurchase Costs 5.75%
Sale Assumptions Standard Worth Sustainable Worth with MatrixSale date 25–Dec–14Years to sale 10.00Exit yield 6.50% 6.89%Exit costs 1.00%ReturnDepreciation 0.50% 0.65%
Risk free rate 5.00% 5.00%Risk premium 2.50% 2.50%Discount rate 7.50% 7.50%Growth Rates Standard Rental Growth Sustainable Rental Growth Net Sustainable Rental GrowthYear 1 1.00% 0.61% -0.04%Year 2 1.00% 0.61% -0.04%Year 3 1.50% 0.92% 0.27%Year 4 1.50% 0.92% 0.27%Year 5 onwards 1.50% 0.92% 0.27%Market Rent per m2 £360.00Other FactorsRefurbishment costs: £0Building inflation 6%Other Costs – Fees & ManagementRent review fees 7.00%Management costs 0%Void service charge psq ft £0.00Rates per sq ft £0.00Inflation on costs 3%
Sustainability Factors Impact Line Office Energy RatingOperational Energy Use Rental growth K Retail (non food) 0If energy cost is known enter Cost per sq m 5 Worst Performer
Property Type J Retail Warehouse (single unit or whole park)Score from Questionnaire Total Score
Adaptability Rental growth 0 12Climate control Depreciation 0 4 Poor performerWaste Depreciation 4 -Water Depreciation 0 -Accessibility Rental growth 8 -Industrial OnlyPollution – Environmental 1 PremiumInsurance Premiums <£60,000Pollutants Rental growth 0Contextual fit Rental growth 4Occupier impact Risk premium 4
Sustainable Criteria Sustainable Criteria Office Basis Points AdjustmentEnergy Use Rental growth 0 -0.38778Adaptability Rental growth 0 0.00000Pollutants Rental growth 0 0.00000Accessibility Rental growth 8 0.00000Contextual fit Rental growth 0.0000Occupier impact Risk premium 0.0000Climate control Depreciation 0 0.25000Waste Depreciation 4 0.00000Water Depreciation 0 0.05000
Results Gross Net % ChangeStandard Worth £76,534,644 £72,373,186 -Sustainable Worth £71,571,736 £67,680,129 -6.93
Appendix B:Case Study 8
SS(1236)B-SustainPAP08AW2 2/4/07 10:19 Page 36
37
Action Energy 2002. Benchmarking tool forindustrial buildings, London: Action Energy [available online at www.energy-efficiency.gov.uk]
Action Energy 2003 Energy ConsumptionGuide 19: Energy use in offices, HMSO:London
Association for the Conservation of Energy,2004. Asset value implications for low energyoffices ACE:London
Baum, A. Callender, M. Crosby, N. Devaney,D. Law, V. Westlake, C. 2004. Depreciation inUK commercial property markets IPF/IPDProperty Investment Conference, Brighton,November 2004
BCO 2000. Office Plus: best practice in thespecification for offices, BCO:London [available at www.bco.org]
BCO 2004. Green travel plans for offices: aresearch report, BCO: London
Bell, M. Quddus, M., Schmocker, J-D andFonzone, A. 2004. The impact of thecongestion charge on the retail sector, Centrefor Transport Studies: London
Bon, R., Gibson, V. and Luck, R. 2003. AnnualCREMRU-JCI survey of corporate real estatepractices in Europe and North America:1993–2002, Facilities, 21 (7/8) 151–167
BRE Trust/Cyril Sweet, 2005. Putting a Priceon sustainability, BRE: Watford
Cameron McKenna, 2004. First courtdecision on contaminated land legislation, www.law-nw.com, 26 August 2004
Chartered Institute of Personnel Development2004. Survey of UK and Ireland, CIPD[available online at www.cipd.co.uk]
Commission of the European Communities(2002) Directive of the European Parliamentand of the Council on the Energy Performanceof Buildings Brussels Belgium: Commission ofthe European Communities (EC Regulation2037/2000)
Davis Langdon and Everest and Mott GreenWall, 2003 Cost model, Building 12 September63–67
Deloitte Research 2004. Globalization andEnergy Supply: strategic Risk in the 21stCentury, London: Deloitte Research [availableonline at www.deloitte.com/research]
DETR Action Energy 1999. Good PracticeGuide 274: Environmentally Smart Buildings – a quantity surveyors guide to thecost-effectiveness of energy efficient offices,HMSO:London
DeMarco, T., and Lister, T. R., 1993.Peopleware: Productive Projects and Teams,New York, Dorset House Publishing
DTI 2004 Energy White Paper: Our energyfuture – creating a low carbon economy,HMSO:London
DTI, 2004. Quarterly energy prices:September update [available online atwww.dti.gov.uk/energy/inform/energy_prices/index.shtml]
ENDS, 2004. Agency turns spotlight on risk-based regulation, ENDS Report 255 August2004 25–28 [available online atwww.endsreport.com]
ENDS 2003 Building Energy Directive becomeslaw, The Ends Report, 336, [available atwww.endreport.com]
HM Treasury, 2004a. An assessment ofoptions for recycling landfill tax revenue,[available online at www.hm-treasury.gov.uk]
Investment Property Forum, 2004. Liquidity inCommercial Property Markets Working Paper2: Desconstructing the transaction process:an analysis of fund transaction data IPF:London
Jayne, M and Skerrat, G. 2003. Therequirements of ethical fund managers andproperty investment, Property Management,21 (2) 136–152
Junnila S. 2004 The environmentalsignificance of facilities in service sectorcompanies, Facilities 22(7/8) 190–198
Jones Lang LaSalle, 2004. Office OSCAR:Service charge analysis for offices, 2004, JLL:London [available online at www.jll.co.uk]
Laing Sir M. 2003. keynote address to DTIsponsored ‘Investing in SustainableDevelopments’ Key Players Workshop 11thNovember, Davis Langdon Consultancy,London.
M4I, 2002. Environmental performanceindicators for sustainable construction,www.m4i.org.uk/m4i/publications/reports/asp
McLennan, P. and Bennets, M. 2003. Thejourney to work: a descriptive UK case study,Facilities 21 (7/8) 180–187
ONS 2002. Travel to work times:HMSO:London
Sayce, S. and Ellison L. 2003a. Towardssustainability indicators for commercialproperty occupiers and investors, EighthAnnual International Sustainable ResearchConference, Nottingham 24–25 March
Sayce, S. and Ellison L. 2003b Integratingsustainability into the appraisal of propertyworth: identifying appropriate indicators ofsustainability, The American Real Estate AndUrban Economics Association Conference,RICS Foundation Sustainable DevelopmentSession August 21 – 23, 2003 Skye, Scotland
Shell International 2001. Energy needs, choicesand possibilities: Scenarios to 2050, ShellInternational [available online at www.Shell.com]
TFL, 2004. Congestion Charging ImactsMonitoring, 2nd Annual Report, TFL: London[available at www.tfl.govuk/tfl/ccloncon]
TFL, 2005. Congestion Charging ImactsMonitoring, 3nd Annual Report, TFL: London[available at www.tfl.govuk/tfl/ccloncon]
References
SS(1236)B-SustainPAP08AW2 2/4/07 10:19 Page 37

38
The David and Lucille Packard Foundation,2002. Building for sustainability: six scenariosfor the David and Lucille Packard FoundationLos Altos Project, [available online atwww.packard.org]
USGBC 2003. The costs and financial benefitsof green buildings: A report to California’sSustainable Building Task Force, USGBC:California [available at www.usgbc.org]
Van der Voordt, T. 2004. Costs and benefitsof flexible workspaces: work in progress inThe Netherlands, Facilities 22 (9/10) 240–246
Warren, C. 2003. New working practices and office space density: a comparison ofAustralia and the UK, Facilities 21 (13/14)306–314
Further Reading
CFI and IPD, 2004. The RICS TenantSatisfaction Index, RICS:London
Chao, M. and Parker, G. 2000 Recognition ofenergy costs and energy performance incommercial property valuation:recommendations and guidelines forappraisers, IMT: San Francisco [available atwww.imt.org]
Defence Evaluation and Research AgencyUK. 2001 Strategic futures thinking: metaanalysis of published material on drivers andtrends, HMSO: London [available online atwww.number-10.gov.uk]
DETR Action Energy 1999. Good PracticeGuide 274: Environmentally Smart Buildings – a quantity surveyors guide to the cost-effectiveness of energy efficientoffices, HMSO:London
DeMarco, T., and Lister, T. R., 1993.Peopleware: Productive Projects and Teams, New York, Dorset House Publishing
International Energy Agency, 2003. WorldEnergy Investment Outlook, IEA:Paris
Leifer, D. 2003. Building Ownership and FM,Facilities 21 (1/2) 38–41
Majersik, C. 2003. The impact of energy costson commercial building value – case studyTelergy Office Building New York, New YorkState Energy Research and DevelopmentAuthority: New York [available at www.imt.org]
Mawson, W. 2002 The Workplace and it’sImpact on productivity, Workplace AssociatesAdvanced Working Papers [available online at[www.advanced-workplace.com]
Oxera 2004. CO2 Emissions trading: how will it affect UK industry? The Carbon Trust:London [available online atwww.thecarbontrust.org]
PSU, 2000. The future and how to think aboutit, [available online at www.number-10.gov.uk]
RICS, 2004. Voice of the tenant: the RICStenant satisfaction index, RICS:London
RICS 1997 The Calculation of Worth: aninformation paper London RICS
The David and Lucille Packard Foundation,2002b. Building for sustainability [available online at www.packard.org]
The David and Lucille Packard Foundation,2002c. Building for sustainability:sustainability matrix, [available online atwww.packard.org]
Yates, A. 2001. Quantifying the businessbenefits of sutainable buildings – summaryof existing research findings BRE: Watford
References
Printed on 150 gsm ‘Take 2 Silk’. 100% recycled paper, distributed by the James McNaughton Group. SS(1236)B
SS(1236)B-SustainPAP08AW2 2/4/07 10:19 Page 38

SS(1236)B-SustainPAP08AW2 2/4/07 10:19 Page 39

SS(1236)B-SustainPAP08AW2 2/4/07 10:19 Page 40

The Sustainable PropertyAppraisal ProjectSchool of SurveyingKingston UniversityPenrhyn RoadKingston upon ThamesSurrey KT1 2EE
Telephone 020 8547 7047Directline 020 8547 8876Fax 020 8547 7087Email [email protected]
Project Director: Prof Sarah SayceProject Manager: Louise Ellison
ISBN 0-9554744-0-X