Embed Size (px)
Citation preview
P R E S E N T E D B Y K I M V O T T A
R E S E A R C H C O O R D I N A T O R M A R G R E T & H . A . R E Y C E N T E R
W A T E R V I L L E V A L L E Y , N H
The Tecumseh Research and Education Transect (TRET)
Presented at the Northeast Regional Space Grant Meeting, June 3, 2011
Outline
Partnering Organizations
TRET
The Research
The Education
Questions
2
Sponsoring Organizations
Margret & H.A. Rey Center www.thereycenter.org
Plymouth State University’s Center for the Environment www.plymouth.edu/cfe
3
TRET
A cooperative research and education initiative of the Rey Center and PSU’s Center for the Environment Integrates scientific research and place-based education
Research goal is to contribute to regional efforts to predict the impacts of climate change on northeastern forests.
Educational goal is to use phenology to inform students and the public about the probable consequences of climate change on the region’s forests and to encourage their interest in and support for monitoring the outcome.
4
The Research
Background
Methods
Results
Conclusions – Discussion
Ongoing work
5
Background: What is Phenology?
Phenology is the study of recurring plant and animal
life cycle events Biodiversity Timing determines growing season length
“Phenology…is perhaps the simplest process in which to track changes in the ecology of species in response to climate change.”
(IPCC, 2007)
6
Background: What is Phenology?
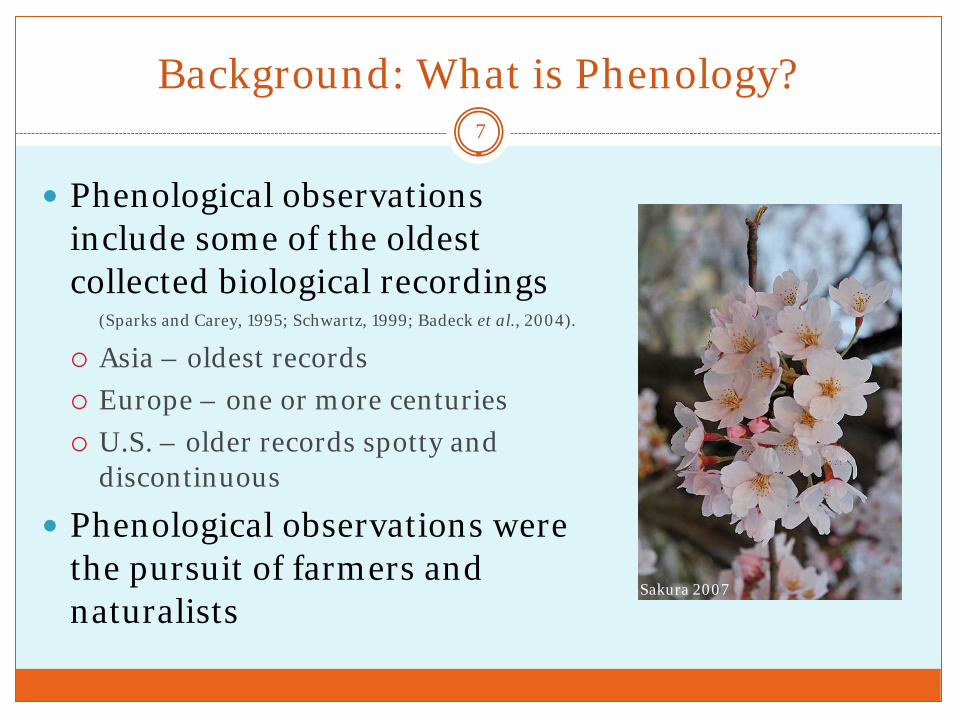
Phenological observations include some of the oldest collected biological recordings (Sparks and Carey, 1995; Schwartz, 1999; Badeck et al., 2004).
Asia – oldest records Europe – one or more centuries U.S. – older records spotty and
discontinuous
Phenological observations were the pursuit of farmers and naturalists
7
Sakura 2007
Background: Temperature
Temperature has the most influence on the timing of
phenophases in plants (Lechowicz, 1984)
In assessing plant phenology, a thermal time approach is often used Assumes that certain phenological events occur when a certain
amount of thermal time or accumulated degree-days (ADD) has been reached
8
Background: Climate Change
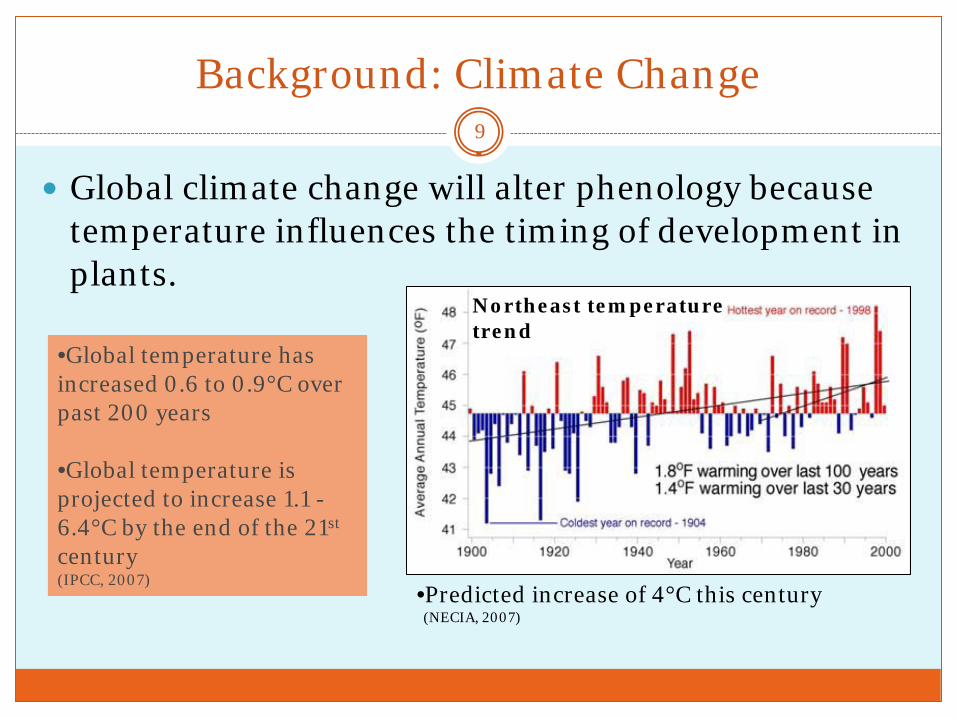
Global climate change will alter phenology because temperature influences the timing of development in plants.
9
•Global temperature has increased 0.6 to 0.9°C over past 200 years
•Global temperature is projected to increase 1.1 - 6.4°C by the end of the 21st century (IPCC, 2007)
Northeast temperature trend
•Predicted increase of 4°C this century (NECIA, 2007)
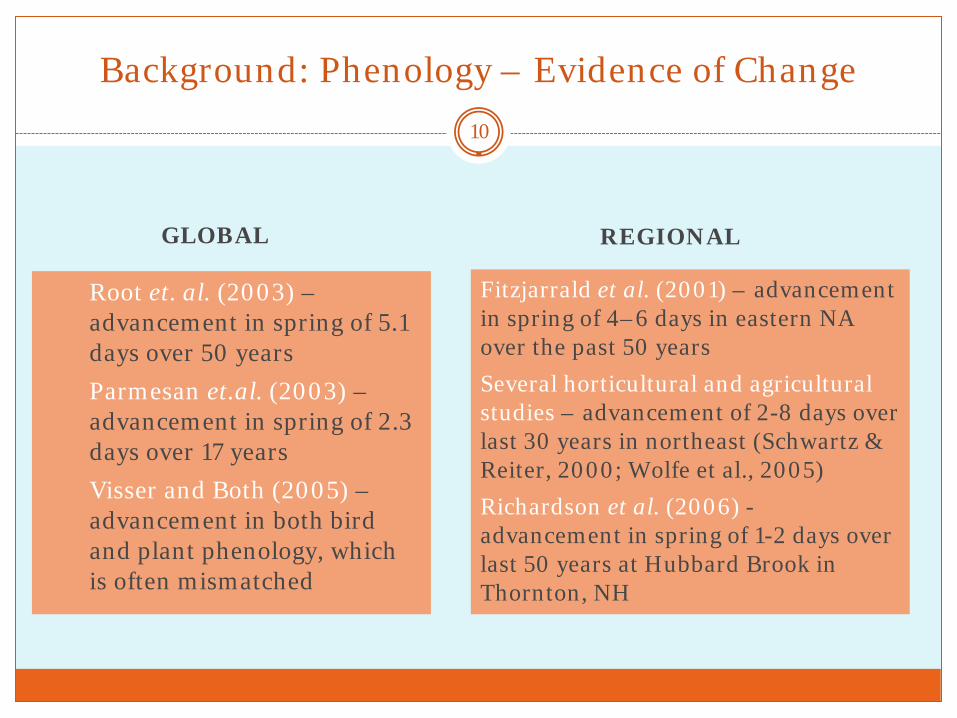
Background: Phenology – Evidence of Change
Root et. al. (2003) – advancement in spring of 5.1 days over 50 years Parmesan et.al. (2003) – advancement in spring of 2.3 days over 17 years Visser and Both (2005) – advancement in both bird and plant phenology, which is often mismatched
GLOBAL REGIONAL
Fitzjarrald et al. (2001) – advancement in spring of 4–6 days in eastern NA over the past 50 years Several horticultural and agricultural studies – advancement of 2-8 days over last 30 years in northeast (Schwartz & Reiter, 2000; Wolfe et al., 2005) Richardson et al. (2006) - advancement in spring of 1-2 days over last 50 years at Hubbard Brook in Thornton, NH
10
Background: Phenology Research Methods
The study of phenology is mainly guided by two independent methods:
Remote Sensing Ground Observations
11
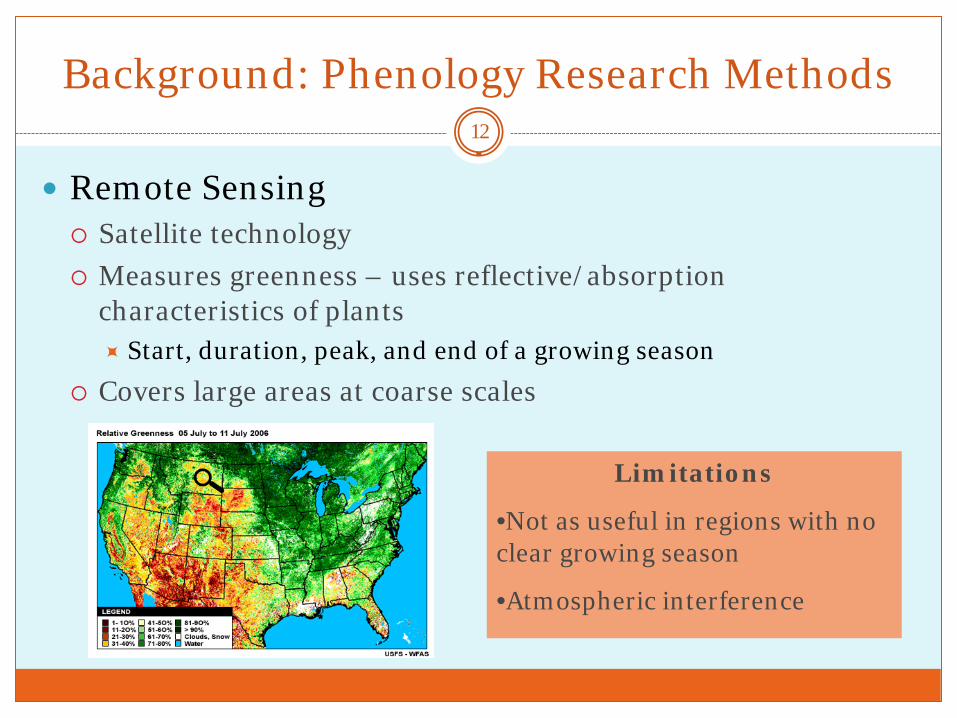
Background: Phenology Research Methods
Remote Sensing Satellite technology Measures greenness – uses reflective/absorption
characteristics of plants Start, duration, peak, and end of a growing season
Covers large areas at coarse scales
Limitations
•Not as useful in regions with no clear growing season
•Atmospheric interference
12
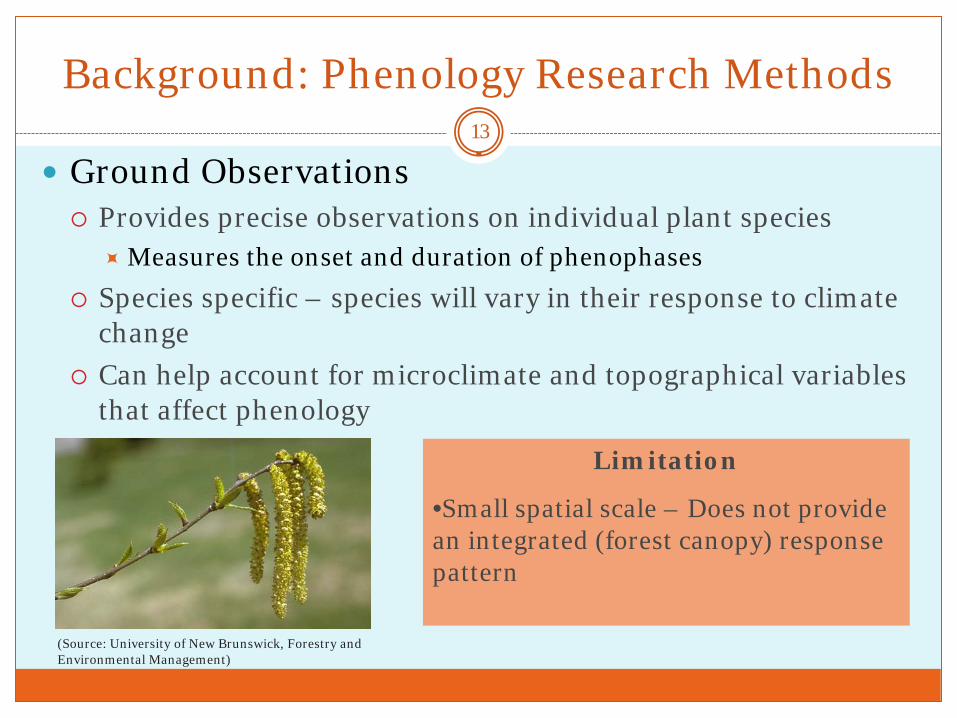
Background: Phenology Research Methods
Ground Observations Provides precise observations on individual plant species
Measures the onset and duration of phenophases Species specific – species will vary in their response to climate
change Can help account for microclimate and topographical variables
that affect phenology Limitation
•Small spatial scale – Does not provide an integrated (forest canopy) response pattern
(Source: University of New Brunswick, Forestry and Environmental Management)
13
Background: Phenology Research Methods
Bridging the gap The development of ground observation protocols specific to
validating remote sensing phenology Increase in ground observation networks
USA-NPN, Project Budburst, PlantWatch (Canada), Nature’s Calendar (UK), Appalachian Mountain Club, Botanical Gardens
Increase in research sites monitoring phenology Hubbard Brook, Vermont Monitoring Cooperative, NPS, PSU,
Appalachian Mountain Club
14
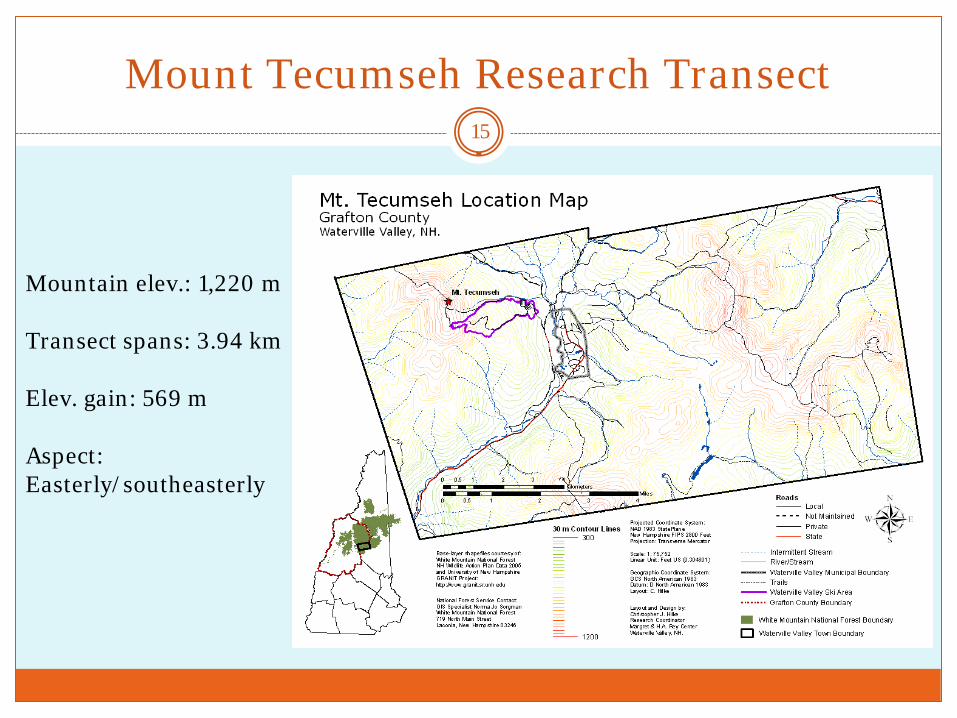
Mount Tecumseh Research Transect
Mountain elev.: 1,220 m Transect spans: 3.94 km Elev. gain: 569 m Aspect: Easterly/southeasterly
15
Methods: Vegetation Monitored
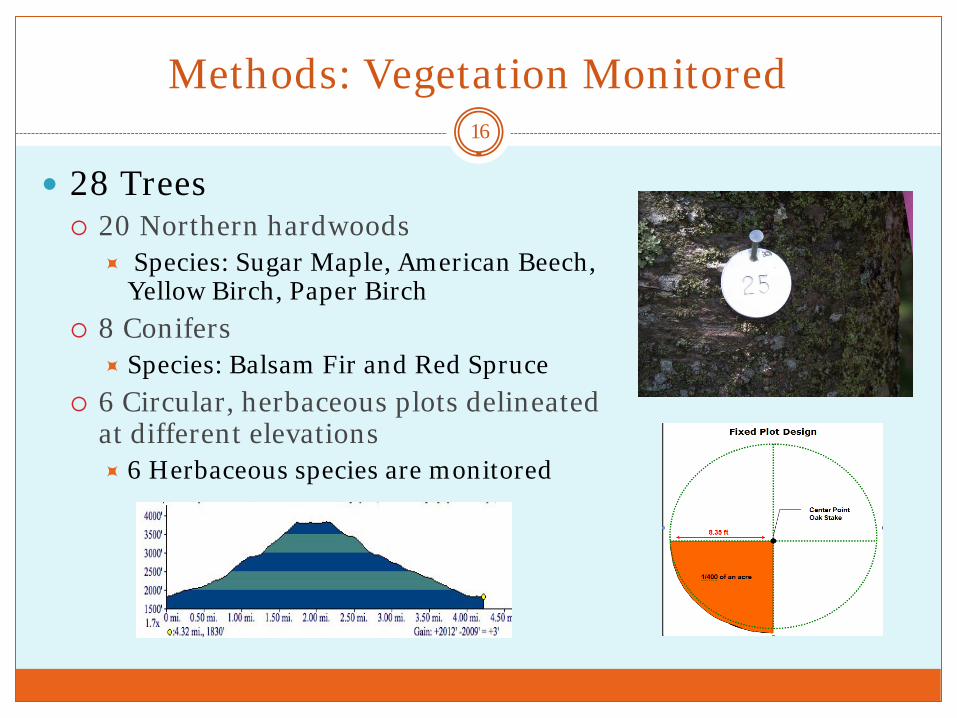
28 Trees 20 Northern hardwoods
Species: Sugar Maple, American Beech, Yellow Birch, Paper Birch
8 Conifers Species: Balsam Fir and Red Spruce
6 Circular, herbaceous plots delineated at different elevations 6 Herbaceous species are monitored
16
Methods: Vegetation Data Collection
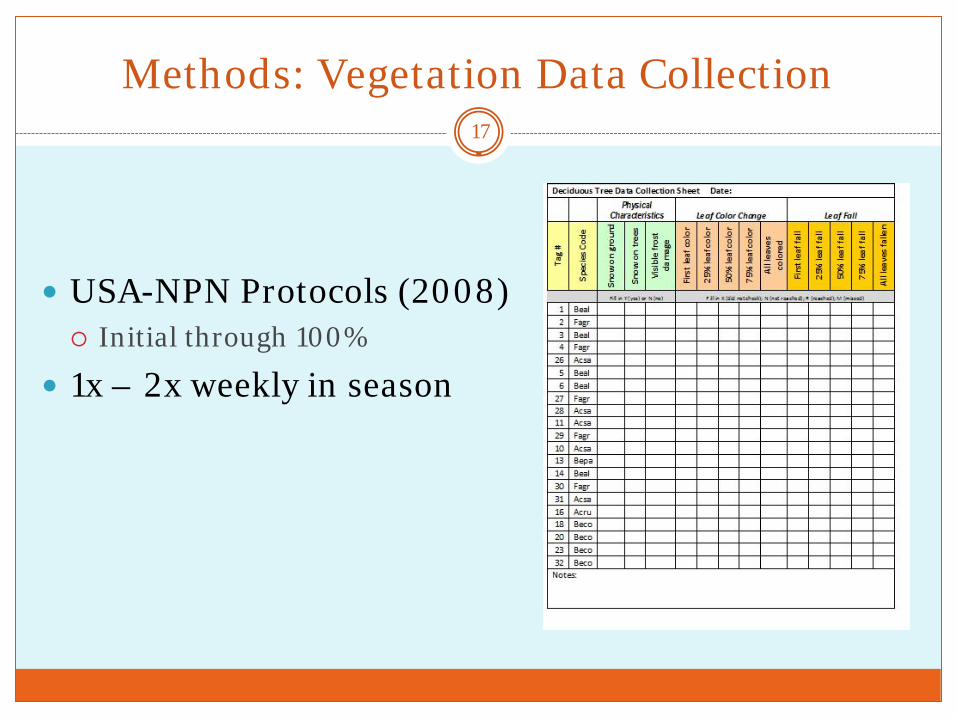
USA-NPN Protocols (2008) Initial through 100%
1x – 2x weekly in season
17
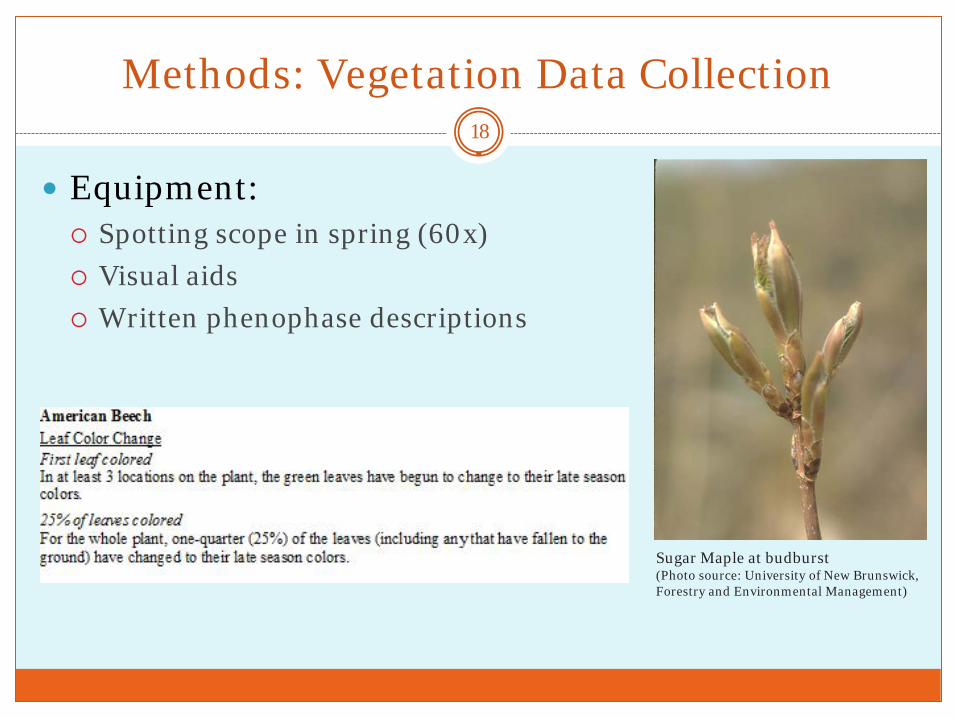
Methods: Vegetation Data Collection
Equipment: Spotting scope in spring (60x) Visual aids Written phenophase descriptions
Sugar Maple at budburst (Photo source: University of New Brunswick, Forestry and Environmental Management)
18
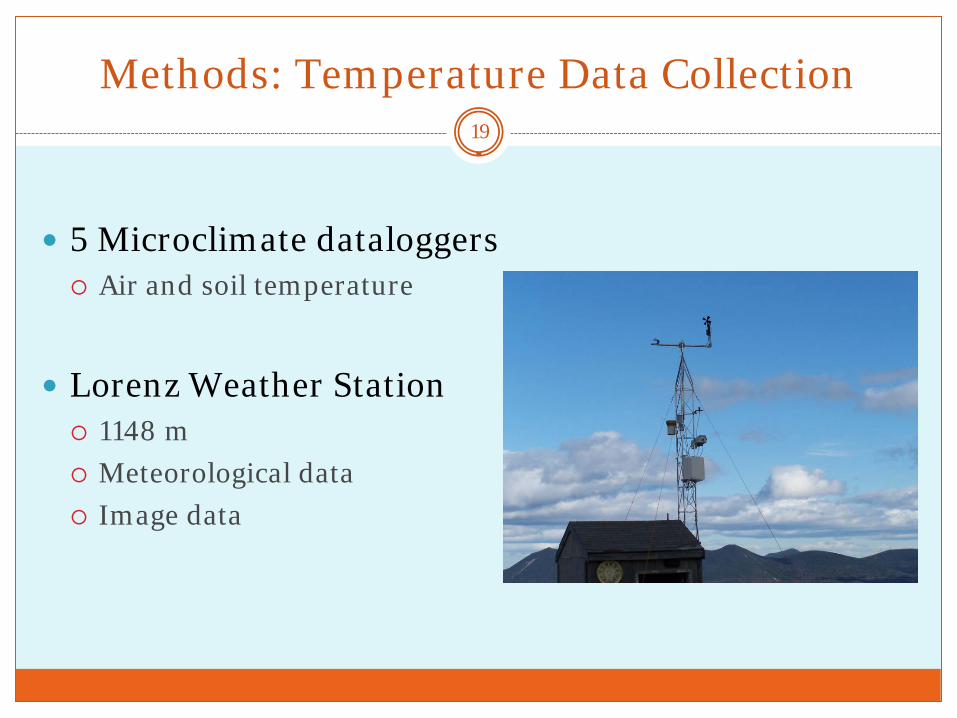
Methods: Temperature Data Collection
5 Microclimate dataloggers Air and soil temperature
Lorenz Weather Station 1148 m Meteorological data Image data
19
Methods: Data Analysis
Phenophase events analyzed: Spring – budburst & leaf elongation progression (LE) Autumn – first leaf color & leaf color progression (LC)
first leaf fall & leaf fall progression (LF)
Occurrence values compared: Day-of-year (DOY) – day of year of a phenophase occurrence Accumulated degree-days (ADD) – amount of accumulated
degree days achieved at phenophase occurrence (Max temp + Min temp)/2 – Base temp = ADD
20
Research Objectives
Gather data on the timing of basic phenological
stages of trees and plants along an elevation gradient
Correlate the relationship between the vegetation data and air temperature to determine the threshold temperatures responsible for triggering phenophases (e.g, budburst, first leaf color)
21
Research Questions
Is there evidence of variation in the phenology of trees relative to either temperature or day-of-year?
Is there evidence of trends in the variation of the phenology of trees relative to their location along an elevation gradient?
Is the phenology of trees representative of regional phenological trends?
22
Results: General Species Patterns
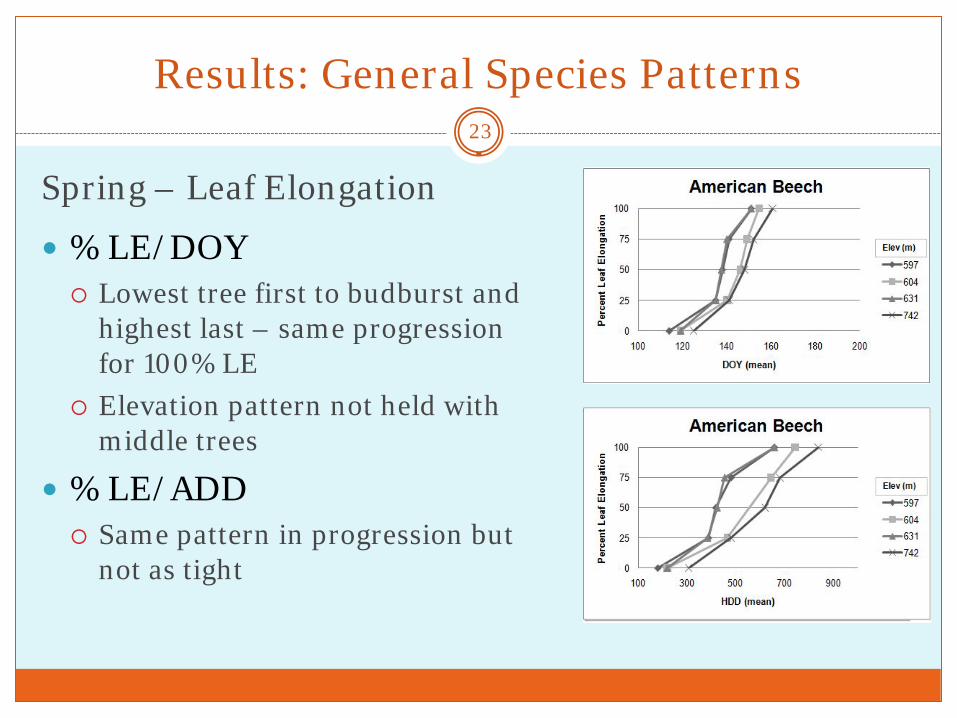
Spring – Leaf Elongation
% LE/DOY Lowest tree first to budburst and
highest last – same progression for 100% LE
Elevation pattern not held with middle trees
% LE/ADD Same pattern in progression but
not as tight
23
Results: Comparison Among Species
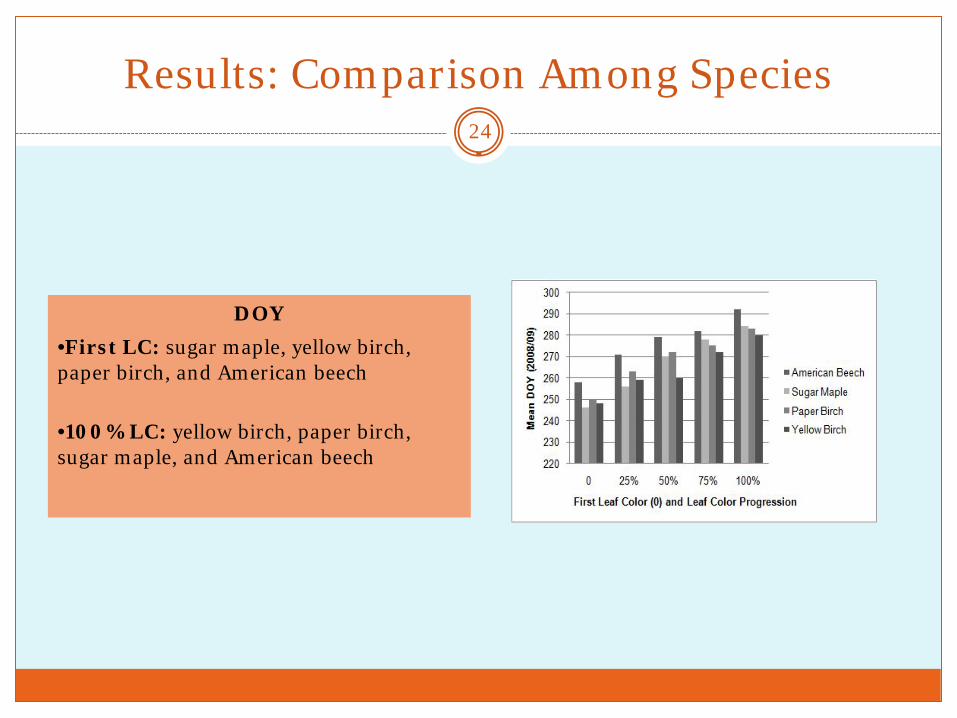
DOY •First LC: sugar maple, yellow birch, paper birch, and American beech
•100% LC: yellow birch, paper birch, sugar maple, and American beech
24
Results: Threshold Temperatures
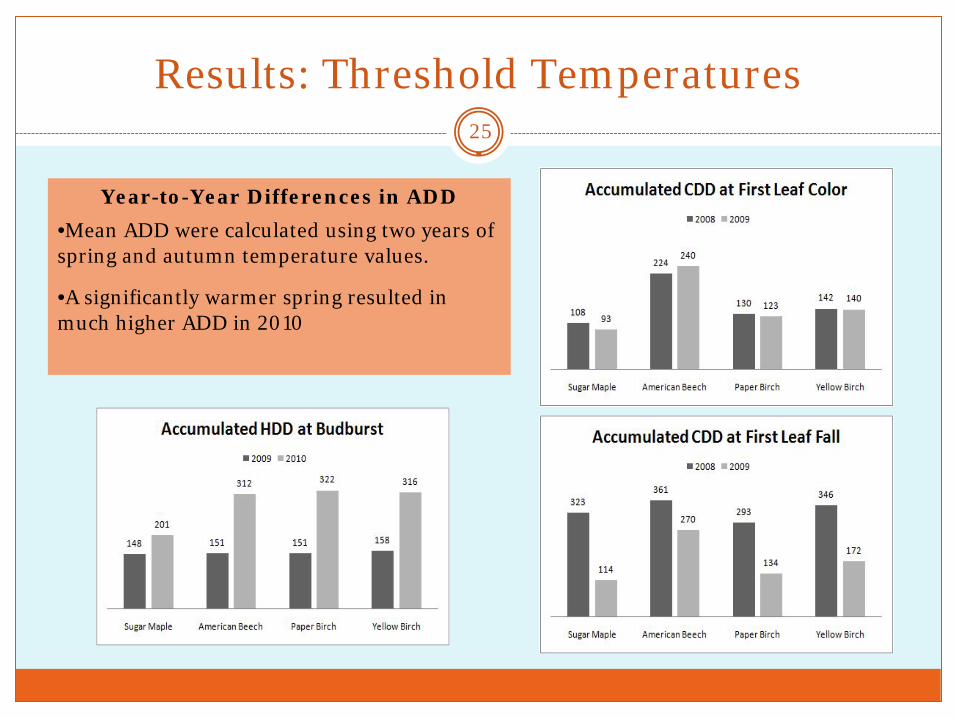
Year-to-Year Differences in ADD •Mean ADD were calculated using two years of spring and autumn temperature values.
•A significantly warmer spring resulted in much higher ADD in 2010
25
Discussion & Conclusions: Elevation Trends
Elevation Trends: Spring comes later and autumn sooner at higher
elevations on Mount Tecumseh.
This trend in phenology is in accord with a noted delay in spring and the advance in autumn calculated along the elevation gradient. On Mount Tecumseh we calculated a delay in spring of 0.93
days/30 m in elevation gain and a delay in autumn (1.46 days/30 m in elevation loss).
Mid-elevation trees did not always follow this trend.
26
Discussion & Conclusions: Species Variations
Recent phenological studies of northern hardwood
trees and their phenology have indicated variation in the timing of phenological events across species. Hubbard Brook Experimental Forest, Thornton, NH (1989 –
2002) (Richardson, et al., 2006)
Vermont Monitoring Cooperative, Mount Mansfield, VT (1992 – 1995) (Wilmot, et al. 1995)
27
Discussion & Conclusions: Species Variations
Species Trends – Regional Variations:
Results on Mount Tecumseh confirmed the order of progression of spring and autumn phenology for several northern hardwood tree species as evidenced at Hubbard Brook.
There is a marked advance in spring phenology and a delay in autumn, evidenced by comparison between Mounts Tecumseh and Mansfield.
28
Ongoing Work
Fourth year of observation
Analyze affects of other factors that influence phenology (microclimates, age, species origin, temperature gradients)
Continue analysis of data in context of other regional phenology datasets
Develop validation methods to test accuracy of observer records
29
The Education 30
Graduate student research Applied education and internship opportunities In the classroom Informal public education and citizen science
The Education 31
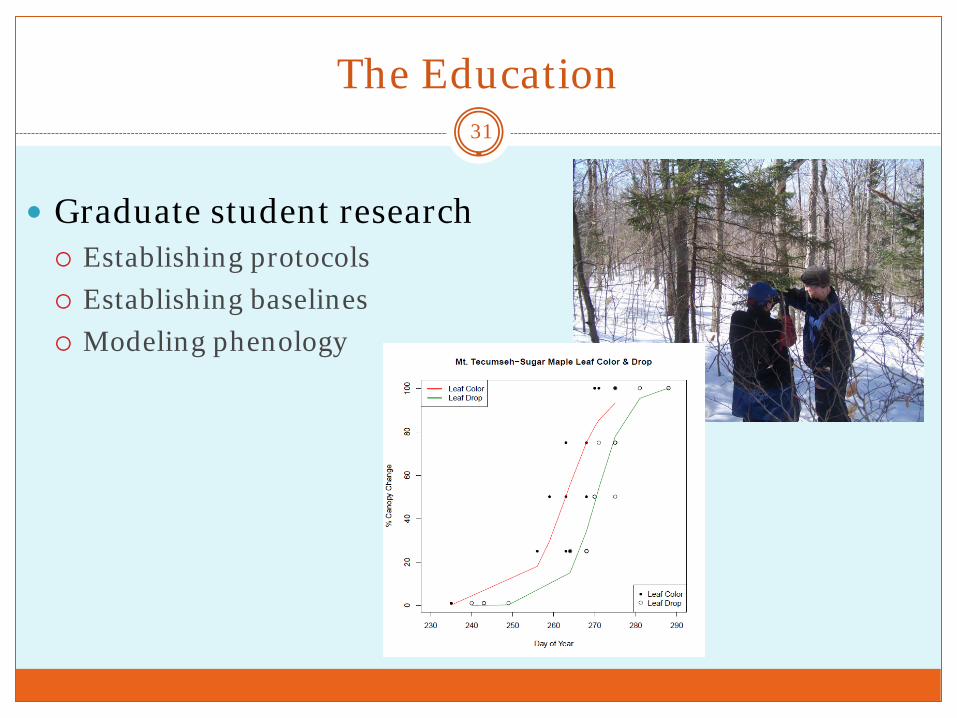
Graduate student research Establishing protocols Establishing baselines Modeling phenology
The Education 32
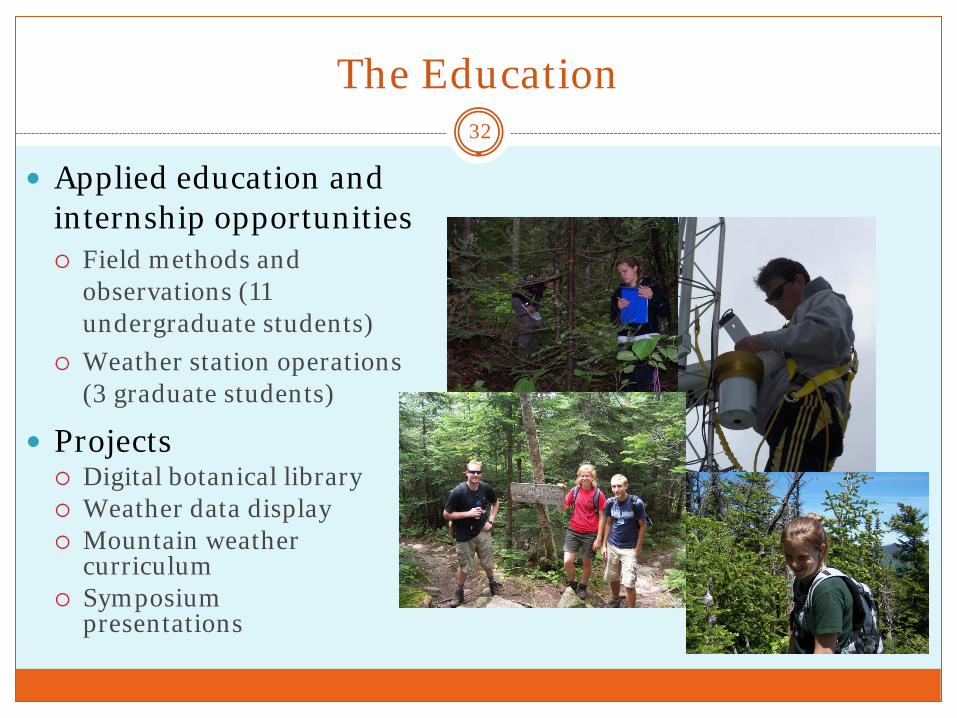
Applied education and internship opportunities Field methods and
observations (11 undergraduate students)
Weather station operations (3 graduate students)
Projects Digital botanical library Weather data display Mountain weather
curriculum Symposium
presentations
The Education 33
In the classroom Phenology and Climate Curriculum
Middle school to high school students Basic principles that cause the physical change of forest vegetation
due to seasonality Use of real-time data to create and comprehend visual graphs and
charts Basic principles of scientific inquiry and the formation of a testable
scientific question Provides teacher training and support for continued observations
in-field or on school grounds Coos County Outreach Initiative support for North Country
implementation
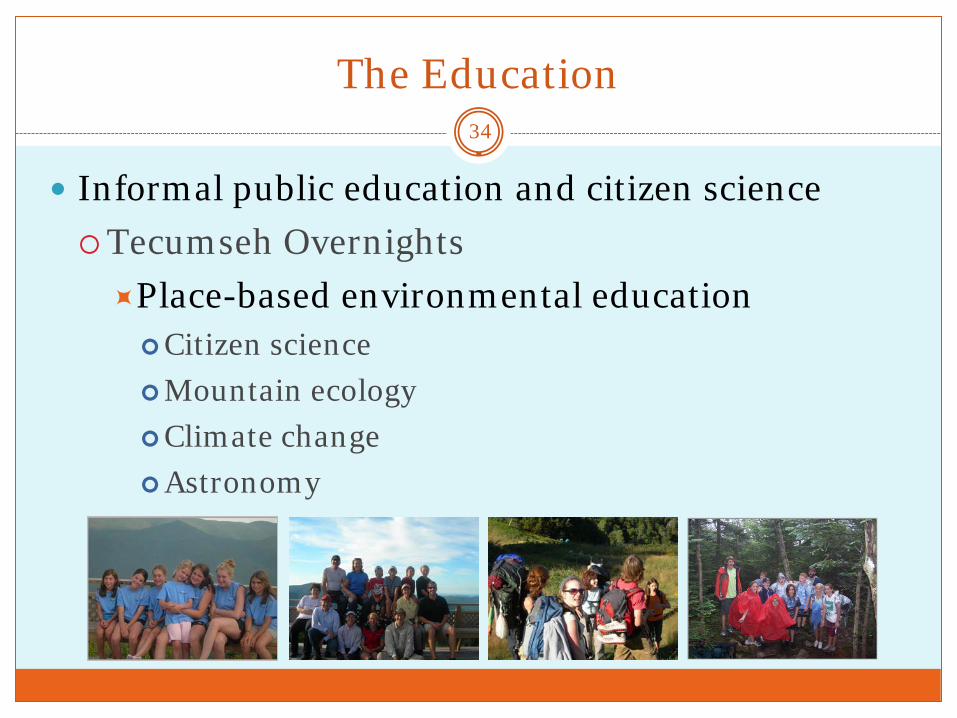
The Education 34
Informal public education and citizen science Tecumseh Overnights Place-based environmental education Citizen science Mountain ecology Climate change Astronomy
Ongoing Work
Continue to create opportunities for graduate and undergraduate students
Expand the implementation of the Phenology and Climate curriculum in the classroom and in the field
Develop a citizen science program to support the long-term collection of phenology data
35
Acknowledgements 36
CCOI Center for Rural
Partnerships
Acknowledgements, cont.
Dr. Michele Pruyn, Assistant Professor of Biological Sciences, PSU
Margret & H.A. Rey Center – its Board of Directors and staff
Thomas Boucher, Associate Professor of Statistics, PSU
Graduate & undergraduate students: Matt Bedard, Jessica Brennan, Maegan Gagne, Amanda Hook, Jacqulyn Huckins, Joe Molloy, Josh Roberti, Alex Sargent, Jim VanGyzen, and others
37

Questions?
38