Embed Size (px)
Citation preview
A Forrester Total Economic Impact™
Study Commissioned By Dynatrace
November 2018
The Total Economic Impact™ Of Dynatrace
Cost Savings And Business Benefits Enabled By AI Powered Software Intelligence
Table Of Contents Executive Summary 1
Key Findings 2
TEI Framework And Methodology 4
The Dynatrace Customer Journey 5
Interviewed Organizations 5
Key Challenges 5
Key Results 6
Composite Organization 7
Analysis Of Benefits 9
IT Operations And Help Desk Time Savings, From Existing State 9
End User Productivity Recovery 11
Development Savings From Reduced Dev And Test Cycles 12
Time-To-Value Benefit Of Faster Application Delivery 13
Application Performance Incident Avoidance On New Buildouts 14
Revenue Capture From Segment Addressability 15
Unquantified Benefits 17
Flexibility 18
Analysis Of Costs 19
Dynatrace License And Support-Related Costs 19
Training And Ramp Time Necessary To Fully Leverage Dynatrace 20
Financial Summary 22
Dynatrace: Overview 23
Appendix A: Total Economic Impact 25
Project Director:
Henry Huang
ABOUT FORRESTER CONSULTING
Forrester Consulting provides independent and objective research-based
consulting to help leaders succeed in their organizations. Ranging in scope from a
short strategy session to custom projects, Forrester’s Consulting services connect
you directly with research analysts who apply expert insight to your specific
business challenges. For more information, visit forrester.com/consulting.
© 2018, Forrester Research, Inc. All rights reserved. Unauthorized reproduction
is strictly prohibited. Information is based on best available resources.
Opinions reflect judgment at the time and are subject to change. Forrester®,
Technographics®, Forrester Wave, RoleView, TechRadar, and Total Economic
Impact are trademarks of Forrester Research, Inc. All other trademarks are the
property of their respective companies. For additional information, go to
forrester.com.
1 | The Total Economic Impact™ Of Dynatrace
Executive Summary
Dynatrace™ is a full stack solution that covers application performance
management, digital experience management, infrastructure monitoring
and AIOps. Dynatrace commissioned Forrester Consulting to conduct a
Total Economic Impact™ (TEI) study and examine the potential return on
investment (ROI) enterprises may realize by deploying Dynatrace™. This
study provides readers with a framework to evaluate the potential financial
impact of Dynatrace™ on their organizations and how it can affect business
operations and users of all types when moving from prior-generation
application performance management (APM) toolsets.
To better understand the benefits, costs, and risks associated with this
investment, Forrester interviewed seven customers with years of
experience using the Dynatrace platform. Our findings revealed that the
AI-powered software intelligence platform performed well across entire IT
stacks — for those organizations using enterprise cloud as well as those
on traditional on-premises infrastructures. Several primary attributes of
Dynatrace were particularly helpful for organizations:
› AI-powered full-stack analyses help multiple groups within IT, providing
decipherable insights rather than extraneous data — to mitigate and
even prevent performance degradations with speedy identification.
› Easily deployable agents can be stood up across the infrastructure, in
hours, not months, even on a multicloud environment.
› Granularity of detection across the entire IT stack brings clear visibility to
interdependencies between data flows.
With Dynatrace, customers markedly improved their efficiency in handling
application performance issues, lifting service levels higher and boosting
end user satisfaction and productivity. Further, the Dynatrace platform
enabled organizations to streamline reliable application and service
delivery at scale, making it possible for these businesses to align with the
age of the customer where the quality of the customer experience (CX)
means the difference between success or failure.
Internal business users and external consumers expect a high level of
service delivery and availability in this day and age where the digital
experience is paramount. Prior to using Dynatrace, customers
experienced a multitude of issues with the delivery of applications to end
users. Commonly mentioned shortcomings with previous solutions were:
› Organizations could not resolve application issues efficiently, tying up
high value people resources in war room situations.
› In some instances, the organizations were unable to find resolutions at
all, causing protracted performance degradation to persist until the
issues had subsided on their own.
› Older solutions did not provide analytical clarity around the root cause of
incidents. Were these problems a factor of bad code, or were they
infrastructure-related problems?
Ultimately, early generations of APM solutions yielded limited success at
best and kept the organizations guessing as to where application
performance and delivery issues truly rested. As one interviewee put it:
“When we had performance issues with our previous solution, all it could
do is tell us we were having an issue, not necessarily what the issue was.
We had to find the issue on our own.”
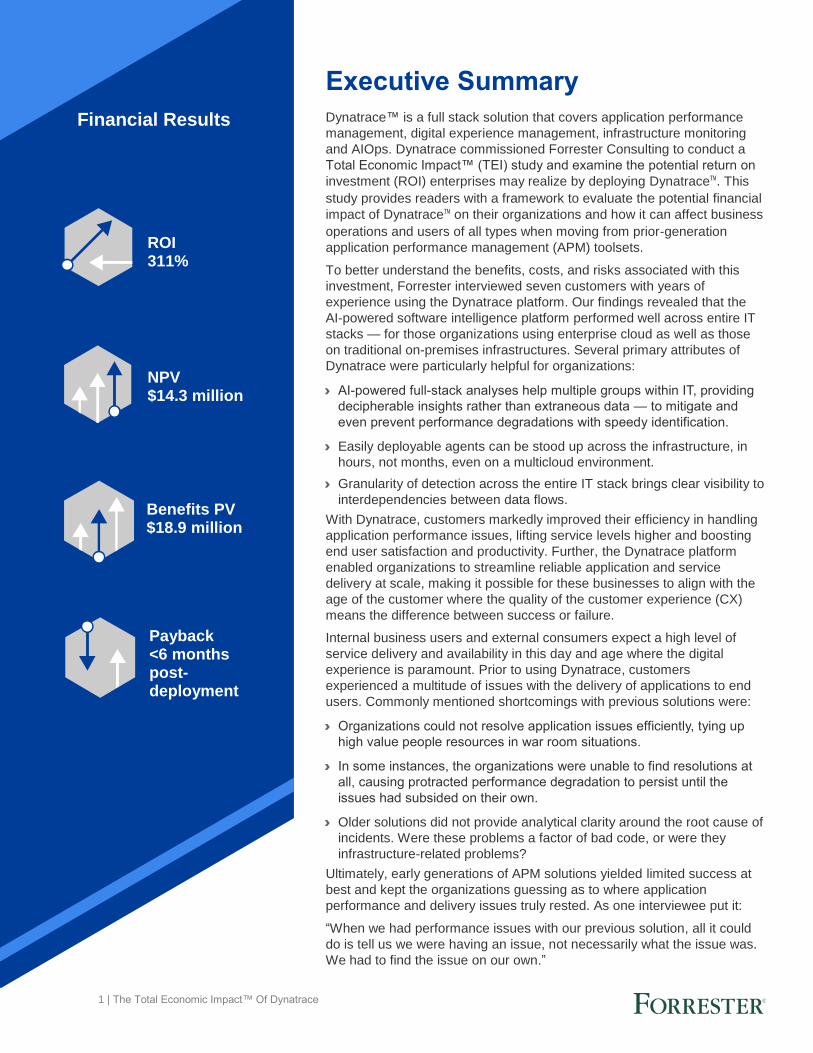
Financial Results
Benefits PV $18.9 million
NPV $14.3 million
Payback <6 months post-deployment
ROI 311%
2 | The Total Economic Impact™ Of Dynatrace
Key Findings
Quantified benefits. The following risk-adjusted present value (PV)
quantified benefits are representative of those experienced by the
companies interviewed:
› More accurate insights rather than superfluous and uncorrelated
data help the greater IT group improve efficiency. Organizations
described their stockpiles of logs and reports, which were often manually
generated. The interviewed organizations wanted earlier incident
detection and usable information that they could use to remediate
existing code to identify bottlenecks in the infrastructure. Organizations
experienced war room scenarios that took hours from members of
varying IT groups; Dynatrace decreased the total time wasted, driven by
a mean-time-to-identify (MTTI) reduction of 75% from previous-
generation APM tools. IT help desk operations were also relieved to see
a decline in performance-related calls due to better customer
experiences delivered. AI-led analyses and detection saved IT groups
and DevOps the equivalent of $2.4 million over three years, PV.
› Fewer performance incidents and faster resolution time result in
greater business end user productivity. As resolution times
decreased and IT groups became more proactive with the Dynatrace
solution, internal business users benefited, noticing everything from
snappier performance to fewer serious performance degradations. Poor
performance equated to 8 minutes per incident — and across an
enterprise at which 10% of an affected workforce could mean over 2,000
users, the effects can be profound. Dynatrace reduced issues an
additional 40% over legacy APM toolsets. We estimate that a typical
enterprise would gain over $4.4 million in productivity.
› Using Dynatrace during the development process saves significant
developer effort for new and ongoing projects. Developers save time
beyond fewer and quicker war room resolutions if leveraging Dynatrace
fully. When integrated into a workflow for application development,
Dynatrace can cut down testing and redundant development cycles by
as much as 45%. Three-year savings for developers who are commonly
expensive to hire and difficult to retain amount to nearly $5.7 million, PV.
› Application delivery to market speed improved, bringing revenues
to organizations sooner. As development accelerated, organizations
reported an earlier introduction of services to the market — enabling an
ongoing quicker recognition of revenues. B2B and B2C organizations
alike will benefit from this, with an estimated amount of $2.2 million, PV.
› New application and enhancement buildouts leveraging Dynatrace
during the development process avoid performance incidents from
the start. Being able to test code in various scenarios on infrastructure
helps organizations avoid future performance issues as projects are
tested from development conception. Over a three-year timeframe, the
expected benefit is $1.2 million, PV.
› Full-stack visibility even across the cloud enables organizations to
move forward with digital transformation efforts faster, opening
new revenue possibilities while minimizing the risk of introducing
application issues. With full-cloud and container monitoring, Dynatrace
can move organizations through their digital transformation efforts much
faster to support customers at scale. The value of addressing new
customers across new segments without diminishing customer
experience is conservatively valued at $3.0 million PV over three years.
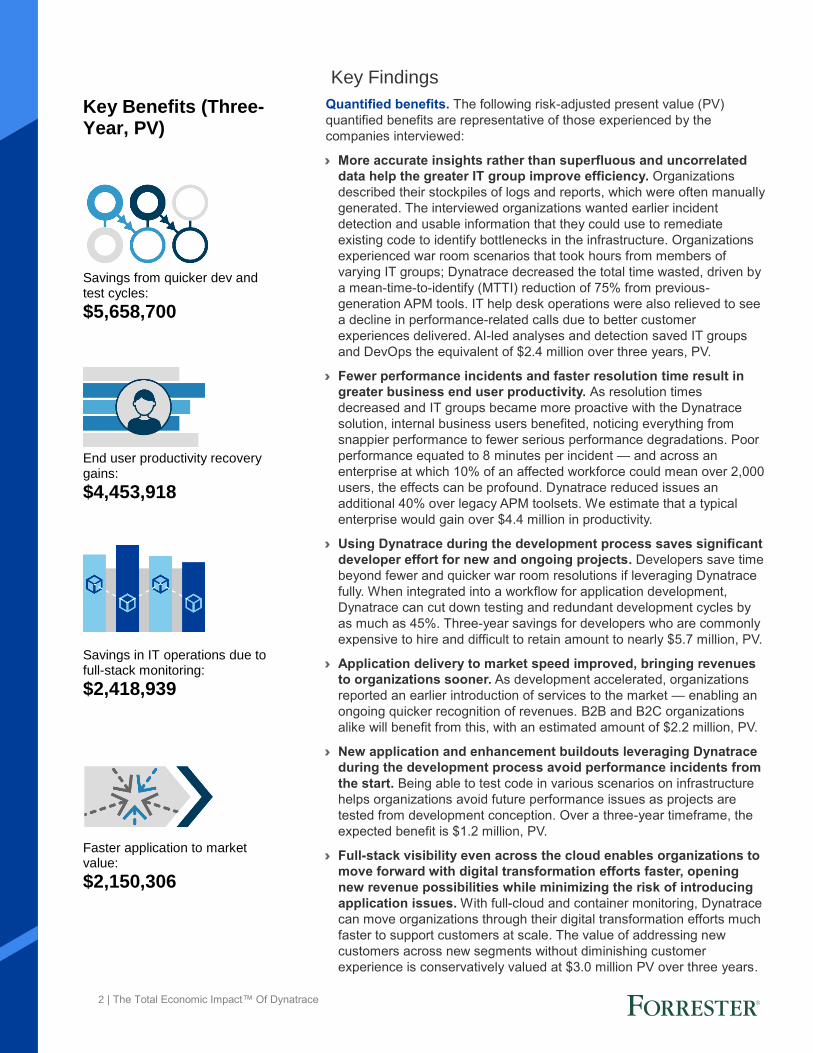
Key Benefits (Three-Year, PV) re Benefits
Savings from quicker dev and test cycles:
$5,658,700
End user productivity recovery gains:
$4,453,918
Savings in IT operations due to full-stack monitoring:
$2,418,939 Faster application to market value:
$2,150,306
3 | The Total Economic Impact™ Of Dynatrace
Unquantified benefits. The interviewed organizations experienced the
following benefits, which are not quantified for this study:
› Coverage of multicloud and containers may provide physical
infrastructure cost benefits. The movement toward more flexible
infrastructures — especially those organizations on multicloud or hybrid
scenarios — can improve the efficiency of infrastructure utilization,
leading to lower capex and opex. As organizational shifts toward this
model are highly variable depending on IT spend allocations, this benefit
has not been quantified in this study.
› The consolidation and sunsetting of legacy tools used previously
to monitor applications and infrastructure, and to determine faults,
can produce a dramatic cost savings. Dynatrace as a full-stack
platform replaces many of the wide-ranging toolsets to manage
experience delivery. These legacy toolsets have hard product costs
along with associated service and support plans, commonly at an
additional 20% of tool subscription costs. Additional indirect costs like
that of administration and functionality buildouts of existing solutions on
older-generation solutions have not been quantified in this study but can
be substantial when collapsing the toolset stack.
Costs. The interviewed organizations experienced the following risk-
adjusted PV costs:
› License, support, and customer success-related costs equate to
$4.4 million over the course of three years, in PV. These costs are
charged yearly as a subscription, inclusive of Digital Experience
Management. Costs reflect a tiered approach to adoption of Dynatrace,
with more host units added to the license annually.
› Training and ramp-up time are important but form only a small
portion of costs to run Dynatrace. The Dynatrace solution puts forth
an intuitive graphical user interface (GUI) that is easy to learn for most
incident responders. Developers, however, need training to understand
how to incorporate the platform into their software development cycles to
improve efficiency. In all, the training and ramp time necessary to fully
leverage Dynatrace over three years, accounting for turnover as well as
increasing usage, is $236,169, PV.
Forrester’s interviews with seven existing customers and subsequent
financial analysis found that a composite organization based on these
interviewed organizations experienced benefits of $18.9 million over three
years versus costs of $4.6 million, adding up to a net present value (NPV)
of $14.3 million and an ROI of 311%.
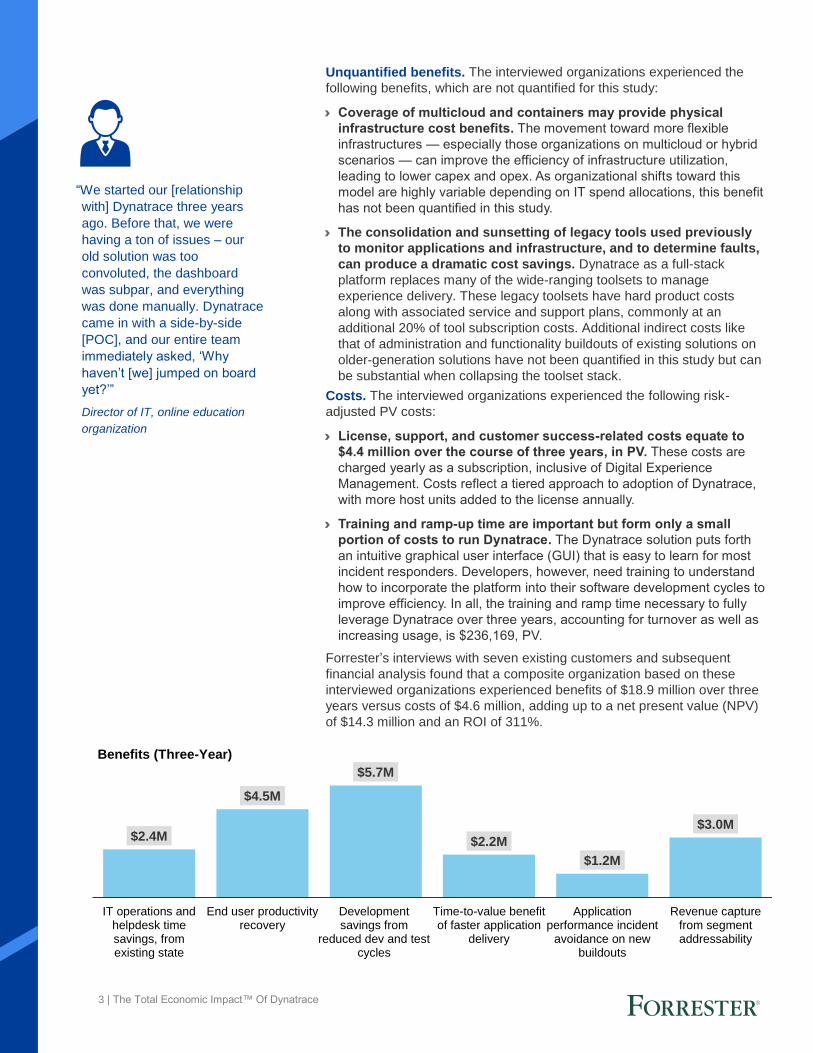
$2.4M
$4.5M
$5.7M
$2.2M
$1.2M
$3.0M
IT operations andhelpdesk timesavings, fromexisting state
End user productivityrecovery
Developmentsavings from
reduced dev and testcycles
Time-to-value benefitof faster application
delivery
Applicationperformance incident
avoidance on newbuildouts
Revenue capturefrom segmentaddressability
Benefits (Three-Year)
“We started our [relationship
with] Dynatrace three years
ago. Before that, we were
having a ton of issues – our
old solution was too
convoluted, the dashboard
was subpar, and everything
was done manually. Dynatrace
came in with a side-by-side
[POC], and our entire team
immediately asked, ‘Why
haven’t [we] jumped on board
yet?’”
Director of IT, online education
organization
4 | The Total Economic Impact™ Of Dynatrace
TEI Framework And Methodology
From the information provided in the interviews, Forrester has constructed
a Total Economic Impact™ (TEI) framework for those organizations
considering implementing Dynatrace.
The objective of the framework is to identify the cost, benefit, flexibility, and
risk factors that affect the investment decision. Forrester took a multistep
approach to evaluate the impact that Dynatrace can have on an
organization:
DUE DILIGENCE Interviewed Dynatrace stakeholders and Forrester analysts to gather data relative to Dynatrace.
CUSTOMER INTERVIEWS Interviewed seven organizations using Dynatrace to obtain data with respect to costs, benefits, and risks.
COMPOSITE ORGANIZATION Designed a composite organization based on characteristics of the interviewed organizations.
FINANCIAL MODEL FRAMEWORK Constructed a financial model representative of the interviews using the TEI methodology and risk-adjusted the financial model based on issues and concerns of the interviewed organizations.
CASE STUDY Employed four fundamental elements of TEI in modeling Dynatrace’s impact: benefits, costs, flexibility, and risks. Given the increasing sophistication that enterprises have regarding ROI analyses related to IT investments, Forrester’s TEI methodology serves to provide a complete picture of the total economic impact of purchase decisions. Please see Appendix A for additional information on the TEI methodology.
The TEI methodology
helps companies
demonstrate, justify,
and realize the
tangible value of IT
initiatives to both
senior management
and other key
business
stakeholders.
DISCLOSURES
Readers should be aware of the following:
This study is commissioned by Dynatrace and delivered by Forrester
Consulting. It is not meant to be used as a competitive analysis.
Forrester makes no assumptions as to the potential ROI that other
organizations will receive. Forrester strongly advises that readers use their own
estimates within the framework provided in the report to determine the
appropriateness of an investment in Dynatrace.
Dynatrace reviewed and provided feedback to Forrester, but Forrester
maintains editorial control over the study and its findings and does not accept
changes to the study that contradict Forrester’s findings or obscure the
meaning of the study.
Dynatrace provided the customer names for the interviews but did not
participate in the interviews.
5 | The Total Economic Impact™ Of Dynatrace
The Dynatrace Customer Journey
BEFORE AND AFTER THE DYNATRACE INVESTMENT
Interviewed Organizations
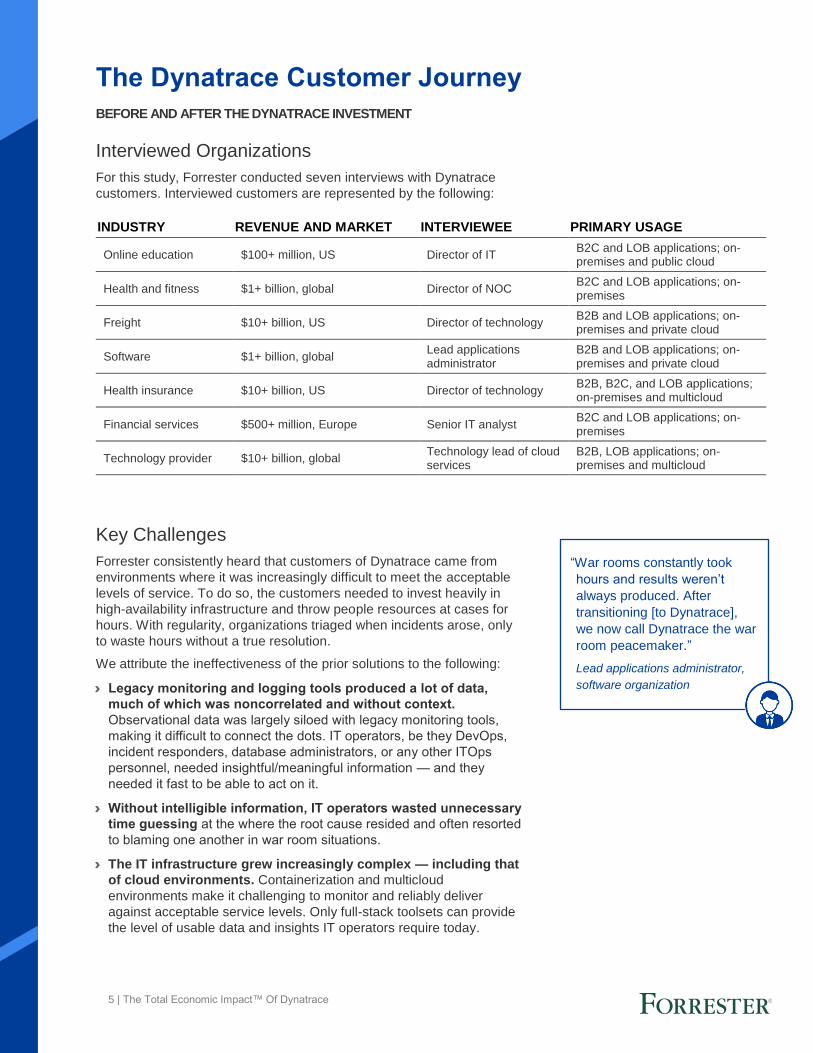
For this study, Forrester conducted seven interviews with Dynatrace
customers. Interviewed customers are represented by the following:
Key Challenges
Forrester consistently heard that customers of Dynatrace came from
environments where it was increasingly difficult to meet the acceptable
levels of service. To do so, the customers needed to invest heavily in
high-availability infrastructure and throw people resources at cases for
hours. With regularity, organizations triaged when incidents arose, only
to waste hours without a true resolution.
We attribute the ineffectiveness of the prior solutions to the following:
› Legacy monitoring and logging tools produced a lot of data,
much of which was noncorrelated and without context.
Observational data was largely siloed with legacy monitoring tools,
making it difficult to connect the dots. IT operators, be they DevOps,
incident responders, database administrators, or any other ITOps
personnel, needed insightful/meaningful information — and they
needed it fast to be able to act on it.
› Without intelligible information, IT operators wasted unnecessary
time guessing at the where the root cause resided and often resorted
to blaming one another in war room situations.
› The IT infrastructure grew increasingly complex — including that
of cloud environments. Containerization and multicloud
environments make it challenging to monitor and reliably deliver
against acceptable service levels. Only full-stack toolsets can provide
the level of usable data and insights IT operators require today.
INDUSTRY REVENUE AND MARKET INTERVIEWEE PRIMARY USAGE
Online education $100+ million, US Director of IT B2C and LOB applications; on-premises and public cloud
Health and fitness $1+ billion, global Director of NOC B2C and LOB applications; on-premises
Freight $10+ billion, US Director of technology B2B and LOB applications; on-premises and private cloud
Software $1+ billion, global Lead applications administrator
B2B and LOB applications; on-premises and private cloud
Health insurance $10+ billion, US Director of technology B2B, B2C, and LOB applications; on-premises and multicloud
Financial services $500+ million, Europe Senior IT analyst B2C and LOB applications; on-premises
Technology provider $10+ billion, global Technology lead of cloud services
B2B, LOB applications; on-premises and multicloud
“War rooms constantly took
hours and results weren’t
always produced. After
transitioning [to Dynatrace],
we now call Dynatrace the war
room peacemaker.”
Lead applications administrator,
software organization
6 | The Total Economic Impact™ Of Dynatrace
› Raw growth of code led by the need to build custom services —
in some instances in different programming languages — was
largely a black box for legacy APM. The sprawl of data and services
required to run organizations has seen explosive growth and makes
legacy monitoring tools largely obsolete as these tools offer no code-
level visibility on newer languages.
› Performance degradation incidents happened unexpectedly —
and sometimes resolved themselves before operators could fix
the real problem. Issues can arise and go away before organizations
can properly identify the root cause, leaving these problems as
exposure points that can repeatedly cause problems.
All of the above contributed to a deeper problem: These organizations
were handicapped in their ability to address their customers. Regardless
of whether these customers were internal business users or external
consumers, organizations were losing dollars in the form of productivity,
(current and future) revenue, and, even worse, long-term brand
reputational harm.
Further worsening the matter, businesses that were engaged in digital
transformation found it extremely difficult to move forward relying on
traditional reactionary measures to application and services delivery. In a
world where developers are expensive to hire and retain, organizations
were forced to make things work by asking more of these already
overutilized personnel — especially those developers who were involved
with operations (DevOps).
Key Results
The interviews revealed that key results from the Dynatrace investment
include the following:
› Self-discovery by the Dynatrace OneAgent allows organizations
to be up and running quickly. It takes hours, not months, to stand up
the Dynatrace platform across the enterprise infrastructure. The
OneAgent self-discovers across all interdependencies and quickly
illustrates the stack, from infrastructure down to microservices. Auto-
baselining further reduces implementation effort, as it’s automated. An
IT director explained: “Deployment of our old solution was painful. . . .
We got this up and baselined in a week, and the actual deploy was
entirely automated. We didn’t have to do anything.”
› AI capabilities greatly reduce the mean-time-to-identify, bringing
dramatic drops to the effort IT groups need to exert. Interviewed
organizations saw a drop in MTTI and mean-time-to-resolve (MTTR),
making for less time spent in a war room and nipping of root-cause
issues immediately. On average, MTTI is down 75% from existing
legacy APM solution sets. “Our previous generation APM solutions still
required a lot of time and effort on our part to understand failures.
Dynatrace showed us the entire flow up to the failure so that we could
be proactive,” said a director of NOC.
“In working with Dynatrace at
multiple companies, I can say
that Dynatrace will show
problems far before everything
else — and the data will be
granular enough so that we
understood the
interdependencies and we can
actually fix it.”
Director of NOC, health and
fitness organization
“Dynatrace’s AI engine helps
our operators a lot. . . .
Prediction and actionable data
are now available, telling us
what might potentially break.
This is what I think makes the
solution priceless.”
Lead applications administrator,
software company
“Dynatrace differs from the
other tools in that it actually
attempts to analyze the root
cause of the problem and
points you in the right direction
specific to the area of code
you should look at.”
Director of IT, online education
organization
7 | The Total Economic Impact™ Of Dynatrace
› Performance-related incidents decrease greatly, raising
satisfaction of internal and external users. Businesses users are
recouping thousands of hours annually with Dynatrace. Without
accounting for external customers, the gain alone internally makes for
millions of dollars per year. An interviewee said: “We track the number
of our major incidents, and it has decreased year over year. Along with
that, minutes that individual users are impacted have also gone down
significantly.”
› Full-stack and multicloud intelligence future-proofs the Dynatrace
solution and accelerates digital transformation efforts. Customers
are more active about moving to flexible compute and storage
solutions on the cloud. Microservices and the interconnectivity between
data sources create a definitive need for such a solution as Dynatrace
so that as organizational application and service delivery models shift
to be more cloud and container based, the monitoring solution can still
provide a holistic view without breakages in monitoring. One
interviewee remarked: “Dynatrace has reinvented APM. They were the
only ones that were able to look inside containers.”
› Developers are freed to do what they are intended to do: deliver
value-add applications and enhancements. Teams can avoid
tedious hours spent triaging in the war room because of the Dynatrace
AI engine. Developers can focus on innovation and move back to real
development efforts. With the usage of Dynatrace in the software
development cycle, they can reduce development time by 45%, largely
by reducing testing times and rework processes. One director of IT
stated: “What’s really been key for us is to put Dynatrace in the hands
of our developers. That’s a big value driver for us.”
Composite Organization
Based on the interviews, Forrester constructed a TEI framework, a
composite company, and an associated ROI analysis that illustrates the
areas financially affected. The composite organization is representative
of the seven companies that Forrester interviewed and is used to present
the aggregate financial analysis in the next section. The composite
organization that Forrester synthesized from the customer interviews has
the following characteristics:
Description of composite. This North American-based but globally-
facing B2C organization had been steadily making strides in its digital
transformation efforts — both to expand serviceability of its client base
and to more effectively scale. Additional characteristics are as follows:
› It has annual revenues in the billions.
› It already had logging tools and legacy APM tools in place but felt that
its IT operations were still severely hampered by the inadequacy of this
toolset to operate effectively to identify issues across its IT stack.
› To keep pace with internal user and external customer expectations, it
required a modern monitoring solution that intelligently automated
many existing incident response workflows.
› It had traditionally been a reactionary organization in its approach with
its application performance issues — with no clear-cut way to
proactively reduce performance incidents.
› Mean-time-to-resolve was terribly slow and affected end user
productivity as well as customer perception of the brand.
Key assumptions
- Global B2C organization
- 20,900 business FTEs
- Migrating from previous-
generation/homegrown
legacy APM
- 120 internal developers
- Moving to a multicloud
infrastructure
“Auto discovery by the
Dynatrace agent is nothing
short of a miracle, especially
as we looked to scale to a
more dynamic infrastructure
on [a cloud computing
platform].”
Director of NOC, health and
fitness organization
8 | The Total Economic Impact™ Of Dynatrace
Prior to selecting Dynatrace as its APM solution, this organization
questioned whether it was effectively using its IT budget on a wide
assortment of tools to address a growing need to deliver consistent
application and service experiences. While delivery of new applications
and associated enhancements was not slow, there was a definitive need
to reduce strain on developers to fix issues when they could be instead
deployed to add value through new developments projects.
Deployment characteristics. The organization started deployment
across its on-premises infrastructure — primarily focusing on critical
applications. By the latter portion of the first year, the Dynatrace solution
effectiveness had warranted a move to expand its use to its cloud
infrastructure. Discovering that the Dynatrace agent was easily
deployable and effective at monitoring containerized applications, the
composite organization continued to expand the use of Dynatrace to
effectively accelerate and manage cloud-based applications residing on
a private cloud and public cloud. Effectively across a three-year span,
the composite leveraged Dynatrace in its internal- and external-facing
application bases, not only for monitoring, but also to rapidly flesh out its
digital transformation efforts.
“In APM, collecting data is the
easy part. AI is adding context
and interpreting these data
points to actually tell you when
there is something you should
be aware of. And that is
priceless because people get
desensitized to data. AI, in my
opinion, is one of the key
differentiating features of
Dynatrace.”
Technology lead of cloud
services, technology provider
9 | The Total Economic Impact™ Of Dynatrace
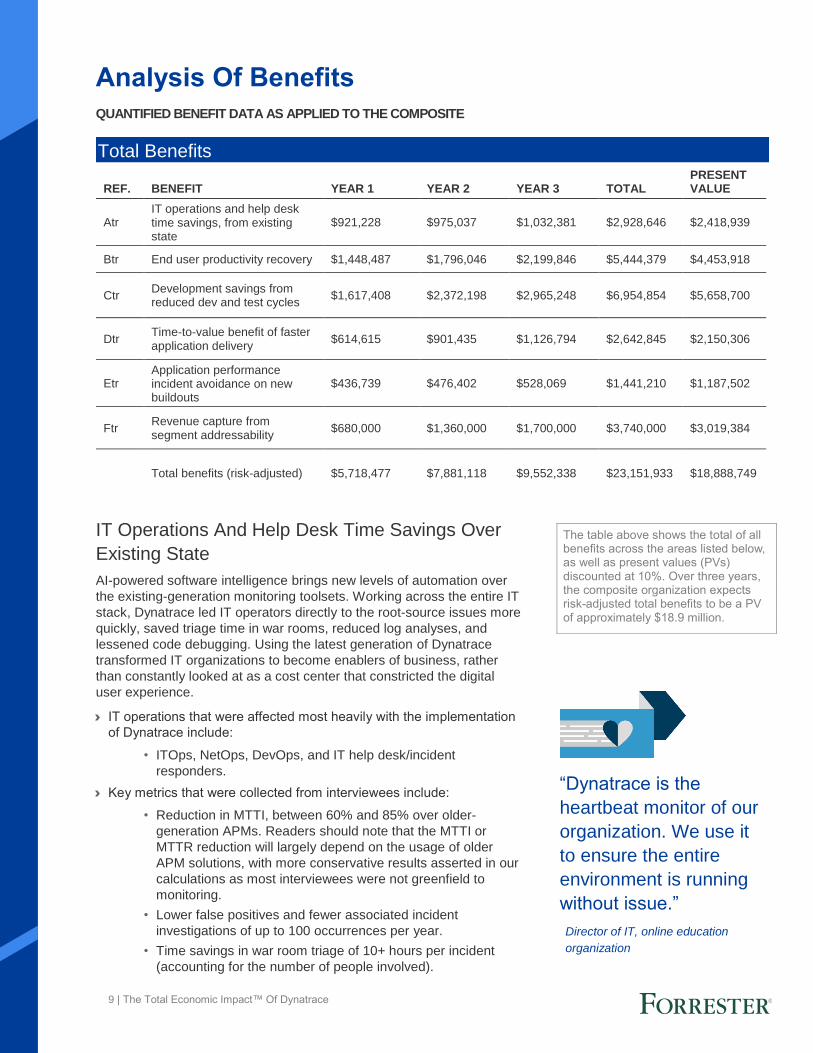
The table above shows the total of all benefits across the areas listed below, as well as present values (PVs) discounted at 10%. Over three years, the composite organization expects risk-adjusted total benefits to be a PV of approximately $18.9 million.
Analysis Of Benefits
QUANTIFIED BENEFIT DATA AS APPLIED TO THE COMPOSITE
IT Operations And Help Desk Time Savings Over
Existing State
AI-powered software intelligence brings new levels of automation over
the existing-generation monitoring toolsets. Working across the entire IT
stack, Dynatrace led IT operators directly to the root-source issues more
quickly, saved triage time in war rooms, reduced log analyses, and
lessened code debugging. Using the latest generation of Dynatrace
transformed IT organizations to become enablers of business, rather
than constantly looked at as a cost center that constricted the digital
user experience.
› IT operations that were affected most heavily with the implementation
of Dynatrace include:
• ITOps, NetOps, DevOps, and IT help desk/incident
responders.
› Key metrics that were collected from interviewees include:
• Reduction in MTTI, between 60% and 85% over older-
generation APMs. Readers should note that the MTTI or
MTTR reduction will largely depend on the usage of older
APM solutions, with more conservative results asserted in our
calculations as most interviewees were not greenfield to
monitoring.
• Lower false positives and fewer associated incident
investigations of up to 100 occurrences per year.
• Time savings in war room triage of 10+ hours per incident
(accounting for the number of people involved).
“Dynatrace is the
heartbeat monitor of our
organization. We use it
to ensure the entire
environment is running
without issue.”
Director of IT, online education
organization
Total Benefits
REF. BENEFIT YEAR 1 YEAR 2 YEAR 3 TOTAL PRESENT VALUE
Atr IT operations and help desk time savings, from existing state
$921,228 $975,037 $1,032,381 $2,928,646 $2,418,939
Btr End user productivity recovery $1,448,487 $1,796,046 $2,199,846 $5,444,379 $4,453,918
Ctr Development savings from reduced dev and test cycles
$1,617,408 $2,372,198 $2,965,248 $6,954,854 $5,658,700
Dtr Time-to-value benefit of faster application delivery
$614,615 $901,435 $1,126,794 $2,642,845 $2,150,306
Etr Application performance incident avoidance on new buildouts
$436,739 $476,402 $528,069 $1,441,210 $1,187,502
Ftr Revenue capture from segment addressability
$680,000 $1,360,000 $1,700,000 $3,740,000 $3,019,384
Total benefits (risk-adjusted) $5,718,477 $7,881,118 $9,552,338 $23,151,933 $18,888,749
10 | The Total Economic Impact™ Of Dynatrace
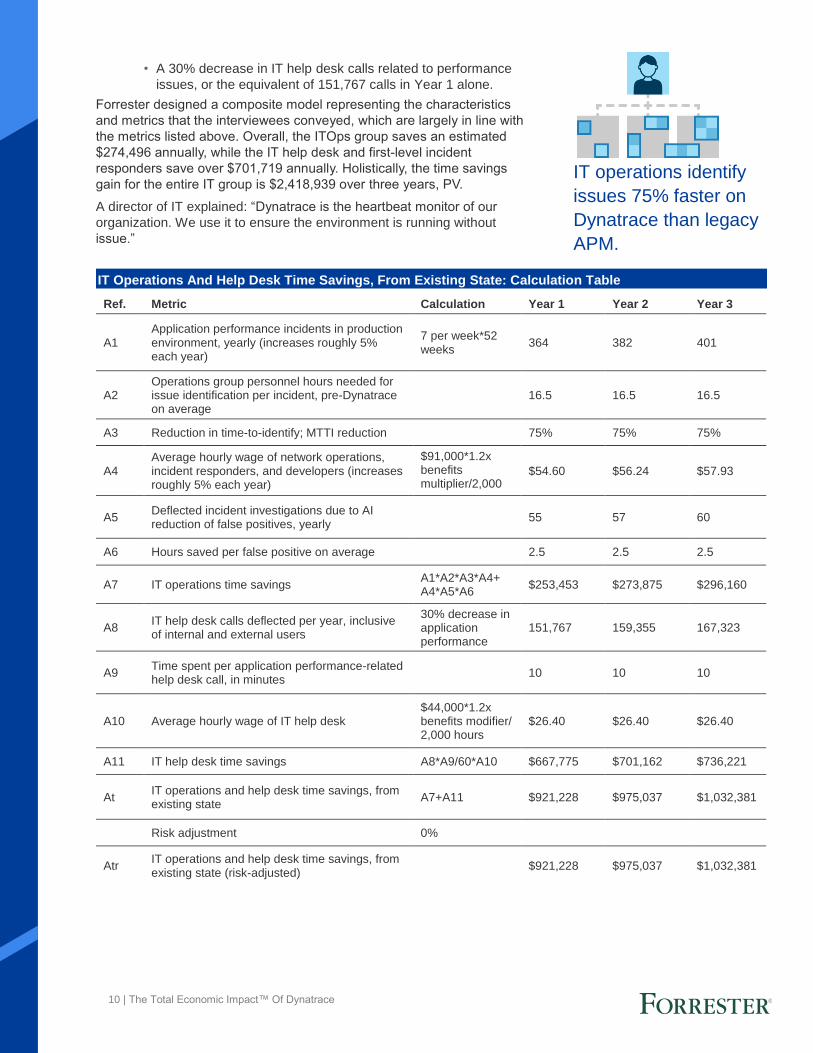
• A 30% decrease in IT help desk calls related to performance
issues, or the equivalent of 151,767 calls in Year 1 alone.
Forrester designed a composite model representing the characteristics
and metrics that the interviewees conveyed, which are largely in line with
the metrics listed above. Overall, the ITOps group saves an estimated
$274,496 annually, while the IT help desk and first-level incident
responders save over $701,719 annually. Holistically, the time savings
gain for the entire IT group is $2,418,939 over three years, PV.
A director of IT explained: “Dynatrace is the heartbeat monitor of our
organization. We use it to ensure the environment is running without
issue.”
IT Operations And Help Desk Time Savings, From Existing State: Calculation Table
Ref. Metric Calculation Year 1 Year 2 Year 3
A1 Application performance incidents in production environment, yearly (increases roughly 5% each year)
7 per week*52 weeks
364 382 401
A2 Operations group personnel hours needed for issue identification per incident, pre-Dynatrace on average
16.5 16.5 16.5
A3 Reduction in time-to-identify; MTTI reduction 75% 75% 75%
A4 Average hourly wage of network operations, incident responders, and developers (increases roughly 5% each year)
$91,000*1.2x benefits multiplier/2,000 hours
$54.60 $56.24 $57.93
A5 Deflected incident investigations due to AI reduction of false positives, yearly
55 57 60
A6 Hours saved per false positive on average 2.5 2.5 2.5
A7 IT operations time savings A1*A2*A3*A4+ A4*A5*A6
$253,453 $273,875 $296,160
A8 IT help desk calls deflected per year, inclusive of internal and external users
30% decrease in application performance related calls
151,767 159,355 167,323
A9 Time spent per application performance-related help desk call, in minutes
10 10 10
A10 Average hourly wage of IT help desk $44,000*1.2x benefits modifier/ 2,000 hours
$26.40 $26.40 $26.40
A11 IT help desk time savings A8*A9/60*A10 $667,775 $701,162 $736,221
At IT operations and help desk time savings, from existing state
A7+A11 $921,228 $975,037 $1,032,381
Risk adjustment 0%
Atr IT operations and help desk time savings, from existing state (risk-adjusted)
$921,228 $975,037 $1,032,381
IT operations identify
issues 75% faster on
Dynatrace than legacy
APM.
11 | The Total Economic Impact™ Of Dynatrace
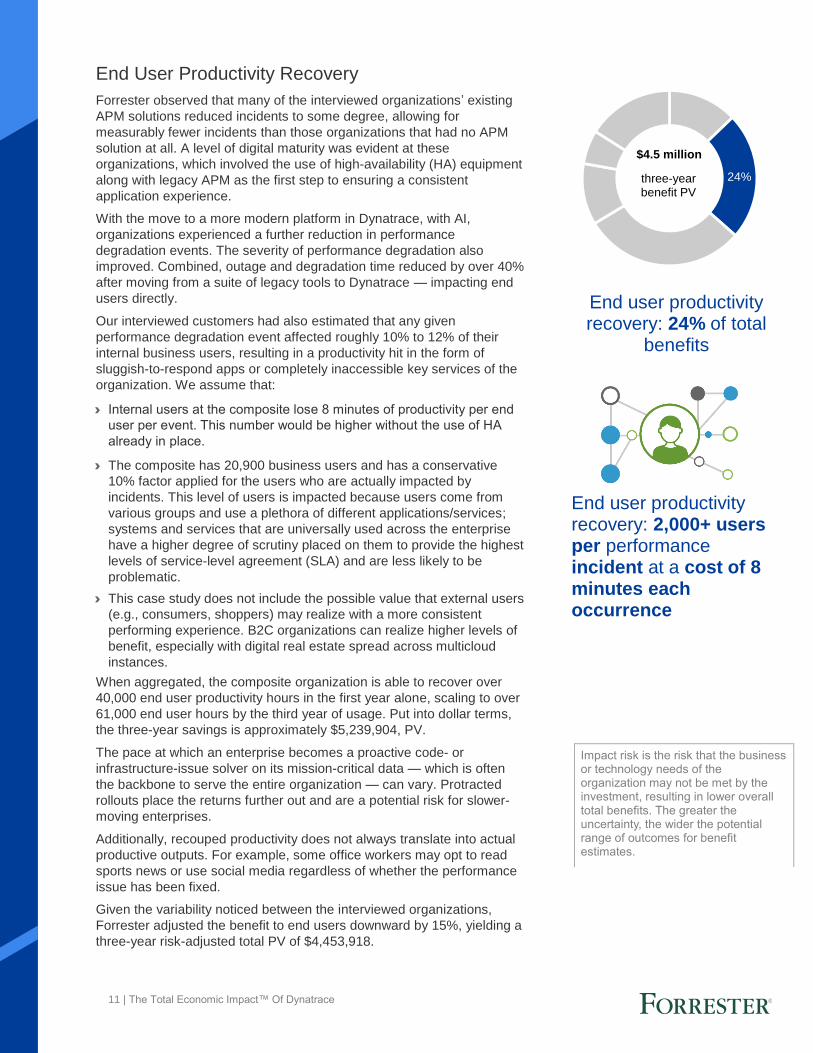
End user productivity recovery: 24% of total
benefits
Impact risk is the risk that the business or technology needs of the organization may not be met by the investment, resulting in lower overall total benefits. The greater the uncertainty, the wider the potential range of outcomes for benefit estimates.
End User Productivity Recovery
Forrester observed that many of the interviewed organizations’ existing
APM solutions reduced incidents to some degree, allowing for
measurably fewer incidents than those organizations that had no APM
solution at all. A level of digital maturity was evident at these
organizations, which involved the use of high-availability (HA) equipment
along with legacy APM as the first step to ensuring a consistent
application experience.
With the move to a more modern platform in Dynatrace, with AI,
organizations experienced a further reduction in performance
degradation events. The severity of performance degradation also
improved. Combined, outage and degradation time reduced by over 40%
after moving from a suite of legacy tools to Dynatrace — impacting end
users directly.
Our interviewed customers had also estimated that any given
performance degradation event affected roughly 10% to 12% of their
internal business users, resulting in a productivity hit in the form of
sluggish-to-respond apps or completely inaccessible key services of the
organization. We assume that:
› Internal users at the composite lose 8 minutes of productivity per end
user per event. This number would be higher without the use of HA
already in place.
› The composite has 20,900 business users and has a conservative
10% factor applied for the users who are actually impacted by
incidents. This level of users is impacted because users come from
various groups and use a plethora of different applications/services;
systems and services that are universally used across the enterprise
have a higher degree of scrutiny placed on them to provide the highest
levels of service-level agreement (SLA) and are less likely to be
problematic.
› This case study does not include the possible value that external users
(e.g., consumers, shoppers) may realize with a more consistent
performing experience. B2C organizations can realize higher levels of
benefit, especially with digital real estate spread across multicloud
instances.
When aggregated, the composite organization is able to recover over
40,000 end user productivity hours in the first year alone, scaling to over
61,000 end user hours by the third year of usage. Put into dollar terms,
the three-year savings is approximately $5,239,904, PV.
The pace at which an enterprise becomes a proactive code- or
infrastructure-issue solver on its mission-critical data — which is often
the backbone to serve the entire organization — can vary. Protracted
rollouts place the returns further out and are a potential risk for slower-
moving enterprises.
Additionally, recouped productivity does not always translate into actual
productive outputs. For example, some office workers may opt to read
sports news or use social media regardless of whether the performance
issue has been fixed.
Given the variability noticed between the interviewed organizations,
Forrester adjusted the benefit to end users downward by 15%, yielding a
three-year risk-adjusted total PV of $4,453,918.
End user productivity recovery: 2,000+ users per performance incident at a cost of 8 minutes each occurrence
24%three-year benefit PV
$4.5 million

12 | The Total Economic Impact™ Of Dynatrace
Shortened software development life cycles:
30% of total benefits
Development Savings From Reduced Dev And Test
Cycles
Many interviewed organizations spoke to Forrester of developer
efficiencies when utilizing Dynatrace in the software development life
cycle. Growingly complex projects that had interdependencies within the
architecture required developers to operate in larger teams and
increased the likelihood of coding rework. Organizations using Dynatrace
during the coding process reduced significant development effort,
enabling the organizations to do more with the same developer
resources.
Software development life cycles (SDLC) were heavily compressed in
the development and testing phases due to live AI-based analytics as
coding was in progress. Organizations found additional effort savings in
the deployment stage of projects.
The composite organization has the following characteristics:
› For new project builds, it experiences 45% in savings for SDLC overall,
separate of operational tasks.
› Developers ramp into the usage of Dynatrace as a regular part of
development efforts over time, gaining traction year over year (YoY).
› Developer resources/FTEs no longer need to increase YoY as
efficiencies build.
Net of introducing Dynatrace into the development cycle, developer time
savings grow from $1.6M in Year 1 to nearly $3M in Year 3. In PV over a
three-year period, the composite recognizes $5,658,700 with this benefit.
End User Productivity Recovery: Calculation Table
Ref. Metric Calculation Year 1 Year 2 Year 3
B1 Outage or degraded app performance incidents, per year
A1 364 382 401
B2 Outage or degradation reduction, on-premises and cloud
40% 45% 50%
B3 Internal users affected by outages at given time of incidents
10% to 12% of 20,900 total business users
2,090 2,195 2,305
B4 Estimated time lost due to poor app performance per incident per user, in minutes
8 8 8
B5 Average hourly wage of internal business user
$70,000*1.2x benefits modifier/ 2,000 hours
$42 $42 $42
Bt End user productivity recovery B1*B2*B3*B4*B5/60
$1,704,102 $2,112,995 $2,588,054
Risk adjustment ↓15%
Btr End user productivity recovery (risk-adjusted)
$1,448,487 $1,796,046 $2,199,846
30%
three-year benefit PV
$5.7 million
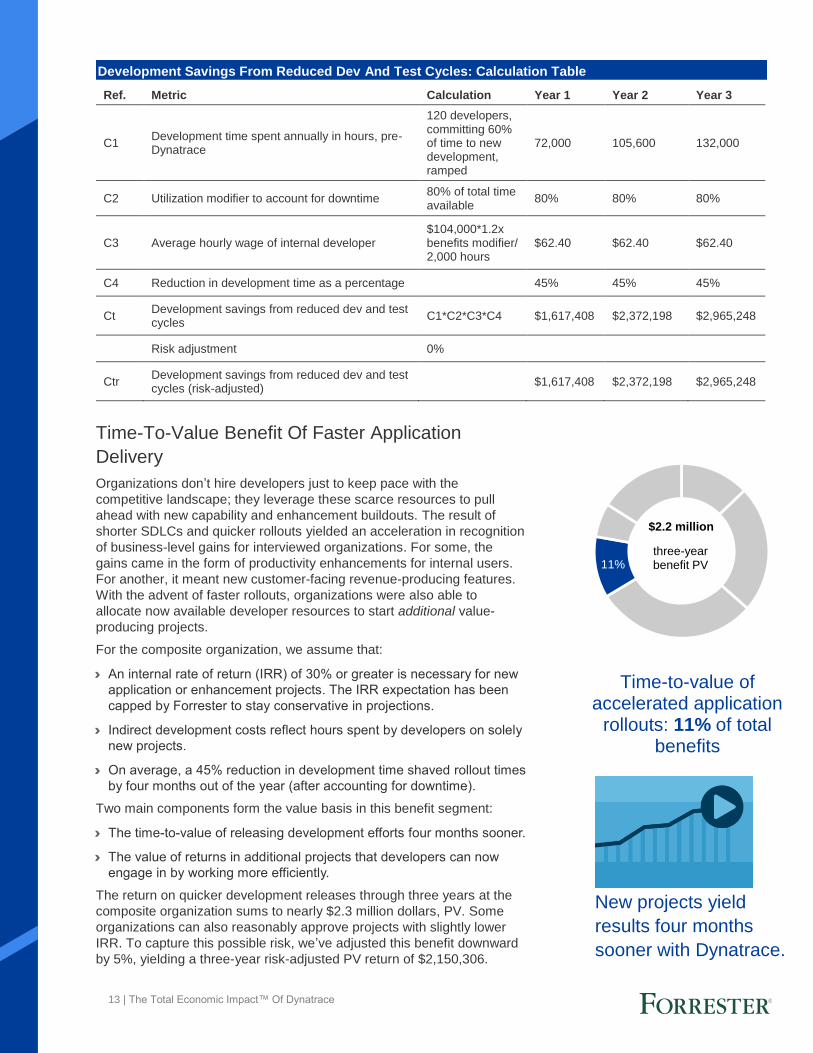
13 | The Total Economic Impact™ Of Dynatrace
Time-to-value of accelerated application
rollouts: 11% of total benefits
Time-To-Value Benefit Of Faster Application
Delivery
Organizations don’t hire developers just to keep pace with the
competitive landscape; they leverage these scarce resources to pull
ahead with new capability and enhancement buildouts. The result of
shorter SDLCs and quicker rollouts yielded an acceleration in recognition
of business-level gains for interviewed organizations. For some, the
gains came in the form of productivity enhancements for internal users.
For another, it meant new customer-facing revenue-producing features.
With the advent of faster rollouts, organizations were also able to
allocate now available developer resources to start additional value-
producing projects.
For the composite organization, we assume that:
› An internal rate of return (IRR) of 30% or greater is necessary for new
application or enhancement projects. The IRR expectation has been
capped by Forrester to stay conservative in projections.
› Indirect development costs reflect hours spent by developers on solely
new projects.
› On average, a 45% reduction in development time shaved rollout times
by four months out of the year (after accounting for downtime).
Two main components form the value basis in this benefit segment:
› The time-to-value of releasing development efforts four months sooner.
› The value of returns in additional projects that developers can now
engage in by working more efficiently.
The return on quicker development releases through three years at the
composite organization sums to nearly $2.3 million dollars, PV. Some
organizations can also reasonably approve projects with slightly lower
IRR. To capture this possible risk, we’ve adjusted this benefit downward
by 5%, yielding a three-year risk-adjusted PV return of $2,150,306.
Development Savings From Reduced Dev And Test Cycles: Calculation Table
Ref. Metric Calculation Year 1 Year 2 Year 3
C1 Development time spent annually in hours, pre-Dynatrace
120 developers, committing 60% of time to new development, ramped
72,000 105,600 132,000
C2 Utilization modifier to account for downtime 80% of total time available
80% 80% 80%
C3 Average hourly wage of internal developer $104,000*1.2x benefits modifier/ 2,000 hours
$62.40 $62.40 $62.40
C4 Reduction in development time as a percentage 45% 45% 45%
Ct Development savings from reduced dev and test cycles
C1*C2*C3*C4 $1,617,408 $2,372,198 $2,965,248
Risk adjustment 0%
Ctr Development savings from reduced dev and test cycles (risk-adjusted)
$1,617,408 $2,372,198 $2,965,248
New projects yield
results four months
sooner with Dynatrace.
11%three-year benefit PV
$2.2 million
14 | The Total Economic Impact™ Of Dynatrace
Performance incident avoidance on new
buildouts: 6% of total benefits
Application Performance Incident Avoidance On
New Buildouts
Fundamentally, interviewed organizations needed to be proactive in their
approach to handling performance degradations. Dynatrace played a
large role to actively find faults in the entire stack so that operators could
address issues before they impacted business segments. A number of
interviewees asked, “What if we could stem the problem further by
coding out issues during the build phase of new projects?” And indeed,
that was exactly what they did once incorporating Dynatrace into their
development cycles.
A director of technology stated: “Finding an issue as we are coding is
one one-thousandth of the impact as it would be if found in production.
‘Shifting left’ and fixing issues during the coding process brings a lot of
efficiency to our defect removal efficiency.”
For the composite organization, Forrester assumes that an increased
average of 31+ priority incidents per year are caused by new buildouts
before Dynatrace. Extrapolating from the cost per incident to the IT
operators, help desk personnel, and end user impact, we deduce that
over a three-year period, the composite derives gains of $1,187,502, PV.
The key here is that everyone benefits as performance surprises are
heavily reduced on the software side.
Time-To-Value Benefit Of Faster Application Delivery: Calculation Table
Ref. Metric Calculation Year 1 Year 2 Year 3
D1 Cost of development pre-Dynatrace C1*C2*C3 $3,594,240 $5,271,552 $6,589,440
D2 Acceleration in app or functionality rollout, counted in percentage decrease in development time
45% 45% 45%
D3 Expected internal rate of return for development projects (IRR)
Interviews 30% 30% 30%
D4 Time-to-initial-deployment savings, represented in months
4 4 4
Dt Time-to-value benefit of faster application delivery
(D1*D2*D3)+(D1*D2*D3*D4/12)
$646,963 $948,879 $1,186,099
Risk adjustment ↓5%
Dtr Time-to-value benefit of faster application delivery (risk-adjusted)
$614,615 $901,435 $1,126,794
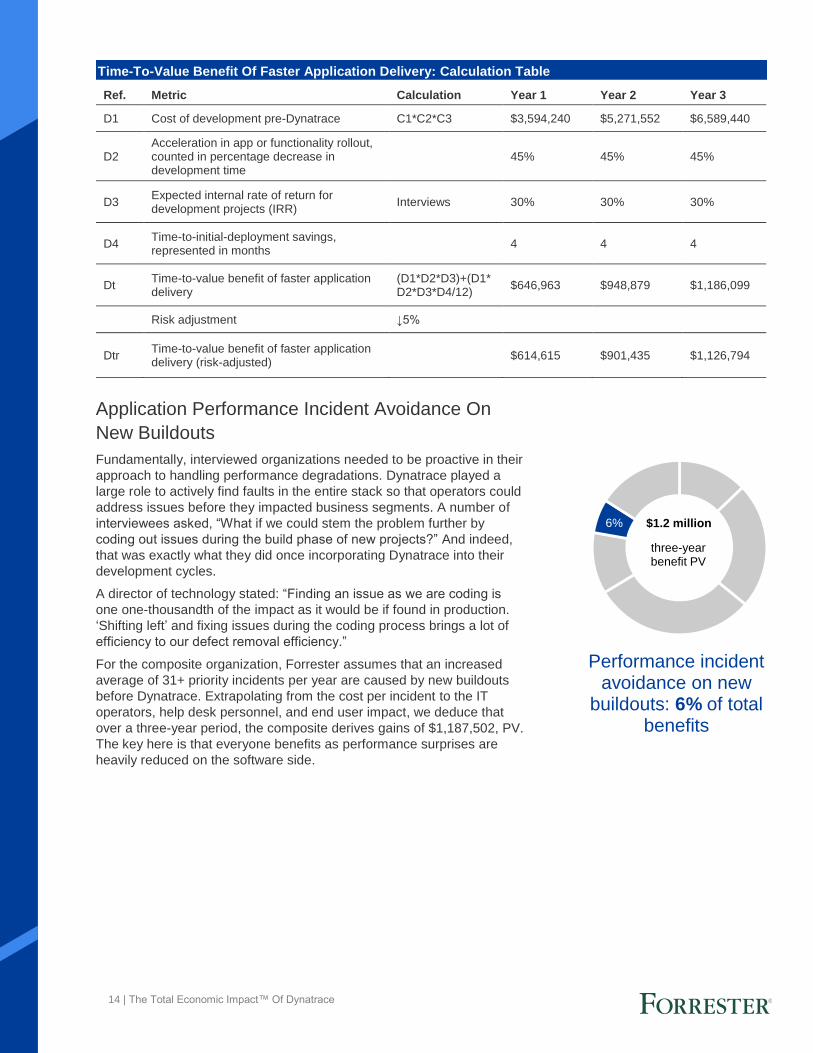
6%
three-year benefit PV
$1.2 million
15 | The Total Economic Impact™ Of Dynatrace
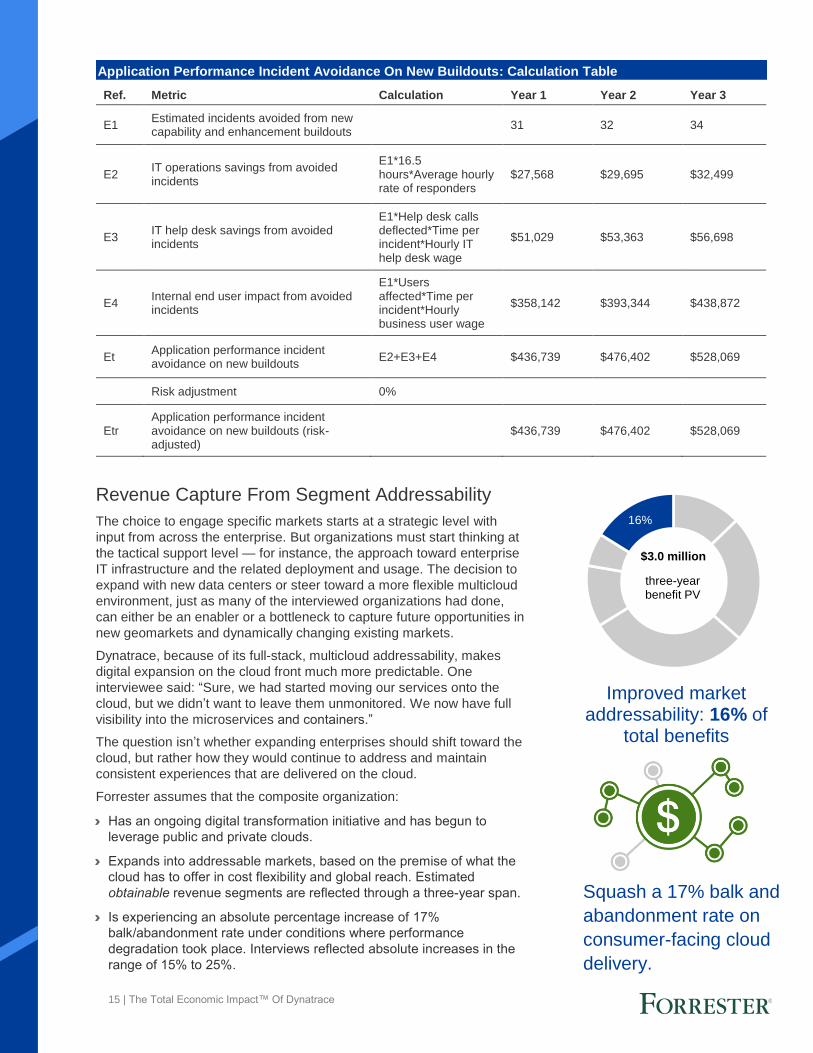
Improved market addressability: 16% of
total benefits
Revenue Capture From Segment Addressability
The choice to engage specific markets starts at a strategic level with
input from across the enterprise. But organizations must start thinking at
the tactical support level — for instance, the approach toward enterprise
IT infrastructure and the related deployment and usage. The decision to
expand with new data centers or steer toward a more flexible multicloud
environment, just as many of the interviewed organizations had done,
can either be an enabler or a bottleneck to capture future opportunities in
new geomarkets and dynamically changing existing markets.
Dynatrace, because of its full-stack, multicloud addressability, makes
digital expansion on the cloud front much more predictable. One
interviewee said: “Sure, we had started moving our services onto the
cloud, but we didn’t want to leave them unmonitored. We now have full
visibility into the microservices and containers.”
The question isn’t whether expanding enterprises should shift toward the
cloud, but rather how they would continue to address and maintain
consistent experiences that are delivered on the cloud.
Forrester assumes that the composite organization:
› Has an ongoing digital transformation initiative and has begun to
leverage public and private clouds.
› Expands into addressable markets, based on the premise of what the
cloud has to offer in cost flexibility and global reach. Estimated
obtainable revenue segments are reflected through a three-year span.
› Is experiencing an absolute percentage increase of 17%
balk/abandonment rate under conditions where performance
degradation took place. Interviews reflected absolute increases in the
range of 15% to 25%.
Application Performance Incident Avoidance On New Buildouts: Calculation Table
Ref. Metric Calculation Year 1 Year 2 Year 3
E1 Estimated incidents avoided from new capability and enhancement buildouts
31 32 34
E2 IT operations savings from avoided incidents
E1*16.5 hours*Average hourly rate of responders
$27,568 $29,695 $32,499
E3 IT help desk savings from avoided incidents
E1*Help desk calls deflected*Time per incident*Hourly IT help desk wage
$51,029 $53,363 $56,698
E4 Internal end user impact from avoided incidents
E1*Users affected*Time per incident*Hourly business user wage
$358,142 $393,344 $438,872
Et Application performance incident avoidance on new buildouts
E2+E3+E4 $436,739 $476,402 $528,069
Risk adjustment 0%
Etr Application performance incident avoidance on new buildouts (risk-adjusted)
$436,739 $476,402 $528,069
Squash a 17% balk and
abandonment rate on
consumer-facing cloud
delivery.
16%
three-year benefit PV
$3.0 million
16 | The Total Economic Impact™ Of Dynatrace
Aggregated, the full benefit across our analysis forecast is $3,019,384,
PV. The primary driving factor to prevent the revenue leakage is
Dynatrace’s full-stack monitoring that provides coverage across multiple
cloud platforms and container services.
Revenue Capture From Segment Addressability: Calculation Table
Ref. Metric Calculation Year 1 Year 2 Year 3
F1 Cloud-enabled customer and segment addressability, expressed as revenue
$40,000,000 $80,000,000 $100,000,000
F2 Revenue susceptible to leakage due to poor level of service provided
10% 10% 10%
F3 User balk/abandonment rate improvement, in absolute percentages
17% 17% 17%
Ft Revenue capture from segment addressability
F1*F2*F3 $680,000 $1,360,000 $1,700,000
Risk adjustment 0%
Ftr Revenue capture from segment addressability (risk-adjusted)
$680,000 $1,360,000 $1,700,000
17 | The Total Economic Impact™ Of Dynatrace
Unquantified Benefits
Forrester’s interviews with and analysis of Dynatrace customers pointed
to additional benefits that could not be reasonably quantified but are still
important to note. The following are segments where we believe further
value can be obtained:
› The usage of Dynatrace led to an earlier realization of
infrastructure operations savings. Migrations to the cloud have been
part of a shift for many organizations, creating new efficiencies in
operational models and infrastructure utilization — all leading to lower
overall spend. Many organizations, however, lacked confidence in
providing consistent service delivery across cloud infrastructures,
which effectively slowed migration efforts. In adding Dynatrace,
visibility into the cloud and container layers became possible at these
organizations. These organizations felt more assured that the
experiences depending on the cloud were delivered with consistency.
Due to this newfound capability, organizations more aggressively
shifted their infrastructure from legacy on-premises installations to
lower-cost-to-operate cloud infrastructures.
While the time-to-value proposition of migrating to more modern
architectures is certainly enabled by Dynatrace, Forrester has opted
not to quantify this benefit, as the adoption of this operational model is
highly variable between organizations dependent on use case.
Nonetheless, opex and, in some situations, capex can be reduced and
should be considered.
› Monitoring, logging, correlation, and analytics engines can be
rationalized through the use of Dynatrace. Traditional application
performance monitoring requires the use of multiple tools that involve
some combination of licensing, in-house buildouts, and
administration/management costs. By collapsing the larger stack into a
single full-stack solution, costs on all of these fronts are reduced when
these older tools are sunset.
Many of the interviewed organizations used a wide variety of tools, but
data was inconclusive as to the precise direct and indirect costs
incurred, particularly for internal builds of tools that were used in
conjunction with off-the-shelf tools. Readers who are interested in this
benefit should contact Dynatrace for a demonstration to determine the
tools that can be reasonably replaced.
Organizations accelerated
to modern clouds with
confidence using
Dynatrace, bringing a
time-to-value savings on
infrastructure operational
costs.
18 | The Total Economic Impact™ Of Dynatrace
Flexibility, as defined by TEI, represents an investment in additional capacity or capability that could be turned into business benefit for a future additional investment. This provides an organization with the "right" or the ability to engage in future initiatives but not the obligation to do so.
Flexibility
The value of flexibility is clearly unique to each customer, and the
measure of its value varies from organization to organization. The
following is a scenario in which a customer might choose to implement
Dynatrace and later realize additional uses and business opportunities,
including:
› Log Analytics. Context is the key to operators in charge of monitoring
IT. Dynatrace’s Log Analytics discovers and brings together log into
context of the applications and infrastructure. By combining the usage
of Log Analytics, which was a new capability at the time of interviews
with customer organizations, Forrester believes that a new level of
visibility and root-cause discovery is possible by feeding the Dynatrace
AI engine with additional data, reducing time for human deduction.
Dynatrace’s key benefit is being able to digest data and bring incidents
into context, leveraging AI to deliver answers. Log Analytics furthers
this as an additive component to fully leverage logs that previously
could not make it through the analytical stage due to insufficient human
capital. Where logs previously simply reported on what happened,
Dynatrace states where and why the issue occurred so that human
operators can stop similar errors from occurring in the future.
› Usage of Dynatrace for infrastructure-as-a-service (IaaS)
providers. Most organizations operate Dynatrace for the benefit of
their users — both external and internal. For certain organizations that
are vendors of IaaS, platform-as-a-service (PaaS), or other as-a-
service offerings, Dynatrace offers a unique value proposition that
could serve as the underpinnings to value delivery to the clients from
both internal usage and external offering perspectives.
Flexibility would also be quantified when evaluated as part of a specific
project (described in more detail in Appendix A).
19 | The Total Economic Impact™ Of Dynatrace
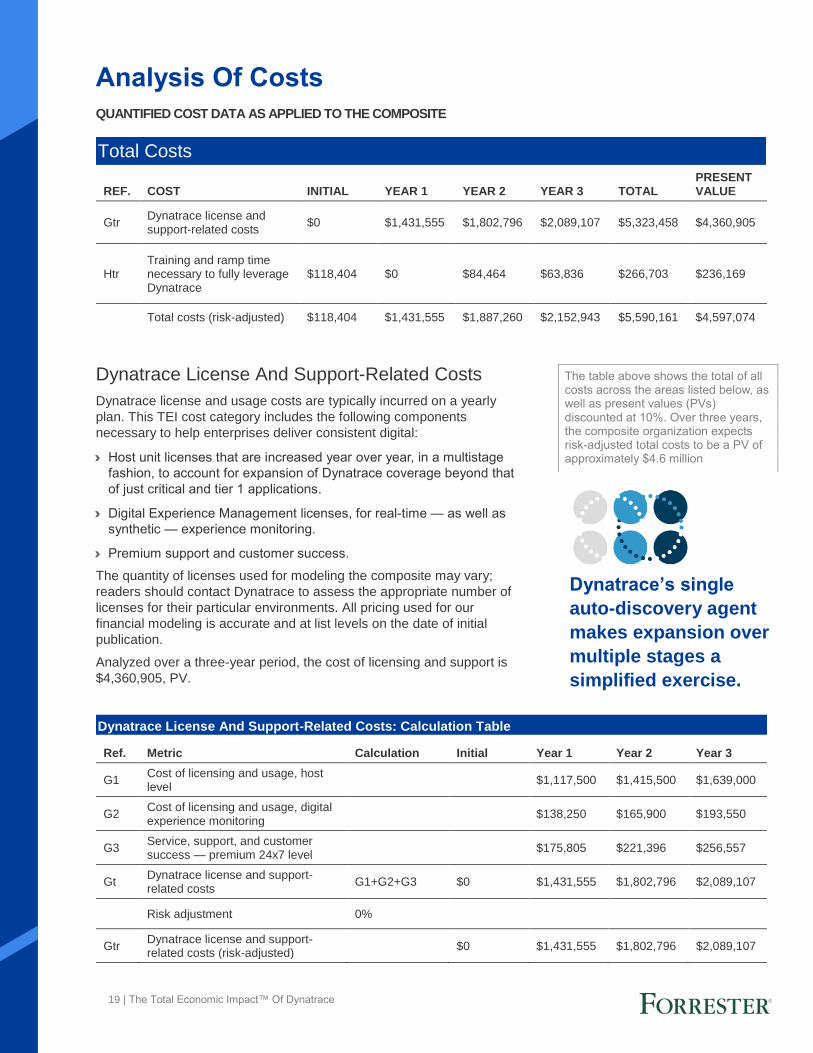
The table above shows the total of all costs across the areas listed below, as well as present values (PVs) discounted at 10%. Over three years, the composite organization expects risk-adjusted total costs to be a PV of approximately $4.6 million
Analysis Of Costs
QUANTIFIED COST DATA AS APPLIED TO THE COMPOSITE
Dynatrace License And Support-Related Costs
Dynatrace license and usage costs are typically incurred on a yearly
plan. This TEI cost category includes the following components
necessary to help enterprises deliver consistent digital:
› Host unit licenses that are increased year over year, in a multistage
fashion, to account for expansion of Dynatrace coverage beyond that
of just critical and tier 1 applications.
› Digital Experience Management licenses, for real-time — as well as
synthetic — experience monitoring.
› Premium support and customer success.
The quantity of licenses used for modeling the composite may vary;
readers should contact Dynatrace to assess the appropriate number of
licenses for their particular environments. All pricing used for our
financial modeling is accurate and at list levels on the date of initial
publication.
Analyzed over a three-year period, the cost of licensing and support is
$4,360,905, PV.
Total Costs
REF. COST INITIAL YEAR 1 YEAR 2 YEAR 3 TOTAL PRESENT VALUE
Gtr Dynatrace license and support-related costs
$0 $1,431,555 $1,802,796 $2,089,107 $5,323,458 $4,360,905
Htr Training and ramp time necessary to fully leverage Dynatrace
$118,404 $0 $84,464 $63,836 $266,703 $236,169
Total costs (risk-adjusted) $118,404 $1,431,555 $1,887,260 $2,152,943 $5,590,161 $4,597,074
Dynatrace License And Support-Related Costs: Calculation Table
Ref. Metric Calculation Initial Year 1 Year 2 Year 3
G1 Cost of licensing and usage, host level
$1,117,500 $1,415,500 $1,639,000
G2 Cost of licensing and usage, digital experience monitoring
$138,250 $165,900 $193,550
G3 Service, support, and customer success — premium 24x7 level
$175,805 $221,396 $256,557
Gt Dynatrace license and support-related costs
G1+G2+G3 $0 $1,431,555 $1,802,796 $2,089,107
Risk adjustment 0%
Gtr Dynatrace license and support-related costs (risk-adjusted)
$0 $1,431,555 $1,802,796 $2,089,107
Dynatrace’s single
auto-discovery agent
makes expansion over
multiple stages a
simplified exercise.
20 | The Total Economic Impact™ Of Dynatrace
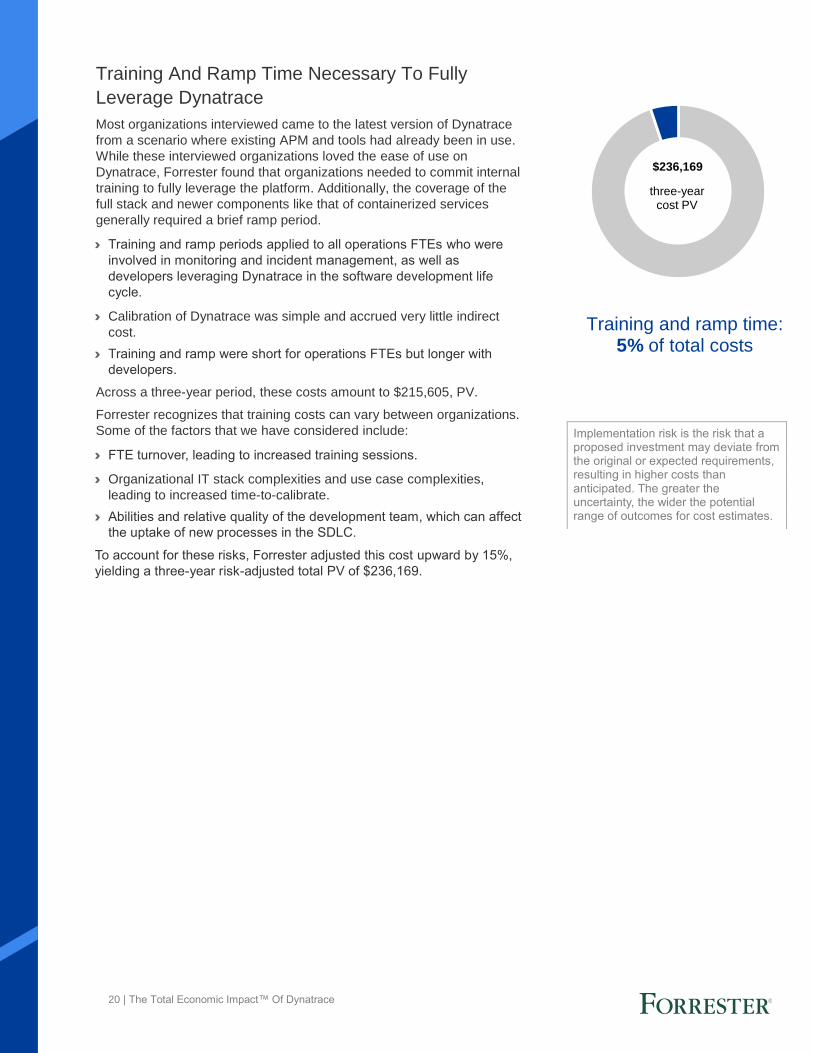
Training and ramp time: 5% of total costs
Implementation risk is the risk that a proposed investment may deviate from the original or expected requirements, resulting in higher costs than anticipated. The greater the uncertainty, the wider the potential range of outcomes for cost estimates.
Training And Ramp Time Necessary To Fully
Leverage Dynatrace
Most organizations interviewed came to the latest version of Dynatrace
from a scenario where existing APM and tools had already been in use.
While these interviewed organizations loved the ease of use on
Dynatrace, Forrester found that organizations needed to commit internal
training to fully leverage the platform. Additionally, the coverage of the
full stack and newer components like that of containerized services
generally required a brief ramp period.
› Training and ramp periods applied to all operations FTEs who were
involved in monitoring and incident management, as well as
developers leveraging Dynatrace in the software development life
cycle.
› Calibration of Dynatrace was simple and accrued very little indirect
cost.
› Training and ramp were short for operations FTEs but longer with
developers.
Across a three-year period, these costs amount to $215,605, PV.
Forrester recognizes that training costs can vary between organizations.
Some of the factors that we have considered include:
› FTE turnover, leading to increased training sessions.
› Organizational IT stack complexities and use case complexities,
leading to increased time-to-calibrate.
› Abilities and relative quality of the development team, which can affect
the uptake of new processes in the SDLC.
To account for these risks, Forrester adjusted this cost upward by 15%,
yielding a three-year risk-adjusted total PV of $236,169.
three-year cost PV
$236,169
21 | The Total Economic Impact™ Of Dynatrace
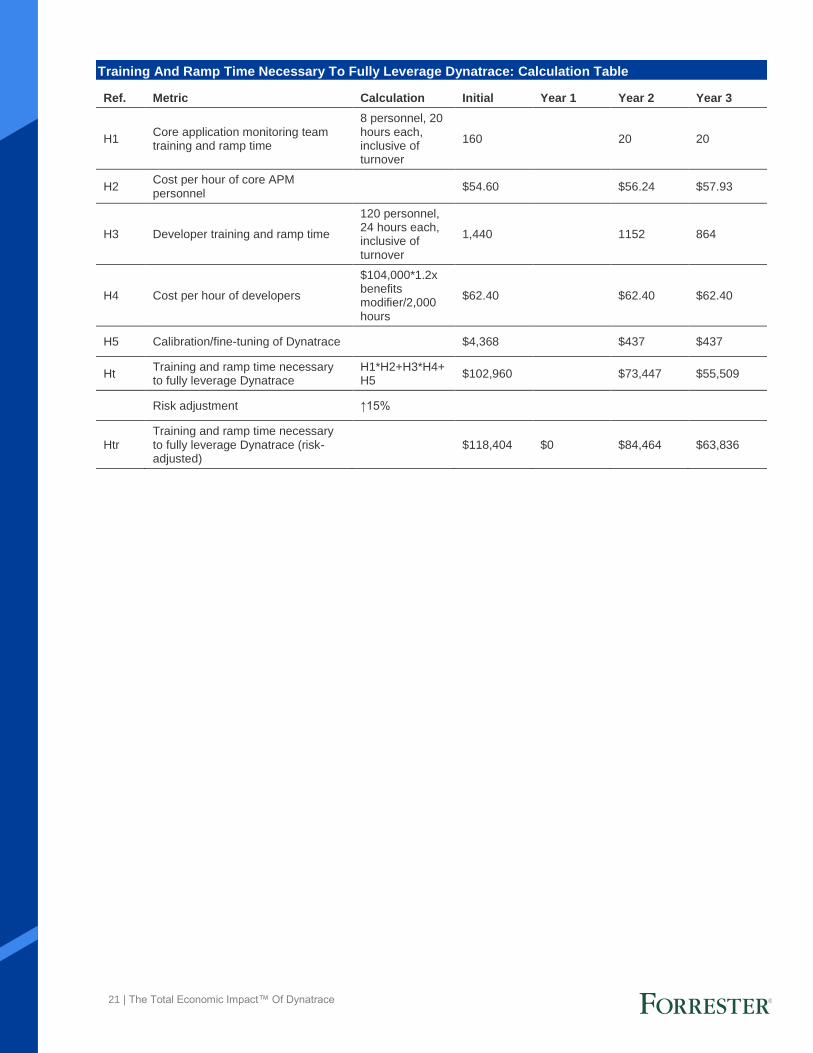
Training And Ramp Time Necessary To Fully Leverage Dynatrace: Calculation Table
Ref. Metric Calculation Initial Year 1 Year 2 Year 3
H1 Core application monitoring team training and ramp time
8 personnel, 20 hours each, inclusive of turnover
160 20 20
H2 Cost per hour of core APM personnel
$54.60 $56.24 $57.93
H3 Developer training and ramp time
120 personnel, 24 hours each, inclusive of turnover
1,440 1152 864
H4 Cost per hour of developers
$104,000*1.2x benefits modifier/2,000 hours
$62.40 $62.40 $62.40
H5 Calibration/fine-tuning of Dynatrace $4,368 $437 $437
Ht Training and ramp time necessary to fully leverage Dynatrace
H1*H2+H3*H4+H5
$102,960 $73,447 $55,509
Risk adjustment ↑15%
Htr Training and ramp time necessary to fully leverage Dynatrace (risk-adjusted)
$118,404 $0 $84,464 $63,836

22 | The Total Economic Impact™ Of Dynatrace
The financial results calculated in the Benefits and Costs sections can be used to determine the ROI, NPV, and payback period for the composite organization’s investment. Forrester assumes a yearly discount rate of 10% for this analysis.
Financial Summary
CONSOLIDATED THREE-YEAR RISK-ADJUSTED METRICS
Cash Flow Chart (Risk-Adjusted)
-$5.0 M
$5.0 M
$10.0 M
$15.0 M
$20.0 M
Initial Year 1 Year 2 Year 3
Cashflows
Total costs
Total benefits
Cumulative net benefits
These risk-adjusted ROI,
NPV, and payback period
values are determined by
applying risk-adjustment
factors to the unadjusted
results in each Benefit and
Cost section.
Cash Flow Table (Risk-Adjusted)
INITIAL YEAR 1 YEAR 2 YEAR 3 TOTAL PRESENT VALUE
Total costs ($118,404) ($1,431,555) ($1,887,260) ($2,152,943) ($5,590,161) ($4,597,074)
Total benefits $0 $5,718,477 $7,881,118 $9,552,338 $23,151,933 $18,888,749
Net benefits ($118,404) $4,286,922 $5,993,858 $7,399,396 $17,561,772 $14,291,675
ROI 311%
Payback period < 6 months
23 | The Total Economic Impact™ Of Dynatrace
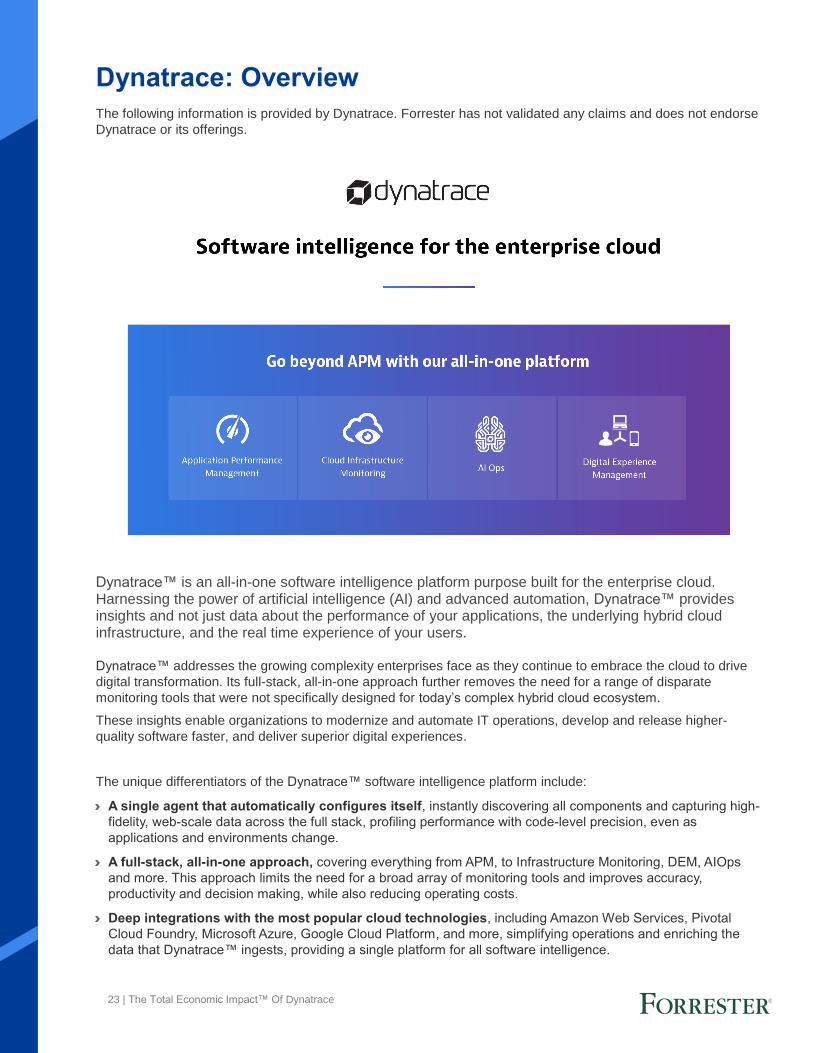
Dynatrace: Overview
The following information is provided by Dynatrace. Forrester has not validated any claims and does not endorse
Dynatrace or its offerings.
Dynatrace™ is an all-in-one software intelligence platform purpose built for the enterprise cloud. Harnessing the power of artificial intelligence (AI) and advanced automation, Dynatrace™ provides insights and not just data about the performance of your applications, the underlying hybrid cloud infrastructure, and the real time experience of your users. Dynatrace™ addresses the growing complexity enterprises face as they continue to embrace the cloud to drive
digital transformation. Its full-stack, all-in-one approach further removes the need for a range of disparate
monitoring tools that were not specifically designed for today’s complex hybrid cloud ecosystem.
These insights enable organizations to modernize and automate IT operations, develop and release higher-
quality software faster, and deliver superior digital experiences.
The unique differentiators of the Dynatrace™ software intelligence platform include:
› A single agent that automatically configures itself, instantly discovering all components and capturing high-
fidelity, web-scale data across the full stack, profiling performance with code-level precision, even as
applications and environments change.
› A full-stack, all-in-one approach, covering everything from APM, to Infrastructure Monitoring, DEM, AIOps
and more. This approach limits the need for a broad array of monitoring tools and improves accuracy,
productivity and decision making, while also reducing operating costs.
› Deep integrations with the most popular cloud technologies, including Amazon Web Services, Pivotal
Cloud Foundry, Microsoft Azure, Google Cloud Platform, and more, simplifying operations and enriching the
data that Dynatrace™ ingests, providing a single platform for all software intelligence.
24 | The Total Economic Impact™ Of Dynatrace
› AI-powered answers instead of data, with the deterministic AI engine constantly analyzing performance to
serve up precise root-cause analysis when performance deviates from the established baseline of “normal”
behavior.
› Auto remediation, allowing customers to take a significant step toward enabling self-healing applications and
transitioning from IT operations (ITOps) to AIOps.
› Web-scale and enterprise grade, built to capture and analyze huge data sets from enterprise cloud
applications and their underlying infrastructure in real time, improving the intelligence of its AI engine and
providing more precise answers about software performance across the full stack.
And that’s why Dynatrace™ is trusted by more than 2,200 customers across 79 countries, including 72 of the
Fortune 100.
Try Dynatrace™ full stack monitoring for free and gain deep insights into your applications.
25 | The Total Economic Impact™ Of Dynatrace
Appendix A: Total Economic Impact
Total Economic Impact is a methodology developed by Forrester
Research that enhances a company’s technology decision-making
processes and assists vendors in communicating the value proposition
of their products and services to clients. The TEI methodology helps
companies demonstrate, justify, and realize the tangible value of IT
initiatives to both senior management and other key business
stakeholders.
Total Economic Impact Approach
Benefits represent the value delivered to the business by the
product. The TEI methodology places equal weight on the
measure of benefits and the measure of costs, allowing for a
full examination of the effect of the technology on the entire
organization.
Costs consider all expenses necessary to deliver the
proposed value, or benefits, of the product. The cost category
within TEI captures incremental costs over the existing
environment for ongoing costs associated with the solution.
Flexibility represents the strategic value that can be
obtained for some future additional investment building on
top of the initial investment already made. Having the ability
to capture that benefit has a PV that can be estimated.
Risks measure the uncertainty of benefit and cost estimates
given: 1) the likelihood that estimates will meet original
projections and 2) the likelihood that estimates will be
tracked over time. TEI risk factors are based on “triangular
distribution.”
The initial investment column contains costs incurred at “time 0” or at the
beginning of Year 1 that are not discounted. All other cash flows are discounted
using the discount rate at the end of the year. PV calculations are calculated for
each total cost and benefit estimate. NPV calculations in the summary tables are
the sum of the initial investment and the discounted cash flows in each year.
Sums and present value calculations of the Total Benefits, Total Costs, and
Cash Flow tables may not exactly add up, as some rounding may occur.
Present value (PV)
The present or current value of (discounted) cost and benefit estimates given at an interest rate (the discount rate). The PV of costs and benefits feed into the total NPV of cash flows.
Net present value (NPV)
The present or current value of (discounted) future net cash flows given an interest rate (the discount rate). A positive project NPV normally indicates that the investment should be made, unless other projects have higher NPVs.
Return on investment (ROI)
A project’s expected return in percentage terms. ROI is calculated by dividing net benefits (benefits less costs) by costs.
Discount rate
The interest rate used in cash flow analysis to take into account the time value of money. Organizations typically use discount rates between 8% and 16%.
Payback period
The breakeven point for an investment. This is the point in time at which net benefits (benefits minus costs) equal initial investment or cost.