Embed Size (px)
Citation preview
The Value of Continuous ScvO2 Monitoring in PICU
Caulette Young, RN, BSN
Pediatric Clinical Nurse Consultant
Edwards Lifesciences, LLC

Disclaimers
• Paid consultant for Edwards Lifesciences, LLC
• Pediatric critical care products
• Provide education, in-services, research & • Provide education, in-services, research & technical advice

Objective
The goal in PICU is to maintain a balance
between oxygen delivery and consumption.
Continuous ScvO2 allows the clinician to 2
assess oxygen delivery and consumption in
real-time. Imbalances can rapidly be identified
and treated earlier with improved outcomes.
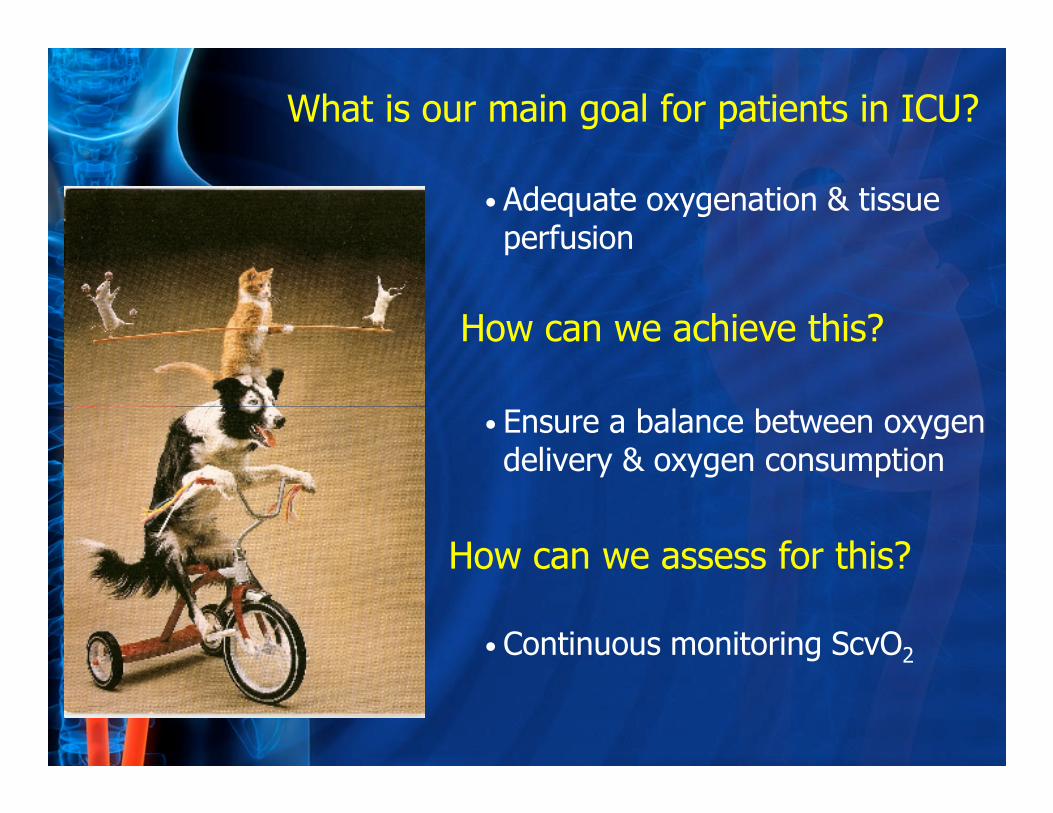
What is our main goal for patients in ICU?
• Adequate oxygenation & tissue perfusion
Ensure a balance between oxygen
How can we achieve this?
• Ensure a balance between oxygen delivery & oxygen consumption
• Continuous monitoring ScvO2
How can we assess for this?

74
Reflection vs Transmission Spectrophotometry
Receiving fiber
SVC
LED photo detector
Transmission fiber
Receiving fiber

Benefits of Continuous vs. Intermittent
• Real-time, no waiting for analysis results
• Decrease risk for infection
• Decrease risk for transfusions
• Early warning• Early warning
– Identification of DO2/VO2 imbalance
– Traditional hemodynamic monitoring unreliable
• Cost savings
– Financial
– Resources of staff
– Prevention
Using continuous ScvO2 monitoring
to evaluate tissue oxygenation at
the bedside enables the clinician to
detect early alterations in oxygen detect early alterations in oxygen
balance.
(Goodrich 2006 Crit Care Nurs Clin N Am)

“Oxygen delivery does not provide information about the adequacy of
tissue oxygenation.”
Curley & Harmon Critical Care Nursing of Infants and Children 2nd Ed
Uncorrected imbalances
• Shift in dissociation curve: left or right
• Hypoxia / hypoxemia
• Acidosis
• Redistribution or maldistribution of blood
• MODS
• Pulmonary hypertension
• Cardiovascular collapse / cardiac arrest
• Necrosis & irreversible cell death
• Death

What is
ScvO2?
� Central venous oxygen saturation
measured at the SVC-RA junction
� Indicative of balance between
oxygen delivery & consumption
� Trends well with SvO2
SVC-RA
� Can be used as a surrogate for
adequate cardiac index
� Early warning indicator
� Used to guide therapy in sepsis &
congenital cardiac surgery
SVC-RAjunction

ScvO2
Oxygen Delivery Oxygen Consumption
Cardiac HemoglobinOxygenation/ventilation
Metabolic demandsCardiac output
Hemoglobin/ventilation
Stroke volume
Heart rate
FiO2
Preload Afterload Contractility
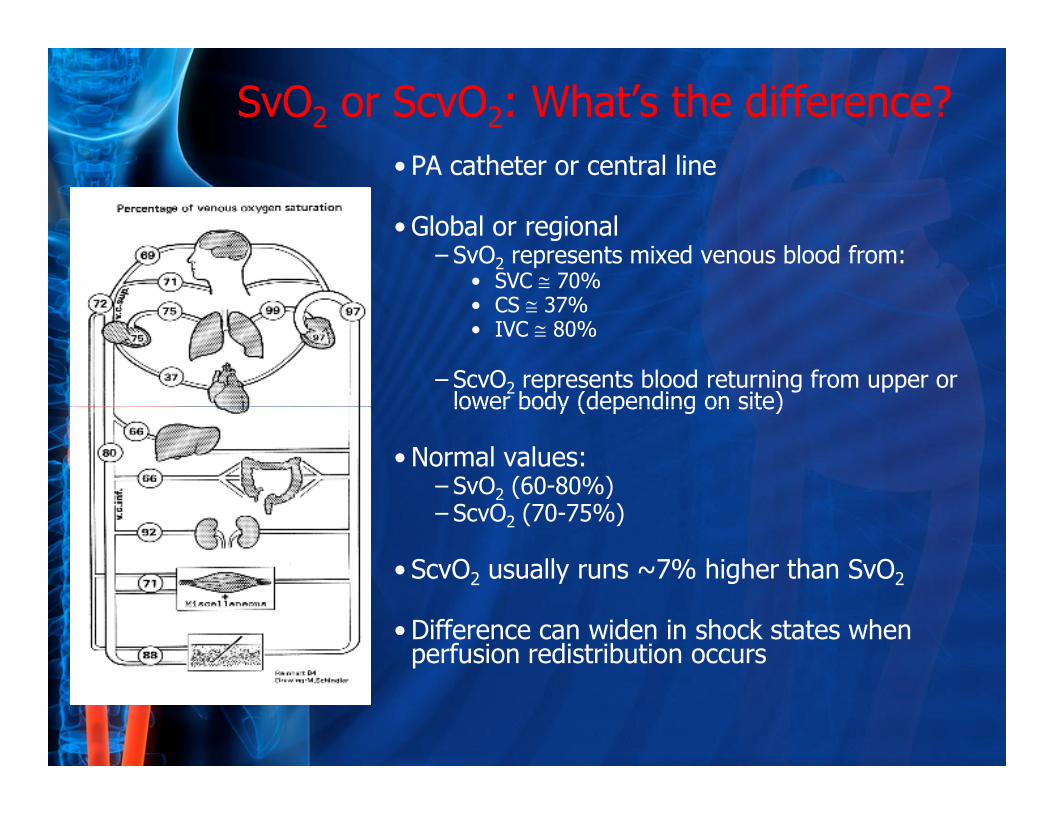
SvO2 or ScvO2: What’s the difference?
• PA catheter or central line
• Global or regional– SvO2 represents mixed venous blood from:
• SVC ≅ 70%• CS ≅ 37%• IVC ≅ 80%
– ScvO2 represents blood returning from upper or lower body (depending on site)lower body (depending on site)
• Normal values:– SvO2 (60-80%) – ScvO2 (70-75%)
• ScvO2 usually runs ~7% higher than SvO2
• Difference can widen in shock states when perfusion redistribution occurs
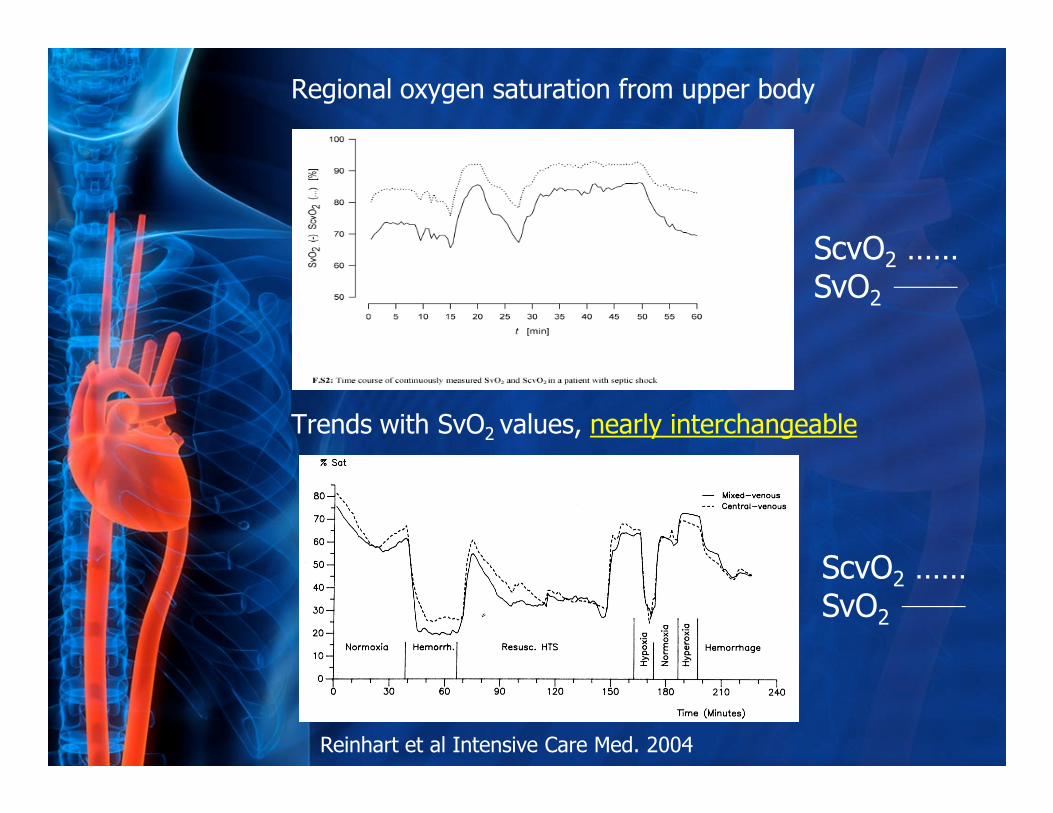
Regional oxygen saturation from upper body
Trends with SvO values, nearly interchangeable
ScvO2 ……SvO2
Trends with SvO2 values, nearly interchangeable
Reinhart et al Intensive Care Med. 2004
ScvO2 ……SvO2

Has been considered a surrogate for cardiac output / index in pediatrics
Tibby et al Arch Dis Child 2003

Usually consumption (VO2) independent of delivery (DO2)
DO2I= CO x SaO2 x Hgb x 1.34 x 10 = 650 + 50 ml/min/m2
VO2I= CO x (SaO2-SvO2) x Hgb x 1.34 x 10 = 120-200 ml/min/m2
�If VO2 increases or DO2 decreases, tissue oxygenation is maintained by increasing oxygen extraction
“Adequate” oxygenation can only be defined when tissue O2 supply matches tissue O2 demand
O2ER = VO2/DO2 x 100 = 25 + 2%
�If DO2 drops below a critical level, oxygen extraction becomes exhausted resulting in VO2 dependent on DO2 or oxygen debt
Tissue hypoxia occurs!
Note: O2ER increases well before lactate begins to accumulate
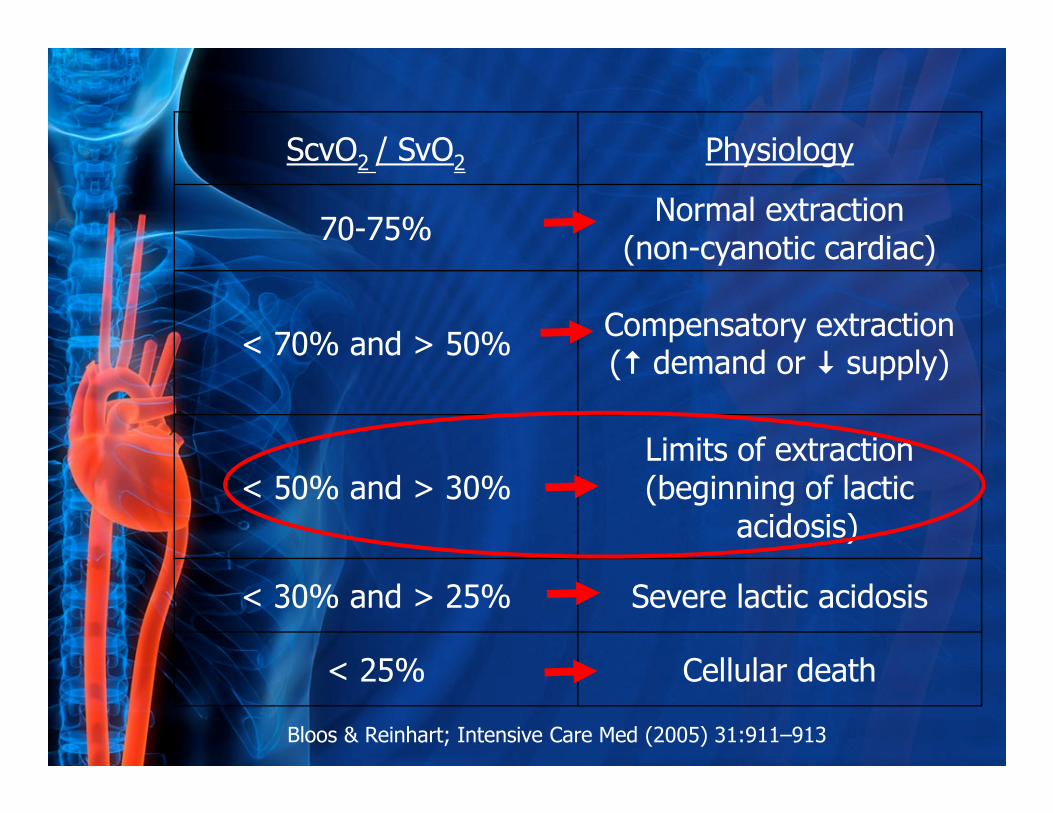
ScvO2 / SvO2 Physiology
70-75% Normal extraction
(non-cyanotic cardiac)
< 70% and > 50%Compensatory extraction (� demand or � supply)
< 50% and > 30%Limits of extraction(beginning of lactic
acidosis)
< 30% and > 25% Severe lactic acidosis
< 25% Cellular death
Bloos & Reinhart; Intensive Care Med (2005) 31:911–913

Factors to be considered in Oxygenation
� Alveolar-pulmonary capillary O2 transport• Gas exchange in terminal portion of lungs
� O2 transport in the blood• Hemoglobin & oxyhemoglobin
− Arterial O2 content (CaO2)
− Oxyhemoglobin dissociation curve
DO2
− Oxyhemoglobin dissociation curve
− O2 delivery (DO2)
� Cellular respiration• Oxygen consumption
• Oxygen extraction ratio (O2ER)
− Tissue oxygenation dependent on microcirculation
− Microcirculation adjusts to enhance O2
extraction
VO2
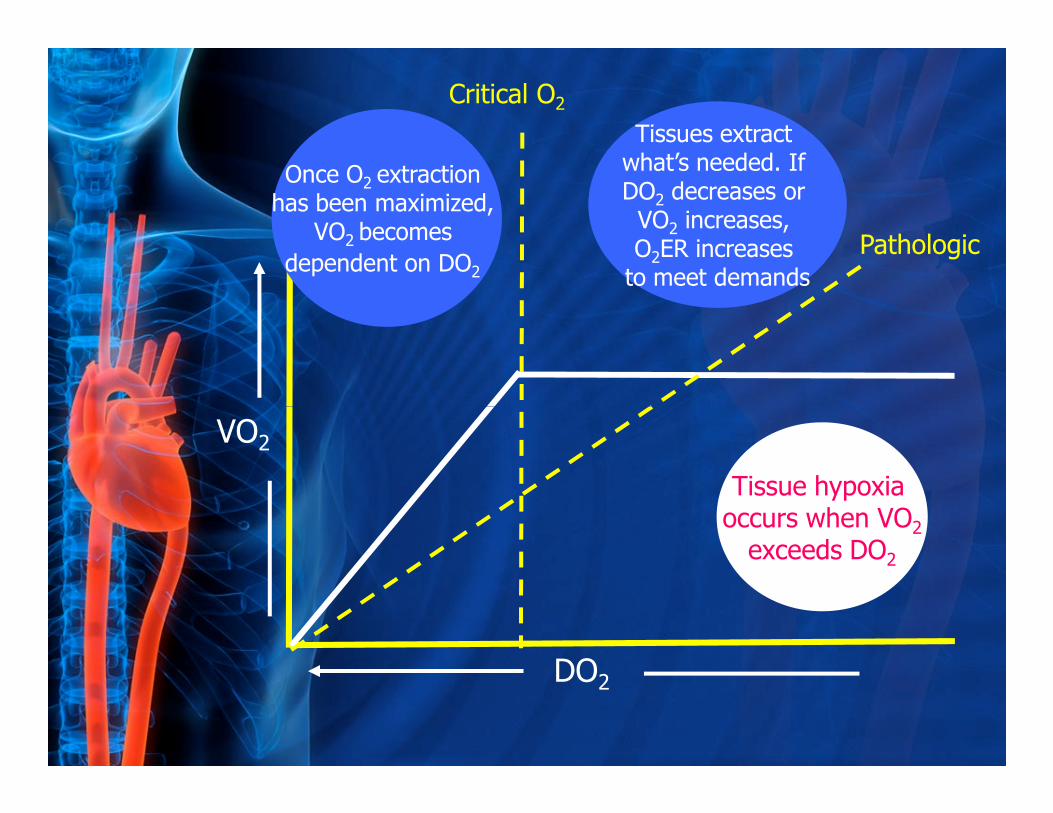
Once O2 extraction has been maximized,
VO2 becomes
dependent on DO2
Tissues extract what’s needed. If DO2 decreases or
VO2 increases, O2ER increases
to meet demands
Pathologic
Critical O2
VO2
DO2
Tissue hypoxia occurs when VO2
exceeds DO2

O ER
NormalO2ER may increase to
meet O2 demands, when DO2 is decreased or
VO2 is increased.
Normal O2ER 25-30%
O2 ER
DO2
Pathologic
VO
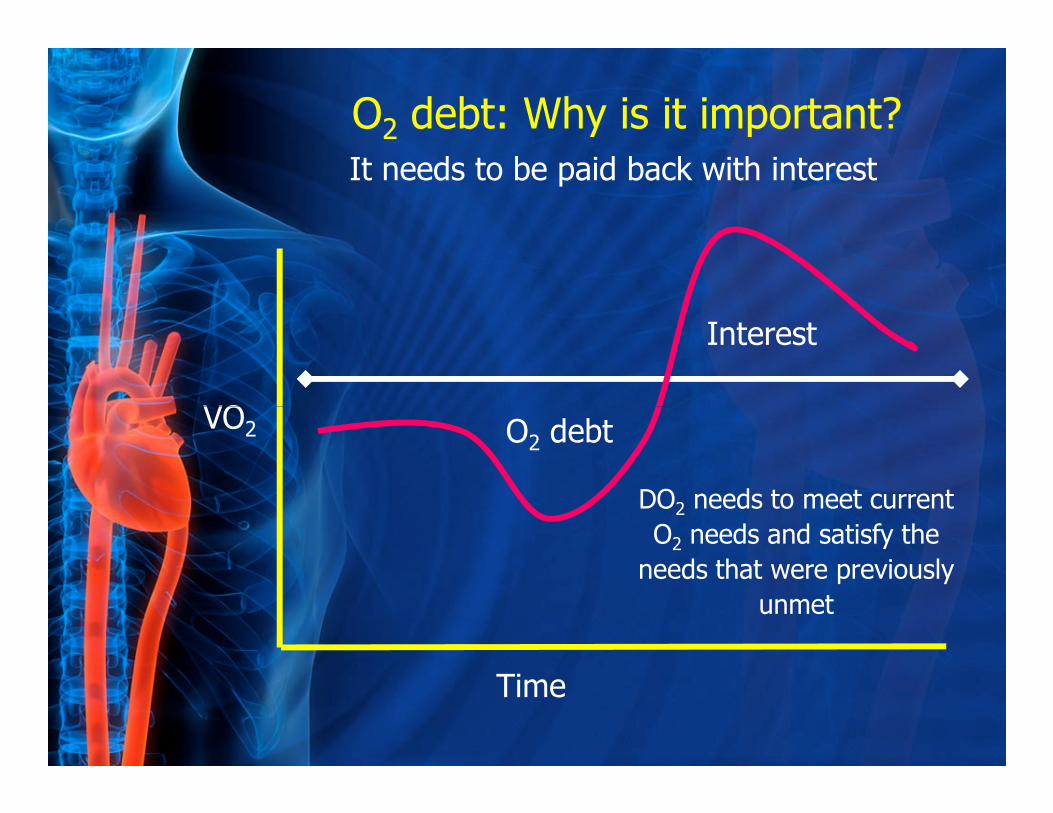
O2 debt: Why is it important?
It needs to be paid back with interest
Interest
VO2
Time
O2 debt
DO2 needs to meet current
O2 needs and satisfy the
needs that were previously
unmet

Oxygen Saturation Values
Site Acyanotic Cyanotic
Superior vena cava 70-75% 35-55%
Right atrium / ventricle 75% 67% / 80%
Pulmonary vein 95% 88%
Aorta 95% 80%
Left atrium / ventricle 95% 90%
Inferior vena cava 78%
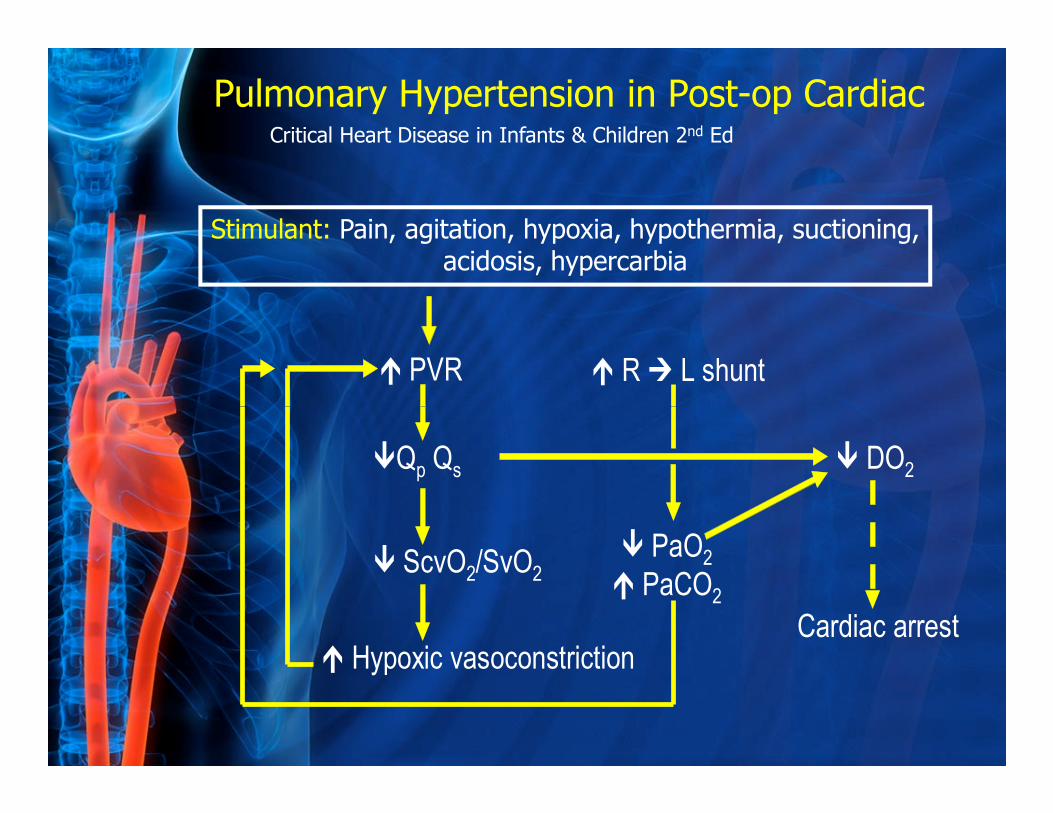
� PVR � R � L shunt
Stimulant: Pain, agitation, hypoxia, hypothermia, suctioning, acidosis, hypercarbia
Pulmonary Hypertension in Post-op CardiacCritical Heart Disease in Infants & Children 2nd Ed
�Qp Qs
� ScvO2/SvO2
� Hypoxic vasoconstriction
� PaO2
� PaCO2
� DO2
Cardiac arrest
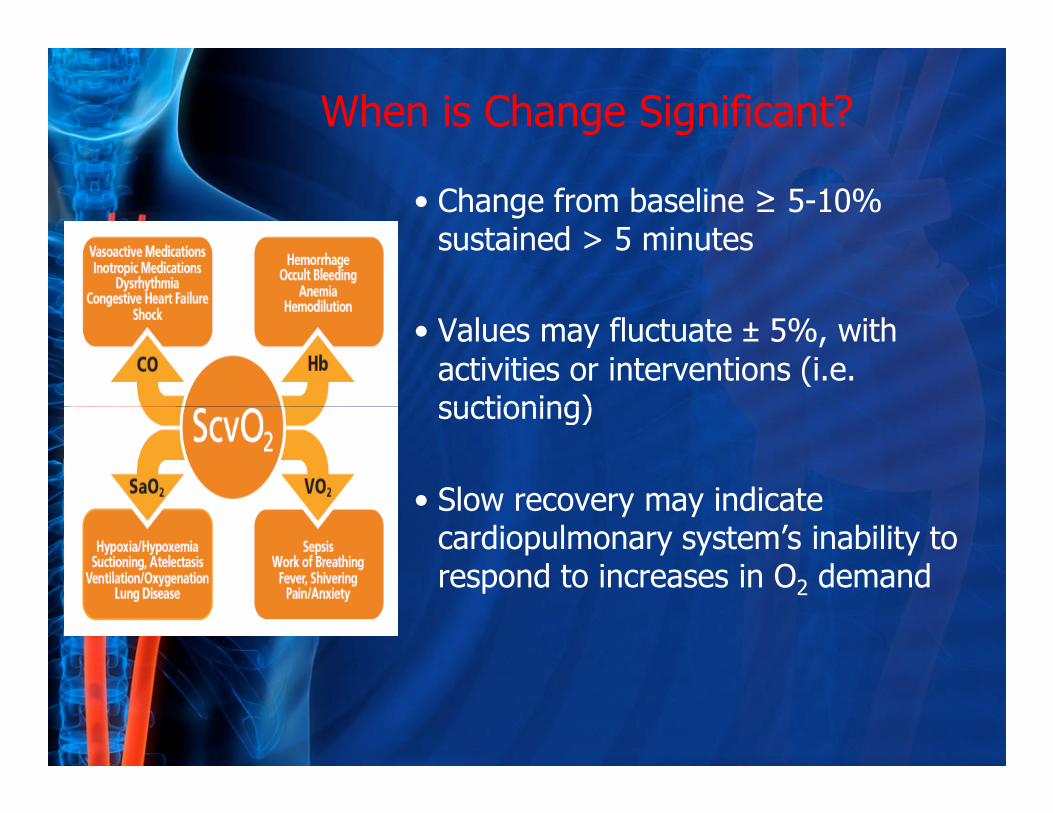
When is Change Significant?
• Change from baseline ≥ 5-10% sustained > 5 minutes
• Values may fluctuate ± 5%, with
activities or interventions (i.e. suctioning)suctioning)
• Slow recovery may indicate cardiopulmonary system’s inability to respond to increases in O2 demand
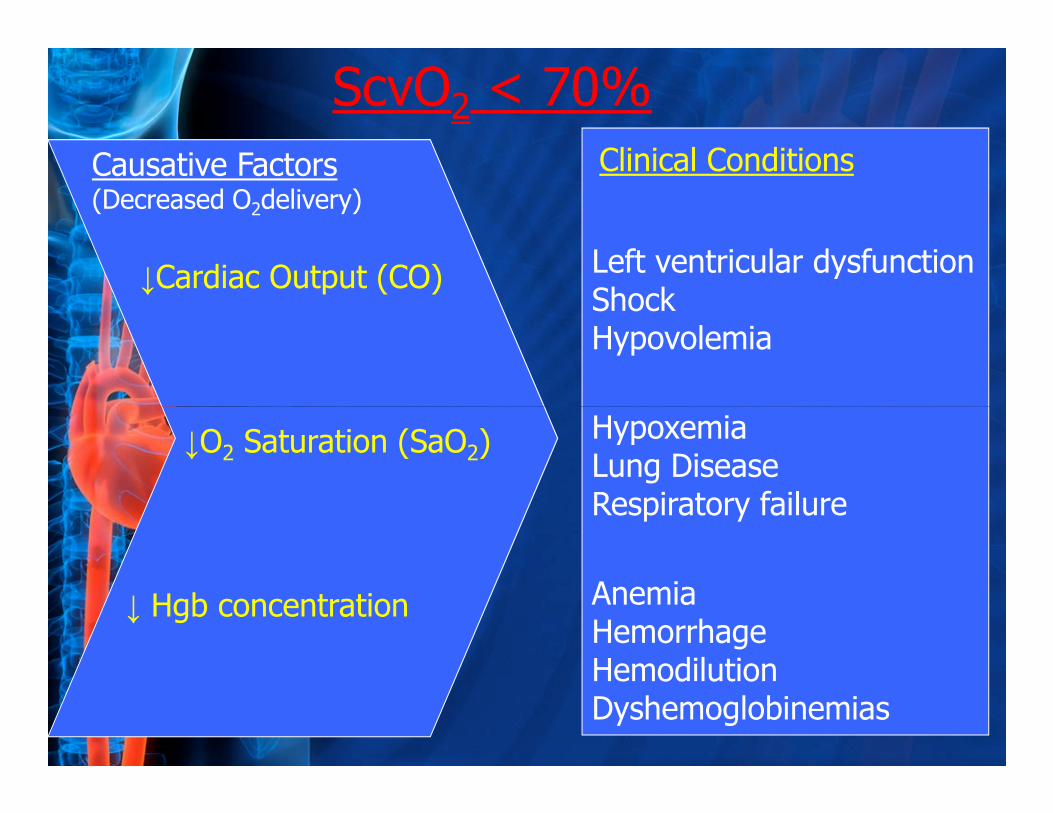
Causative Factors(Decreased O2delivery)
Left ventricular dysfunctionShock Hypovolemia
Hypoxemia
↓Cardiac Output (CO)
Clinical Conditions
ScvO2 < 70%
↓O2 Saturation (SaO2)HypoxemiaLung DiseaseRespiratory failure
AnemiaHemorrhageHemodilutionDyshemoglobinemias
↓ Hgb concentration
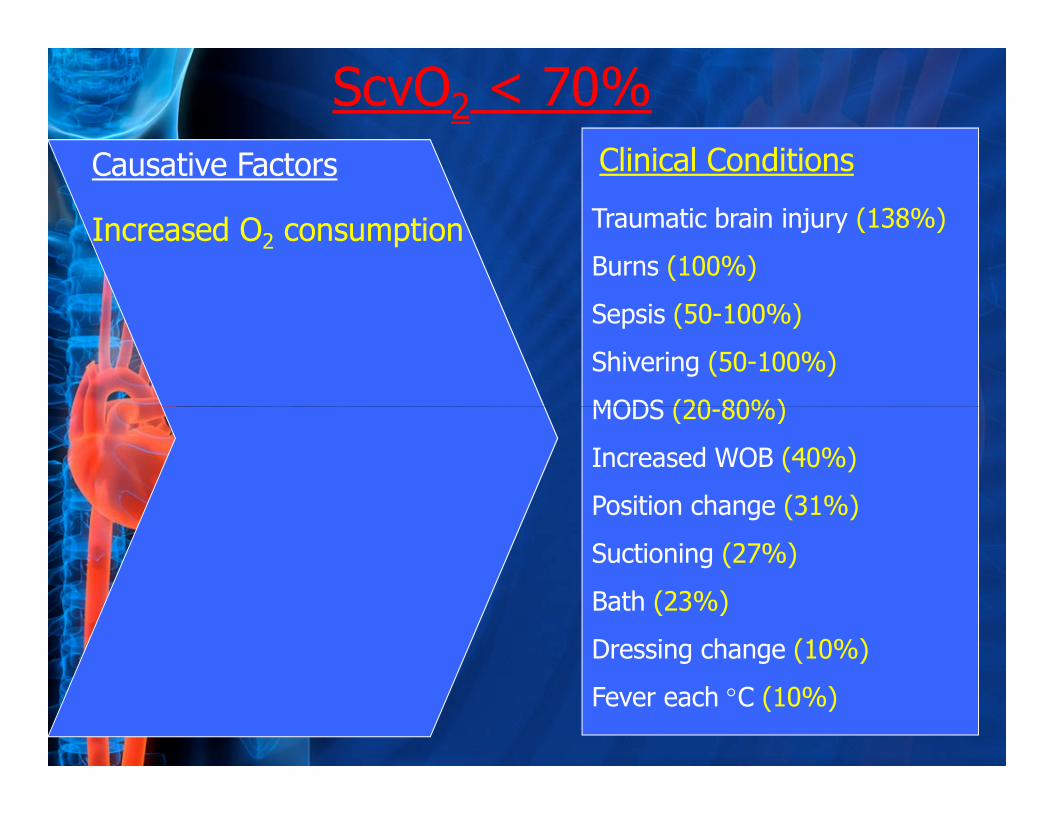
Causative Factors
Traumatic brain injury (138%)
Burns (100%)
Sepsis (50-100%)
Shivering (50-100%)
MODS (20-80%)
Increased O2 consumption
Clinical Conditions
ScvO2 < 70%
MODS (20-80%)
Increased WOB (40%)
Position change (31%)
Suctioning (27%)
Bath (23%)
Dressing change (10%)
Fever each °C (10%)
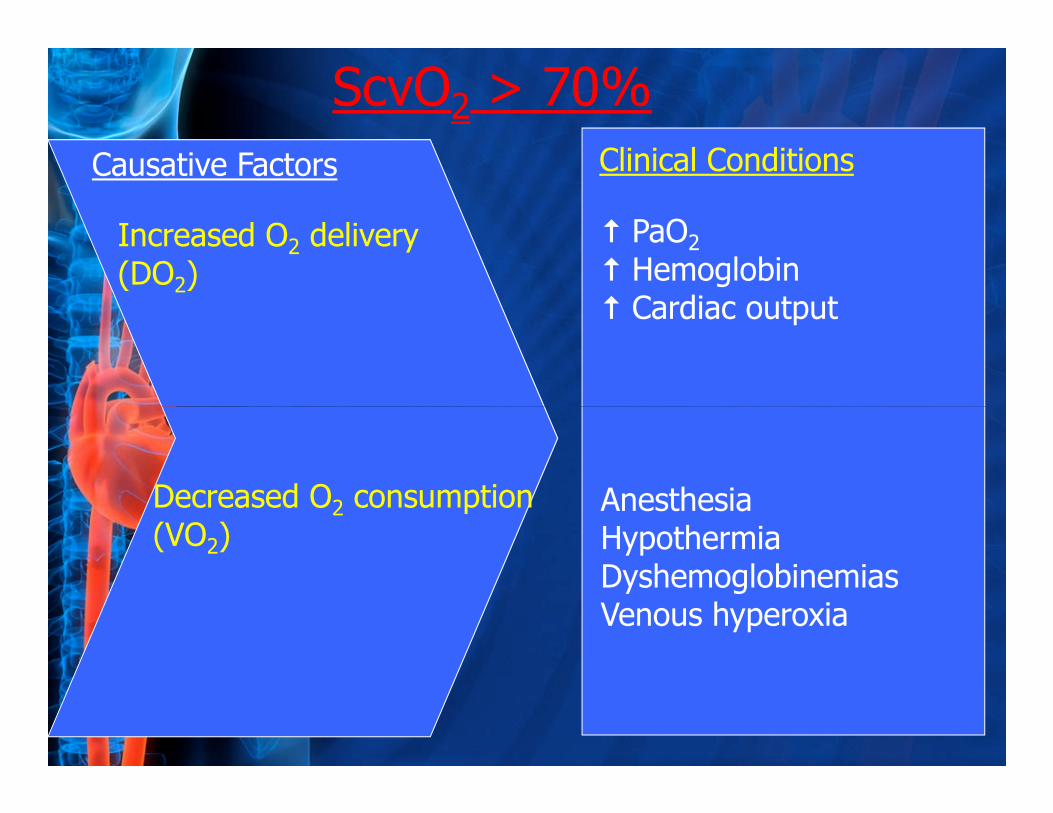
Causative Factors
� PaO2
� Hemoglobin � Cardiac output
Increased O2 delivery(DO2)
Clinical Conditions
ScvO2 > 70%
Decreased O2 consumption (VO2)
AnesthesiaHypothermiaDyshemoglobinemiasVenous hyperoxia
Understanding the clinical significance of
SvO2 (ScvO2) measurements….can help
guide clinical decision-making to assure
adequate oxygenation to meet tissue adequate oxygenation to meet tissue
needs.
(Sanders, 1997 Applied Pathophysiology)
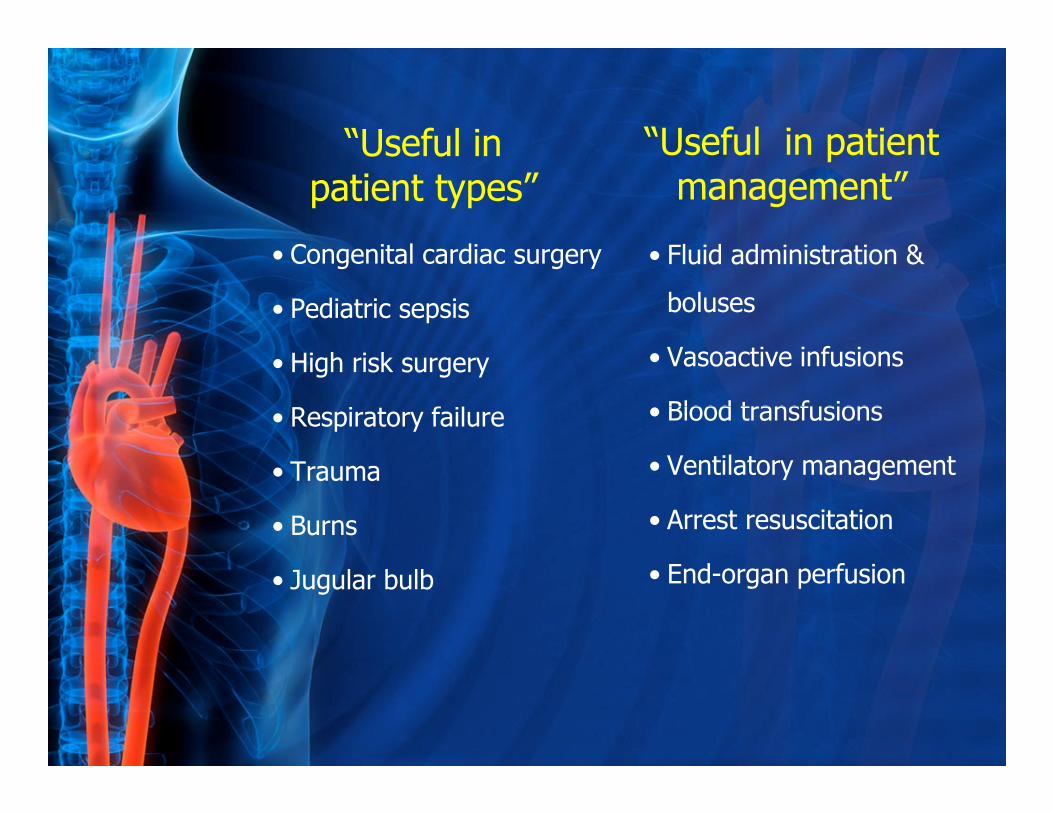
• Congenital cardiac surgery
• Pediatric sepsis
• High risk surgery
• Respiratory failure
• Fluid administration &
boluses
• Vasoactive infusions
• Blood transfusions
“Useful in patient management”
“Useful in patient types”
• Respiratory failure
• Trauma
• Burns
• Jugular bulb
• Blood transfusions
• Ventilatory management
• Arrest resuscitation
• End-organ perfusion

Thank You!
“Hypoxia not only stops the machine, it wrecks
the machinery” the machinery”
John Scott Haldane, 1880
[email protected]/pediasat