Embed Size (px)
Citation preview

Return TOC
2020 Virginia Polytechnic Institute and State University VCE-CNRE NP
Virginia Cooperative Extension programs and employment are open to all, regardless of age, color, disability, gender, gender identity, gender expression, national origin, political affiliation, race, religion, sexual orientation, genetic information, veteran status, or any other basis protected by law. An equal opportunity/affirmative action employer. Issued in furtherance of Cooperative Extension work, Virginia Polytechnic Institute and State University, Virginia State University, and the U.S. Department of Agriculture cooperating. Edwin J. Jones, Director, Virginia Cooperative Extension, Virginia Tech, Blacksburg; M. Ray McKinnie, Administrator, 1890 Extension Program, Virginia State University, Petersburg.
Delton Alderman
Forest Products Marketing Unit
Forest Products Laboratory
U.S. Forest Service
Madison, WI
304.431.2734
Urs Buehlmann
Department of Sustainable Biomaterials
College of Natural Resources & Environment
Virginia Tech
Blacksburg, VA
540.231.9759
The Virginia Tech – U.S. Forest Service January 2021
Housing Commentary: Section I
Return TOC
Table of Contents Slide 3: Opening Remarks
Slide 4: Housing Scorecard
Slide 5: Wood Use in Construction
Slide 8: New Housing Starts
Slide 15: Regional Housing Starts
Slide 21: New Housing Permits
Slide 25: Regional New Housing Permits
Slide 29: Housing Under Construction
Slide 31: Regional Under Construction
Slide 36: Housing Completions
Slide 38: Regional Housing Completions
Slide 43: New Single-Family House Sales
Slide 46: Region SF House Sales & Price
Slide 52: New SF Sales-Population Ratio
Slide 63: Construction Spending
Slide 66: Construction Spending Shares
Slide 69: Remodeling
Slide 77: Existing House Sales
Slide 88: Affordability
Slide 91: First-Time Purchasers
Slide 99: Summary
Slide 100: Virginia Tech Disclaimer
Slide 101: USDA Disclaimer
This report is a free monthly service of Virginia Tech. Past issues are available at:
http://woodproducts.sbio.vt.edu/housing-report.
To request the commentary, please email: [email protected] or [email protected]

Return TOC
Opening Remarks January housing data denoted the second consecutive month of total starts greater than 1.5-
million units. Month-over-month and year-over-year United States housing market data were
mostly positive. Aggregate multi-family starts decreased month-over-month and year-over year.
New and existing house sales were positive month-over-month and year-over-year. The New York
Federal Reserve Bank’s reported new mortgages, in the fourth quarter of 2020, totaled $1.2 trillion,
a record. Residential construction spending was positive month-over-month. On a year-over-year
basis, total and single-family expenditures improved 21% and 24%, respectively.
The March 8th Atlanta Fed GDPNow™ model forecast was an aggregate 16.3% increase for
total residential investment spending for March 2021. New private permanent site expenditures
were projected at 33.4%; the improvement spending forecast was 8.0%; and the
manufactured/mobile expenditures projection was 11.9% (all: quarterly log change and at a
seasonally adjusted annual rate).1
“Despite a hot market marked by rampant demand from eager buyers, home owners with the
potential to sell have stayed on the sidelines more so than Americans looking to buy – with
pandemic fears given as one of the main reasons for staying put. But if and when that anxiety
fades, many sellers may decide to enter the market and list their homes, helping to ease an ongoing
inventory crunch and also contributing to keeping home buying demand high as they list and look
for new homes themselves.”2 – Manny Garcia, Population Scientist, Zillow.
This month’s commentary contains applicable housing data. Section I contains relevant data,
remodeling, and housing finance commentary. Section II includes regional Federal Reserve
analysis, private firm indicators, and demographic and economic information.
Sources: 1 www.frbatlanta.org/cqer/research/gdpnow.aspx; 3/8/21; 2 https://www.zillow.com/research/covid-vaccine-housing-market-29008/; 2/23/21
Return TOC Sources: U.S. Department of Commerce-Construction; 1 FRED: Federal Reserve Bank of St. Louis
* All multi-family (2 to 4 + ≥ 5-units) M/M = month-over-month; Y/Y = year-over-year;
NC = No change
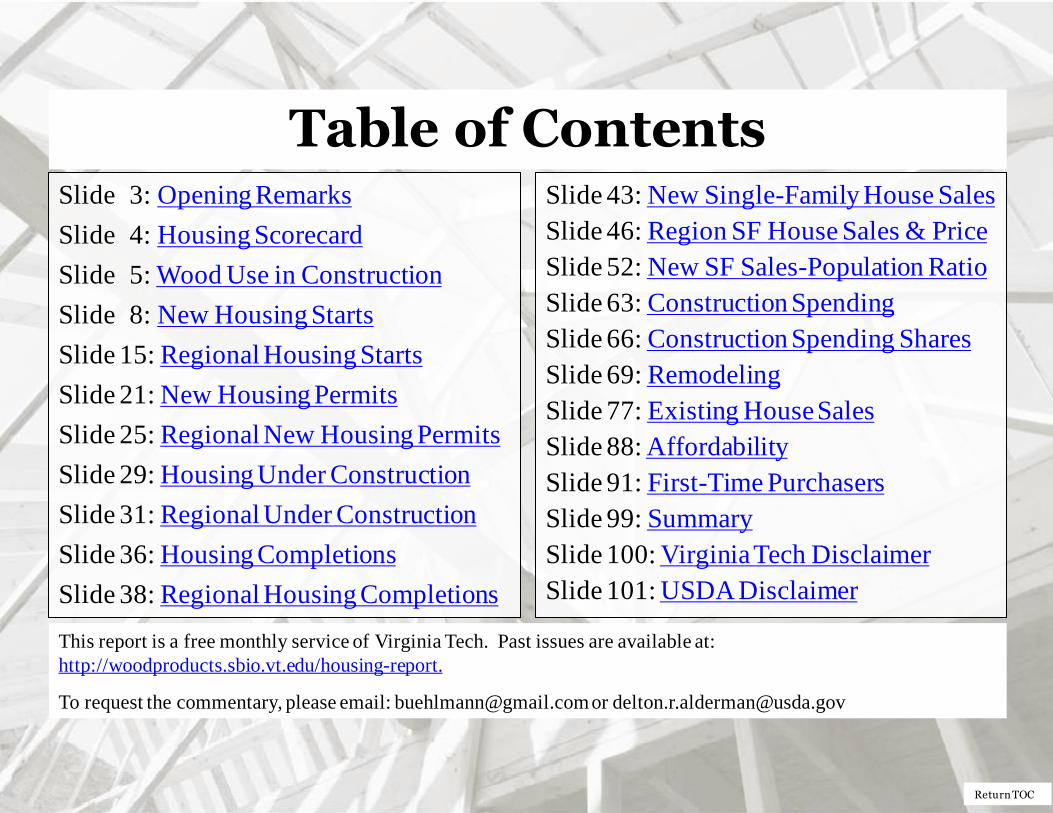
January 2020 Housing Scorecard
M/M Y/Y
Housing Starts ▲ 5.8% ▲ 5.2%
Single-Family (SF) Starts ▲ 12.0% ▲ 27.8%
Multi-Family (MF) Starts* ▼ 13.6% ▼ 38.7%
Housing Permits ▲ 4.2% ▲ 17.0%
SF Permits ▲ 7.6% ▲ 30.1%
MF Permits* ▼ 3.4% ▼ 7.0%
Housing Under Construction ▲ 0.6% ▲ 6.4%
SF Under Construction ▲ 1.1% ▲ 16.1%
Housing Completions ▼ 2.3% ▲ 2.4%
SF Completions ▲ 10.0% ▲ 14.3%
New SF House Sales ▲ 4.3% ▲ 19.3%
Private Residential Construction Spending ▲ 2.5% ▲ 21.0%
SF Construction Spending ▲ 3.0% ▲ 24.2%
Existing House Sales1 ▲ 0.6% ▲ 23.7%

Return TOC
New Construction’s Percentage of Wood Products Consumption
Source: USDA Forest Service. Howard, J., S. Liang, and D. McKeever. 2017. U.S. Forest Products Annual Market Review and Prosp ects, 2013-2017
21%
32%
47%
Non-structural panels Total Sawnwood Structural panels
Return TOC
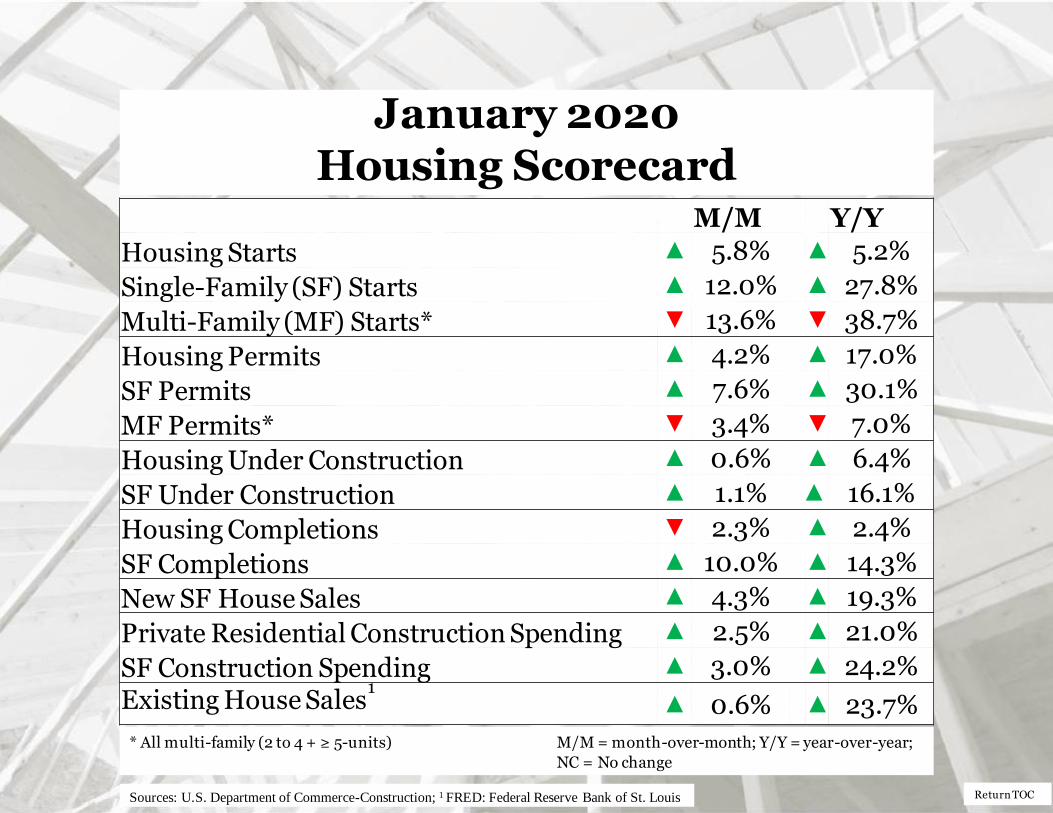
New SF Construction Percentage of Wood Products Consumption
14%
86%
Non-structural panels:
New Housing
Other markets
25%
75%
All Sawnwood: New housing
Other markets
40% 60%
Structural panels:
New housing
Other markets
Source: USDA Forest Service. Howard, J., S. Liang, and D. McKeever. 2017. U.S. Forest Products Annual Market Review and Prosp ects, 2013-2017
Return TOC
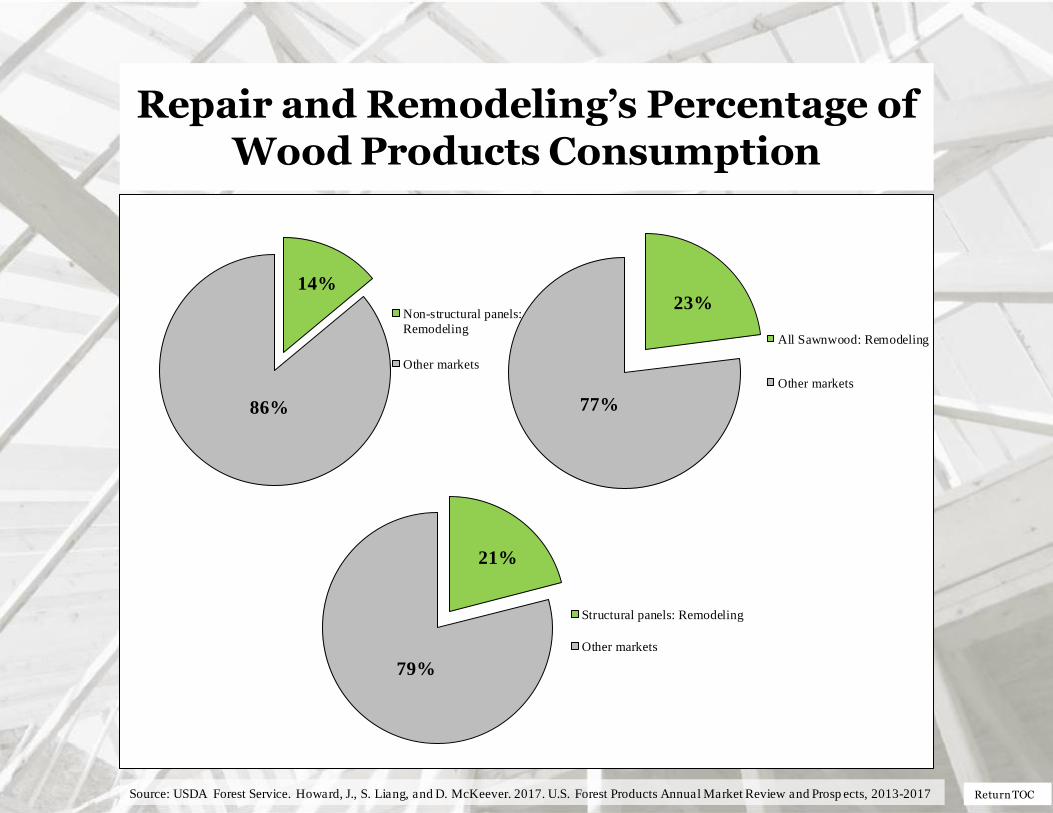
Repair and Remodeling’s Percentage of Wood Products Consumption
14%
86%
Non-structural panels:
Remodeling
Other markets
23%
77%
All Sawnwood: Remodeling
Other markets
21%
79%
Structural panels: Remodeling
Other markets
Source: USDA Forest Service. Howard, J., S. Liang, and D. McKeever. 2017. U.S. Forest Products Annual Market Review and Prosp ects, 2013-2017
Return TOC
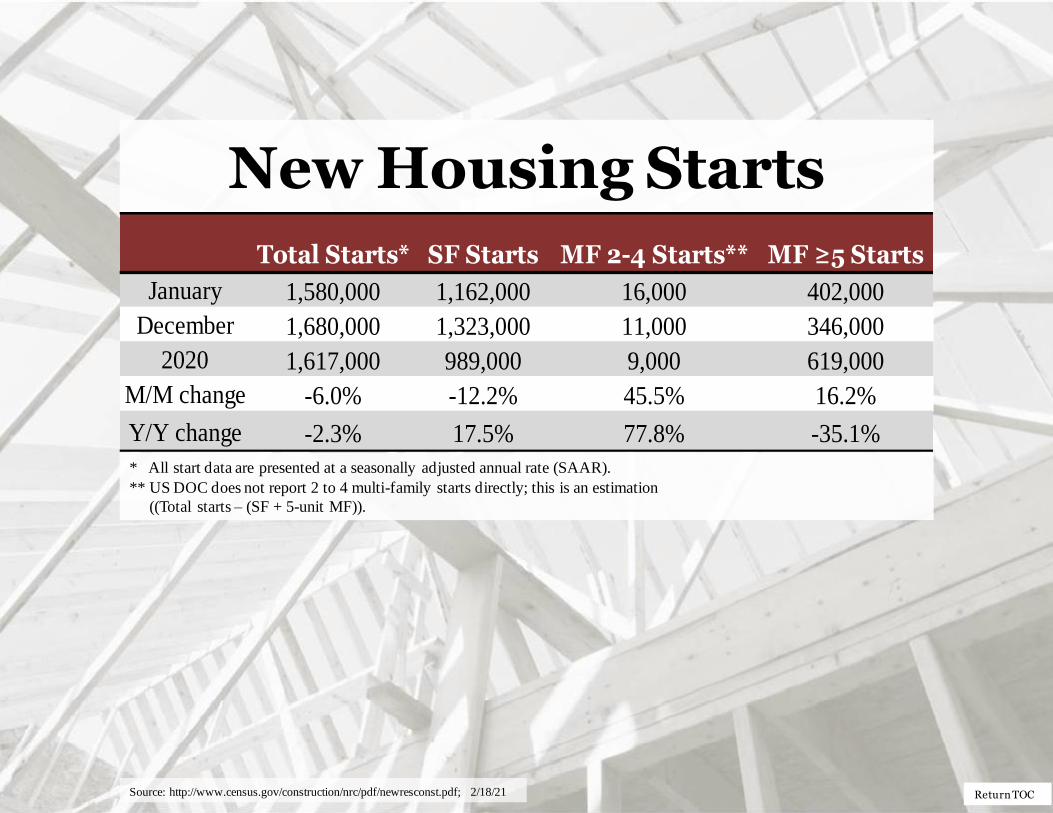
New Housing Starts
* All start data are presented at a seasonally adjusted annual rate (SAAR).
** US DOC does not report 2 to 4 multi-family starts directly; this is an estimation
((Total starts – (SF + 5-unit MF)).
Source: http://www.census.gov/construction/nrc/pdf/newresconst.pdf; 2/18/21
Total Starts* SF Starts MF 2-4 Starts** MF ≥5 Starts
January 1,580,000 1,162,000 16,000 402,000
December 1,680,000 1,323,000 11,000 346,000
2020 1,617,000 989,000 9,000 619,000
M/M change -6.0% -12.2% 45.5% 16.2%
Y/Y change -2.3% 17.5% 77.8% -35.1%
Return TOC
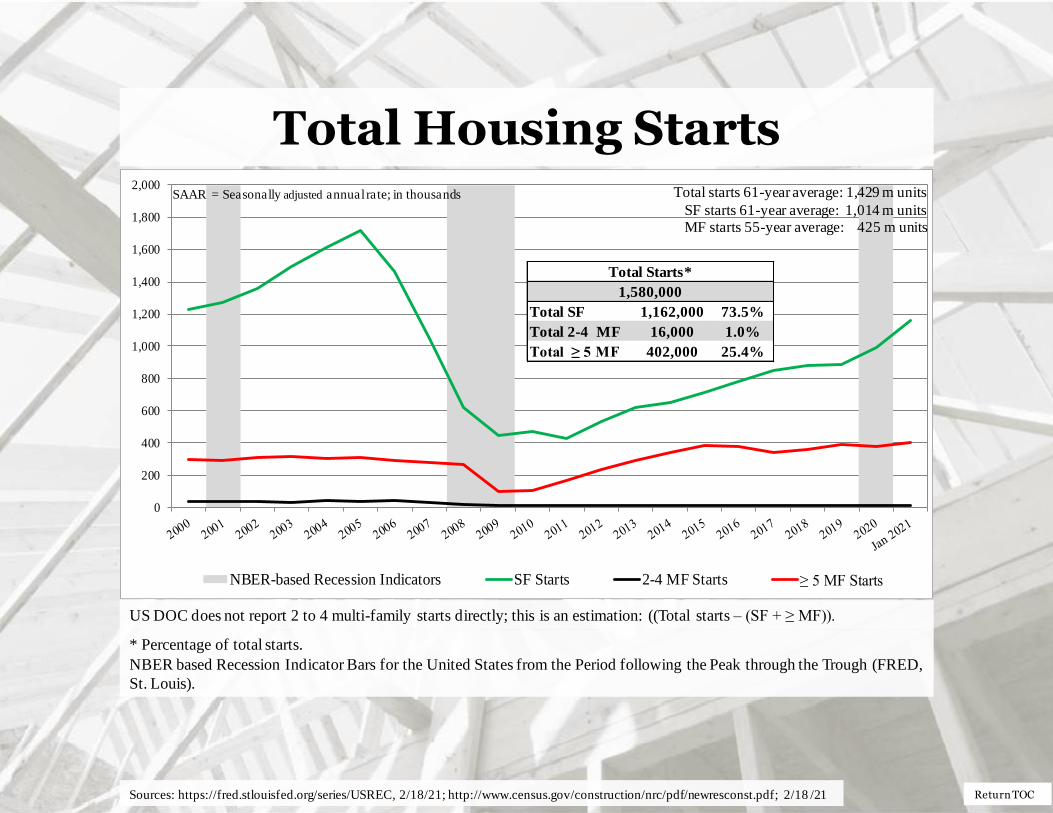
Total Housing Starts
* Percentage of total starts.
NBER based Recession Indicator Bars for the United States from the Period following the Peak through the Trough (FRED,
St. Louis).
US DOC does not report 2 to 4 multi-family starts directly; this is an estimation: ((Total starts – (SF + ≥ MF)).
Sources: https://fred.stlouisfed.org/series/USREC, 2/18/21; http://www.census.gov/construction/nrc/pdf/newresconst.pdf; 2/18 /21
0
200
400
600
800
1,000
1,200
1,400
1,600
1,800
2,000
NBER-based Recession Indicators SF Starts 2-4 MF Starts ≥ 5 MF Starts
SAAR = Seasonally adjusted annual rate; in thousands Total starts 61-year average: 1,429 m units
SF starts 61-year average: 1,014 m units MF starts 55-year average: 425 m units
Total SF 1,162,000 73.5%
Total 2-4 MF 16,000 1.0%
Total ≥ 5 MF 402,000 25.4%
Total Starts*
1,580,000
Return TOC
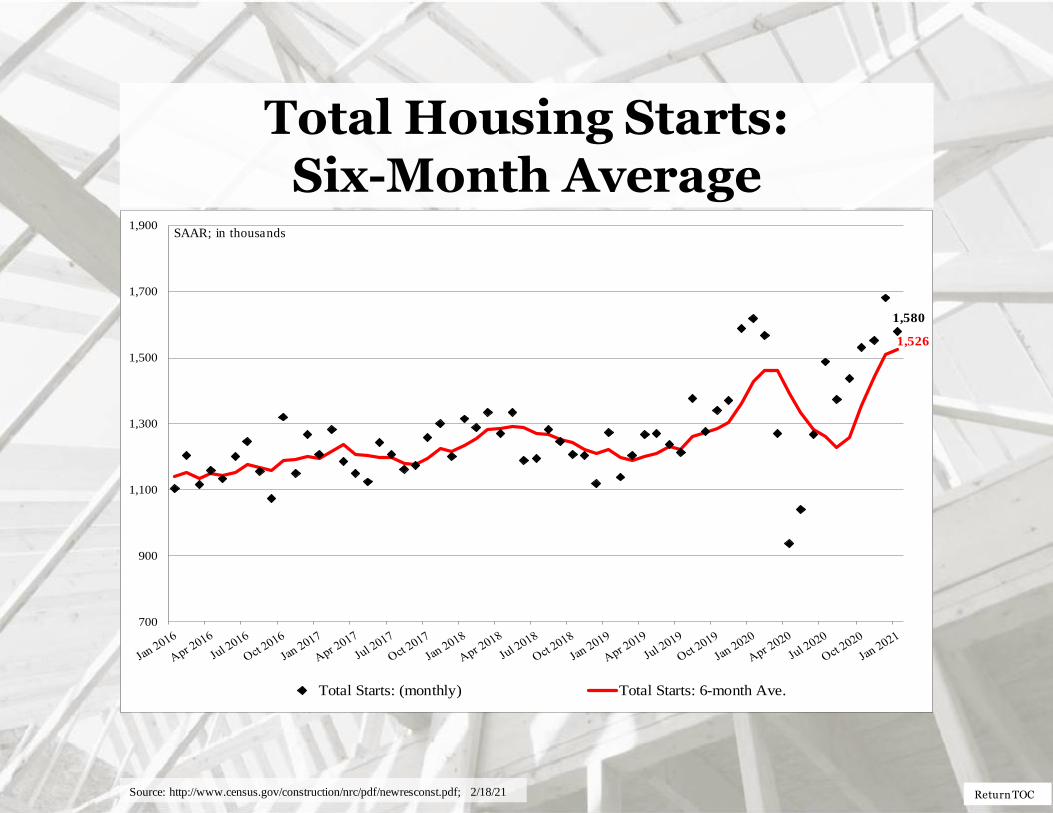
Total Housing Starts: Six-Month Average
Source: http://www.census.gov/construction/nrc/pdf/newresconst.pdf; 2/18/21
1,580
1,526
700
900
1,100
1,300
1,500
1,700
1,900
Total Starts: (monthly) Total Starts: 6-month Ave.
SAAR; in thousands
Return TOC
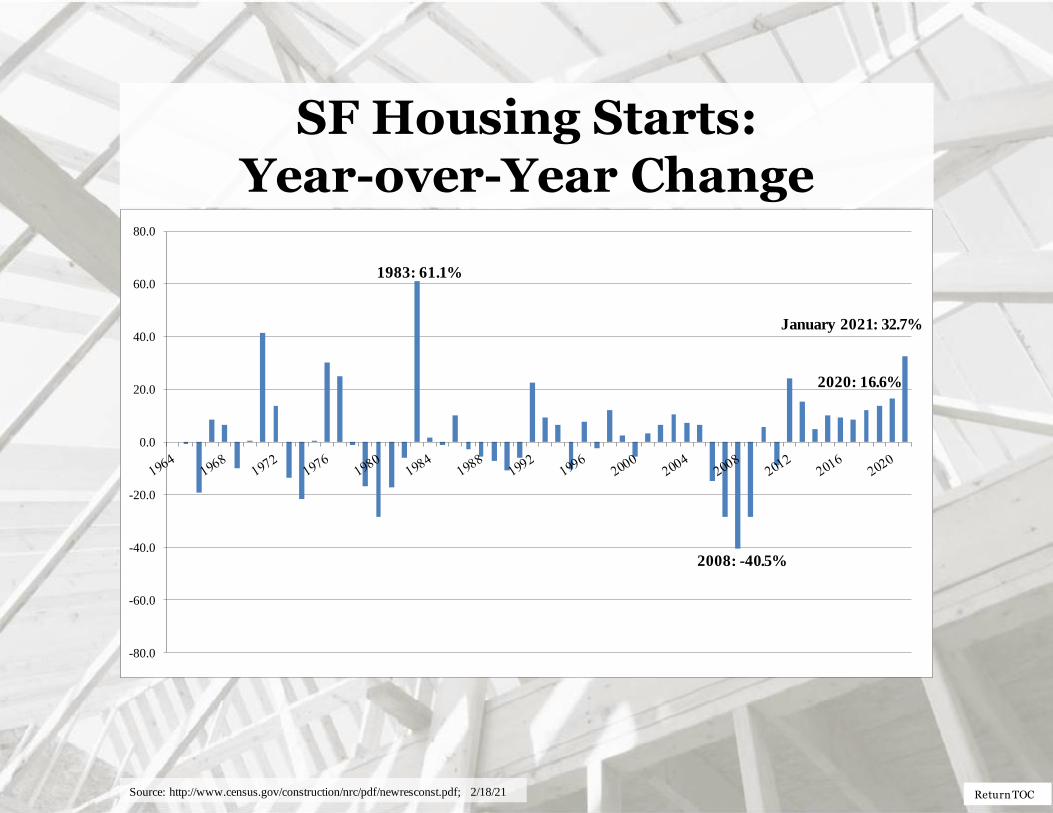
SF Housing Starts: Year-over-Year Change
Source: http://www.census.gov/construction/nrc/pdf/newresconst.pdf; 2/18/21
-80.0
-60.0
-40.0
-20.0
0.0
20.0
40.0
60.0
80.0
1983: 61.1%
2008: -40.5%
2020: 16.6%
January 2021: 32.7%
Return TOC
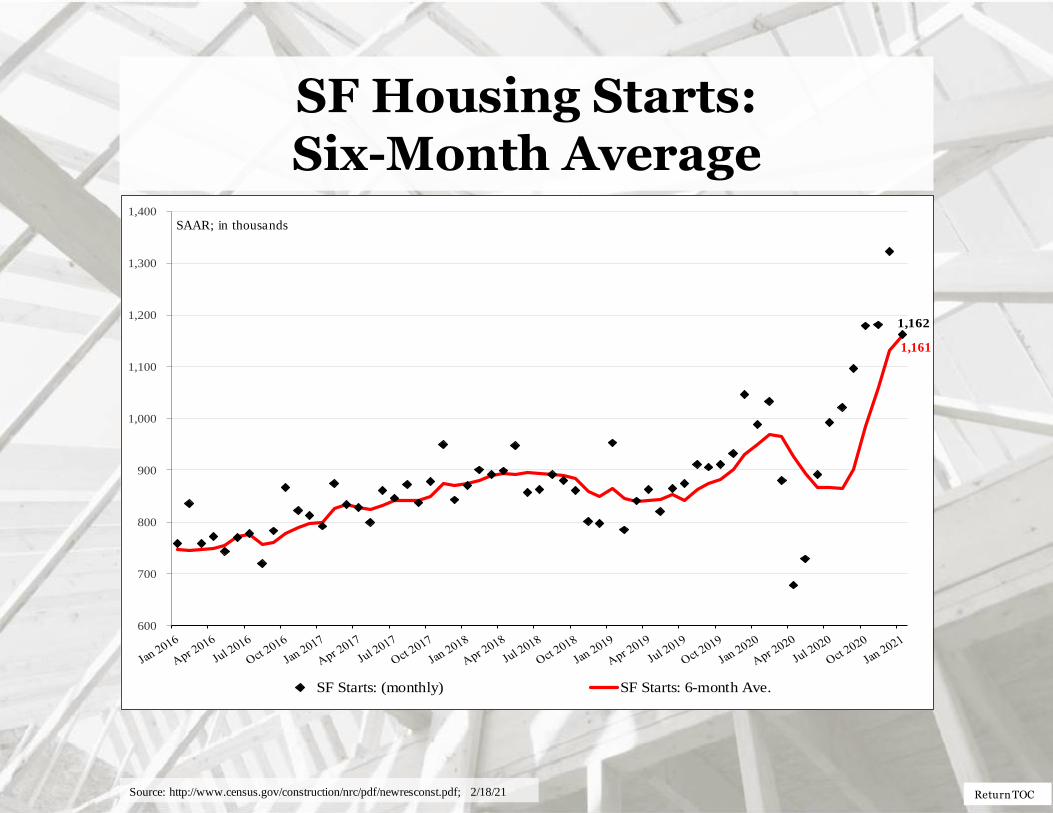
SF Housing Starts: Six-Month Average
Source: http://www.census.gov/construction/nrc/pdf/newresconst.pdf; 2/18/21
1,162
600
700
800
900
1,000
1,100
1,200
1,300
1,400
SF Starts: (monthly) SF Starts: 6-month Ave.
SAAR; in thousands
1,161
Return TOC
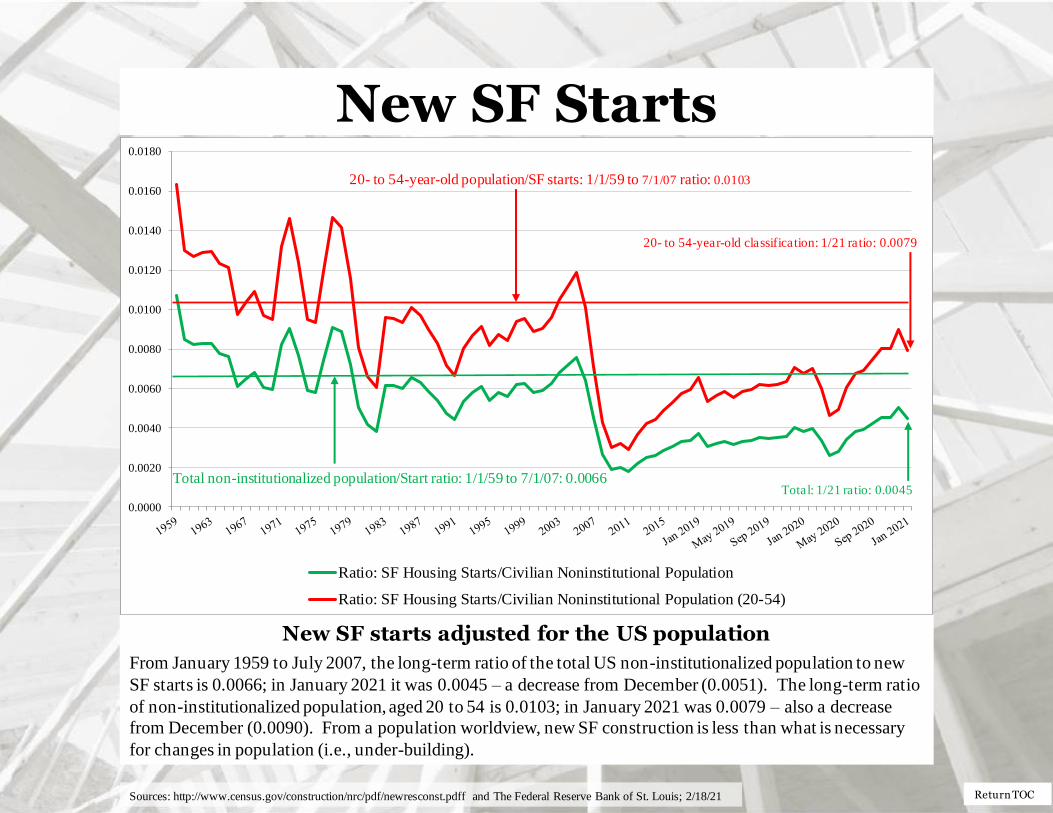
New SF Starts
Sources: http://www.census.gov/construction/nrc/pdf/newresconst.pdff and The Federal Reserve Bank of St. Louis; 2/18/21
New SF starts adjusted for the US population
From January 1959 to July 2007, the long-term ratio of the total US non-institutionalized population to new
SF starts is 0.0066; in January 2021 it was 0.0045 – a decrease from December (0.0051). The long-term ratio
of non-institutionalized population, aged 20 to 54 is 0.0103; in January 2021 was 0.0079 – also a decrease
from December (0.0090). From a population worldview, new SF construction is less than what is necessary
for changes in population (i.e., under-building).
0.0000
0.0020
0.0040
0.0060
0.0080
0.0100
0.0120
0.0140
0.0160
0.0180
Ratio: SF Housing Starts/Civilian Noninstitutional Population
Ratio: SF Housing Starts/Civilian Noninstitutional Population (20-54)
Total non-institutionalized population/Start ratio: 1/1/59 to 7/1/07: 0.0066 Total: 1/21 ratio: 0.0045
20- to 54-year-old population/SF starts: 1/1/59 to 7/1/07 ratio: 0.0103
20- to 54-year-old classification: 1/21 ratio: 0.0079
Return TOC
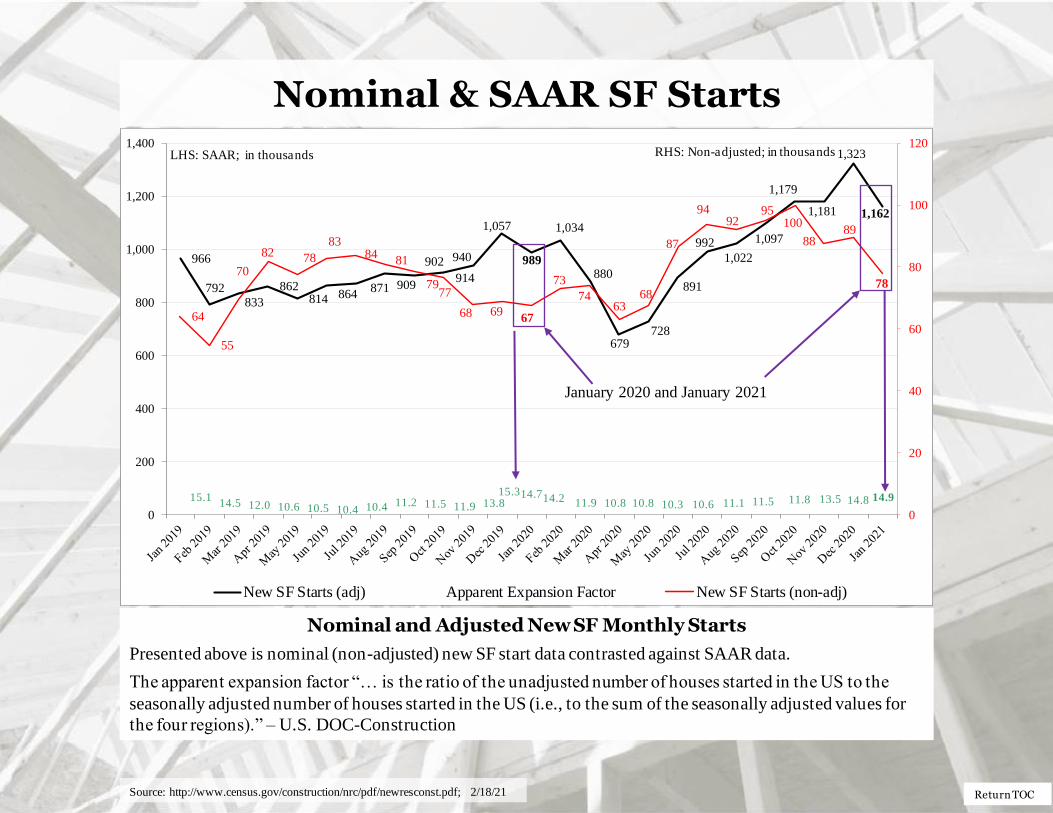
Nominal & SAAR SF Starts
Nominal and Adjusted New SF Monthly Starts
Presented above is nominal (non-adjusted) new SF start data contrasted against SAAR data.
The apparent expansion factor “… is the ratio of the unadjusted number of houses started in the US to the
seasonally adjusted number of houses started in the US (i.e., to the sum of the seasonally adjusted values for
the four regions).” – U.S. DOC-Construction
Source: http://www.census.gov/construction/nrc/pdf/newresconst.pdf; 2/18/21
966
792833
862814 864
871 909
902
914
940
1,057
989
1,034
880
679728
891
992
1,022
1,097
1,179
1,181
1,323
1,162
15.114.5 12.0 10.6 10.5 10.4 10.4 11.2 11.5 11.9 13.8
15.314.714.2 11.9 10.8 10.8 10.3 10.6 11.1 11.5 11.8 13.5 14.8 14.9
64
55
70
82 78
8384
81
7977
68 6967
73
7463
68
87
9492
95100
8889
78
0
20
40
60
80
100
120
0
200
400
600
800
1,000
1,200
1,400
New SF Starts (adj) Apparent Expansion Factor New SF Starts (non-adj)
January 2020 and January 2021
LHS: SAAR; in thousands RHS: Non-adjusted; in thousands
Return TOC
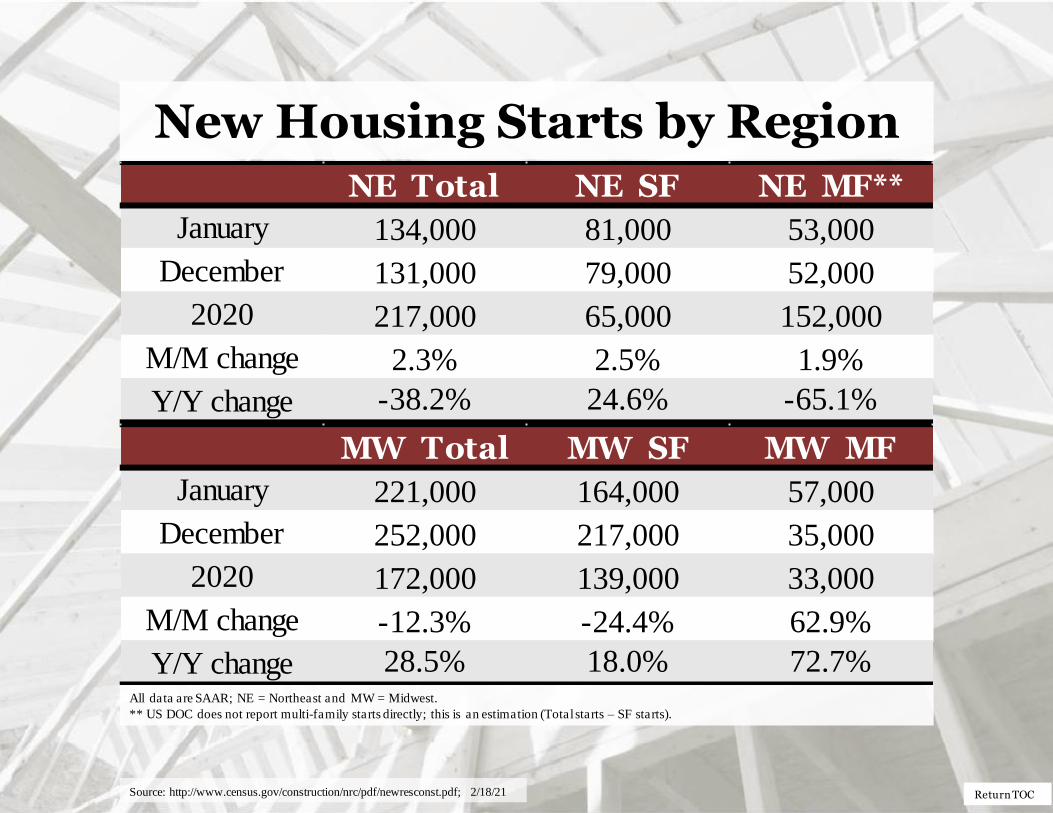
New Housing Starts by Region
All data are SAAR; NE = Northeast and MW = Midwest.
** US DOC does not report multi-family starts directly; this is an estimation (Total starts – SF starts).
Source: http://www.census.gov/construction/nrc/pdf/newresconst.pdf; 2/18/21
NE Total NE SF NE MF**
January 134,000 81,000 53,000
December 131,000 79,000 52,000
2020 217,000 65,000 152,000
M/M change 2.3% 2.5% 1.9%
Y/Y change -38.2% 24.6% -65.1%
MW Total MW SF MW MF
January 221,000 164,000 57,000
December 252,000 217,000 35,000
2020 172,000 139,000 33,000
M/M change -12.3% -24.4% 62.9%
Y/Y change 28.5% 18.0% 72.7%
Return TOC
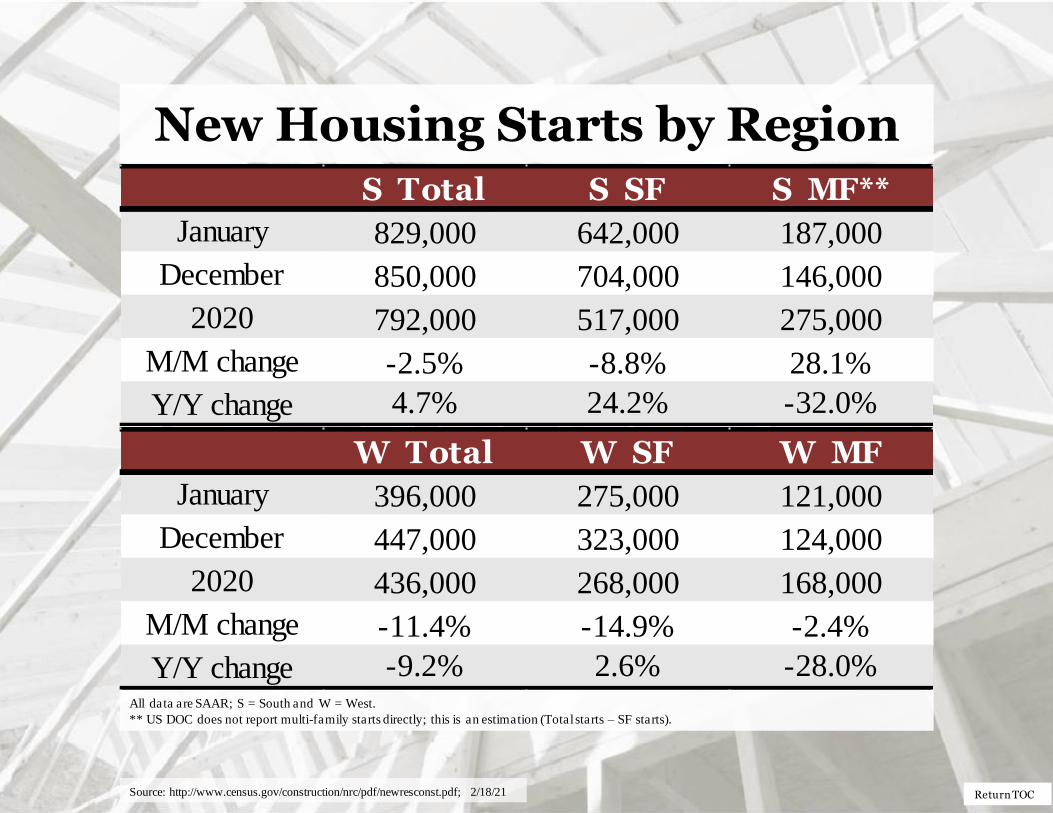
New Housing Starts by Region
All data are SAAR; S = South and W = West.
** US DOC does not report multi-family starts directly; this is an estimation (Total starts – SF starts).
Source: http://www.census.gov/construction/nrc/pdf/newresconst.pdf; 2/18/21
S Total S SF S MF**
January 829,000 642,000 187,000
December 850,000 704,000 146,000
2020 792,000 517,000 275,000
M/M change -2.5% -8.8% 28.1%
Y/Y change 4.7% 24.2% -32.0%
W Total W SF W MF
January 396,000 275,000 121,000
December 447,000 323,000 124,000
2020 436,000 268,000 168,000
M/M change -11.4% -14.9% -2.4%
Y/Y change -9.2% 2.6% -28.0%
Return TOC
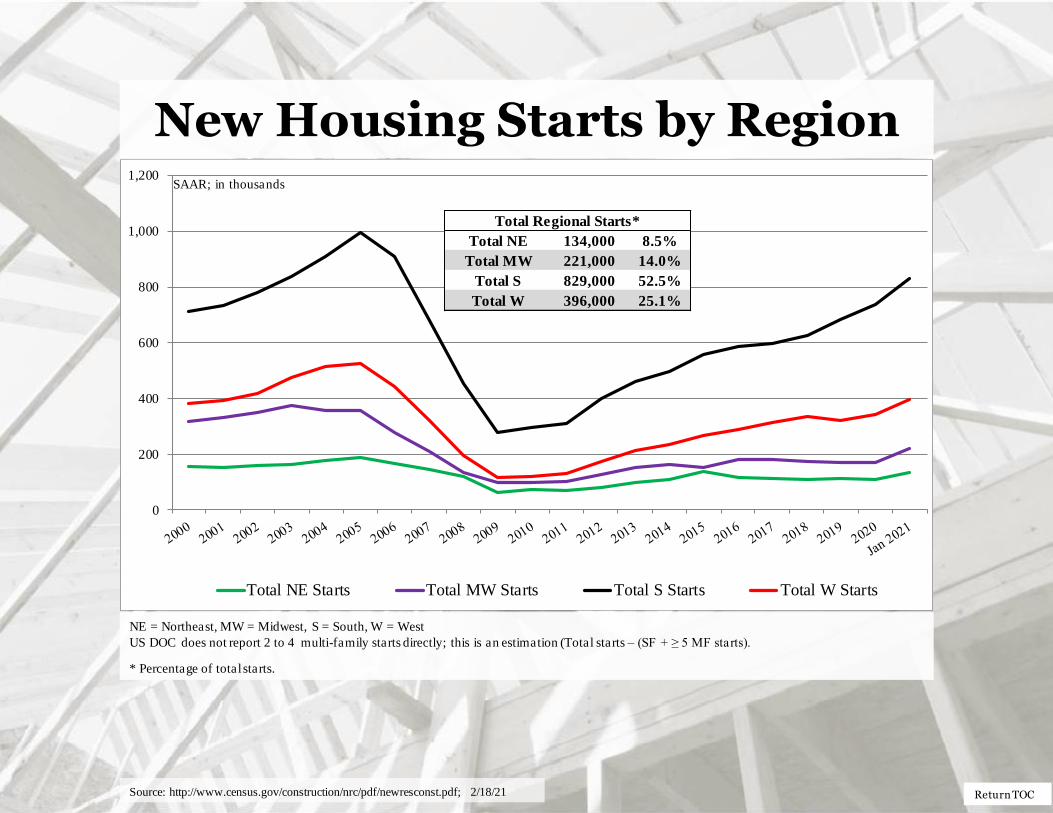
New Housing Starts by Region
NE = Northeast, MW = Midwest, S = South, W = West
US DOC does not report 2 to 4 multi-family starts directly; this is an estimation (Total starts – (SF + ≥ 5 MF starts).
* Percentage of total starts.
Source: http://www.census.gov/construction/nrc/pdf/newresconst.pdf; 2/18/21
0
200
400
600
800
1,000
1,200
Total NE Starts Total MW Starts Total S Starts Total W Starts
SAAR; in thousands
Total NE 134,000 8.5%
Total MW 221,000 14.0%
Total S 829,000 52.5%
Total W 396,000 25.1%
Total Regional Starts*
Return TOC
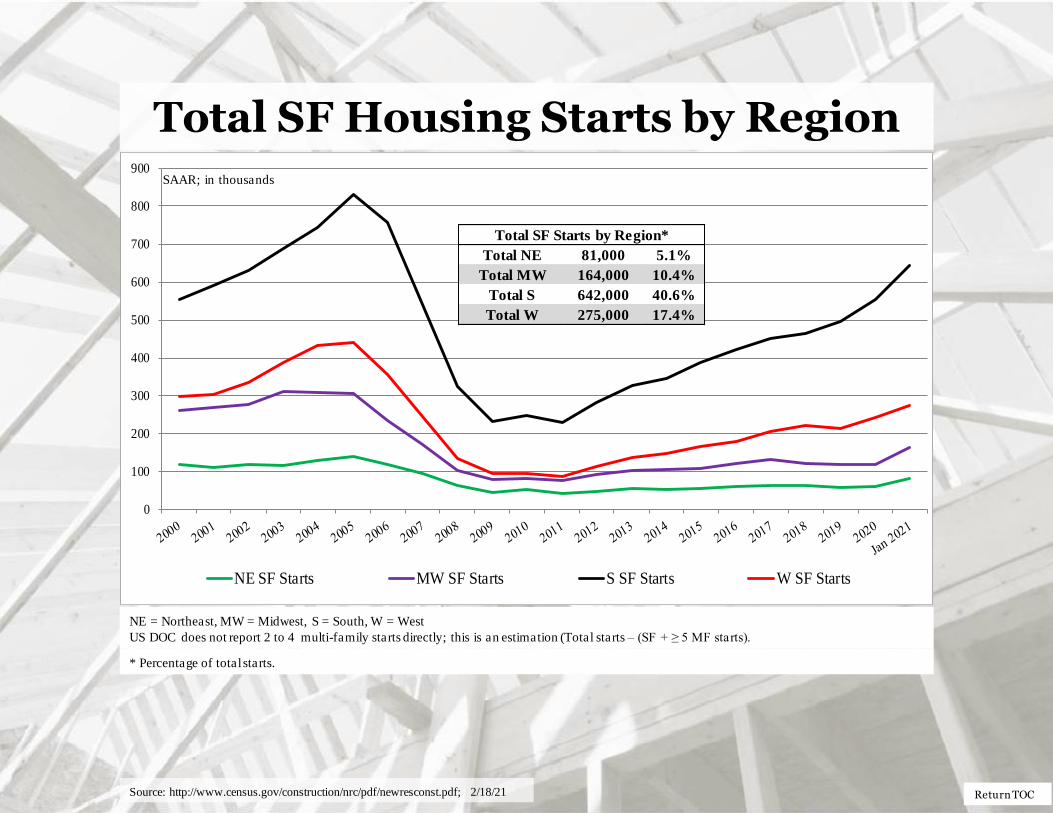
Total SF Housing Starts by Region
* Percentage of total starts.
NE = Northeast, MW = Midwest, S = South, W = West
US DOC does not report 2 to 4 multi-family starts directly; this is an estimation (Total starts – (SF + ≥ 5 MF starts).
Source: http://www.census.gov/construction/nrc/pdf/newresconst.pdf; 2/18/21
0
100
200
300
400
500
600
700
800
900
NE SF Starts MW SF Starts S SF Starts W SF Starts
SAAR; in thousands
Total NE 81,000 5.1%
Total MW 164,000 10.4%
Total S 642,000 40.6%
Total W 275,000 17.4%
Total SF Starts by Region*
Return TOC
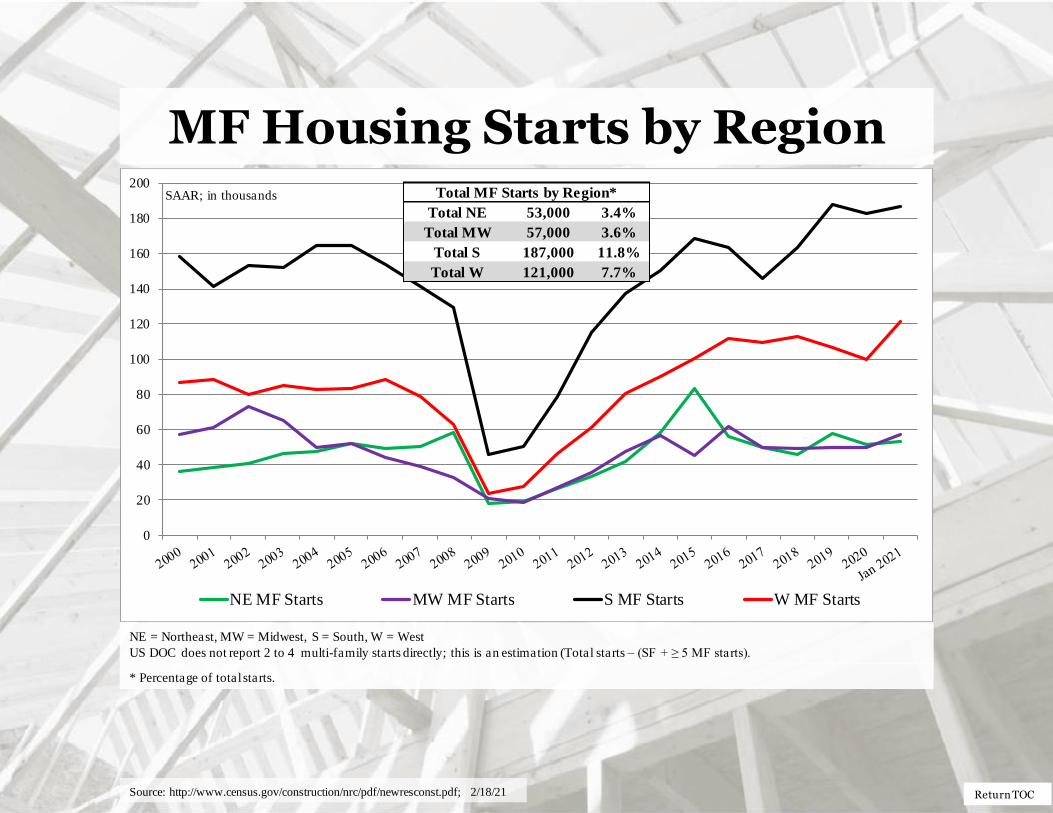
MF Housing Starts by Region
* Percentage of total starts.
NE = Northeast, MW = Midwest, S = South, W = West
US DOC does not report 2 to 4 multi-family starts directly; this is an estimation (Total starts – (SF + ≥ 5 MF starts).
Source: http://www.census.gov/construction/nrc/pdf/newresconst.pdf; 2/18/21
0
20
40
60
80
100
120
140
160
180
200
NE MF Starts MW MF Starts S MF Starts W MF Starts
SAAR; in thousands
Total NE 53,000 3.4%
Total MW 57,000 3.6%
Total S 187,000 11.8%
Total W 121,000 7.7%
Total MF Starts by Region*
Return TOC
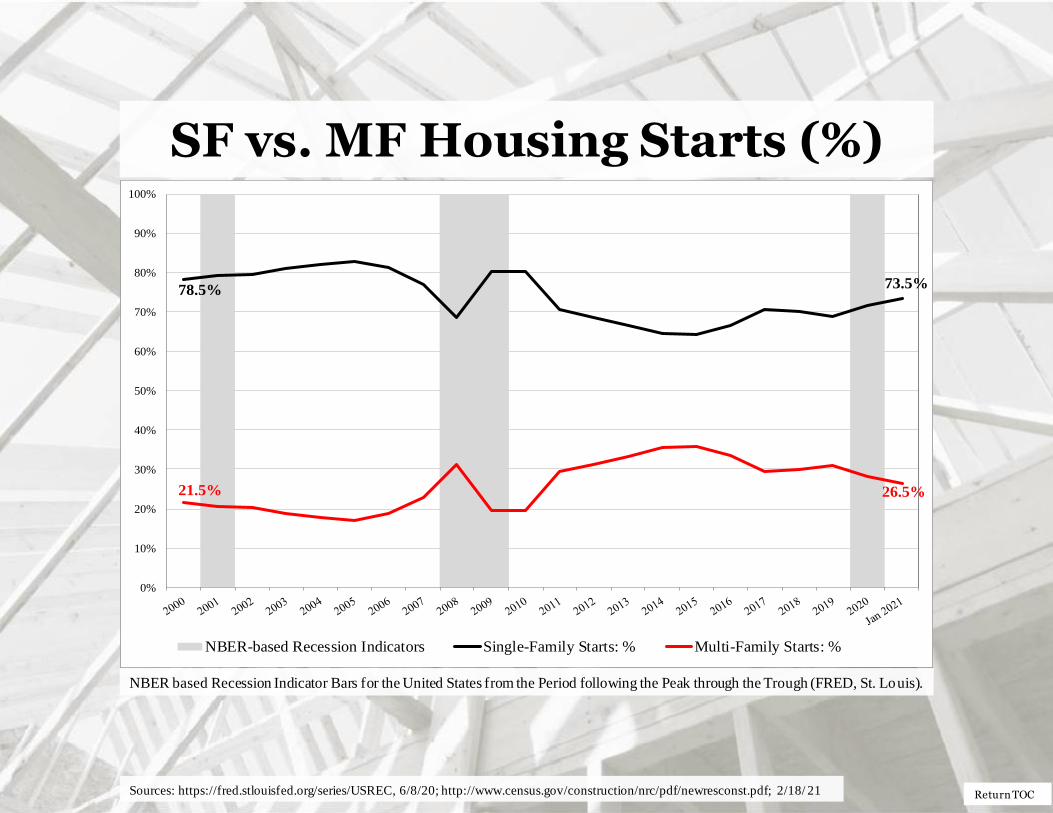
SF vs. MF Housing Starts (%)
NBER based Recession Indicator Bars for the United States from the Period following the Peak through the Trough (FRED, St. Louis).
Sources: https://fred.stlouisfed.org/series/USREC, 6/8/20; http://www.census.gov/construction/nrc/pdf/newresconst.pdf; 2/18/ 21
78.5% 73.5%
21.5% 26.5%
0%
10%
20%
30%
40%
50%
60%
70%
80%
90%
100%
NBER-based Recession Indicators Single-Family Starts: % Multi-Family Starts: %
Return TOC
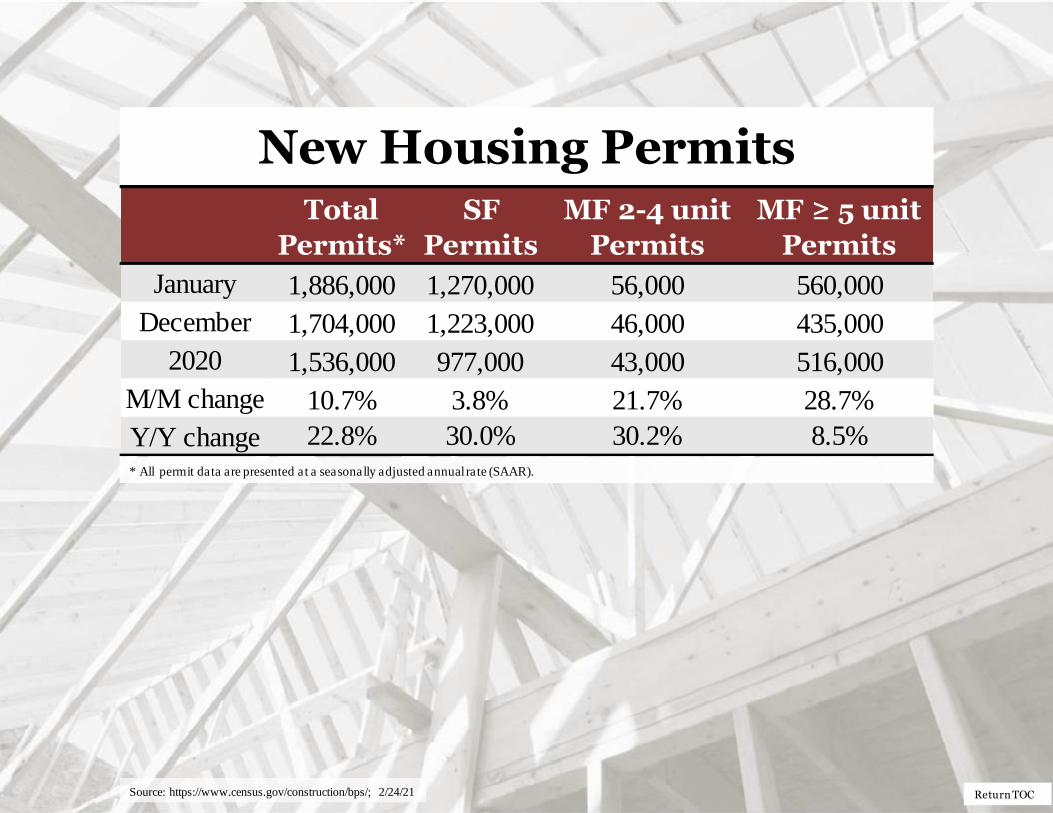
New Housing Permits
* All permit data are presented at a seasonally adjusted annual rate (SAAR).
Source: https://www.census.gov/construction/bps/; 2/24/21
Total
Permits*
SF
Permits
MF 2-4 unit
Permits
MF ≥ 5 unit
Permits
January 1,886,000 1,270,000 56,000 560,000
December 1,704,000 1,223,000 46,000 435,000
2020 1,536,000 977,000 43,000 516,000
M/M change 10.7% 3.8% 21.7% 28.7%
Y/Y change 22.8% 30.0% 30.2% 8.5%
Return TOC
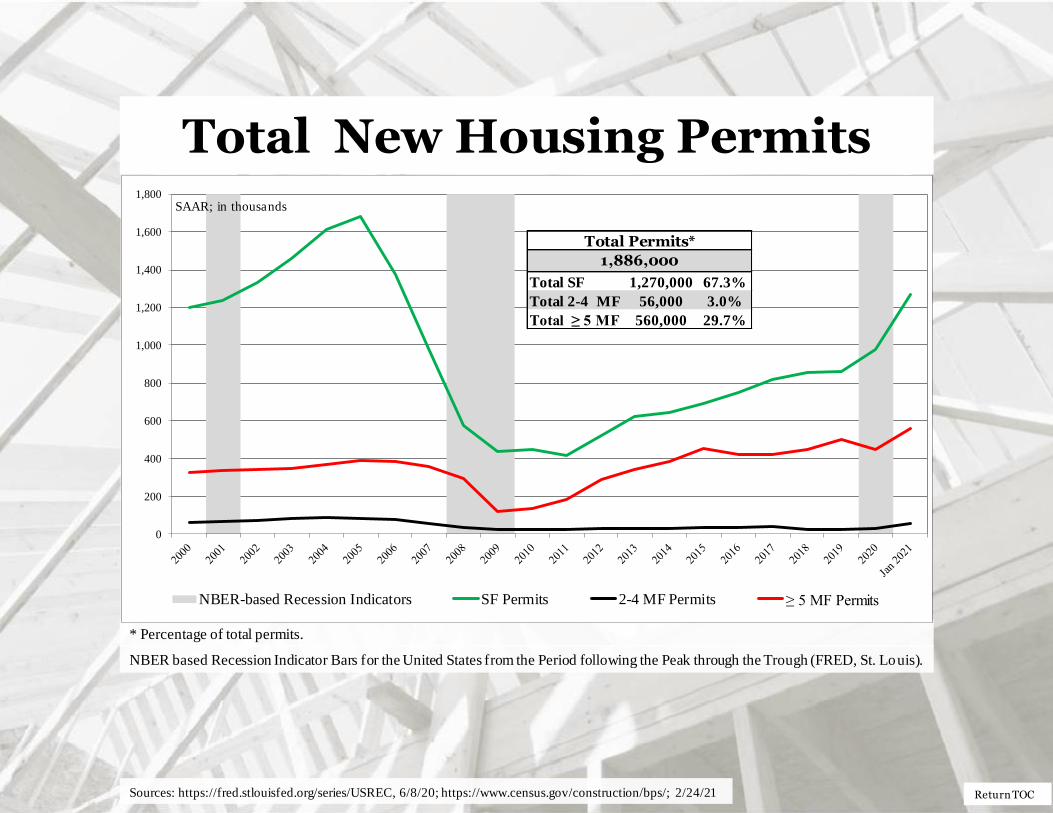
Total New Housing Permits
* Percentage of total permits.
NBER based Recession Indicator Bars for the United States from the Period following the Peak through the Trough (FRED, St. Louis).
Sources: https://fred.stlouisfed.org/series/USREC, 6/8/20; https://www.census.gov/construction/bps/; 2/24/21
0
200
400
600
800
1,000
1,200
1,400
1,600
1,800
NBER-based Recession Indicators SF Permits 2-4 MF Permits ≥ 5 MF Permits
SAAR; in thousands
Total SF 1,270,000 67.3%
Total 2-4 MF 56,000 3.0%
Total ≥ 5 MF 560,000 29.7%
Total Permits*
1,886,000
Return TOC
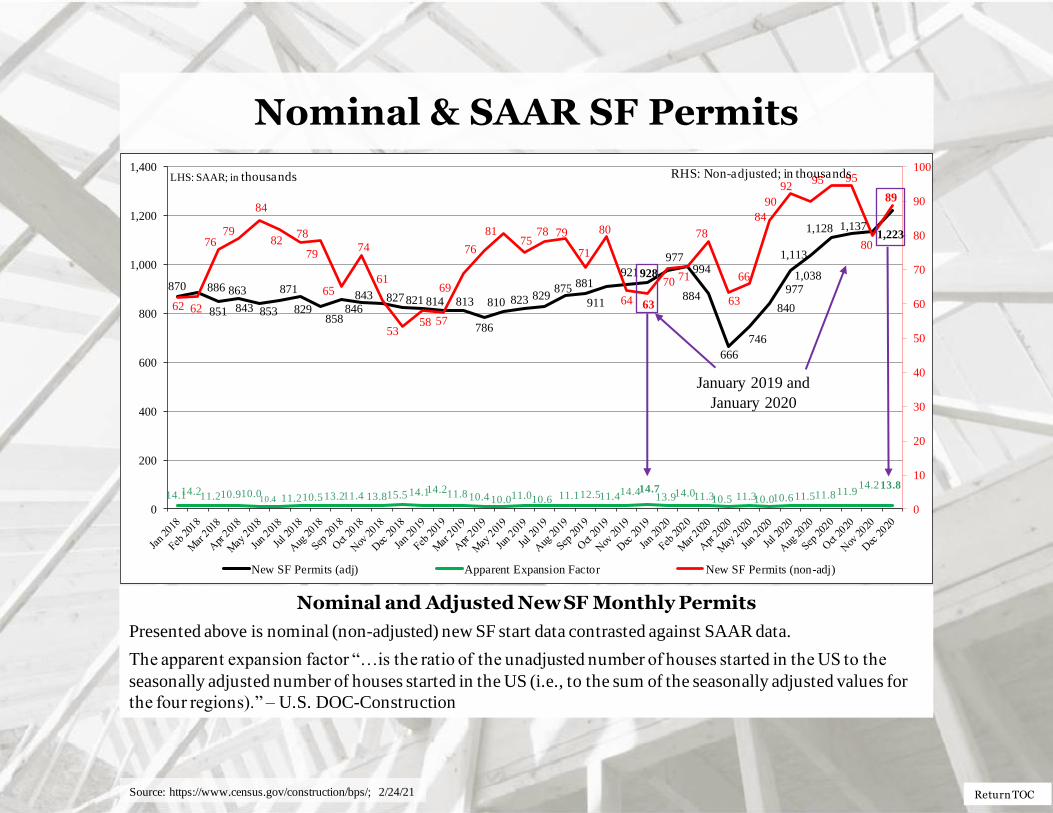
Nominal & SAAR SF Permits
Nominal and Adjusted New SF Monthly Permits
Presented above is nominal (non-adjusted) new SF start data contrasted against SAAR data.
The apparent expansion factor “…is the ratio of the unadjusted number of houses started in the US to the
seasonally adjusted number of houses started in the US (i.e., to the sum of the seasonally adjusted values for
the four regions).” – U.S. DOC-Construction
870 886
851
863
843 853
871
829858
846843 827821 814 813
786
810 823 829875 881
911
921928
977994
884
666
746
840
9771,038
1,113
1,128 1,1371,223
14.114.211.210.910.010.4 11.210.513.211.4 13.815.5 14.114.211.8 10.4 10.011.010.6 11.112.511.414.414.7
13.914.011.310.5 11.310.010.611.511.811.914.213.8
62 62
7679
84
8278
79
65
74
61
5358 57
69
76
8175
78 79
71
80
64 63
70 71
78
63
66
84
92
90
95 95
80
89
0
10
20
30
40
50
60
70
80
90
100
0
200
400
600
800
1,000
1,200
1,400
New SF Permits (adj) Apparent Expansion Factor New SF Permits (non-adj)
January 2019 and
January 2020
RHS: Non-adjusted; in thousands LHS: SAAR; in thousands
Source: https://www.census.gov/construction/bps/; 2/24/21

Return TOC
New Housing Permits by Region
NE = Northeast; MW = Midwest
* All data are SAAR
** US DOC does not report multi-family permits directly; this is an estimation (Total permits – SF permits).
NE Total* NE SF NE MF**
January 193,000 80,000 113,000
December 140,000 72,000 68,000
2020 179,000 67,000 112,000
M/M change 37.9% 11.1% 66.2%
Y/Y change 7.8% 19.4% 0.9%
MW Total* MW SF MW MF**
January 246,000 178,000 68,000
December 248,000 171,000 77,000
2020 217,000 135,000 82,000
M/M change -0.8% 4.1% -11.7%
Y/Y change 13.4% 31.9% -17.1%
Source: https://www.census.gov/construction/bps/; 2/24/21
Return TOC
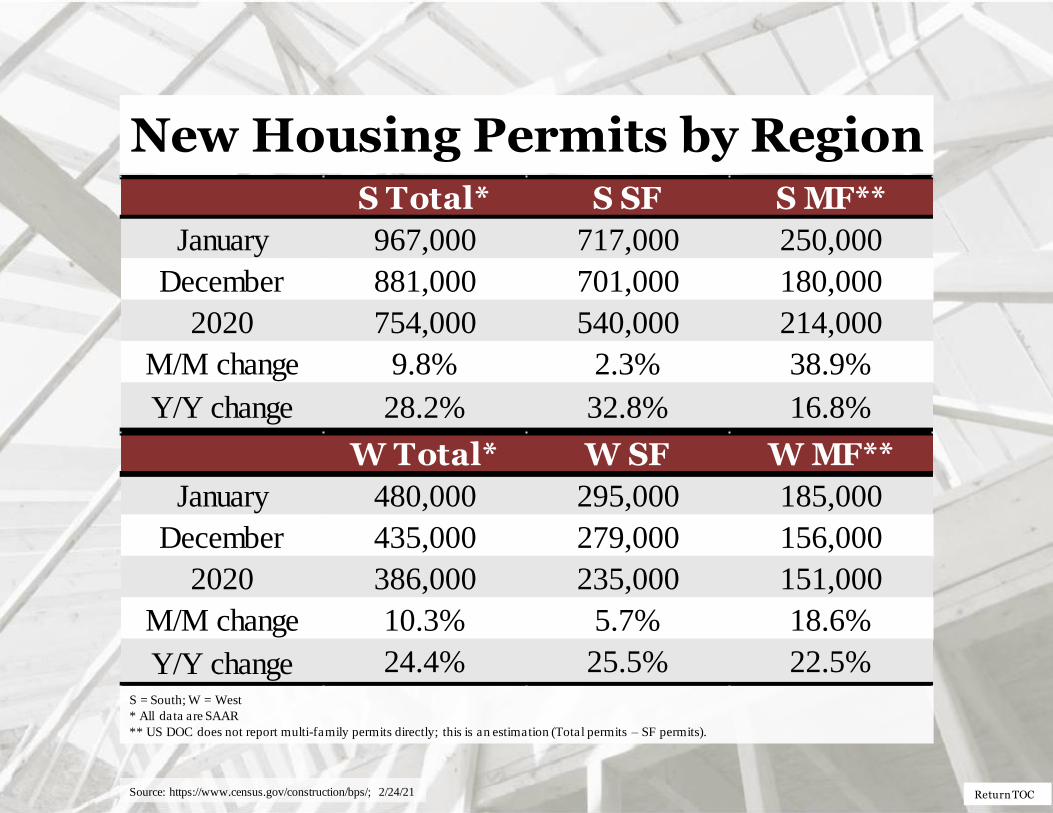
New Housing Permits by Region
S = South; W = West
* All data are SAAR
** US DOC does not report multi-family permits directly; this is an estimation (Total permits – SF permits).
S Total* S SF S MF**
January 967,000 717,000 250,000
December 881,000 701,000 180,000
2020 754,000 540,000 214,000
M/M change 9.8% 2.3% 38.9%
Y/Y change 28.2% 32.8% 16.8%
W Total* W SF W MF**
January 480,000 295,000 185,000
December 435,000 279,000 156,000
2020 386,000 235,000 151,000
M/M change 10.3% 5.7% 18.6%
Y/Y change 24.4% 25.5% 22.5%
Source: https://www.census.gov/construction/bps/; 2/24/21
Return TOC
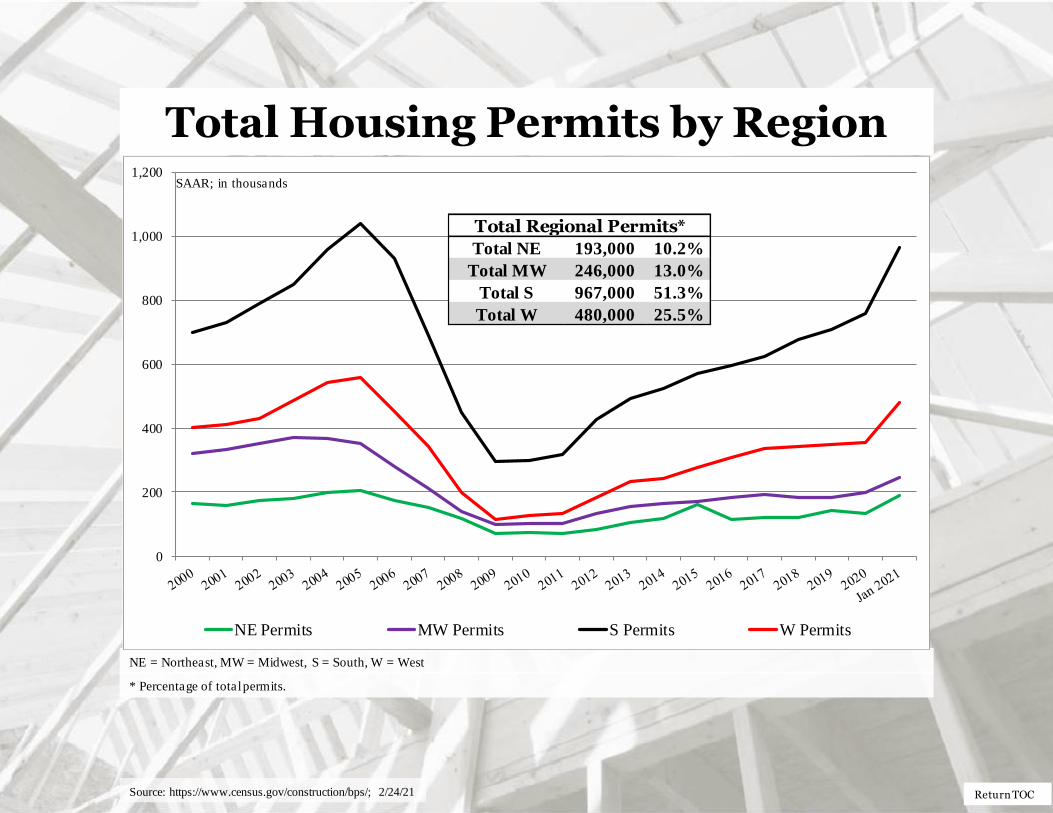
Total Housing Permits by Region
* Percentage of total permits.
NE = Northeast, MW = Midwest, S = South, W = West
0
200
400
600
800
1,000
1,200
NE Permits MW Permits S Permits W Permits
SAAR; in thousands
Total NE 193,000 10.2%
Total MW 246,000 13.0%
Total S 967,000 51.3%
Total W 480,000 25.5%
Total Regional Permits*
Source: https://www.census.gov/construction/bps/; 2/24/21
Return TOC
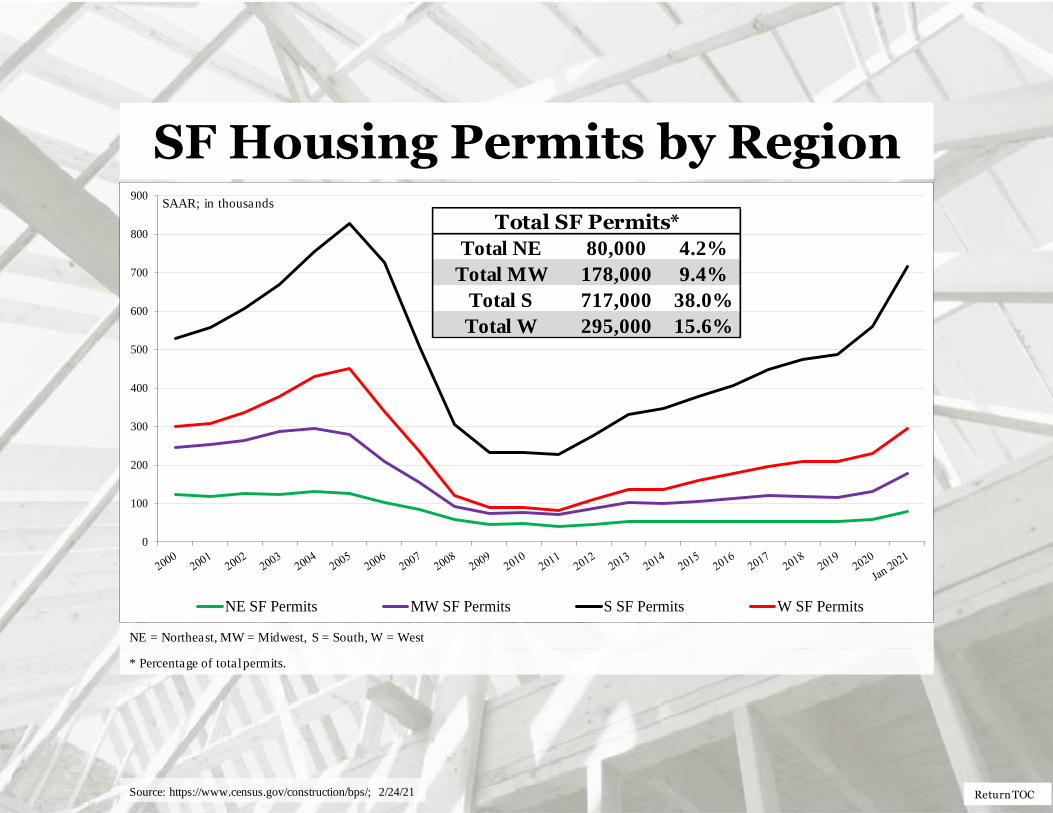
SF Housing Permits by Region
* Percentage of total permits.
NE = Northeast, MW = Midwest, S = South, W = West
0
100
200
300
400
500
600
700
800
900
NE SF Permits MW SF Permits S SF Permits W SF Permits
Total NE 80,000 4.2%
Total MW 178,000 9.4%
Total S 717,000 38.0%
Total W 295,000 15.6%
Total SF Permits*SAAR; in thousands
Source: https://www.census.gov/construction/bps/; 2/24/21

Return TOC
MF Housing Permits by Region
* Percentage of total permits.
NE = Northeast, MW = Midwest, S = South, W = West
0
50
100
150
200
250
300
NE MF Permits MW MF Permits S MF Permits W MF Permits
SAAR; in thousands
Total NE 113,000 6.0%
Total MW 68,000 3.6%
Total S 250,000 13.3%
Total W 185,000 9.8%
Total MF Permits*
Source: https://www.census.gov/construction/bps/; 2/24/21
Return TOC
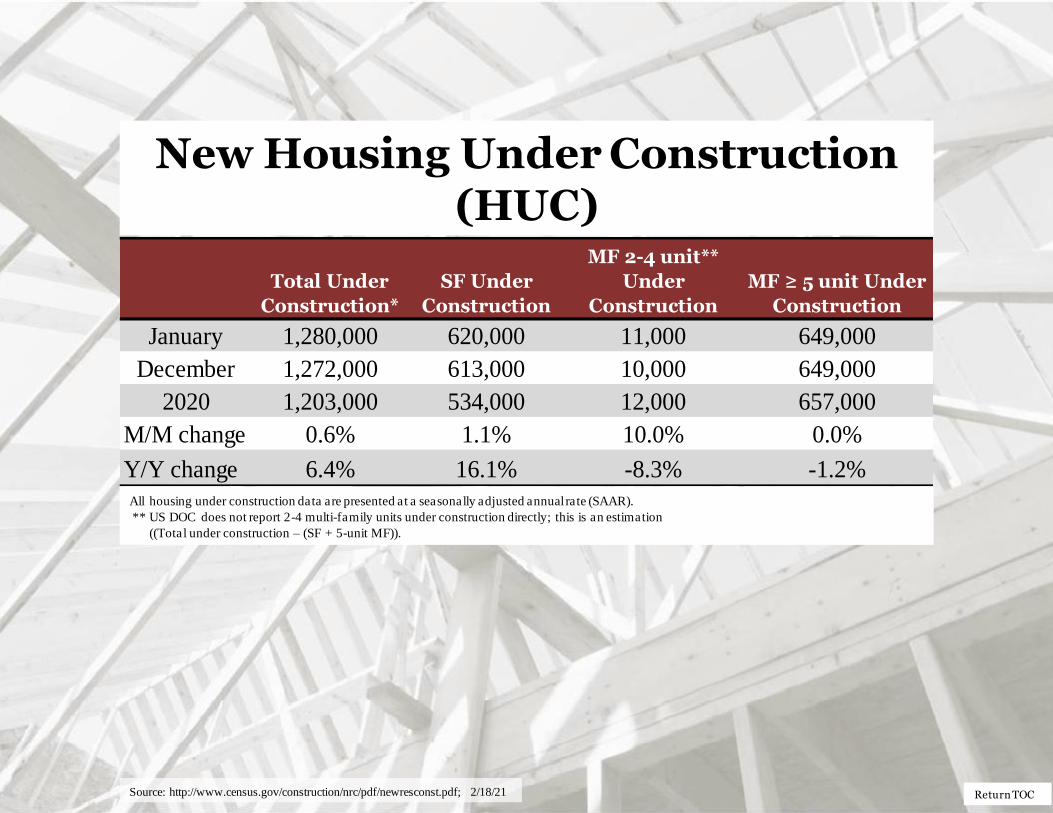
New Housing Under Construction (HUC)
All housing under construction data are presented at a seasonally adjusted annual rate (SAAR).
** US DOC does not report 2-4 multi-family units under construction directly; this is an estimation
((Total under construction – (SF + 5-unit MF)).
Source: http://www.census.gov/construction/nrc/pdf/newresconst.pdf; 2/18/21
Total Under
Construction*
SF Under
Construction
MF 2-4 unit**
Under
Construction
MF ≥ 5 unit Under
Construction
January 1,280,000 620,000 11,000 649,000
December 1,272,000 613,000 10,000 649,000
2020 1,203,000 534,000 12,000 657,000
M/M change 0.6% 1.1% 10.0% 0.0%
Y/Y change 6.4% 16.1% -8.3% -1.2%
Return TOC
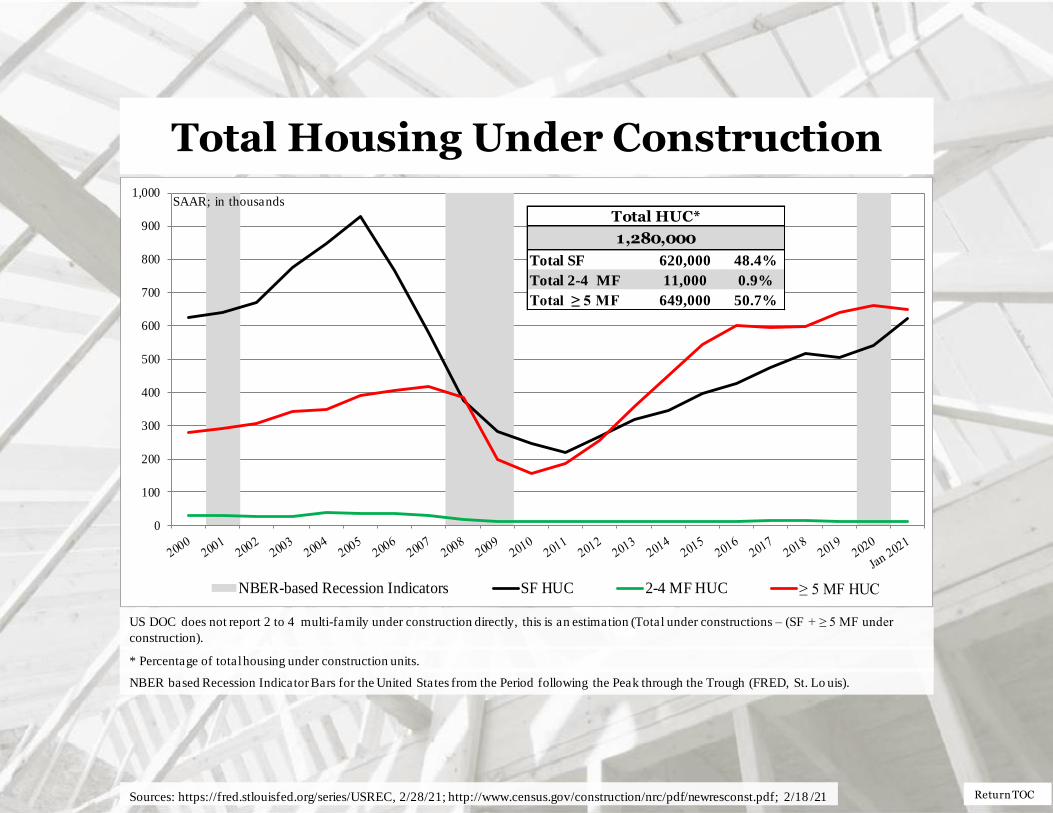
Total Housing Under Construction
Sources: https://fred.stlouisfed.org/series/USREC, 2/28/21; http://www.census.gov/construction/nrc/pdf/newresconst.pdf; 2/18 /21
* Percentage of total housing under construction units.
US DOC does not report 2 to 4 multi-family under construction directly, this is an estimation (Total under constructions – (SF + ≥ 5 MF under
construction).
NBER based Recession Indicator Bars for the United States from the Period following the Peak through the Trough (FRED, St. Lo uis).
0
100
200
300
400
500
600
700
800
900
1,000
NBER-based Recession Indicators SF HUC 2-4 MF HUC ≥ 5 MF HUC
SAAR; in thousands
Total SF 620,000 48.4%
Total 2-4 MF 11,000 0.9%
Total ≥ 5 MF 649,000 50.7%
Total HUC*
1,280,000
Return TOC
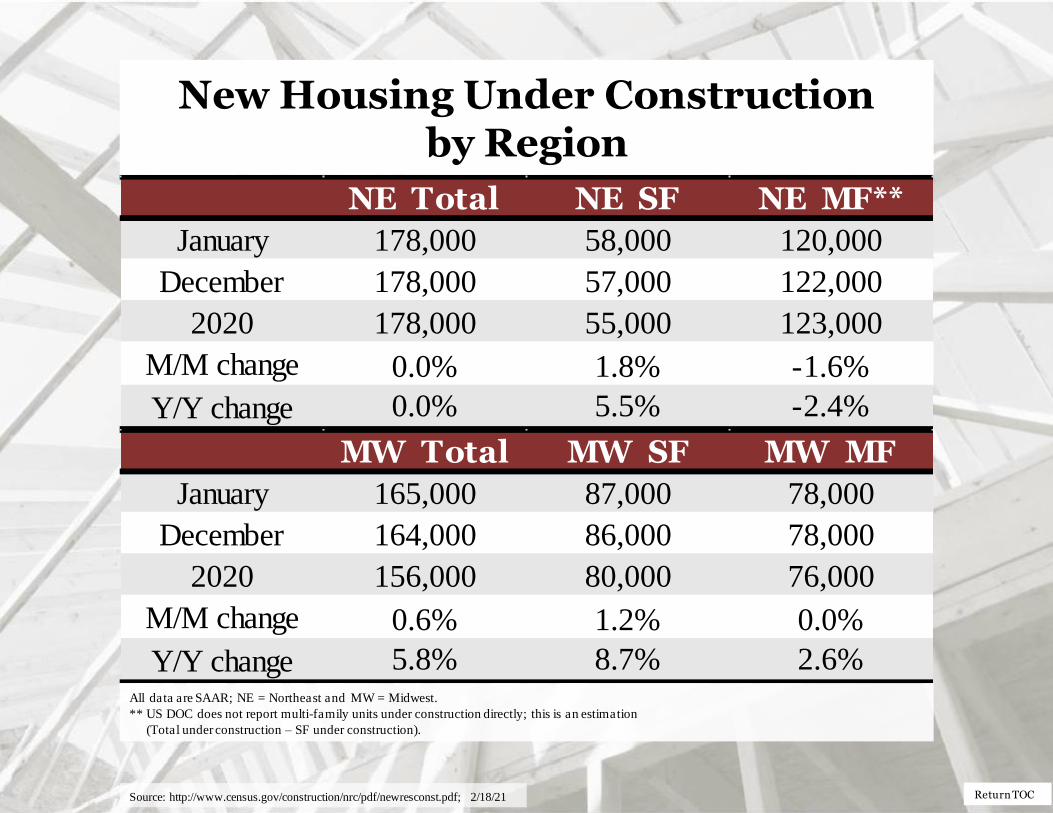
New Housing Under Construction by Region
All data are SAAR; NE = Northeast and MW = Midwest.
** US DOC does not report multi-family units under construction directly; this is an estimation
(Total under construction – SF under construction).
Source: http://www.census.gov/construction/nrc/pdf/newresconst.pdf; 2/18/21
NE Total NE SF NE MF**
January 178,000 58,000 120,000
December 178,000 57,000 122,000
2020 178,000 55,000 123,000
M/M change 0.0% 1.8% -1.6%
Y/Y change 0.0% 5.5% -2.4%
MW Total MW SF MW MF
January 165,000 87,000 78,000
December 164,000 86,000 78,000
2020 156,000 80,000 76,000
M/M change 0.6% 1.2% 0.0%
Y/Y change 5.8% 8.7% 2.6%
Return TOC
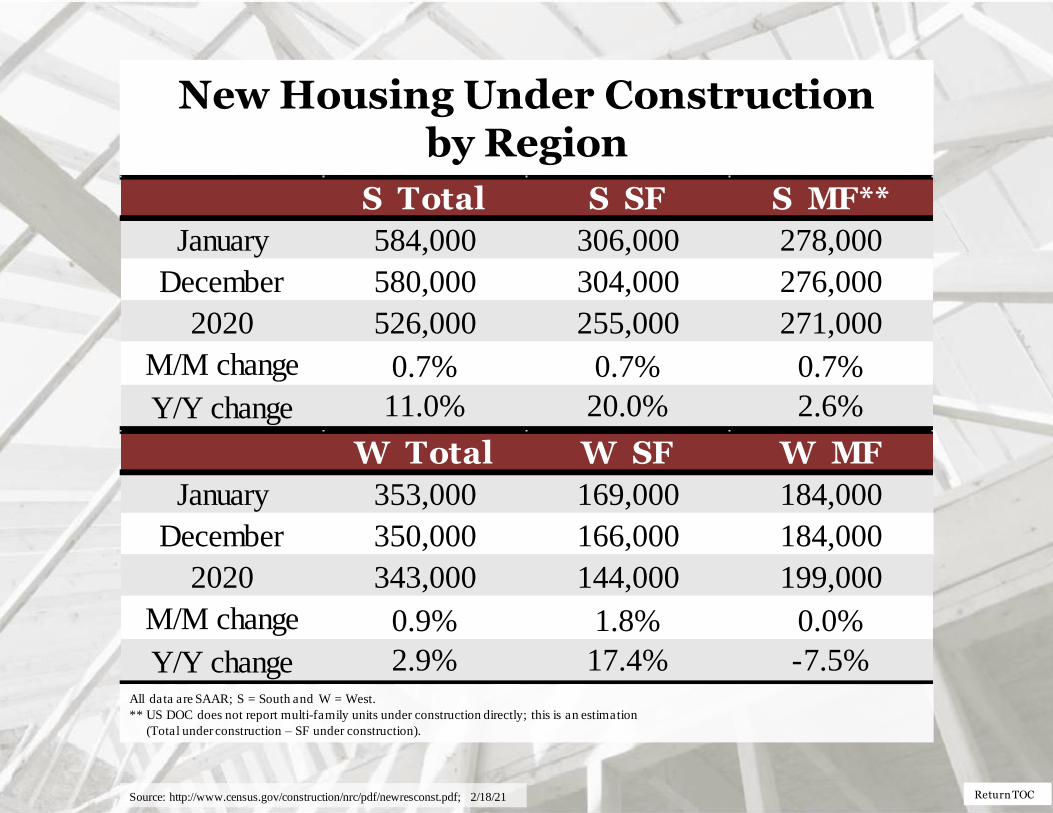
New Housing Under Construction by Region
All data are SAAR; S = South and W = West.
** US DOC does not report multi-family units under construction directly; this is an estimation
(Total under construction – SF under construction).
Source: http://www.census.gov/construction/nrc/pdf/newresconst.pdf; 2/18/21
S Total S SF S MF**
January 584,000 306,000 278,000
December 580,000 304,000 276,000
2020 526,000 255,000 271,000
M/M change 0.7% 0.7% 0.7%
Y/Y change 11.0% 20.0% 2.6%
W Total W SF W MF
January 353,000 169,000 184,000
December 350,000 166,000 184,000
2020 343,000 144,000 199,000
M/M change 0.9% 1.8% 0.0%
Y/Y change 2.9% 17.4% -7.5%
Return TOC
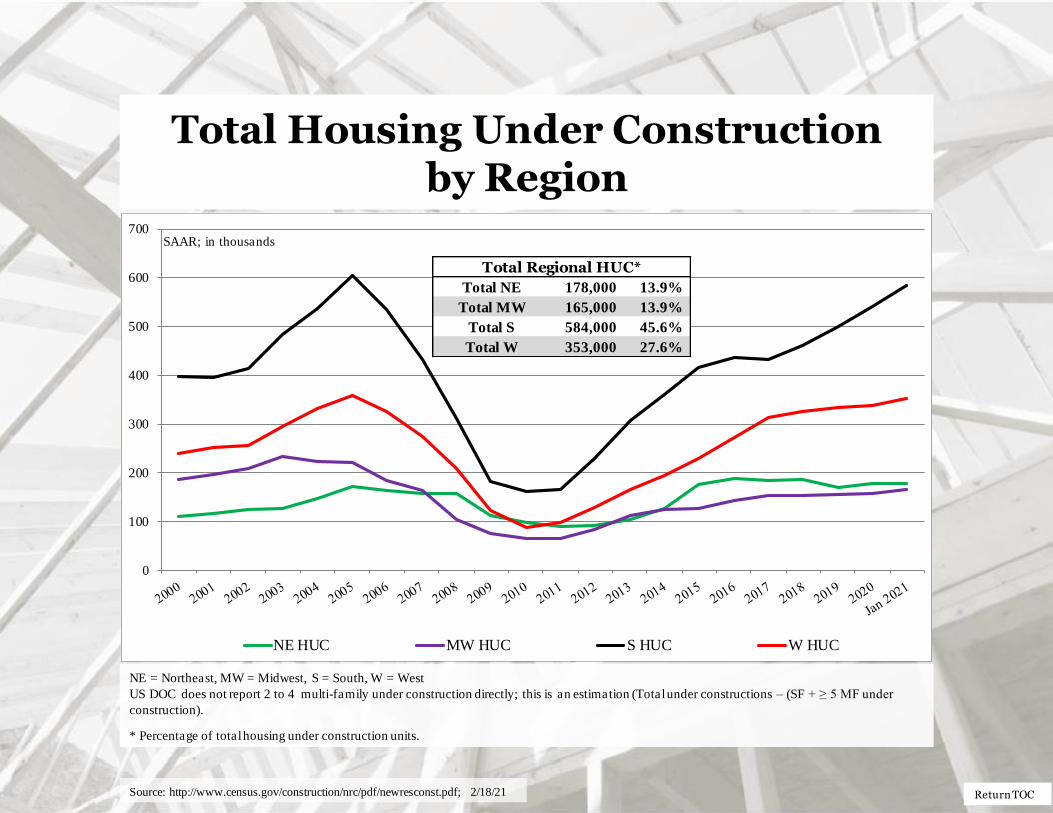
Total Housing Under Construction by Region
* Percentage of total housing under construction units.
NE = Northeast, MW = Midwest, S = South, W = West
US DOC does not report 2 to 4 multi-family under construction directly; this is an estimation (Total under constructions – (SF + ≥ 5 MF under
construction).
Source: http://www.census.gov/construction/nrc/pdf/newresconst.pdf; 2/18/21
0
100
200
300
400
500
600
700
NE HUC MW HUC S HUC W HUC
SAAR; in thousands
Total NE 178,000 13.9%
Total MW 165,000 13.9%
Total S 584,000 45.6%
Total W 353,000 27.6%
Total Regional HUC*

Return TOC
SF Housing Under Construction by Region
* Percentage of total housing under construction units.
NE = Northeast, MW = Midwest, S = South, W = West.
US DOC does not report 2 to 4 multi-family under construction directly, this is an estimation (Total under constructions – (SF + ≥ 5 MF under
construction).
Source: http://www.census.gov/construction/nrc/pdf/newresconst.pdf; 2/18/21
0
50
100
150
200
250
300
350
400
450
NE SF HUC MW SF HUC S SF HUC W SF HUC
SAAR; in thousands
Total NE 58,000 4.5%
Total MW 87,000 6.8%
Total S 306,000 23.9%
Total W 169,000 13.2%
Total SF HUC*
Return TOC
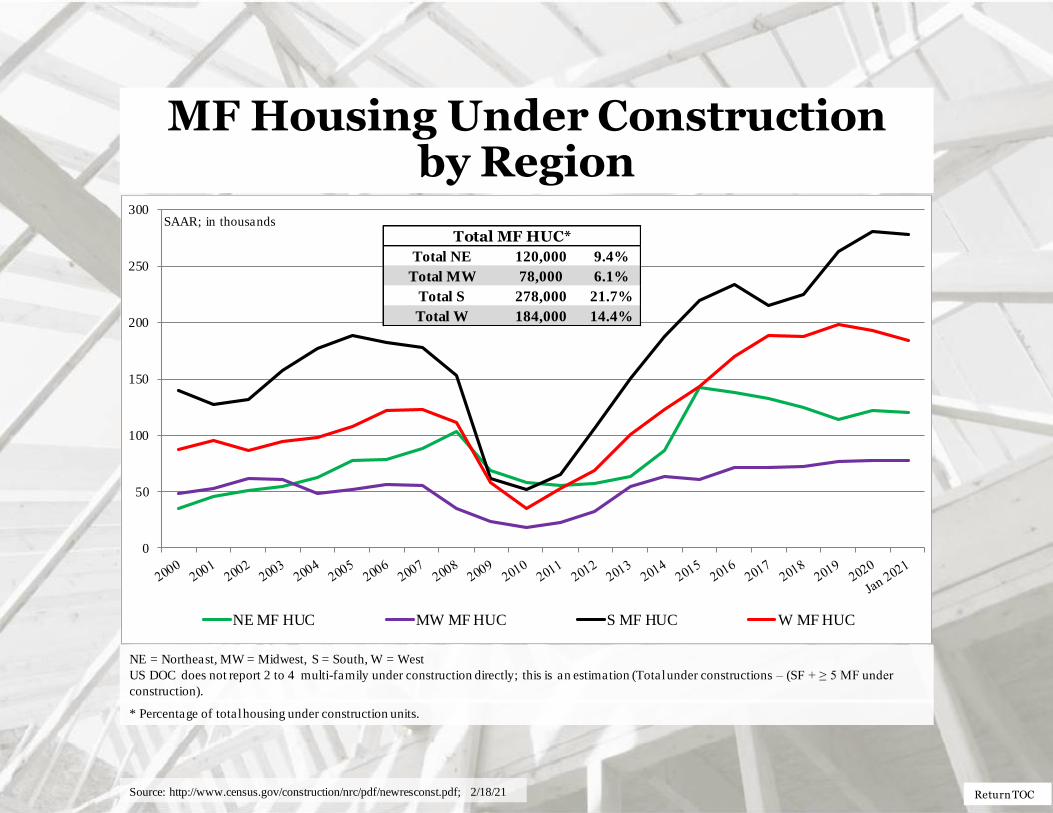
MF Housing Under Construction by Region
* Percentage of total housing under construction units.
NE = Northeast, MW = Midwest, S = South, W = West
US DOC does not report 2 to 4 multi-family under construction directly; this is an estimation (Total under constructions – (SF + ≥ 5 MF under
construction).
Source: http://www.census.gov/construction/nrc/pdf/newresconst.pdf; 2/18/21
0
50
100
150
200
250
300
NE MF HUC MW MF HUC S MF HUC W MF HUC
SAAR; in thousands
Total NE 120,000 9.4%
Total MW 78,000 6.1%
Total S 278,000 21.7%
Total W 184,000 14.4%
Total MF HUC*
Return TOC
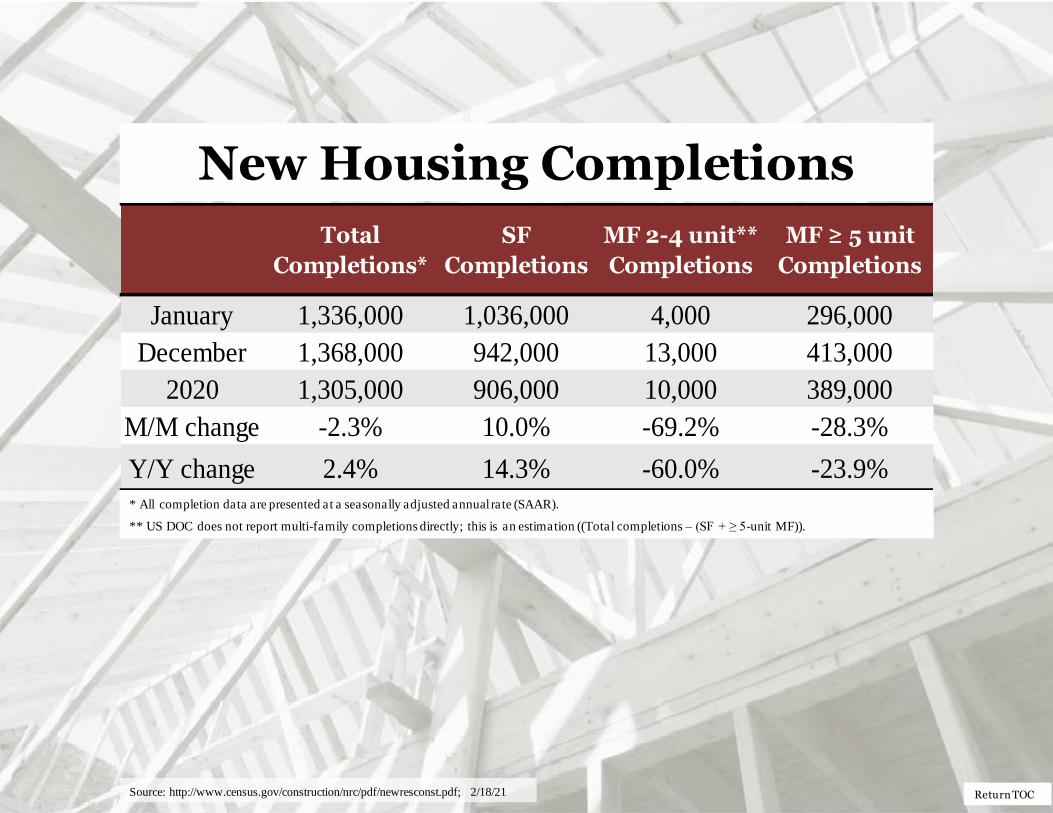
New Housing Completions
* All completion data are presented at a seasonally adjusted annual rate (SAAR).
** US DOC does not report multi-family completions directly; this is an estimation ((Total completions – (SF + ≥ 5-unit MF)).
Source: http://www.census.gov/construction/nrc/pdf/newresconst.pdf; 2/18/21
Total
Completions*
SF
Completions
MF 2-4 unit**
Completions
MF ≥ 5 unit
Completions
January 1,336,000 1,036,000 4,000 296,000
December 1,368,000 942,000 13,000 413,000
2020 1,305,000 906,000 10,000 389,000
M/M change -2.3% 10.0% -69.2% -28.3%
Y/Y change 2.4% 14.3% -60.0% -23.9%

Return TOC
Total Housing Completions
* Percentage of total housing completions
** US DOC does not report multifamily completions directly, this is an estimation ((Total completions – (SF + ≥ 5-unit MF)).
NBER based Recession Indicator Bars for the United States from the Period following the Peak through the Trough (FRED, St. Lo uis).
Sources: https://fred.stlouisfed.org/series/USREC, 2/18/20; http://www.census.gov/construction/nrc/pdf/newresconst.pdf; 2/18 /21
0
200
400
600
800
1,000
1,200
1,400
1,600
1,800
NBER-based Recession Indicators Total SF Completions Total 2-4 MF Completions Total ≥ 5 MF Completions
SAAR; in thousands
Total SF 1,036,000 77.5%
Total 2-4 MF 4,000 0.3%
Total ≥ 5 MF 296,000 22.2%
Total Completions*
1,336,000

Return TOC
New Housing Completions by Region
Source: http://www.census.gov/construction/nrc/pdf/newresconst.pdf; 2/18/21
NE = Northeast, MW = Midwest, S = South, W = West
US DOC does not report 2 to 4 multi-family completions directly; this is an estimation (Total completions – SF completions).
* Percentage of total housing completions
NE Total NE SF NE MF**
January 101,000 65,000 36,000
December 118,000 58,000 60,000
2020 104,000 78,000 26,000
M/M change -14.4% 12.1% -40.0%
Y/Y change -2.9% -16.7% 38.5%
MW Total MW SF MW MF
January 175,000 150,000 25,000
December 190,000 138,000 52,000
2020 184,000 126,000 58,000
M/M change -7.9% 8.7% -51.9%
Y/Y change -4.9% 19.0% -56.9%
Return TOC
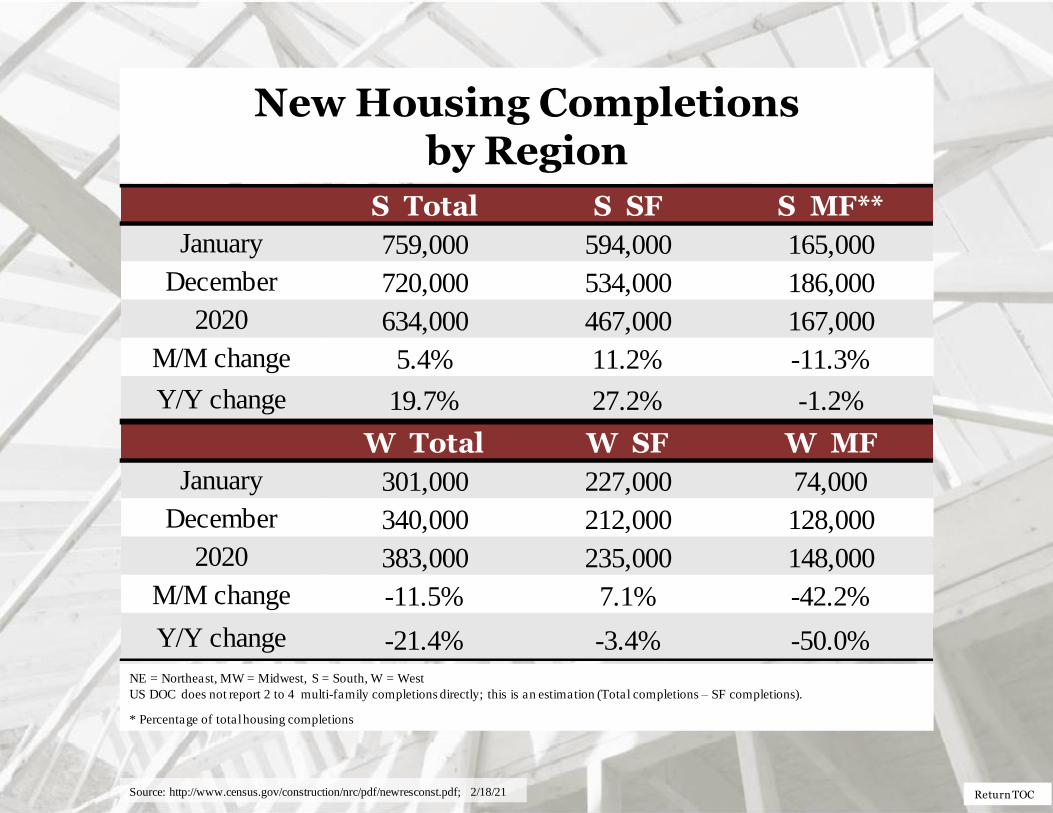
New Housing Completions by Region
Source: http://www.census.gov/construction/nrc/pdf/newresconst.pdf; 2/18/21
NE = Northeast, MW = Midwest, S = South, W = West
US DOC does not report 2 to 4 multi-family completions directly; this is an estimation (Total completions – SF completions).
* Percentage of total housing completions
S Total S SF S MF**
January 759,000 594,000 165,000
December 720,000 534,000 186,000
2020 634,000 467,000 167,000
M/M change 5.4% 11.2% -11.3%
Y/Y change 19.7% 27.2% -1.2%
W Total W SF W MF
January 301,000 227,000 74,000
December 340,000 212,000 128,000
2020 383,000 235,000 148,000
M/M change -11.5% 7.1% -42.2%
Y/Y change -21.4% -3.4% -50.0%
Return TOC
All data are SAAR; NE = Northeast and MW = Midwest.
** US DOC does not report multi-family units completions directly; this is an estimation
(Total completions – SF completions).
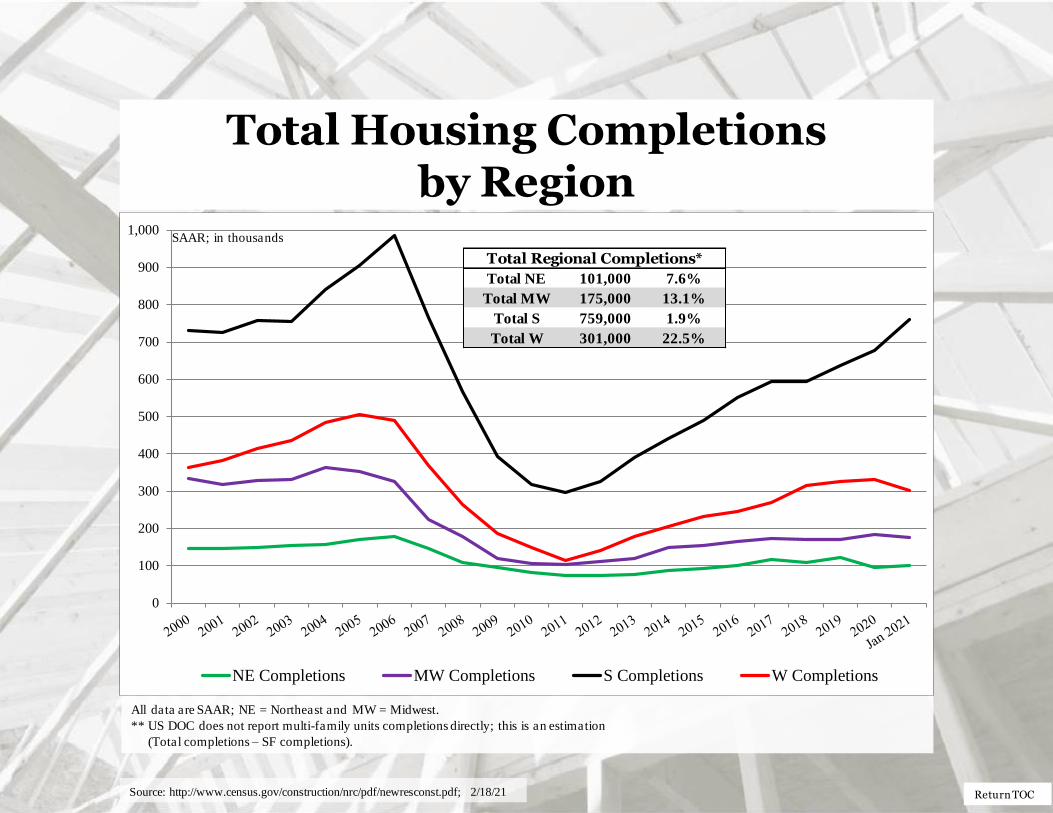
Total Housing Completions by Region
Source: http://www.census.gov/construction/nrc/pdf/newresconst.pdf; 2/18/21
0
100
200
300
400
500
600
700
800
900
1,000
NE Completions MW Completions S Completions W Completions
SAAR; in thousands
Total NE 101,000 7.6%
Total MW 175,000 13.1%
Total S 759,000 1.9%
Total W 301,000 22.5%
Total Regional Completions*

Return TOC
SF Housing Completions by Region
NE = Northeast, MW = Midwest, S = South, W = West
US DOC does not report 2 to 4 multi-family completions directly; this is an estimation (Total completions – SF completions).
* Percentage of total housing completions
Source: http://www.census.gov/construction/nrc/pdf/newresconst.pdf; 2/18/21
0
100
200
300
400
500
600
700
800
900
NE SF Completions MW SF Completions S SF Completions W SF Completions
SAAR; in thousands
Total NE 65,000 4.9%
Total MW 150,000 11.2%
Total S 594,000 56.8%
Total W 227,000 17.0%
Total SF Completions*
Return TOC
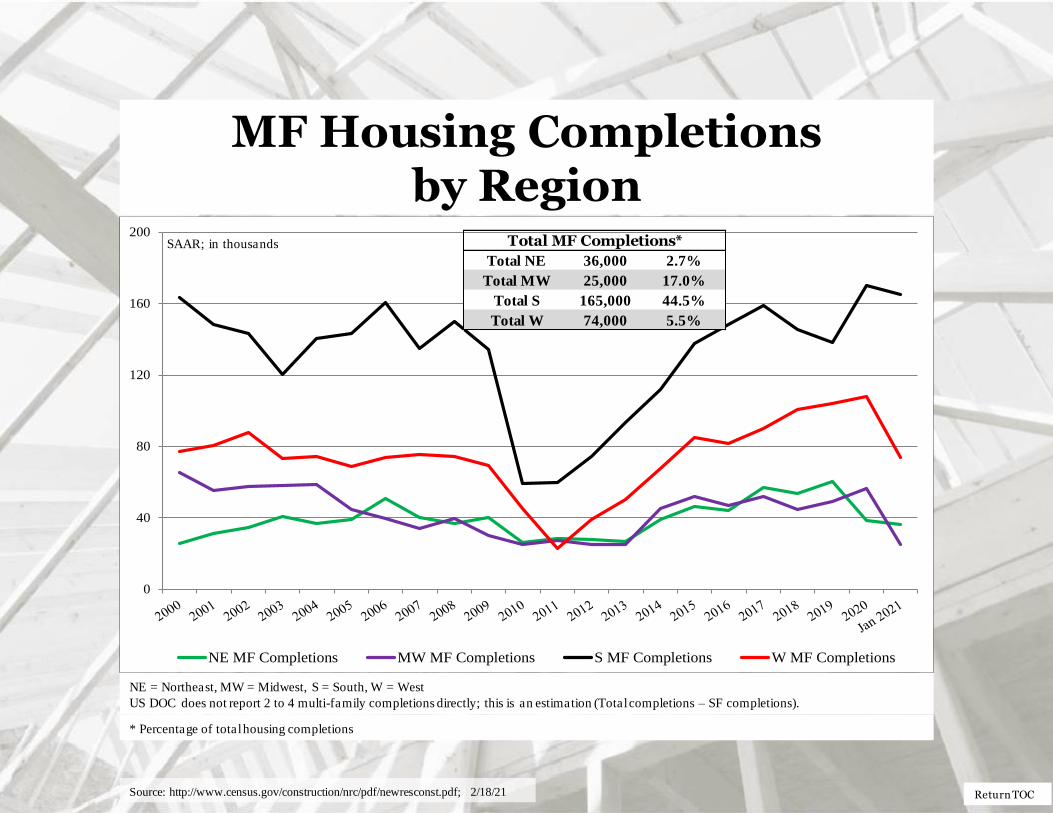
MF Housing Completions by Region
NE = Northeast, MW = Midwest, S = South, W = West
US DOC does not report 2 to 4 multi-family completions directly; this is an estimation (Total completions – SF completions).
* Percentage of total housing completions
Source: http://www.census.gov/construction/nrc/pdf/newresconst.pdf; 2/18/21
0
40
80
120
160
200
NE MF Completions MW MF Completions S MF Completions W MF Completions
Total NE 36,000 2.7%
Total MW 25,000 17.0%
Total S 165,000 44.5%
Total W 74,000 5.5%
Total MF Completions*SAAR; in thousands
Return TOC
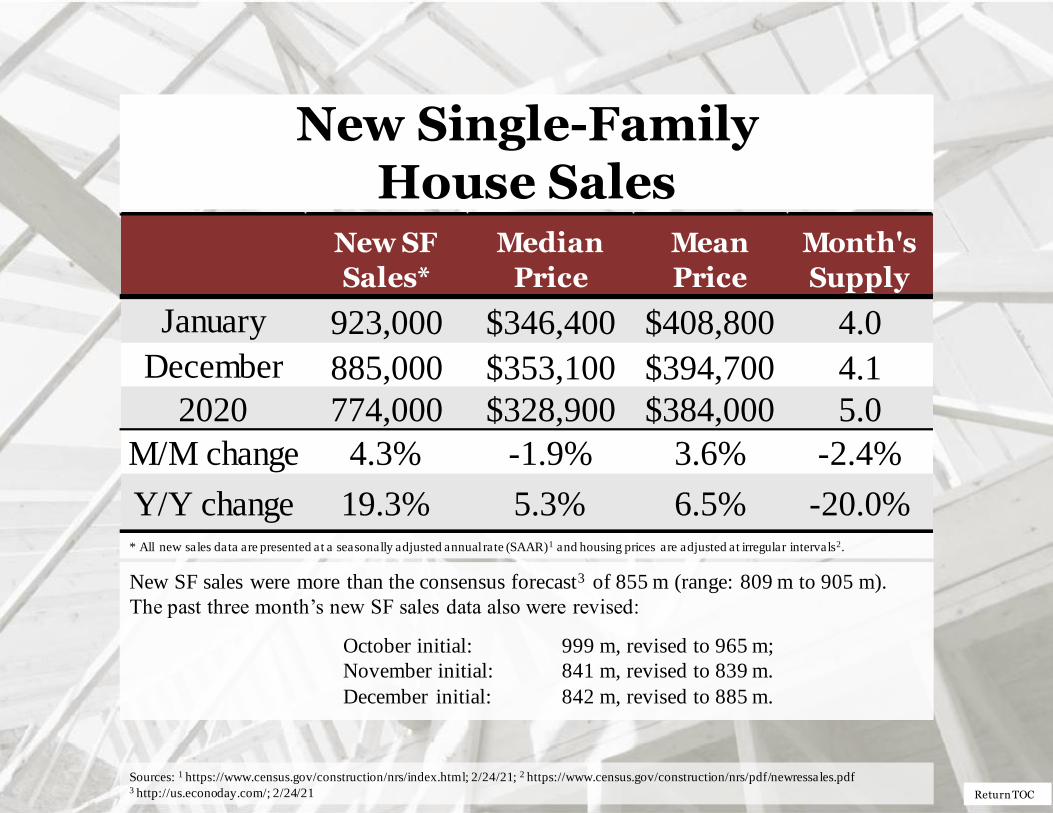
New Single-Family House Sales
* All new sales data are presented at a seasonally adjusted annual rate (SAAR)1 and housing prices are adjusted at irregular intervals2.
Sources: 1 https://www.census.gov/construction/nrs/index.html; 2/24/21; 2 https://www.census.gov/construction/nrs/pdf/newressales.pdf 3 http://us.econoday.com/; 2/24/21
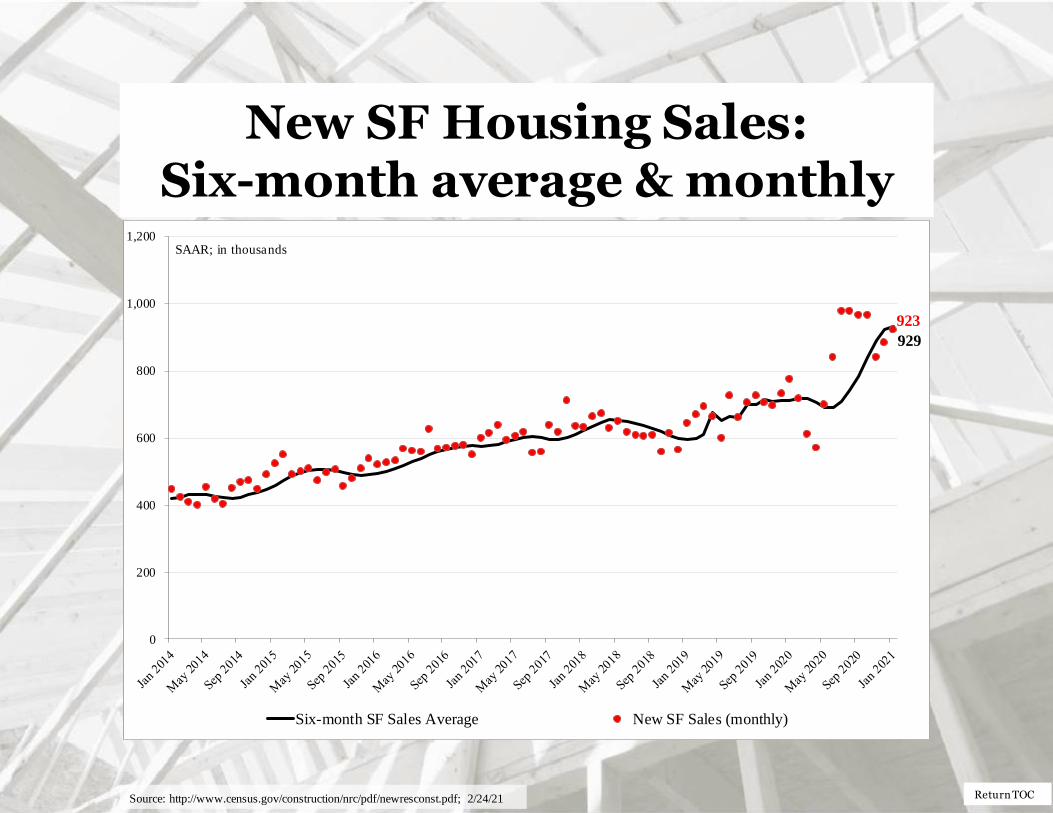
New SF sales were more than the consensus forecast3 of 855 m (range: 809 m to 905 m).
The past three month’s new SF sales data also were revised:
October initial: 999 m, revised to 965 m;
November initial: 841 m, revised to 839 m.
December initial: 842 m, revised to 885 m.
New SF
Sales*
Median
Price
Mean
Price
Month's
Supply
January 923,000 $346,400 $408,800 4.0
December 885,000 $353,100 $394,700 4.1
2020 774,000 $328,900 $384,000 5.0
M/M change 4.3% -1.9% 3.6% -2.4%
Y/Y change 19.3% 5.3% 6.5% -20.0%
Return TOC
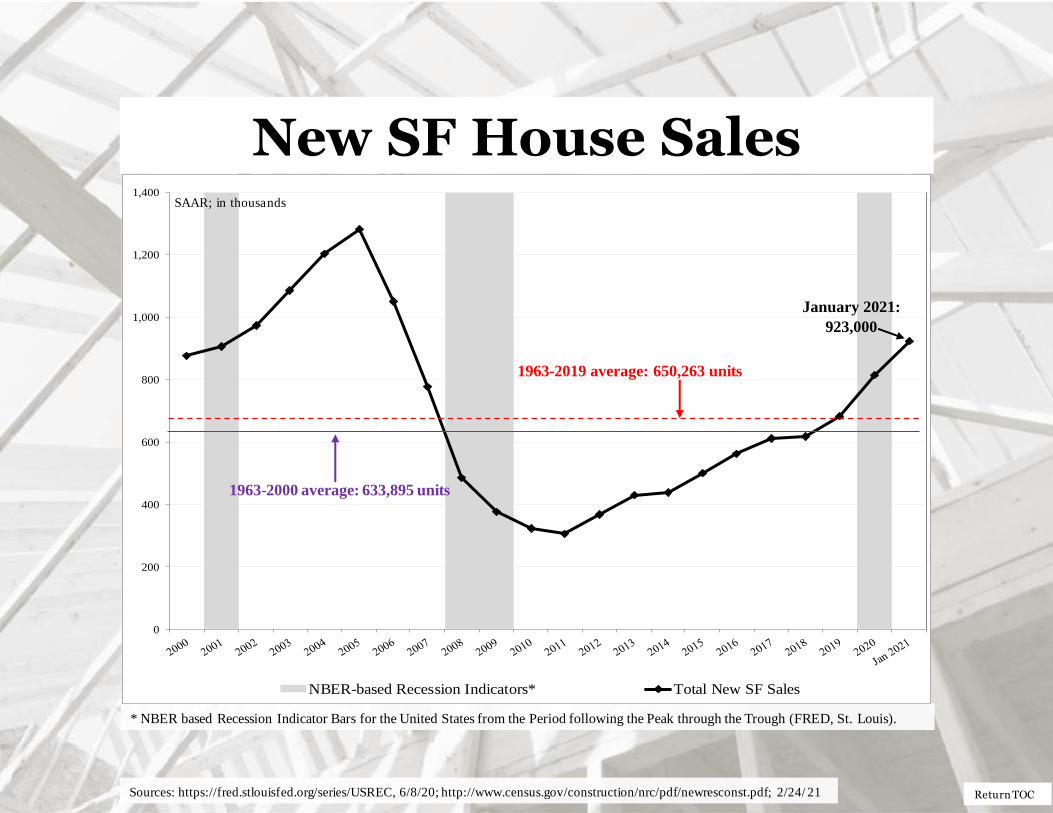
New SF House Sales
Sources: https://fred.stlouisfed.org/series/USREC, 6/8/20; http://www.census.gov/construction/nrc/pdf/newresconst.pdf; 2/24/ 21
* NBER based Recession Indicator Bars for the United States from the Period following the Peak through the Trough (FRED, St. Louis).
0
200
400
600
800
1,000
1,200
1,400
NBER-based Recession Indicators* Total New SF Sales
January 2021:
923,000
1963-2000 average: 633,895 units
1963-2019 average: 650,263 units
SAAR; in thousands
Return TOC
New SF Housing Sales: Six-month average & monthly
Source: http://www.census.gov/construction/nrc/pdf/newresconst.pdf; 2/24/21
923
929
0
200
400
600
800
1,000
1,200
Six-month SF Sales Average New SF Sales (monthly)
SAAR; in thousands
Return TOC
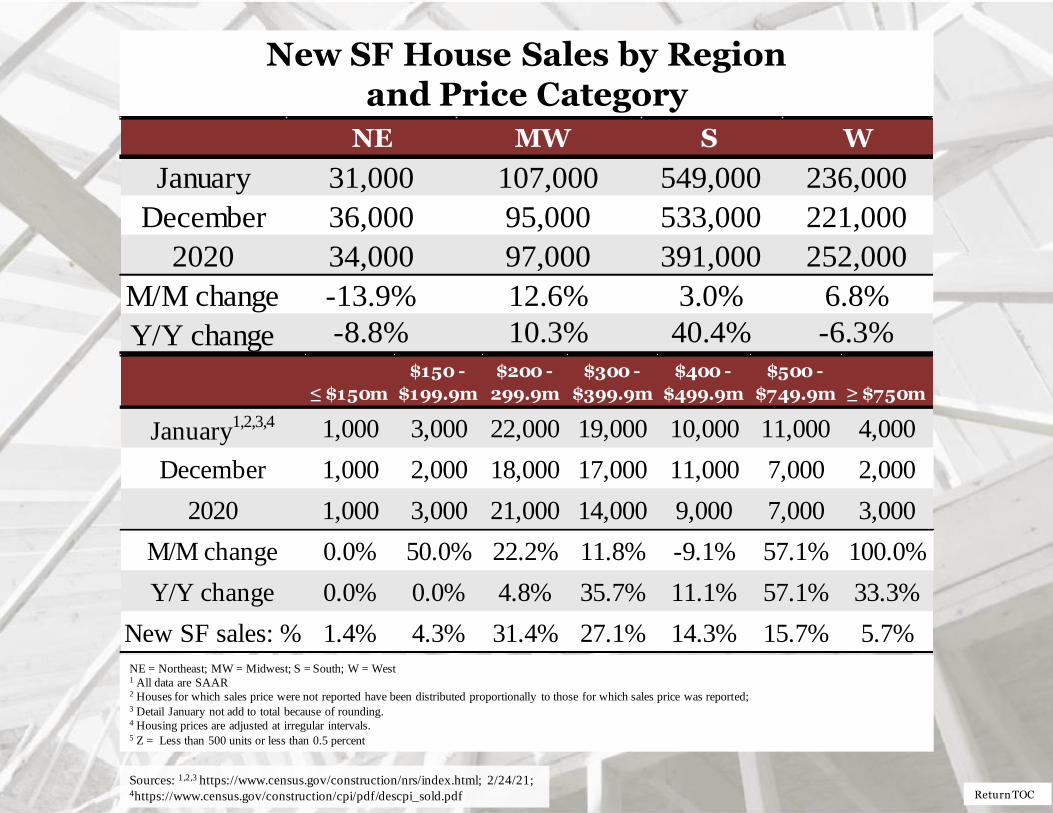
New SF House Sales by Region and Price Category
NE = Northeast; MW = Midwest; S = South; W = West 1 All data are SAAR 2 Houses for which sales price were not reported have been distributed proportionally to those for which sales price was reported; 3 Detail January not add to total because of rounding. 4 Housing prices are adjusted at irregular intervals. 5 Z = Less than 500 units or less than 0.5 percent
Sources: 1,2,3 https://www.census.gov/construction/nrs/index.html; 2/24/21; 4https://www.census.gov/construction/cpi/pdf/descpi_sold.pdf
NE MW S W
January 31,000 107,000 549,000 236,000
December 36,000 95,000 533,000 221,000
2020 34,000 97,000 391,000 252,000
M/M change -13.9% 12.6% 3.0% 6.8%
Y/Y change -8.8% 10.3% 40.4% -6.3%
≤ $150m
$150 -
$199.9m
$200 -
299.9m
$300 -
$399.9m
$400 -
$499.9m
$500 -
$749.9m ≥ $750m
January1,2,3,4 1,000 3,000 22,000 19,000 10,000 11,000 4,000
December 1,000 2,000 18,000 17,000 11,000 7,000 2,000
2020 1,000 3,000 21,000 14,000 9,000 7,000 3,000
M/M change 0.0% 50.0% 22.2% 11.8% -9.1% 57.1% 100.0%
Y/Y change 0.0% 0.0% 4.8% 35.7% 11.1% 57.1% 33.3%
New SF sales: % 1.4% 4.3% 31.4% 27.1% 14.3% 15.7% 5.7%
Return TOC
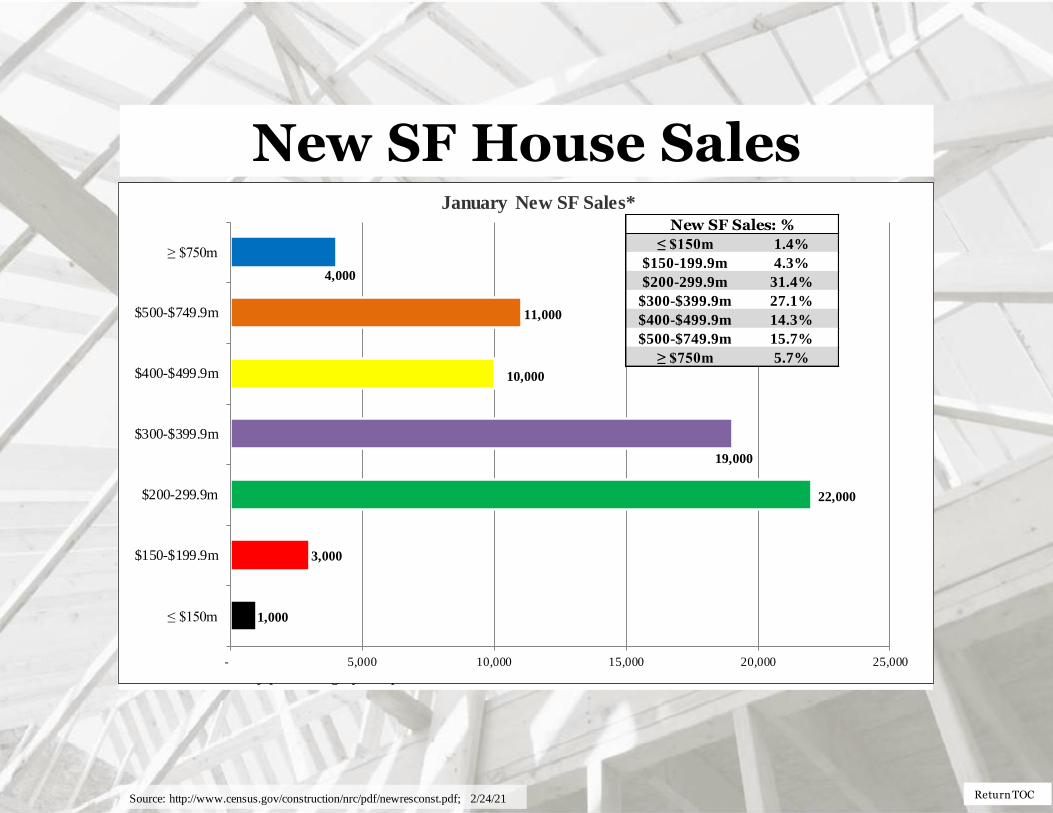
New SF House Sales
• Total new sales by price category and percent.
Source: http://www.census.gov/construction/nrc/pdf/newresconst.pdf; 2/24/21
1,000
3,000
22,000
19,000
10,000
11,000
4,000
- 5,000 10,000 15,000 20,000 25,000
≤ $150m
$150-$199.9m
$200-299.9m
$300-$399.9m
$400-$499.9m
$500-$749.9m
≥ $750m
January New SF Sales*
≤ $150m 1.4%
$150-199.9m 4.3%
$200-299.9m 31.4%
$300-$399.9m 27.1%
$400-$499.9m 14.3%
$500-$749.9m 15.7%
≥ $750m 5.7%
New SF Sales: %
Return TOC
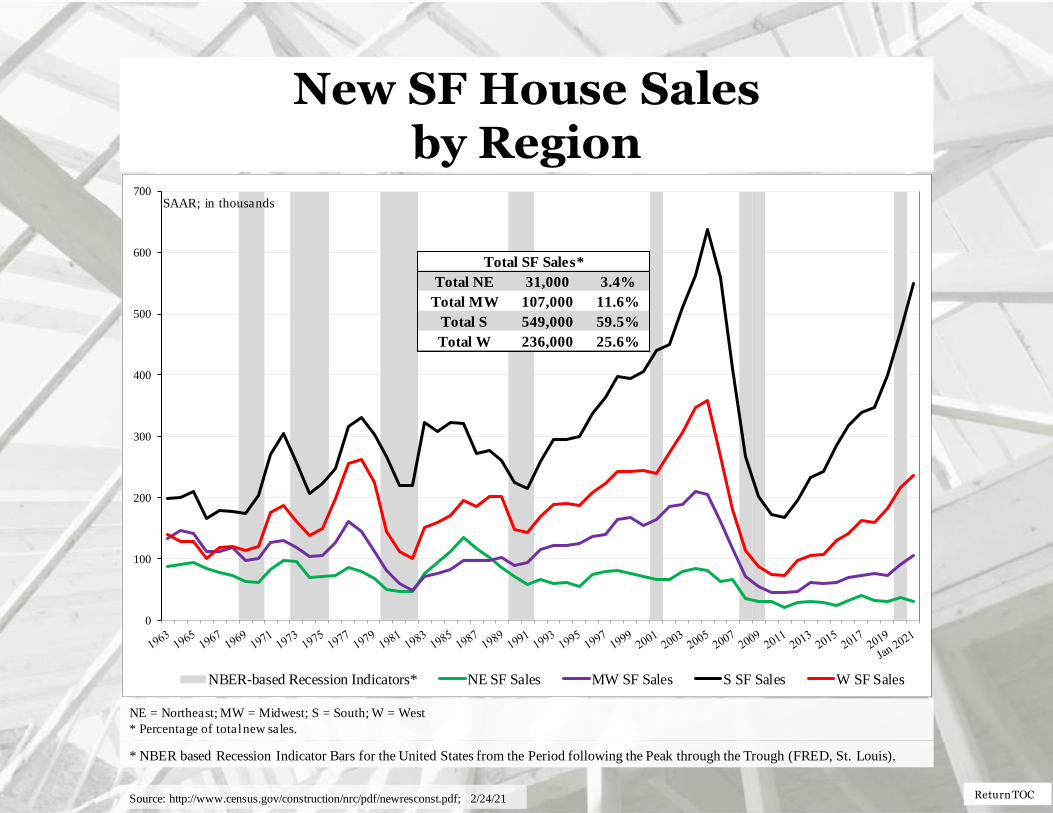
New SF House Sales by Region
NE = Northeast; MW = Midwest; S = South; W = West
* Percentage of total new sales.
* NBER based Recession Indicator Bars for the United States from the Period following the Peak through the Trough (FRED, St. Louis).
Source: http://www.census.gov/construction/nrc/pdf/newresconst.pdf; 2/24/21
0
100
200
300
400
500
600
700
NBER-based Recession Indicators* NE SF Sales MW SF Sales S SF Sales W SF Sales
SAAR; in thousands
Total NE 31,000 3.4%
Total MW 107,000 11.6%
Total S 549,000 59.5%
Total W 236,000 25.6%
Total SF Sales*

Return TOC
New SF House Sales by Price Category
* Sales tallied by price category.
0
50
100
150
200
250
300
350
400
1999 2000 2001 2002 2003 2004 2005 2006 2007 2008 2009 2010 2011 2012 2013 2014 2015 2016 2017 2018 2019
< $150
$150-199.9
$200-299.9
$300-$399.9
$400-$499.9
$500-$749.9
> $750
2019 Total New SF Sales*: 681 m units
2002-2019; in thousands, and thousands of dollars; SAAR
Source: http://www.census.gov/construction/nrc/pdf/newresconst.pdf; 6/23/20
Return TOC
New SF House Sales
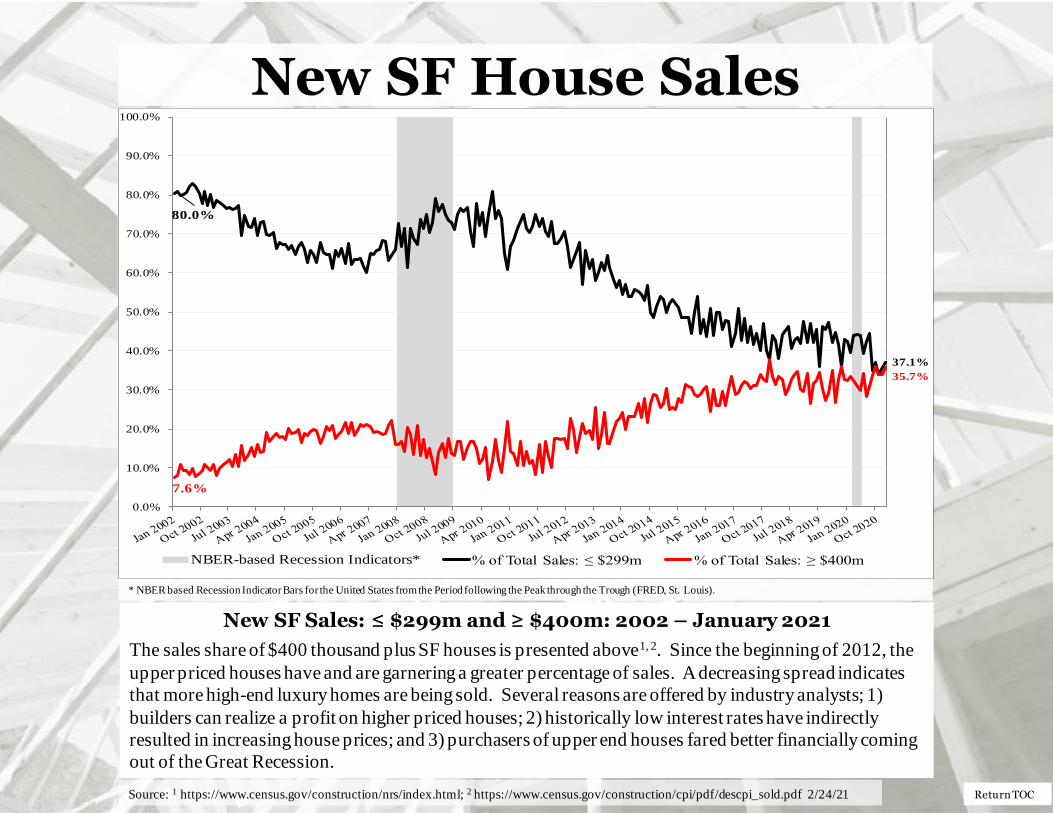
New SF Sales: ≤ $299m and ≥ $400m: 2002 – January 2021
The sales share of $400 thousand plus SF houses is presented above1, 2. Since the beginning of 2012, the
upper priced houses have and are garnering a greater percentage of sales. A decreasing spread indicates
that more high-end luxury homes are being sold. Several reasons are offered by industry analysts; 1)
builders can realize a profit on higher priced houses; 2) historically low interest rates have indirectly
resulted in increasing house prices; and 3) purchasers of upper end houses fared better financially coming
out of the Great Recession.
Source: 1 https://www.census.gov/construction/nrs/index.html; 2 https://www.census.gov/construction/cpi/pdf/descpi_sold.pdf 2/24/21
* NBER based Recession Indicator Bars for the United States from the Period following the Peak through the Trough (FRED, St. Louis).
80.0%
37.1%
7.6%
35.7%
0.0%
10.0%
20.0%
30.0%
40.0%
50.0%
60.0%
70.0%
80.0%
90.0%
100.0%
NBER-based Recession Indicators* % of Total Sales: ≤ $299m % of Total Sales: ≥ $400m
Return TOC
New SF House Sales
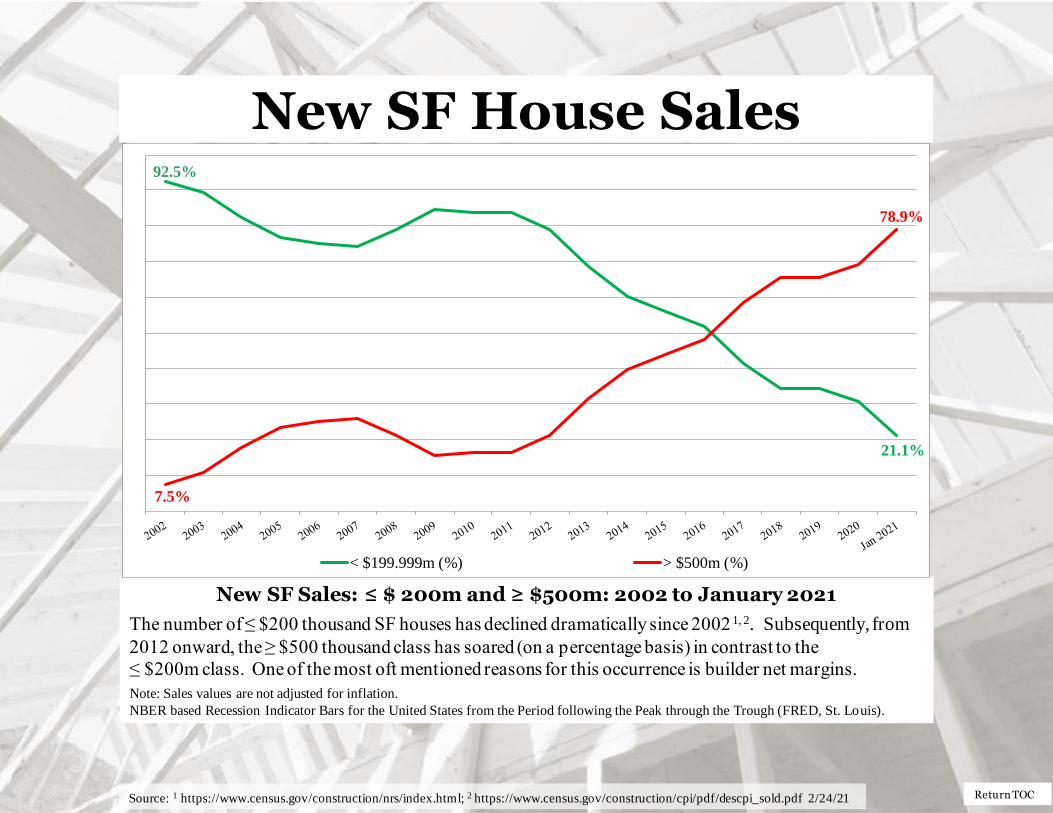
New SF Sales: ≤ $ 200m and ≥ $500m: 2002 to January 2021
The number of ≤ $200 thousand SF houses has declined dramatically since 2002 1, 2. Subsequently, from
2012 onward, the ≥ $500 thousand class has soared (on a percentage basis) in contrast to the
≤ $200m class. One of the most oft mentioned reasons for this occurrence is builder net margins.
Note: Sales values are not adjusted for inflation.
NBER based Recession Indicator Bars for the United States from the Period following the Peak through the Trough (FRED, St. Louis).
Source: 1 https://www.census.gov/construction/nrs/index.html; 2 https://www.census.gov/construction/cpi/pdf/descpi_sold.pdf 2/24/21
7.5%
78.9%
92.5%
21.1%
< $199.999m (%) > $500m (%)

Return TOC
New SF House Sales
New SF sales adjusted for the US population
From January 1963 to January 2007, the long-term ratio of new house sales to the total US non-
institutionalized population was 0.0039; in January 2021 it was 0.0035 – an increase from December. The
non-institutionalized population, aged 20 to 54 long-term ratio is 0.0062; in January 2021 it was 0.00636 – a
slight increase from December (0.0060). All are non-adjusted data. New house sales for the 20 to 54 class
exceeded population growth for the second time in more than a decade. From a total population world view,
new sales remain less than the long-term average.
Source: http://www.census.gov/construction/nrc/pdf/newresconst.pdf; 2/24/21
0.0000
0.0010
0.0020
0.0030
0.0040
0.0050
0.0060
0.0070
0.0080
0.0090
0.0100
Ratio of New SF Sales/Civilian Noninstitutional Population
Ratio of New SF Sales/Civilian Noninstitutional Population (20-54)
20 to 54-year-old population/New SF sales: 1/1/63 to 12/31/07 ratio: 0.0062
20 to 54: 1/21 ratio: 0.0063
Total US non-institutionalized population/new SF sales: 1/1/63 to 12/31/07 ratio: 0.0039 All new SF sales: 1/21 ratio: 0.0035

Return TOC
Nominal vs. SAAR New SF House Sales
Nominal and Adjusted New SF Monthly Sales
Presented above is nominal (non-adjusted) new SF sales data contrasted against SAAR data.
The apparent expansion factor “…is the ratio of the unadjusted number of houses sold in the US to the
seasonally adjusted number of houses sold in the US (i.e., to the sum of the seasonally adjusted values for
the four regions).” – U.S. DOC-Construction
Source: http://www.census.gov/construction/nrc/pdf/newresconst.pdf; 2/24/21
633
663
672629 650
618609
604
607
557
615 633 607669
693
664
600
726
661706 726 706
696
731
774
716
612
570
698
840
979977 965
965
839
885923
13.212.310.210.310.511.011.712.913.213.014.014.8 13.111.710.210.410.711.012.012.413.012.813.9
14.913.1 11.4 10.411.010.910.611.512.112.512.414.215.0
13.2
48
54
6661 62
5652
4746
43
44
38
4957
68 64
56 66
55 57 56 5550 49
5963
59
52
64
79
8581
77 78
59 59
70
0
10
20
30
40
50
60
70
80
90
100
0
200
400
600
800
1,000
New SF sales (adj) Apparent Expansion Factor New SF sales (non-adj)
RHS: New SF SAAR
Contrast of January 2020 and
January 2021
LHS: Nominal & Expansion Factors
Nominal & SF data, in thousands
Return TOC
New SF House Sales
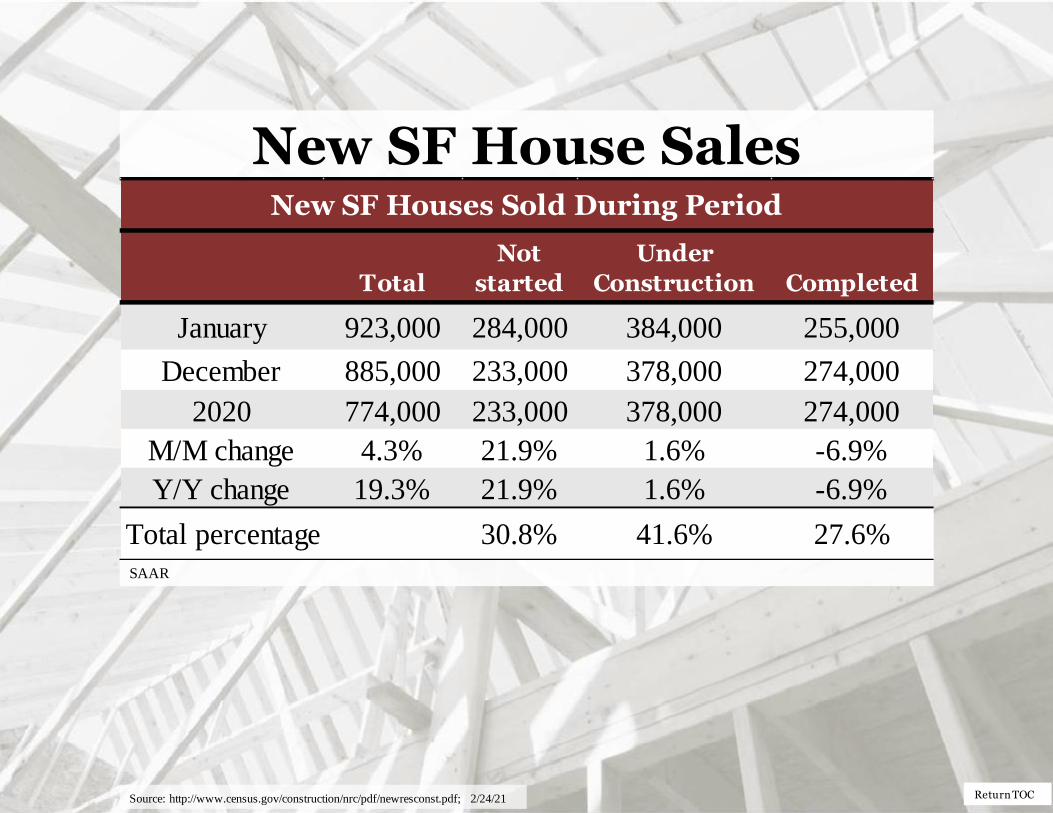
SAAR
Source: http://www.census.gov/construction/nrc/pdf/newresconst.pdf; 2/24/21
Total
Not
started
Under
Construction Completed
January 923,000 284,000 384,000 255,000
December 885,000 233,000 378,000 274,000
2020 774,000 233,000 378,000 274,000
M/M change 4.3% 21.9% 1.6% -6.9%
Y/Y change 19.3% 21.9% 1.6% -6.9%
Total percentage 30.8% 41.6% 27.6%
New SF Houses Sold During Period
Return TOC
* NBER based Recession Indicator Bars for the United States from the Period following the Peak through the Trough (FRED, St. Louis).
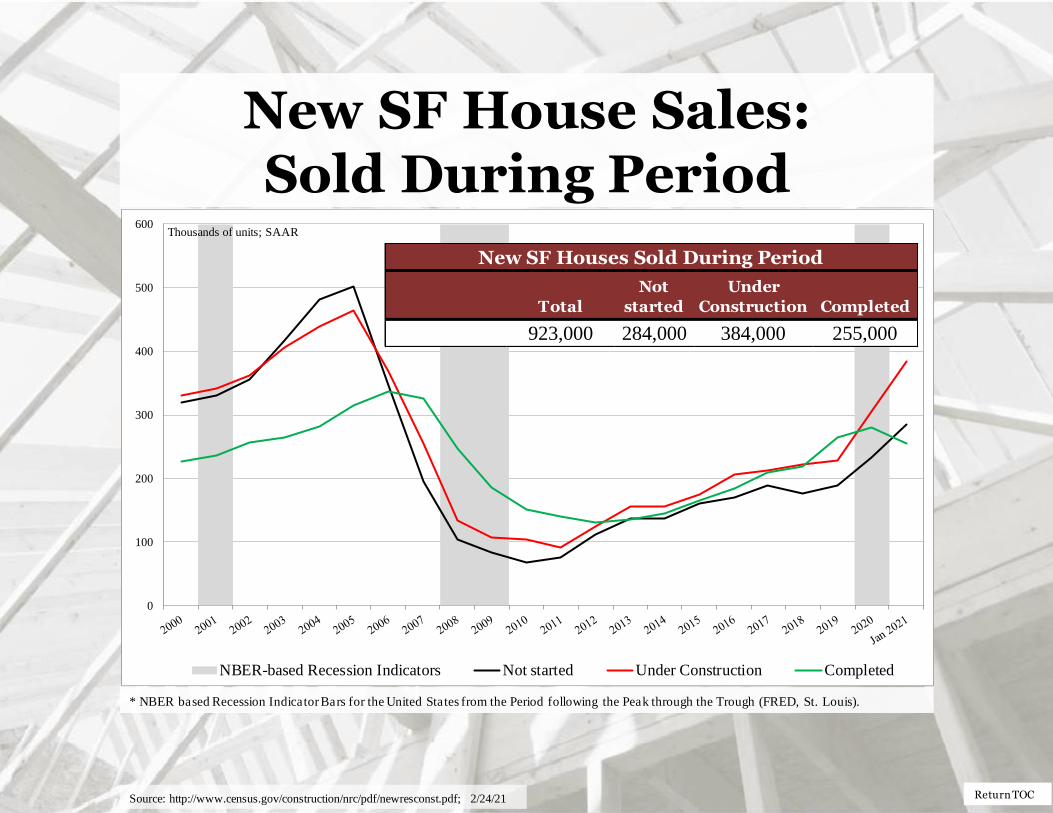
New SF House Sales: Sold During Period
Source: http://www.census.gov/construction/nrc/pdf/newresconst.pdf; 2/24/21
0
100
200
300
400
500
600
NBER-based Recession Indicators Not started Under Construction Completed
Thousands of units; SAAR
Total
Not
started
Under
Construction Completed
923,000 284,000 384,000 255,000
New SF Houses Sold During Period
Return TOC
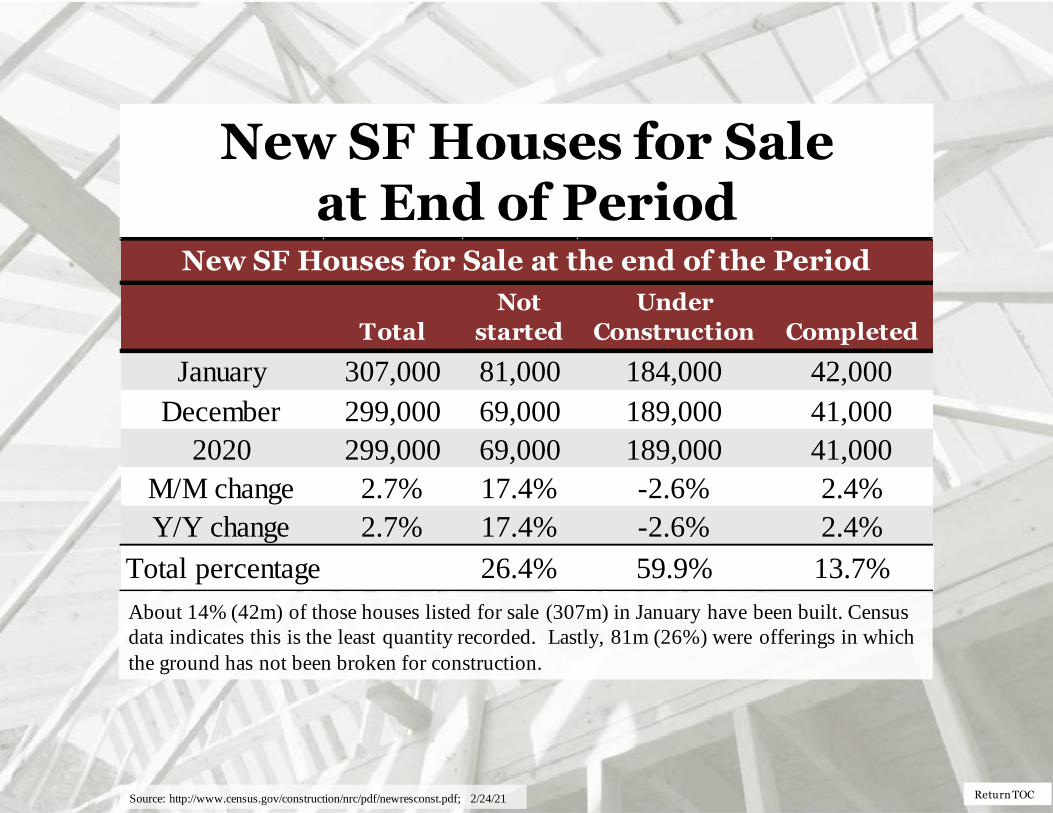
New SF Houses for Sale at End of Period
About 14% (42m) of those houses listed for sale (307m) in January have been built. Census
data indicates this is the least quantity recorded. Lastly, 81m (26%) were offerings in which
the ground has not been broken for construction.
Source: http://www.census.gov/construction/nrc/pdf/newresconst.pdf; 2/24/21
Total
Not
started
Under
Construction Completed
January 307,000 81,000 184,000 42,000
December 299,000 69,000 189,000 41,000
2020 299,000 69,000 189,000 41,000
M/M change 2.7% 17.4% -2.6% 2.4%
Y/Y change 2.7% 17.4% -2.6% 2.4%
Total percentage 26.4% 59.9% 13.7%
New SF Houses for Sale at the end of the Period
Return TOC
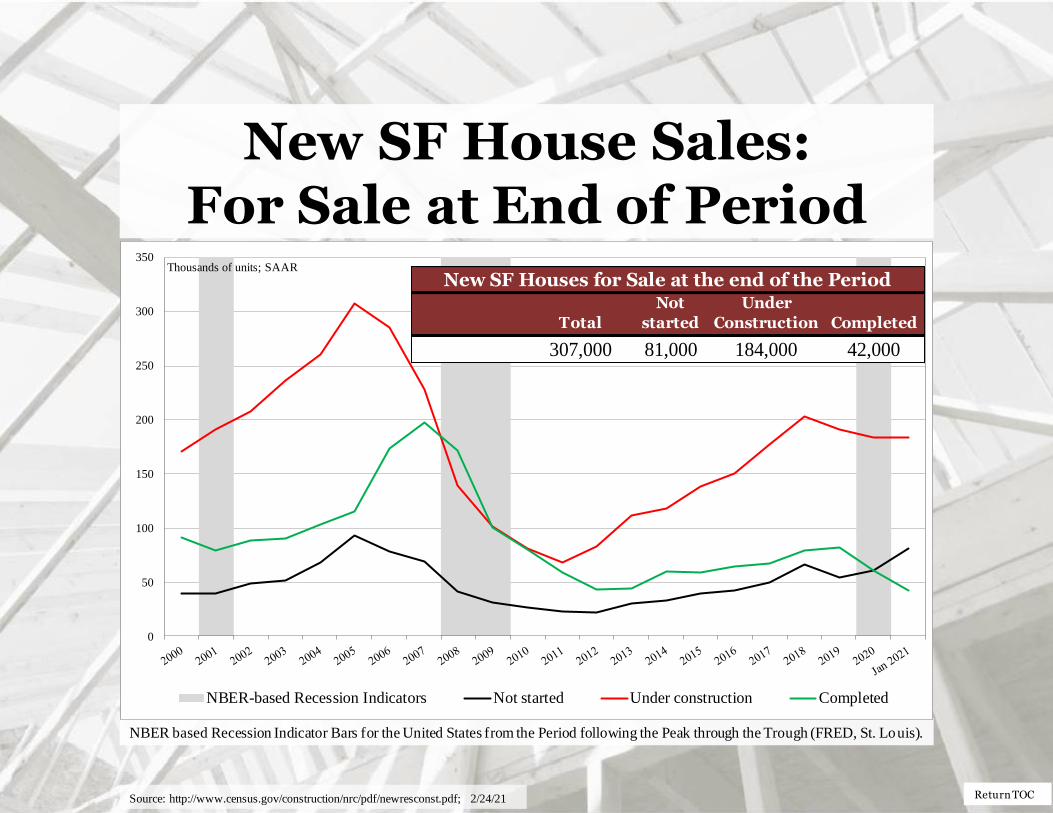
New SF House Sales: For Sale at End of Period
NBER based Recession Indicator Bars for the United States from the Period following the Peak through the Trough (FRED, St. Louis).
Source: http://www.census.gov/construction/nrc/pdf/newresconst.pdf; 2/24/21
0
50
100
150
200
250
300
350
NBER-based Recession Indicators Not started Under construction Completed
Thousands of units; SAAR
Total
Not
started
Under
Construction Completed
307,000 81,000 184,000 42,000
New SF Houses for Sale at the end of the Period
Return TOC
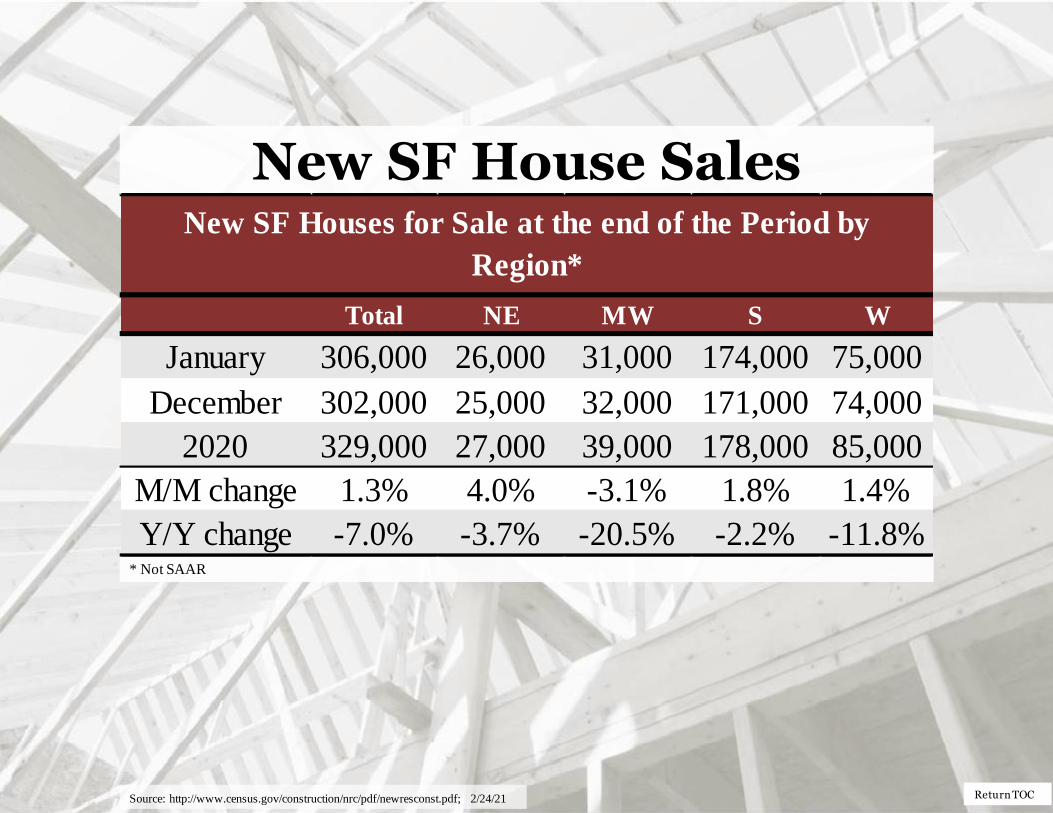
New SF House Sales
* Not SAAR
Source: http://www.census.gov/construction/nrc/pdf/newresconst.pdf; 2/24/21
Total NE MW S W
January 306,000 26,000 31,000 174,000 75,000
December 302,000 25,000 32,000 171,000 74,000
2020 329,000 27,000 39,000 178,000 85,000
M/M change 1.3% 4.0% -3.1% 1.8% 1.4%
Y/Y change -7.0% -3.7% -20.5% -2.2% -11.8%
New SF Houses for Sale at the end of the Period by
Region*
Return TOC
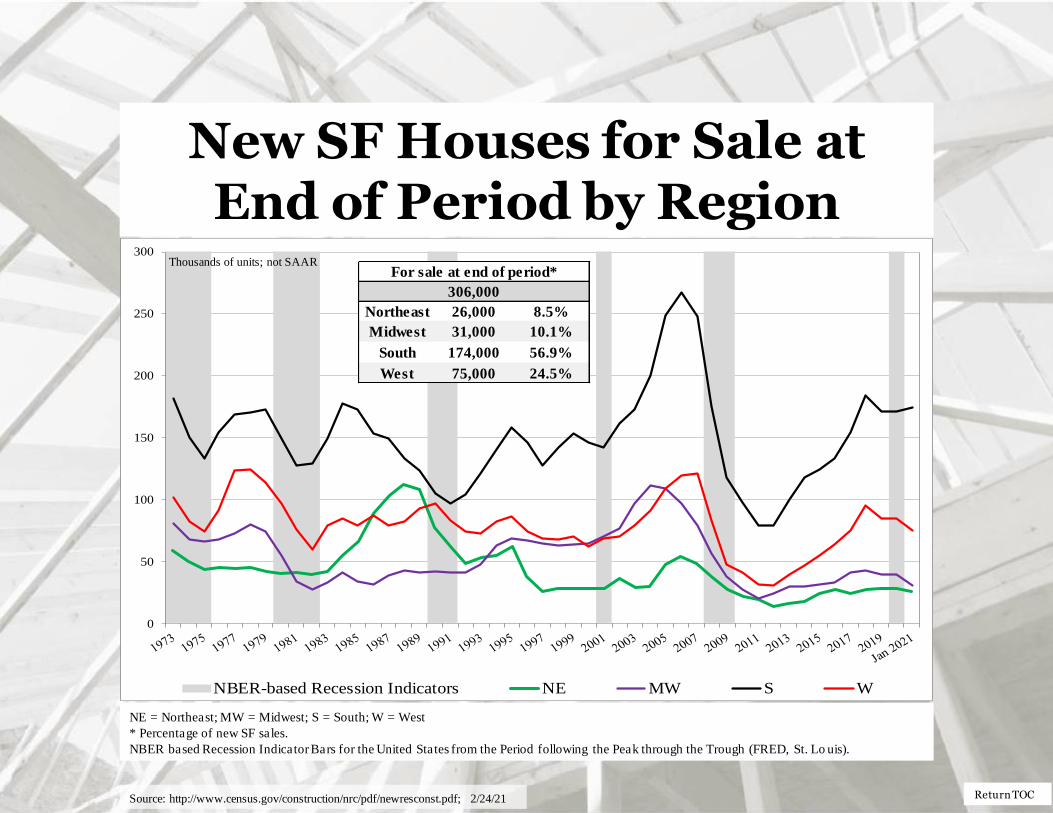
New SF Houses for Sale at End of Period by Region
NE = Northeast; MW = Midwest; S = South; W = West
* Percentage of new SF sales.
NBER based Recession Indicator Bars for the United States from the Period following the Peak through the Trough (FRED, St. Lo uis).
Source: http://www.census.gov/construction/nrc/pdf/newresconst.pdf; 2/24/21
0
50
100
150
200
250
300
NBER-based Recession Indicators NE MW S W
Thousands of units; not SAAR
Northeast 26,000 8.5%
Midwest 31,000 10.1%
South 174,000 56.9%
West 75,000 24.5%
For sale at end of period*
306,000
Return TOC
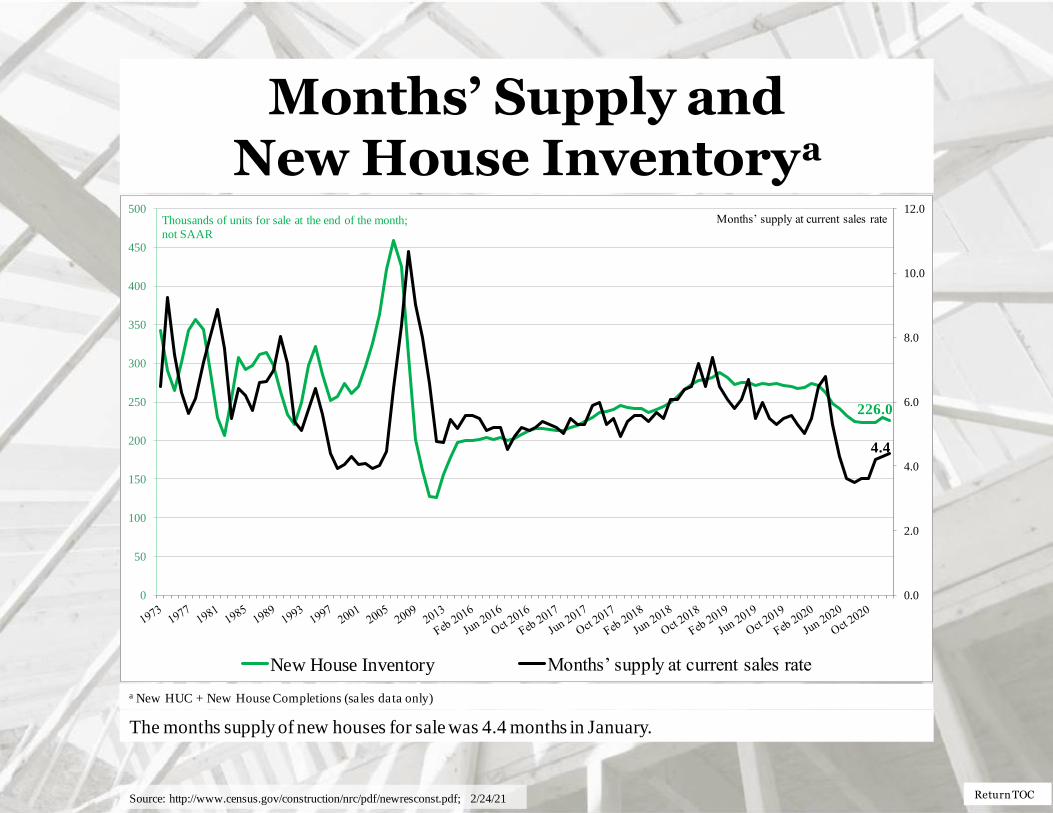
Months’ Supply and New House Inventory
a
a New HUC + New House Completions (sales data only)
Source: http://www.census.gov/construction/nrc/pdf/newresconst.pdf; 2/24/21
The months supply of new houses for sale was 4.4 months in January.
226.0
4.4
0.0
2.0
4.0
6.0
8.0
10.0
12.0
0
50
100
150
200
250
300
350
400
450
500
New House Inventory Months’ supply at current sales rate
Thousands of units for sale at the end of the month;
not SAAR
Months’ supply at current sales rate
Return TOC
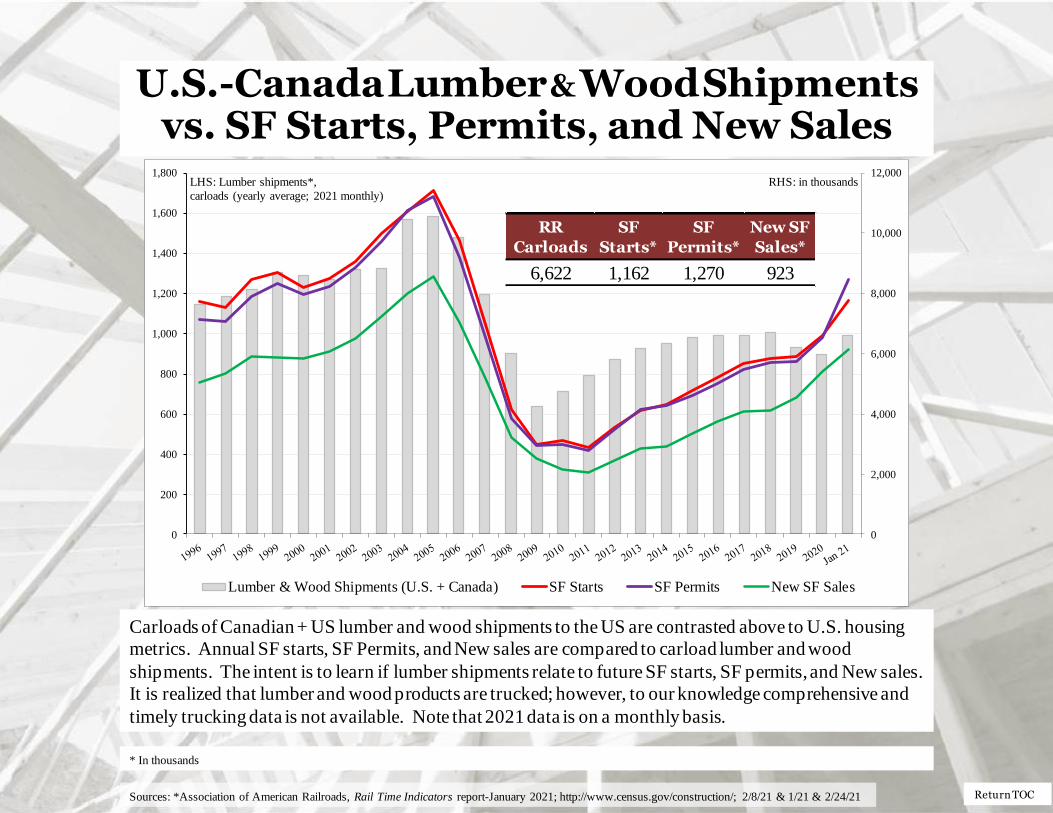
U.S.-Canada Lumber & Wood Shipments vs. SF Starts, Permits, and New Sales
Sources: *Association of American Railroads, Rail Time Indicators report-January 2021; http://www.census.gov/construction/; 2/8/21 & 1/21 & 2/24/21
Carloads of Canadian + US lumber and wood shipments to the US are contrasted above to U.S. housing
metrics. Annual SF starts, SF Permits, and New sales are compared to carload lumber and wood
shipments. The intent is to learn if lumber shipments relate to future SF starts, SF permits, and New sales.
It is realized that lumber and wood products are trucked; however, to our knowledge comprehensive and
timely trucking data is not available. Note that 2021 data is on a monthly basis.
* In thousands
0
2,000
4,000
6,000
8,000
10,000
12,000
0
200
400
600
800
1,000
1,200
1,400
1,600
1,800
Lumber & Wood Shipments (U.S. + Canada) SF Starts SF Permits New SF Sales
RHS: in thousands LHS: Lumber shipments*,
carloads (yearly average; 2021 monthly)
RR
Carloads
SF
Starts*
SF
Permits*
New SF
Sales*
6,622 1,162 1,270 923
Return TOC
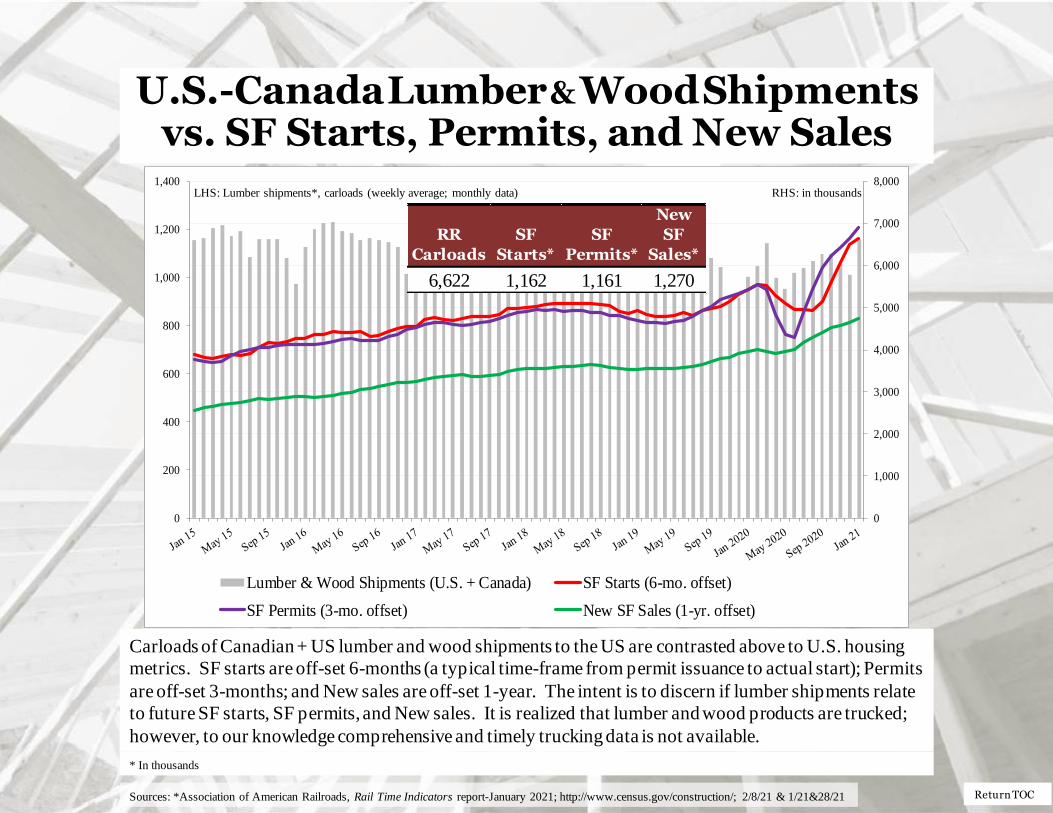
Carloads of Canadian + US lumber and wood shipments to the US are contrasted above to U.S. housing
metrics. SF starts are off-set 6-months (a typical time-frame from permit issuance to actual start); Permits
are off-set 3-months; and New sales are off-set 1-year. The intent is to discern if lumber shipments relate
to future SF starts, SF permits, and New sales. It is realized that lumber and wood products are trucked;
however, to our knowledge comprehensive and timely trucking data is not available.
U.S.-Canada Lumber & Wood Shipments vs. SF Starts, Permits, and New Sales
* In thousands
Sources: *Association of American Railroads, Rail Time Indicators report-January 2021; http://www.census.gov/construction/; 2/8/21 & 1/21&28/21
0
200
400
600
800
1,000
1,200
1,400
0
1,000
2,000
3,000
4,000
5,000
6,000
7,000
8,000
Lumber & Wood Shipments (U.S. + Canada) SF Starts (6-mo. offset)
SF Permits (3-mo. offset) New SF Sales (1-yr. offset)
RHS: in thousands LHS: Lumber shipments*, carloads (weekly average; monthly data)
RR
Carloads
SF
Starts*
SF
Permits*
New
SF
Sales*
6,622 1,162 1,161 1,270
Return TOC
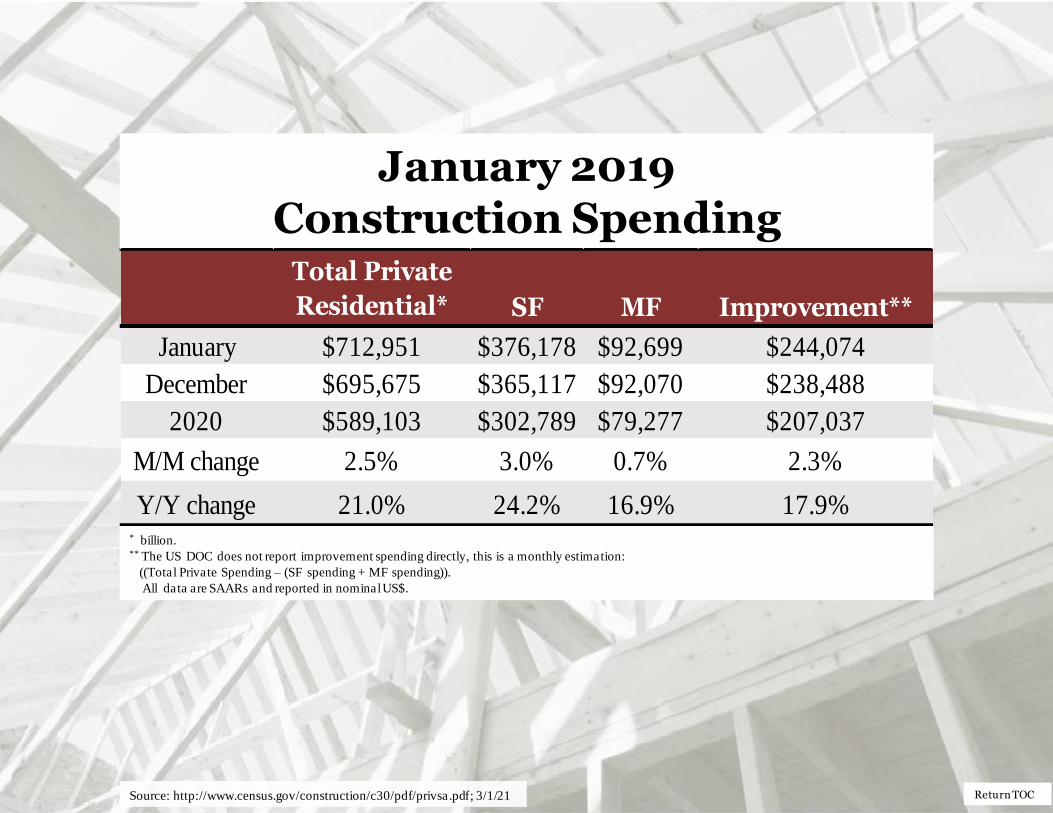
January 2019 Construction Spending
* billion. ** The US DOC does not report improvement spending directly, this is a monthly estimation:
((Total Private Spending – (SF spending + MF spending)).
All data are SAARs and reported in nominal US$.
Source: http://www.census.gov/construction/c30/pdf/privsa.pdf; 3/1/21
Total Private
Residential* SF MF Improvement**
January $712,951 $376,178 $92,699 $244,074
December $695,675 $365,117 $92,070 $238,488
2020 $589,103 $302,789 $79,277 $207,037
M/M change 2.5% 3.0% 0.7% 2.3%
Y/Y change 21.0% 24.2% 16.9% 17.9%
Return TOC
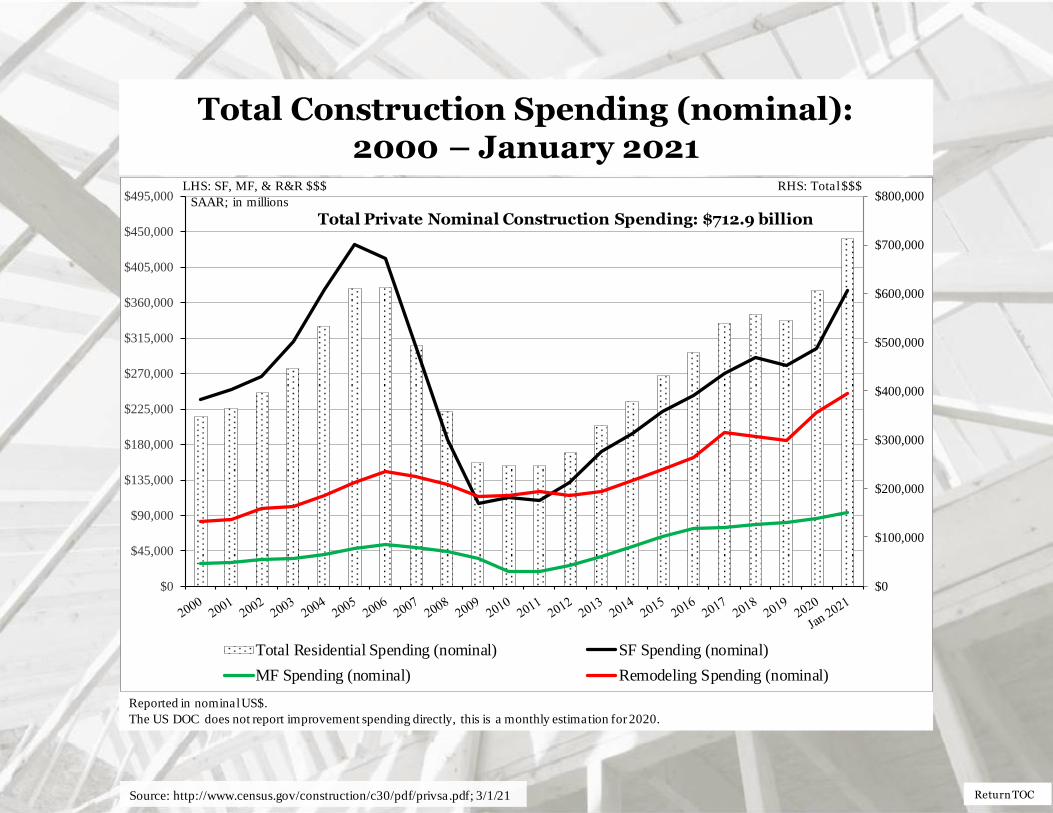
Total Construction Spending (nominal): 2000 – January 2021
Reported in nominal US$.
The US DOC does not report improvement spending directly, this is a monthly estimation for 2020.
Source: http://www.census.gov/construction/c30/pdf/privsa.pdf; 3/1/21
$0
$100,000
$200,000
$300,000
$400,000
$500,000
$600,000
$700,000
$800,000
$0
$45,000
$90,000
$135,000
$180,000
$225,000
$270,000
$315,000
$360,000
$405,000
$450,000
$495,000
Total Residential Spending (nominal) SF Spending (nominal)
MF Spending (nominal) Remodeling Spending (nominal)
RHS: Total $$$
Total Private Nominal Construction Spending: $712.9 billion SAAR; in millions
LHS: SF, MF, & R&R $$$
Return TOC
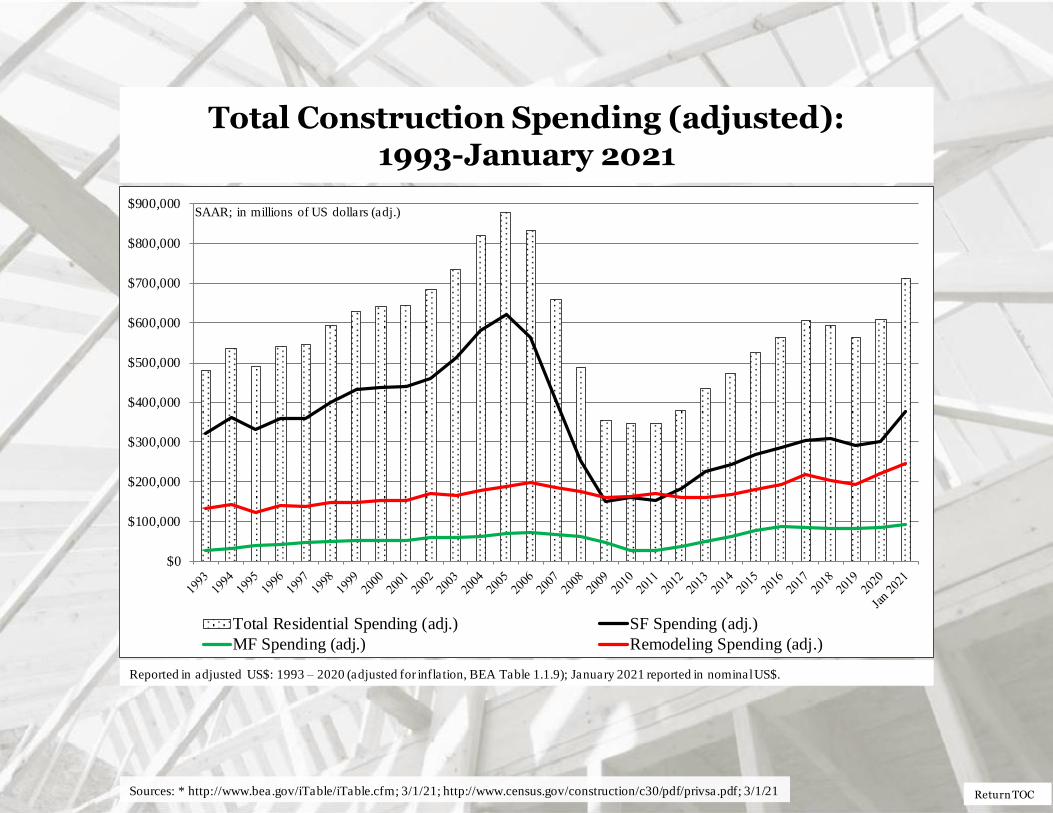
Total Construction Spending (adjusted): 1993-January 2021
Reported in adjusted US$: 1993 – 2020 (adjusted for inflation, BEA Table 1.1.9); January 2021 reported in nominal US$.
Sources: * http://www.bea.gov/iTable/iTable.cfm; 3/1/21; http://www.census.gov/construction/c30/pdf/privsa.pdf; 3/1/21
$0
$100,000
$200,000
$300,000
$400,000
$500,000
$600,000
$700,000
$800,000
$900,000
Total Residential Spending (adj.) SF Spending (adj.)
MF Spending (adj.) Remodeling Spending (adj.)
SAAR; in millions of US dollars (adj.)
Return TOC
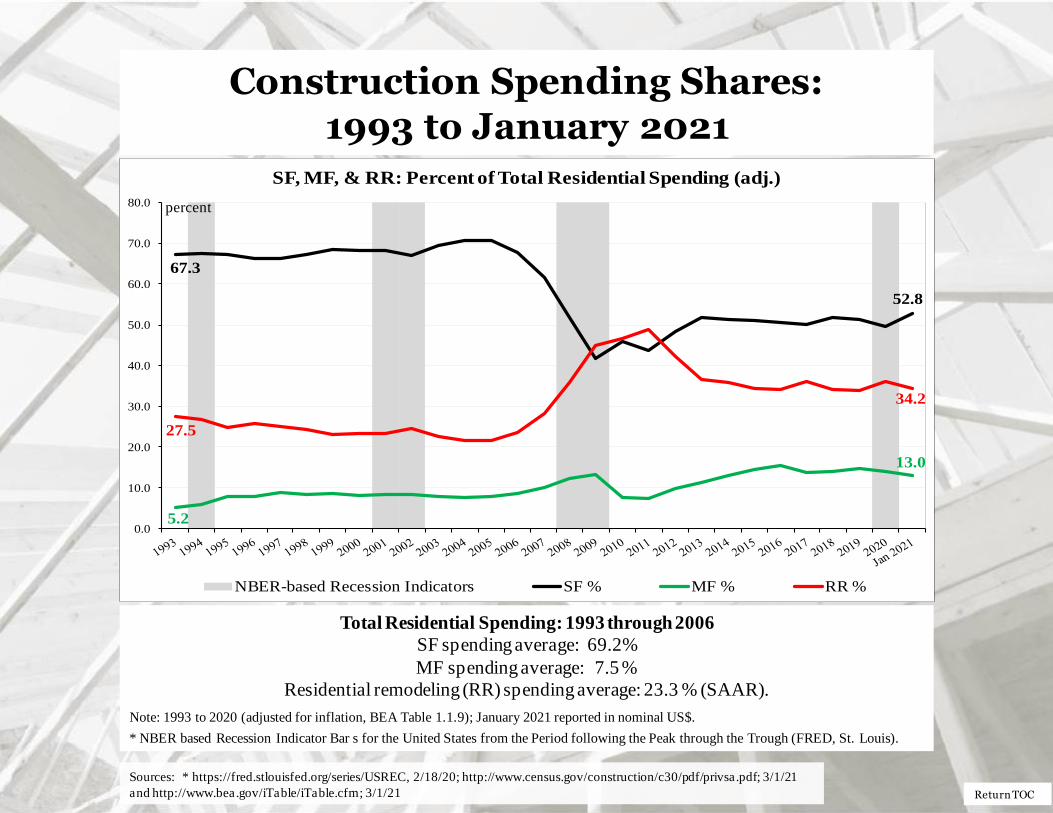
Construction Spending Shares: 1993 to January 2021
Total Residential Spending: 1993 through 2006
SF spending average: 69.2%
MF spending average: 7.5 %
Residential remodeling (RR) spending average: 23.3 % (SAAR).
Note: 1993 to 2020 (adjusted for inflation, BEA Table 1.1.9); January 2021 reported in nominal US$.
* NBER based Recession Indicator Bar s for the United States from the Period following the Peak through the Trough (FRED, St. Louis).
Sources: * https://fred.stlouisfed.org/series/USREC, 2/18/20; http://www.census.gov/construction/c30/pdf/privsa.pdf; 3/1/21
and http://www.bea.gov/iTable/iTable.cfm; 3/1/21
67.3
52.8
5.2
13.0
27.5
34.2
0.0
10.0
20.0
30.0
40.0
50.0
60.0
70.0
80.0
SF, MF, & RR: Percent of Total Residential Spending (adj.)
NBER-based Recession Indicators SF % MF % RR %
percent

Return TOC
Adjusted Construction Spending: Y/Y Percentage Change,
1993 to January 2021
Nominal Residential Construction Spending:
Y/Y percentage change, 1993 to January 2021
Presented above is the percentage change of inflation adjusted Y/Y construction spending. SF, MF, and
RR expenditures were positive on a percentage basis, year-over-year and month-over-month (January
2021 data reported in nominal dollars). * NBER based Recession Bars for the United States from the Period following the Peak through the Trough (FRED, St. Louis).
Sources: * https://fred.stlouisfed.org/series/USREC, 2/18/20; http://www.census.gov/construction/c30/pdf/privsa.pdf; 3/1/21
and http://www.bea.gov/iTable/iTable.cfm; 2/4/21
-60.0
-40.0
-20.0
0.0
20.0
40.0
60.0
NBER-based Recession Indicators SF Spending-nom.: Y/Y % change
MF Spending-nom.: Y/Y % change Remodeling Spending-nom.: Y/Y % change

Return TOC
Adjusted Construction Spending: Y/Y Percentage Change,
1993 to January 2021
Sources: http://www.census.gov/construction/c30/pdf/privsa.pdf; 3/1/21 and http://www.bea.gov/iTable/iTable.cfm; 3/1/21
-60.0
-40.0
-20.0
0.0
20.0
40.0
60.0
Total Residential Spending Y/Y % change (adj.) SF Spending Y/Y % change (adj.)
MF Spending Y/Y % change (adj.) Remodeling Spending Y/Y % change (adj.)
Return TOC
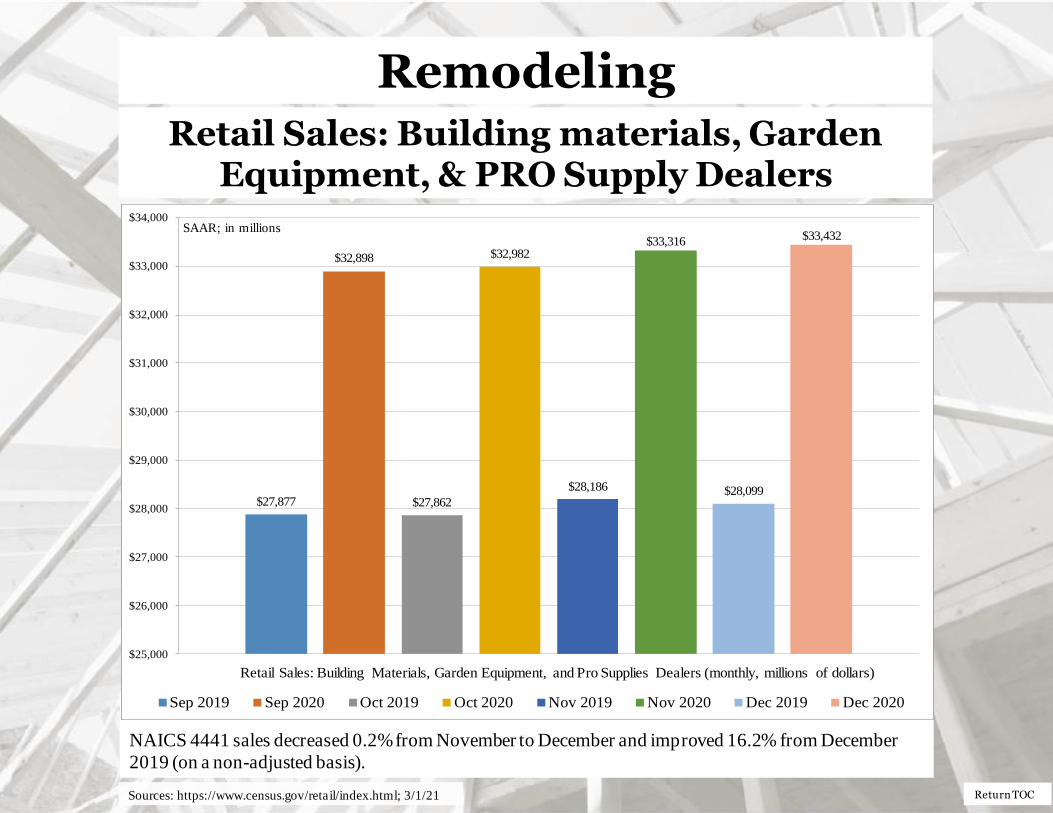
Retail Sales: Building materials, Garden Equipment, & PRO Supply Dealers
Sources: https://www.census.gov/retail/index.html; 3/1/21
Building materials, Garden Equipment, & PRO Supply Dealers: NAICS 4441
NAICS 4441 sales decreased 0.2% from November to December and improved 16.2% from December
2019 (on a non-adjusted basis).
Remodeling
$27,877
$32,898
$27,862
$32,982
$28,186
$33,316
$28,099
$33,432
$25,000
$26,000
$27,000
$28,000
$29,000
$30,000
$31,000
$32,000
$33,000
$34,000
Retail Sales: Building Materials, Garden Equipment, and Pro Supplies Dealers (monthly, millions of dollars)
Sep 2019 Sep 2020 Oct 2019 Oct 2020 Nov 2019 Nov 2020 Dec 2019 Dec 2020
SAAR; in millions
Return TOC
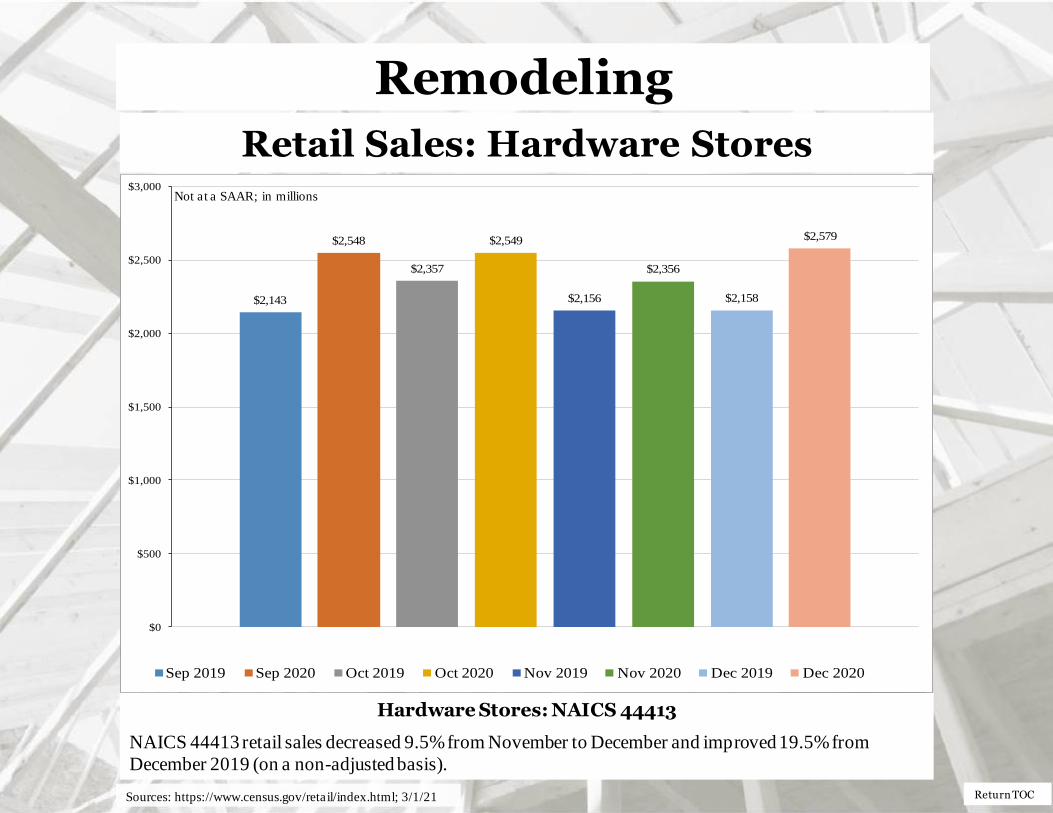
Retail Sales: Hardware Stores
Hardware Stores: NAICS 44413
NAICS 44413 retail sales decreased 9.5% from November to December and improved 19.5% from
December 2019 (on a non-adjusted basis).
Remodeling
$2,143
$2,548
$2,357
$2,549
$2,156
$2,356
$2,158
$2,579
$0
$500
$1,000
$1,500
$2,000
$2,500
$3,000
Sep 2019 Sep 2020 Oct 2019 Oct 2020 Nov 2019 Nov 2020 Dec 2019 Dec 2020
Not at a SAAR; in millions
Sources: https://www.census.gov/retail/index.html; 3/1/21
Return TOC
Remodeling
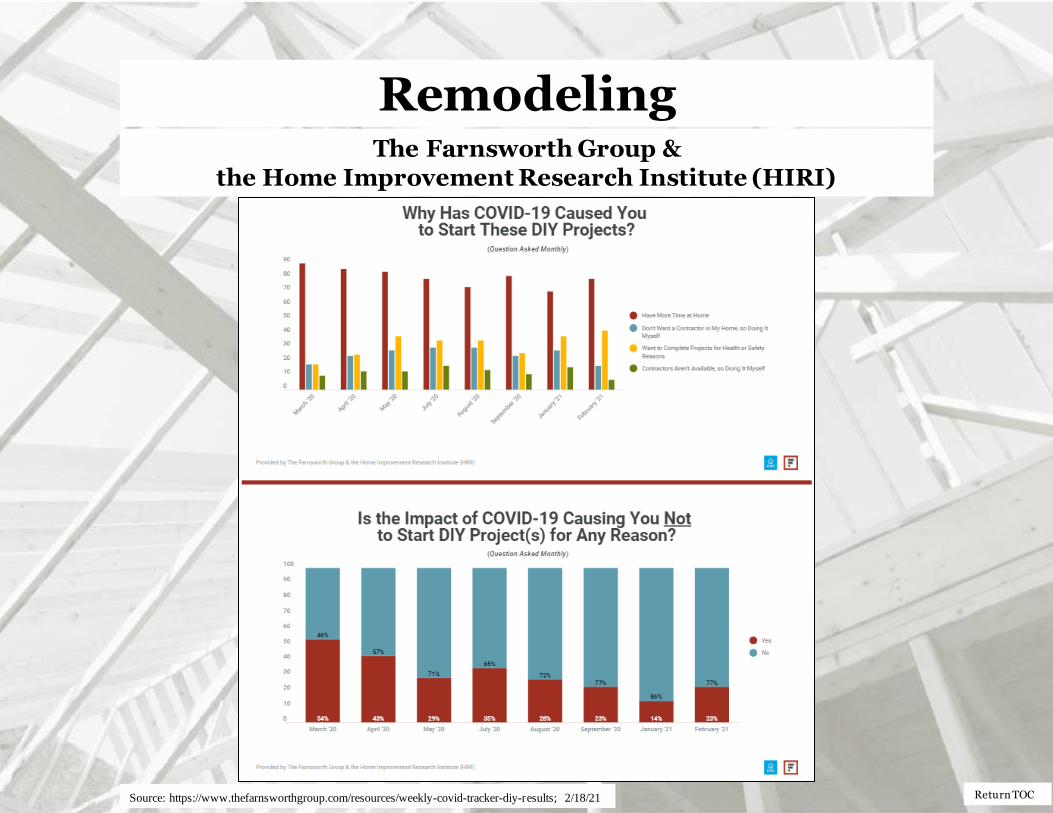
Source: https://www.thefarnsworthgroup.com/resources/weekly-covid-tracker-diy-results; 2/18/21
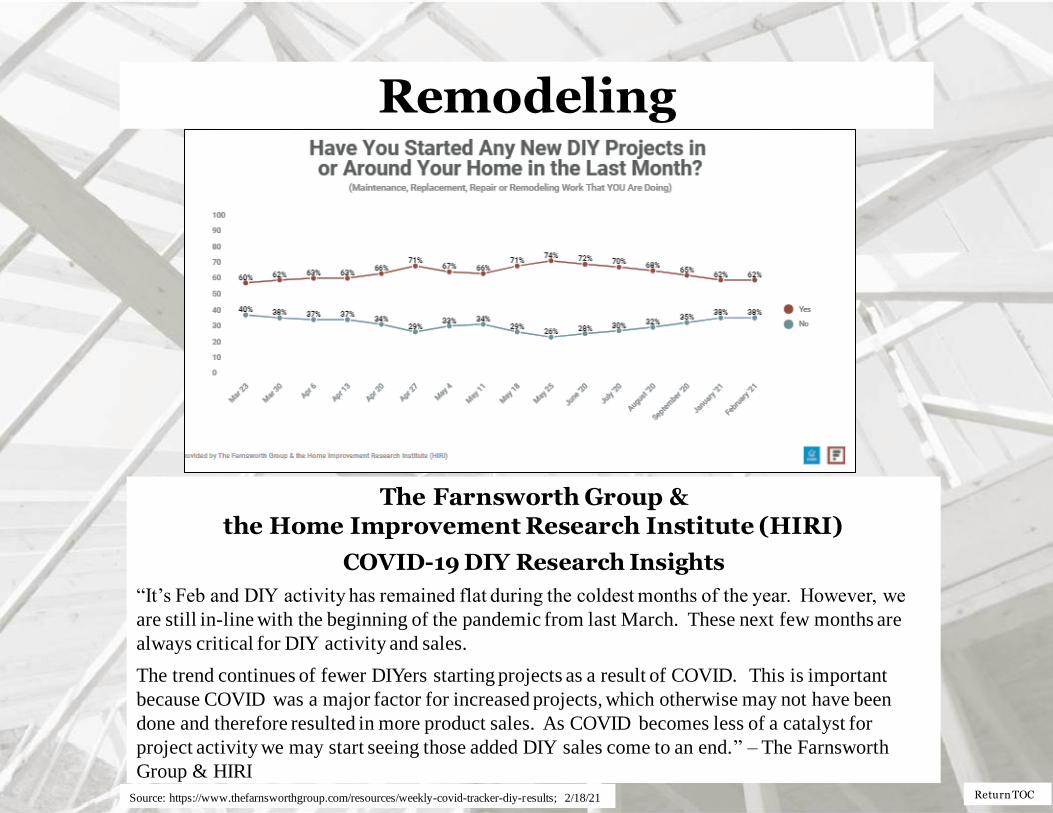
The Farnsworth Group & the Home Improvement Research Institute (HIRI)
COVID-19 DIY Research Insights
“It’s Feb and DIY activity has remained flat during the coldest months of the year. However, we
are still in-line with the beginning of the pandemic from last March. These next few months are
always critical for DIY activity and sales.
The trend continues of fewer DIYers starting projects as a result of COVID. This is important
because COVID was a major factor for increased projects, which otherwise may not have been
done and therefore resulted in more product sales. As COVID becomes less of a catalyst for
project activity we may start seeing those added DIY sales come to an end.” – The Farnsworth
Group & HIRI
Return TOC
Remodeling The Farnsworth Group &
the Home Improvement Research Institute (HIRI)
Source: https://www.thefarnsworthgroup.com/resources/weekly-covid-tracker-diy-results; 2/18/21
Return TOC
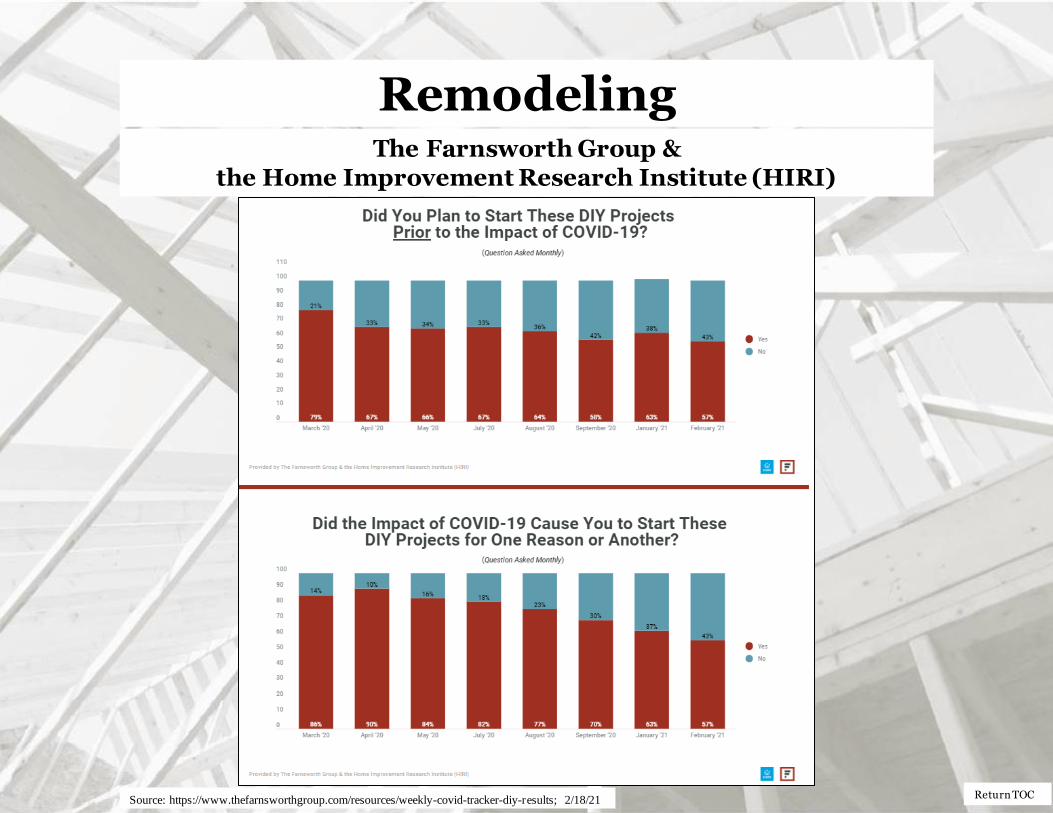
Remodeling The Farnsworth Group &
the Home Improvement Research Institute (HIRI)
Source: https://www.thefarnsworthgroup.com/resources/weekly-covid-tracker-diy-results; 2/18/21

Return TOC
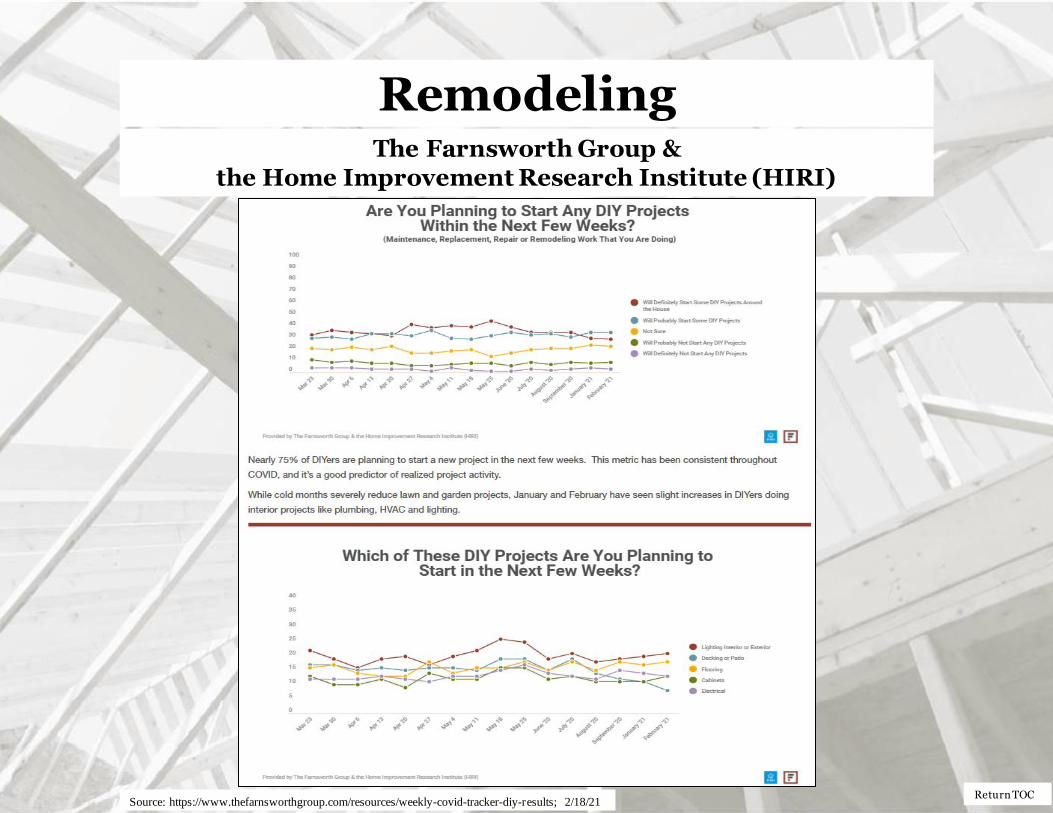
Remodeling The Farnsworth Group &
the Home Improvement Research Institute (HIRI)
Source: https://www.thefarnsworthgroup.com/resources/weekly-covid-tracker-diy-results; 2/18/21
Return TOC
Remodeling The Farnsworth Group &
the Home Improvement Research Institute (HIRI)
Source: https://www.thefarnsworthgroup.com/resources/weekly-covid-tracker-diy-results; 2/18/21
Return TOC
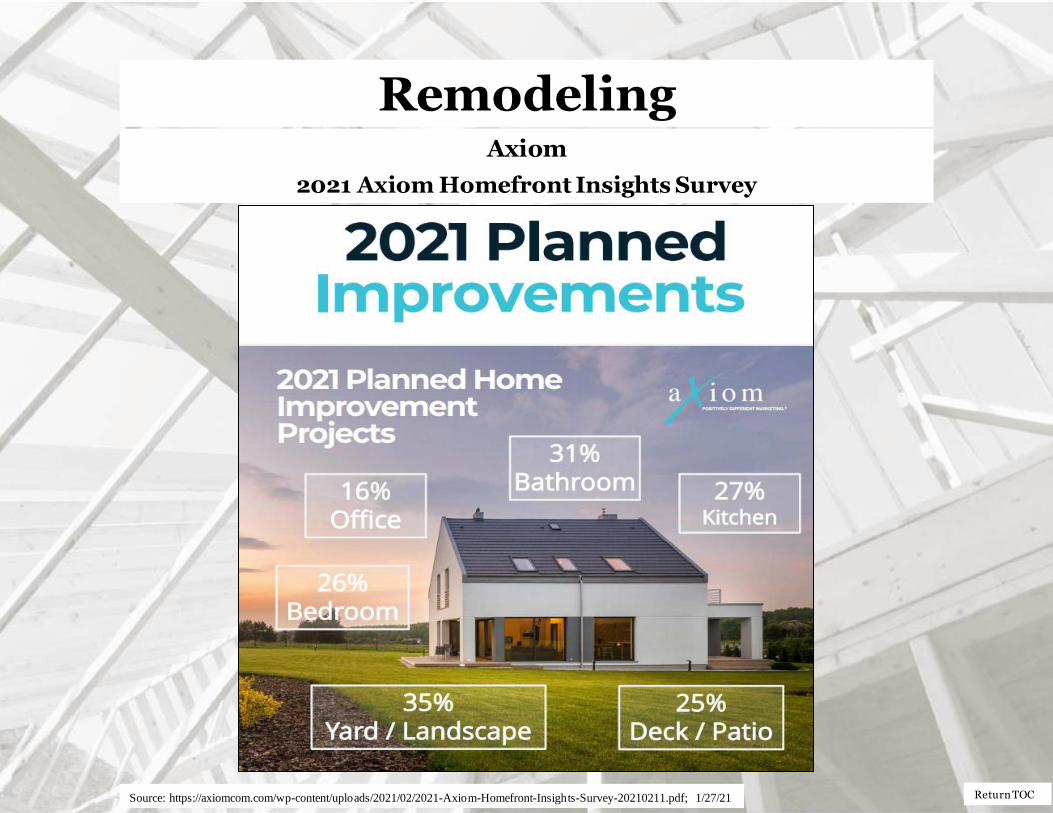
Remodeling Axiom
2021 Axiom Homefront Insights Survey
Source: https://axiomcom.com/wp-content/uploads/2021/02/2021-Axiom-Homefront-Insights-Survey-20210211.pdf; 1/27/21
Return TOC
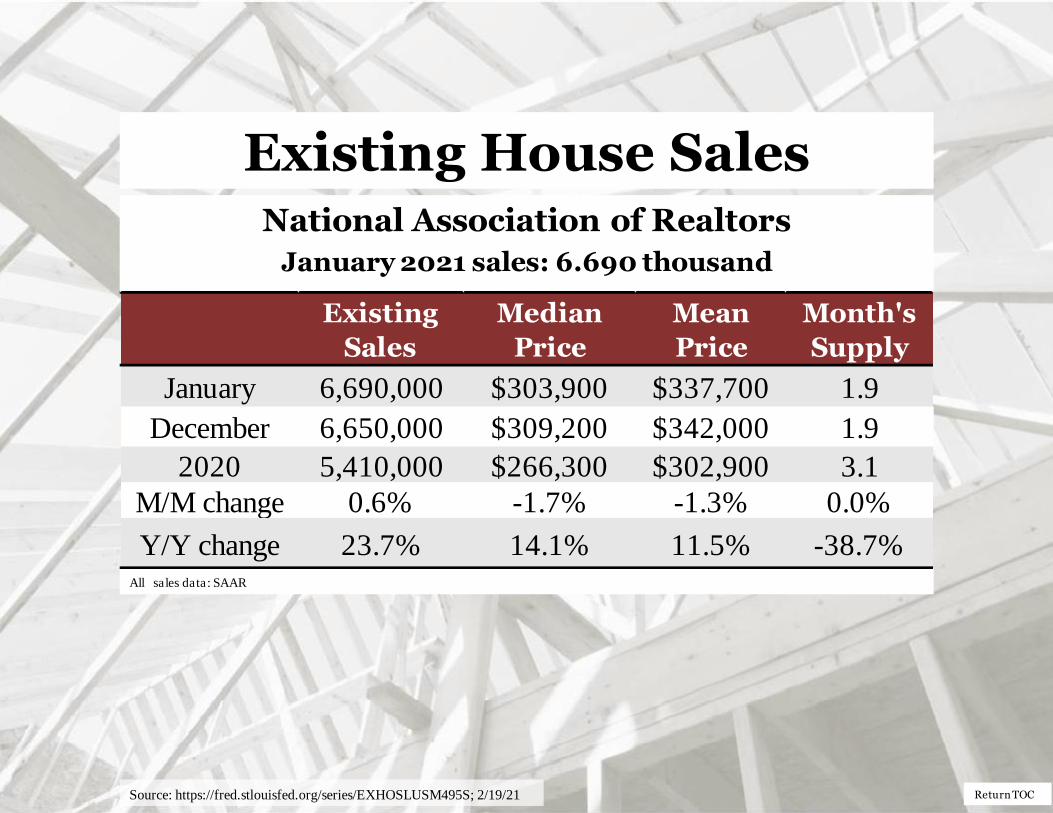
Existing House Sales National Association of Realtors
January 2021 sales: 6.690 thousand
All sales data: SAAR
Source: https://fred.stlouisfed.org/series/EXHOSLUSM495S; 2/19/21
Existing
Sales
Median
Price
Mean
Price
Month's
Supply
January 6,690,000 $303,900 $337,700 1.9
December 6,650,000 $309,200 $342,000 1.9
2020 5,410,000 $266,300 $302,900 3.1
M/M change 0.6% -1.7% -1.3% 0.0%
Y/Y change 23.7% 14.1% 11.5% -38.7%
Return TOC
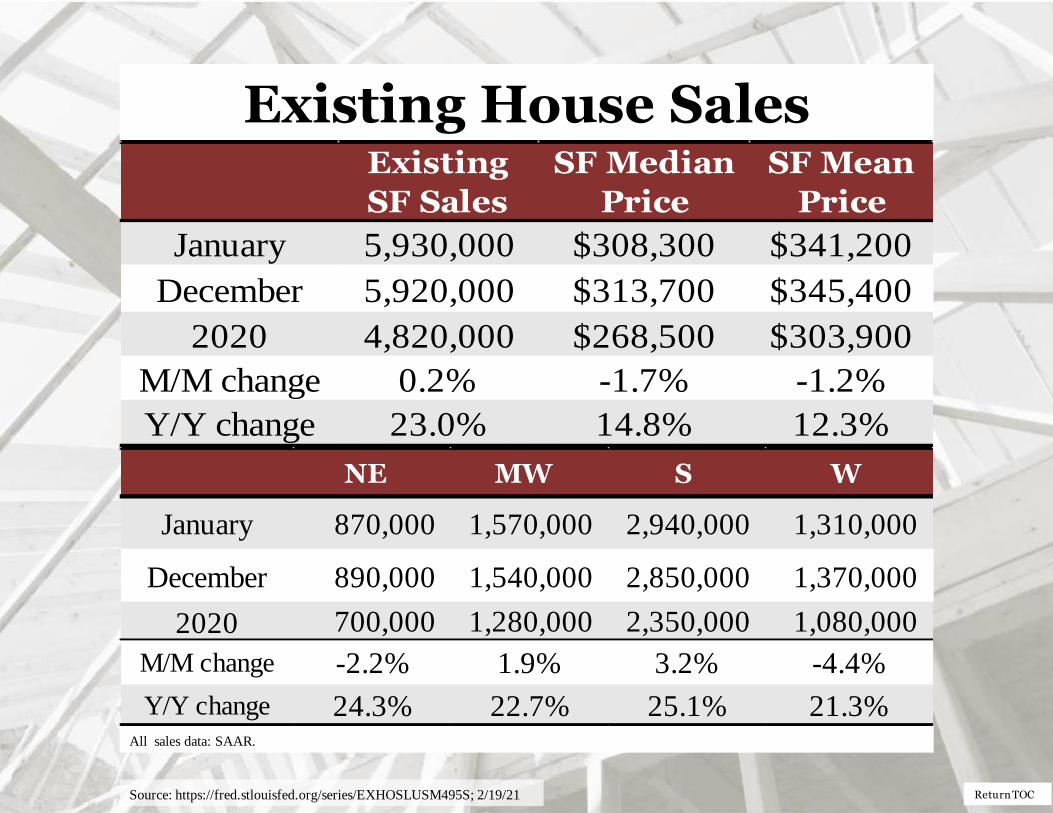
Existing House Sales
All sales data: SAAR.
Source: https://fred.stlouisfed.org/series/EXHOSLUSM495S; 2/19/21
Existing
SF Sales
SF Median
Price
SF Mean
Price
January 5,930,000 $308,300 $341,200
December 5,920,000 $313,700 $345,400
2020 4,820,000 $268,500 $303,900
M/M change 0.2% -1.7% -1.2%
Y/Y change 23.0% 14.8% 12.3%
NE MW S W
January 870,000 1,570,000 2,940,000 1,310,000
December 890,000 1,540,000 2,850,000 1,370,000
2020 700,000 1,280,000 2,350,000 1,080,000
M/M change -2.2% 1.9% 3.2% -4.4%
Y/Y change 24.3% 22.7% 25.1% 21.3%

Return TOC
Existing House Sales
NE = Northeast; MW = Midwest; S = South; W = West
* Percentage of total existing sales.
Source: https://fred.stlouisfed.org/series/EXHOSLUSM495S; 2/19/21
0
1,000
2,000
3,000
4,000
5,000
6,000
7,000
8,000
Total U.S. U.S. SF NE MW S W
SAAR; in thousands
Total NE 870,000 13.0%
Total MW 1,570,000 23.5%
Total S 2,940,000 43.9%
Total W 1,310,000 19.6%
Total Existing Sales*
Return TOC Return to TOC
U.S. Housing Prices
Source: https://www.fhfa.gov//Media/PublicAffairs/Pages/US-House-Prices-Rise-10pt8-Percent-over-the-Last-Year-Up-3pt8-Percent-in-4Q.aspx; 2/23/21
Federal Housing Finance Agency
U.S. House Prices Rise 10.8 Percent over the Last Year; Up 3.8 Percent in the Fourth Quarter
House prices have risen for 38 consecutive quarters, or since September 2011
Significant Findings
“ U.S. house prices rose 10.8 percent from the fourth quarter of 2019 to the fourth quarter of 2020
according to the Federal Housing Finance Agency House Price Index (FHFA HPI®). House prices
were up 3.8 percent compared to the third quarter of 2020. FHFA's seasonally adjusted monthly
index for December was up 1.1 percent from November.” – Raffi Williams and Adam Russell,
FHFA
“House prices nationwide recorded the largest annual and quarterly increase in the history of the
FHFA HPI. Low mortgage rates, pent up demand from homebuyers, and a limited housing supply
propelled every region of the country to experience faster growth in 2020 compared to a year ago
despite the pandemic. In particular, house prices in western states and cities saw the highest rates
of growth, where annual gains often rose above 10 percent.” – Dr. Lynn Fisher, Deputy Director of
the Division of Research and Statistics, FHFA
Return TOC Return to TOC
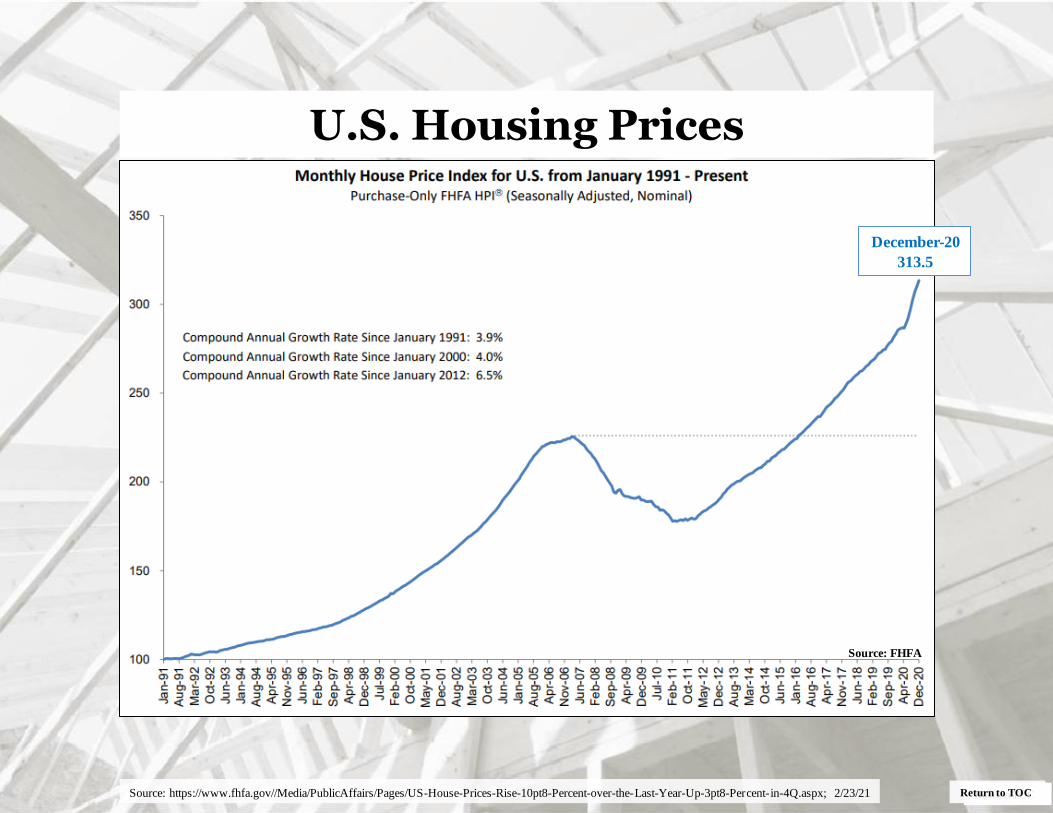
U.S. Housing Prices
Source: https://www.fhfa.gov//Media/PublicAffairs/Pages/US-House-Prices-Rise-10pt8-Percent-over-the-Last-Year-Up-3pt8-Percent-in-4Q.aspx; 2/23/21
December-20
313.5
Source: FHFA

Return TOC Return to TOC
S&P CoreLogic Case-Shiller Index Reports 10.4% Annual Home Price Gain To End 2020
“Data for December 2020 show that home prices continue to increase across the U.S. More
than 27 years of history are available for these data series, and can be accessed in full by
going to www.spdji.com.
Year-Over-Year
The S&P CoreLogic Case-Shiller U.S. National Home Price NSA Index, covering all nine
U.S. census divisions, reported a 10.4% annual gain in December, up from 9.5% in the
previous month. The 10-City Composite annual increase came in at 9.8%, up from 8.9% in
the previous month. The 20-City Composite posted a 10.1% year-over-year gain, up from
9.2% in the previous month.
Phoenix, Seattle, and San Diego continued to report the highest year-over-year gains among
the 19 cities (excluding Detroit) in December. Phoenix led the way with a 14.4% year-over-
year price increase, followed by Seattle with a 13.6% increase and San Diego with a 13.0%
increase. Eighteen of the 19 cities reported higher price increases in the year ending
December 2020 versus the year ending November 2020.” – Craig J. Lazzara, Managing
Director and Global Head of Index Investment Strategy, S&P Dow Jones Indices
U.S. Housing Prices
Source: https://www.spglobal.com/spdji/en/index-family/indicators/sp-corelogic-case-shiller/sp-corelogic-case-shiller-composite/#overview/; 2/23/21

Return TOC Return to TOC
S&P CoreLogic Case-Shiller Index
Month-Over-Month
“Before seasonal adjustment, the U.S. National Index posted a 0.9% month-over-month increase,
while the 10-City and 20-City Composites both posted increases of 0.9% and 0.8% respectively in
December. After seasonal adjustment, the U.S. National Index posted a month-over-month
increase of 1.3%, while the 10-City and 20-City Composites both posted increases of 1.2% and
1.3% respectively. In December, 18 cities (excluding Detroit) reported increases before seasonal
adjustment, while all 19 cities reported increases after seasonal adjustment.
Analysis
“Home prices finished 2020 with double-digit gains, as the National Composite Index rose by
10.4% compared to year-ago levels. The trend of accelerating prices that began in June 2020 has
now reached its seventh month and is also reflected in the 10- and 20-City Composites (up 9.8%
and 10.1%, respectively). The market’s strength continues to be broadly-based: 18 of the 19 cities
for which we have December data rose, and 18 cities gained more in the 12 months ended in
December than they had gained in the 12 months ended in November.
Phoenix’s 14.4% increase led all cities for the 19th consecutive month, with Seattle (+13.6%) and
San Diego (+13.0%) close behind. Prices were strongest in the West (+10.8%) and Southwest
(+10.5%), but gains were impressive in every region.
As COVID-related restrictions began to grip the economy in early 2020, their effect on housing
prices was unclear. Price growth decelerated in May and June, and then began a steady climb
upward, and December’s report continues that acceleration in an emphatic manner. 2020’s 10.4%
gain marks the best performance of housing prices in a calendar year since 2013. From the
perspective of more than 30 years of S&P CoreLogic Case-Shiller data, December’s year-over-year
change ranks within the top decile of all reports.” – Craig Lazzara, Managing Director and Global
Head of Index Investment Strategy, S&P Dow Jones Indices
U.S. Housing Prices
Source: https://www.spglobal.com/spdji/en/index-family/indicators/sp-corelogic-case-shiller/sp-corelogic-case-shiller-composite/#overview/; 2/23/21
Return TOC Return to TOC
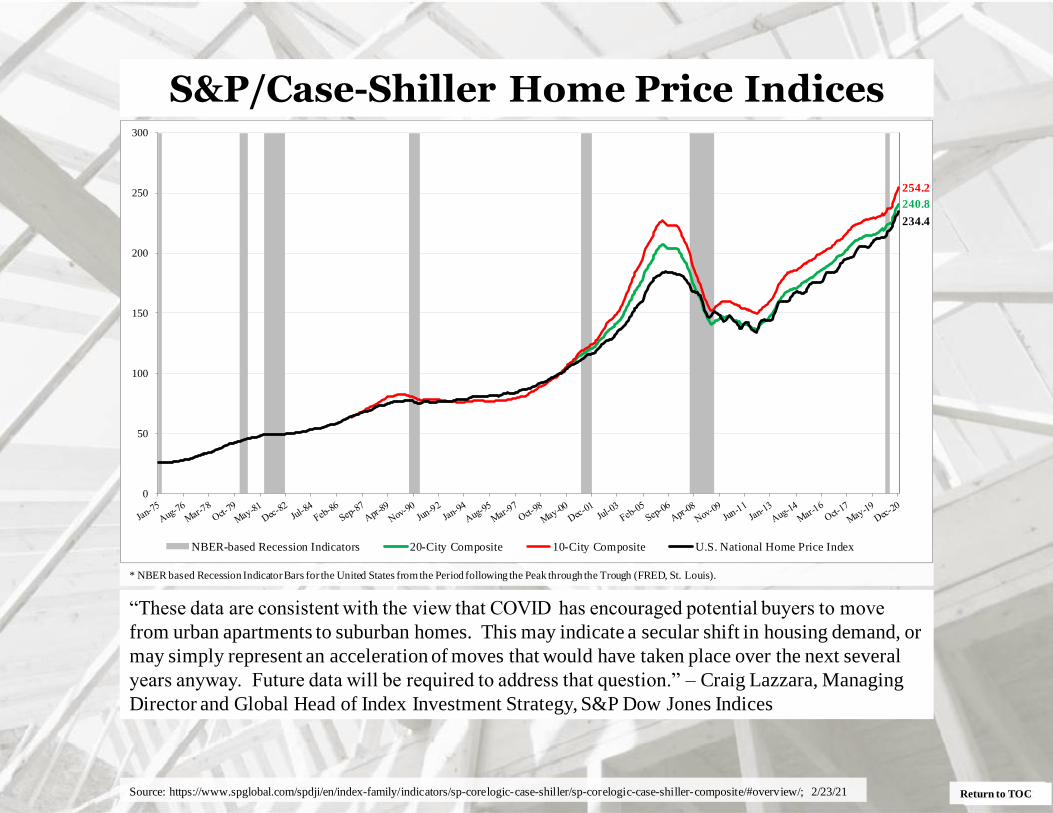
S&P/Case-Shiller Home Price Indices
* NBER based Recession Indicator Bars for the United States from the Period following the Peak through the Trough (FRED, St. Louis).
240.8
254.2
234.4
0
50
100
150
200
250
300
NBER-based Recession Indicators 20-City Composite 10-City Composite U.S. National Home Price Index
“These data are consistent with the view that COVID has encouraged potential buyers to move
from urban apartments to suburban homes. This may indicate a secular shift in housing demand, or
may simply represent an acceleration of moves that would have taken place over the next several
years anyway. Future data will be required to address that question.” – Craig Lazzara, Managing
Director and Global Head of Index Investment Strategy, S&P Dow Jones Indices
Source: https://www.spglobal.com/spdji/en/index-family/indicators/sp-corelogic-case-shiller/sp-corelogic-case-shiller-composite/#overview/; 2/23/21
Return TOC
U.S. Housing Prices
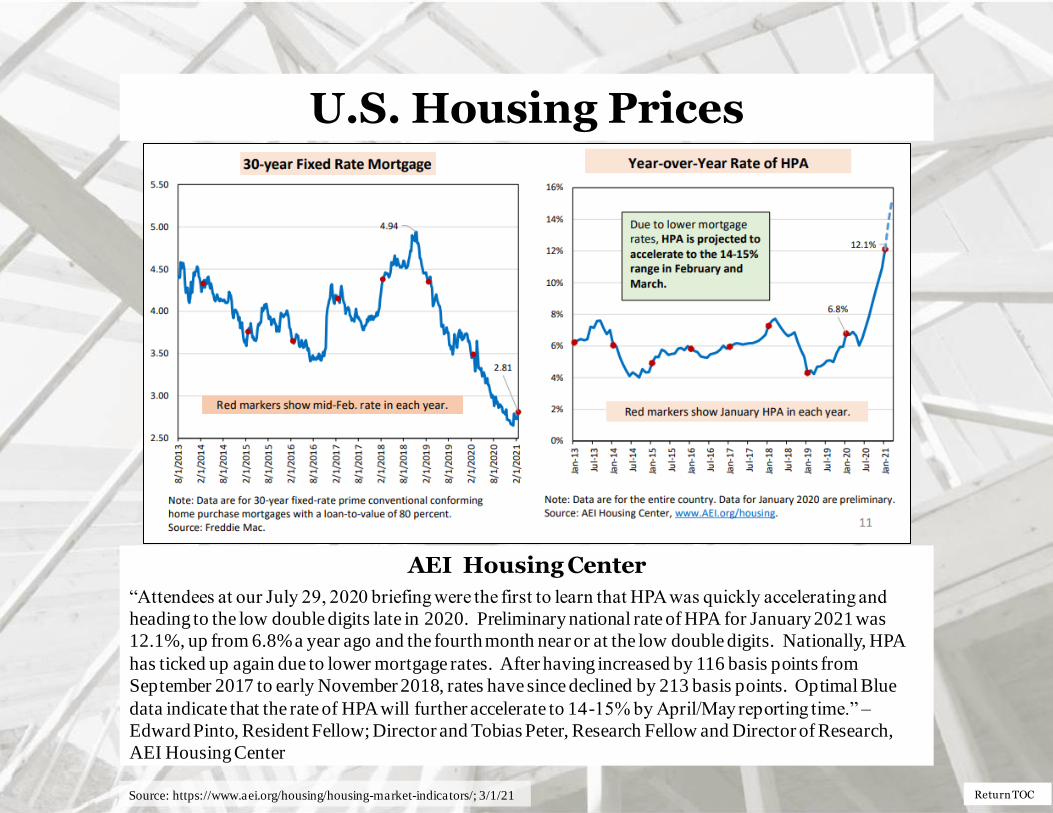
AEI Housing Center
“Attendees at our July 29, 2020 briefing were the first to learn that HPA was quickly accelerating and
heading to the low double digits late in 2020. Preliminary national rate of HPA for January 2021 was
12.1%, up from 6.8% a year ago and the fourth month near or at the low double digits. Nationally, HPA
has ticked up again due to lower mortgage rates. After having increased by 116 basis points from
September 2017 to early November 2018, rates have since declined by 213 basis points. Optimal Blue
data indicate that the rate of HPA will further accelerate to 14-15% by April/May reporting time.” –
Edward Pinto, Resident Fellow; Director and Tobias Peter, Research Fellow and Director of Research,
AEI Housing Center
Source: https://www.aei.org/housing/housing-market-indicators/; 3/1/21
Return TOC
U.S. Housing Prices
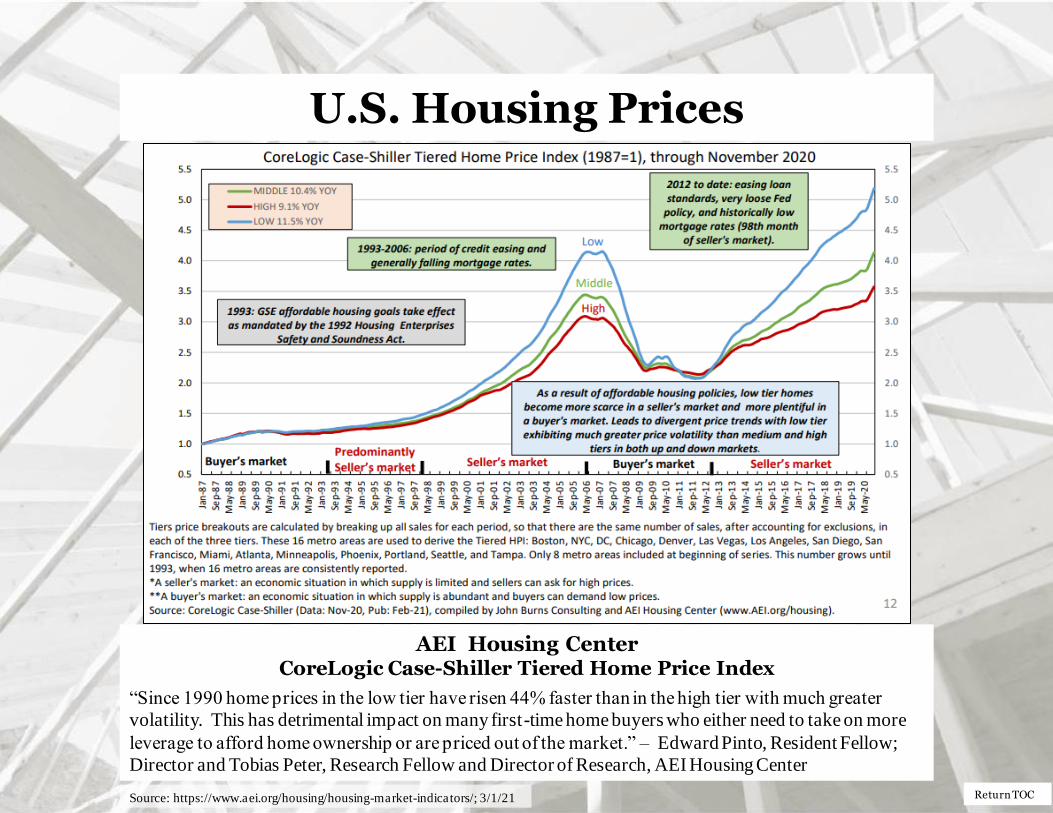
AEI Housing Center CoreLogic Case-Shiller Tiered Home Price Index
“Since 1990 home prices in the low tier have risen 44% faster than in the high tier with much greater
volatility. This has detrimental impact on many first-time home buyers who either need to take on more
leverage to afford home ownership or are priced out of the market.” – Edward Pinto, Resident Fellow;
Director and Tobias Peter, Research Fellow and Director of Research, AEI Housing Center
Source: https://www.aei.org/housing/housing-market-indicators/; 3/1/21
Return TOC
U.S. Housing Prices
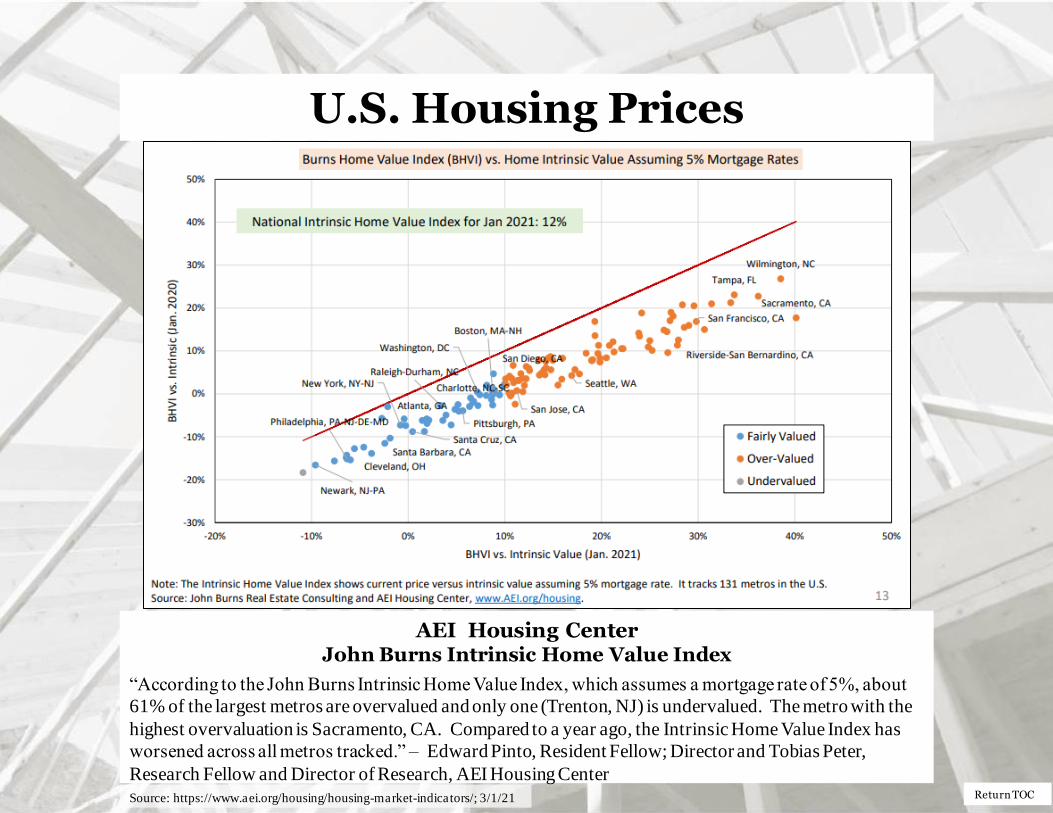
AEI Housing Center John Burns Intrinsic Home Value Index
“According to the John Burns Intrinsic Home Value Index, which assumes a mortgage rate of 5%, about
61% of the largest metros are overvalued and only one (Trenton, NJ) is undervalued. The metro with the
highest overvaluation is Sacramento, CA. Compared to a year ago, the Intrinsic Home Value Index has
worsened across all metros tracked.” – Edward Pinto, Resident Fellow; Director and Tobias Peter,
Research Fellow and Director of Research, AEI Housing Center
Source: https://www.aei.org/housing/housing-market-indicators/; 3/1/21
Return TOC
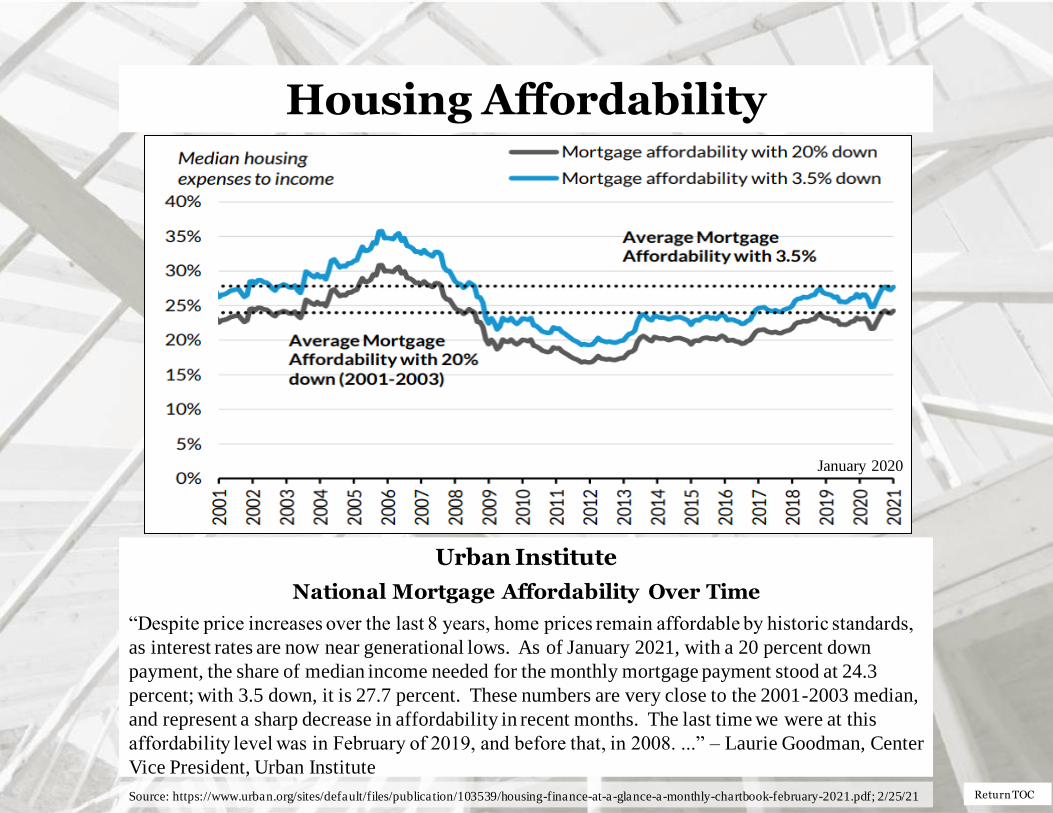
Housing Affordability
Urban Institute
National Mortgage Affordability Over Time
“Despite price increases over the last 8 years, home prices remain affordable by historic standards,
as interest rates are now near generational lows. As of January 2021, with a 20 percent down
payment, the share of median income needed for the monthly mortgage payment stood at 24.3
percent; with 3.5 down, it is 27.7 percent. These numbers are very close to the 2001-2003 median,
and represent a sharp decrease in affordability in recent months. The last time we were at this
affordability level was in February of 2019, and before that, in 2008. ...” – Laurie Goodman, Center
Vice President, Urban Institute
Source: https://www.urban.org/sites/default/files/publication/103539/housing-finance-at-a-glance-a-monthly-chartbook-february-2021.pdf; 2/25/21
January 2020
Return TOC
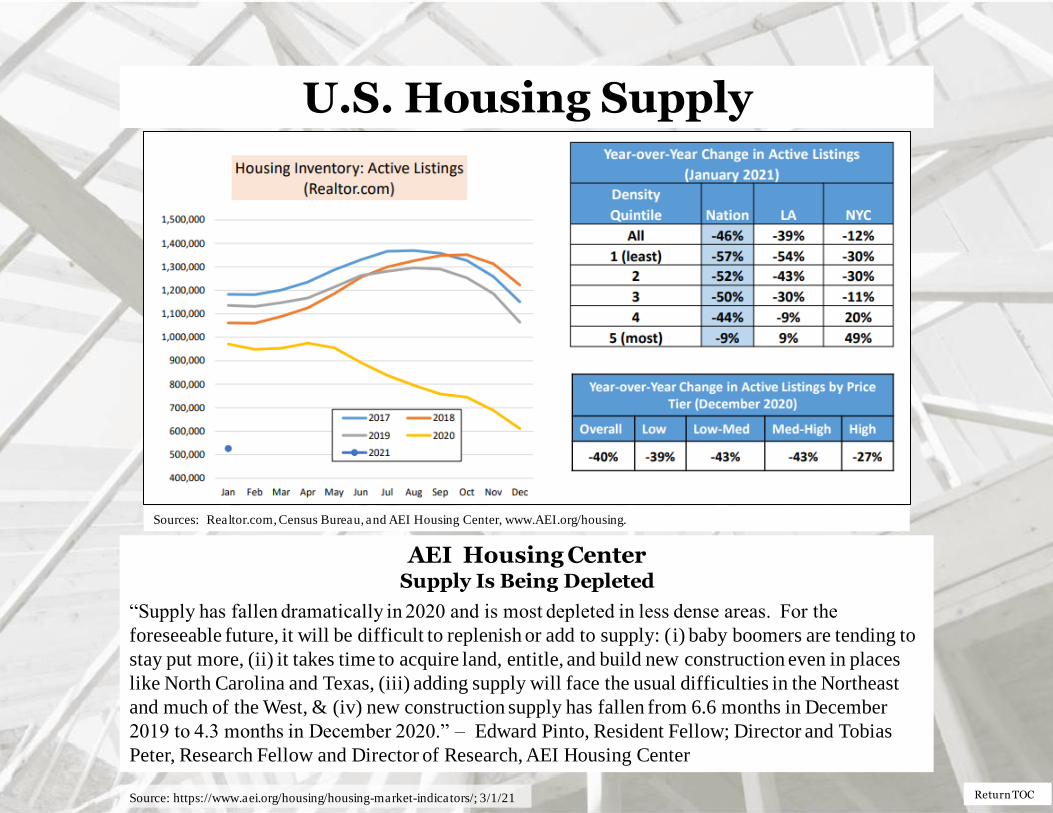
U.S. Housing Supply
AEI Housing Center Supply Is Being Depleted
“Supply has fallen dramatically in 2020 and is most depleted in less dense areas. For the
foreseeable future, it will be difficult to replenish or add to supply: (i) baby boomers are tending to
stay put more, (ii) it takes time to acquire land, entitle, and build new construction even in places
like North Carolina and Texas, (iii) adding supply will face the usual difficulties in the Northeast
and much of the West, & (iv) new construction supply has fallen from 6.6 months in December
2019 to 4.3 months in December 2020.” – Edward Pinto, Resident Fellow; Director and Tobias
Peter, Research Fellow and Director of Research, AEI Housing Center
Sources: Realtor.com, Census Bureau, and AEI Housing Center, www.AEI.org/housing.
Source: https://www.aei.org/housing/housing-market-indicators/; 3/1/21
Return TOC
Housing Supply
AEI Housing Center Months’ Supply Price Tiers
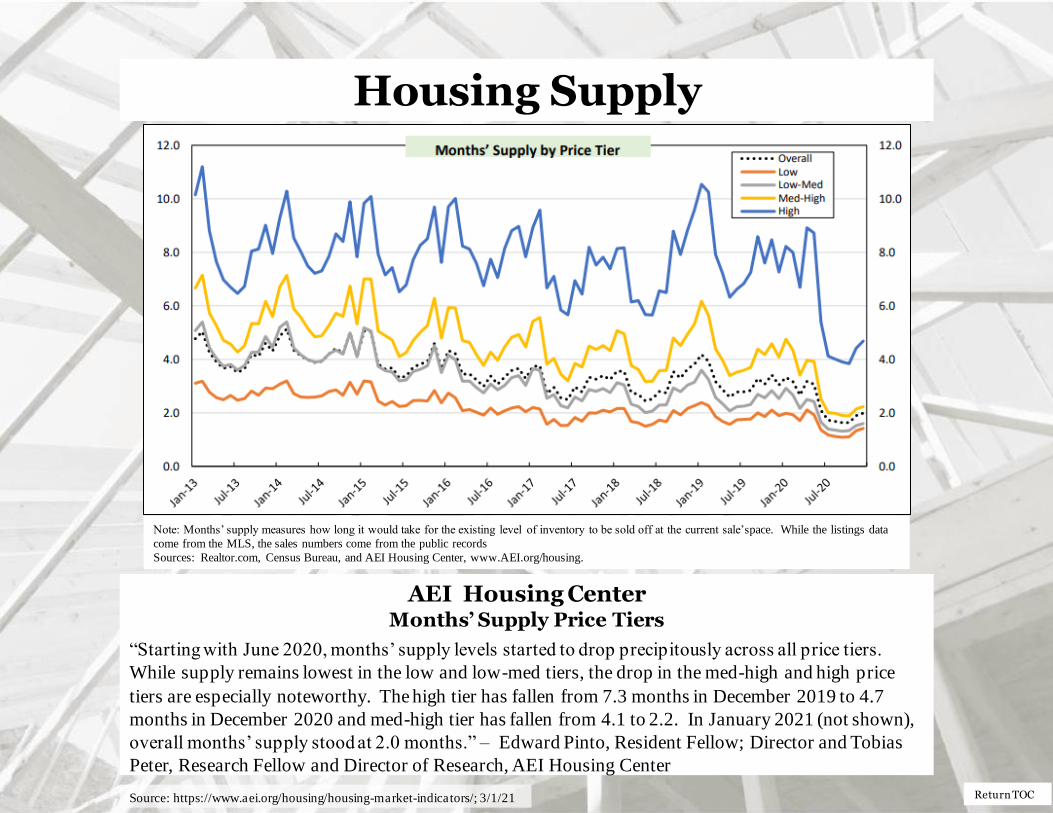
“Starting with June 2020, months’ supply levels started to drop precipitously across all price tiers.
While supply remains lowest in the low and low-med tiers, the drop in the med-high and high price
tiers are especially noteworthy. The high tier has fallen from 7.3 months in December 2019 to 4.7
months in December 2020 and med-high tier has fallen from 4.1 to 2.2. In January 2021 (not shown),
overall months’ supply stood at 2.0 months.” – Edward Pinto, Resident Fellow; Director and Tobias
Peter, Research Fellow and Director of Research, AEI Housing Center
Note: Months’ supply measures how long it would take for the existing level of inventory to be sold off at the current sale’s pace. While the listings data
come from the MLS, the sales numbers come from the public records
Sources: Realtor.com, Census Bureau, and AEI Housing Center, www.AEI.org/housing.
Source: https://www.aei.org/housing/housing-market-indicators/; 3/1/21
Return TOC
First-Time House Buyers
Urban Institute First-Time Homebuyer Share
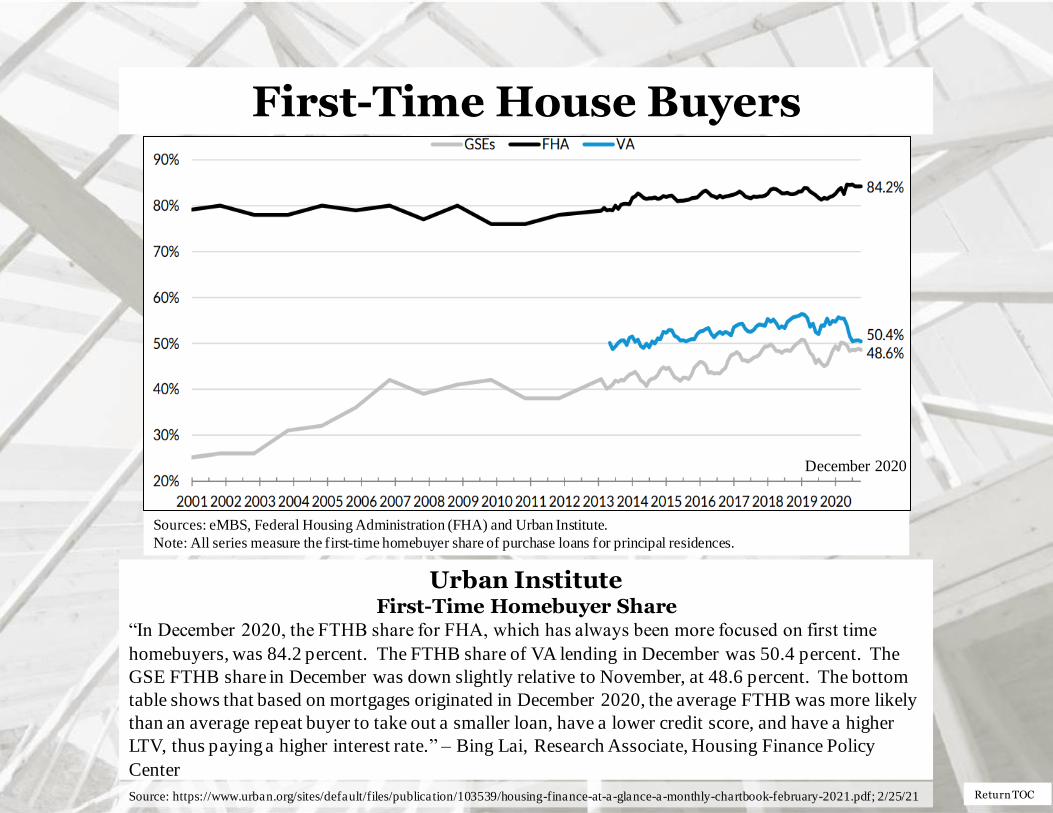
“In December 2020, the FTHB share for FHA, which has always been more focused on first time
homebuyers, was 84.2 percent. The FTHB share of VA lending in December was 50.4 percent. The
GSE FTHB share in December was down slightly relative to November, at 48.6 percent. The bottom
table shows that based on mortgages originated in December 2020, the average FTHB was more likely
than an average repeat buyer to take out a smaller loan, have a lower credit score, and have a higher
LTV, thus paying a higher interest rate.” – Bing Lai, Research Associate, Housing Finance Policy
Center
Sources: eMBS, Federal Housing Administration (FHA) and Urban Institute.
Note: All series measure the first-time homebuyer share of purchase loans for principal residences.
Source: https://www.urban.org/sites/default/files/publication/103539/housing-finance-at-a-glance-a-monthly-chartbook-february-2021.pdf; 2/25/21
December 2020

Return TOC
U.S. Housing Finance
Mortgage Bankers Association (MBA)
Mortgage Credit Availability Unchanged in February
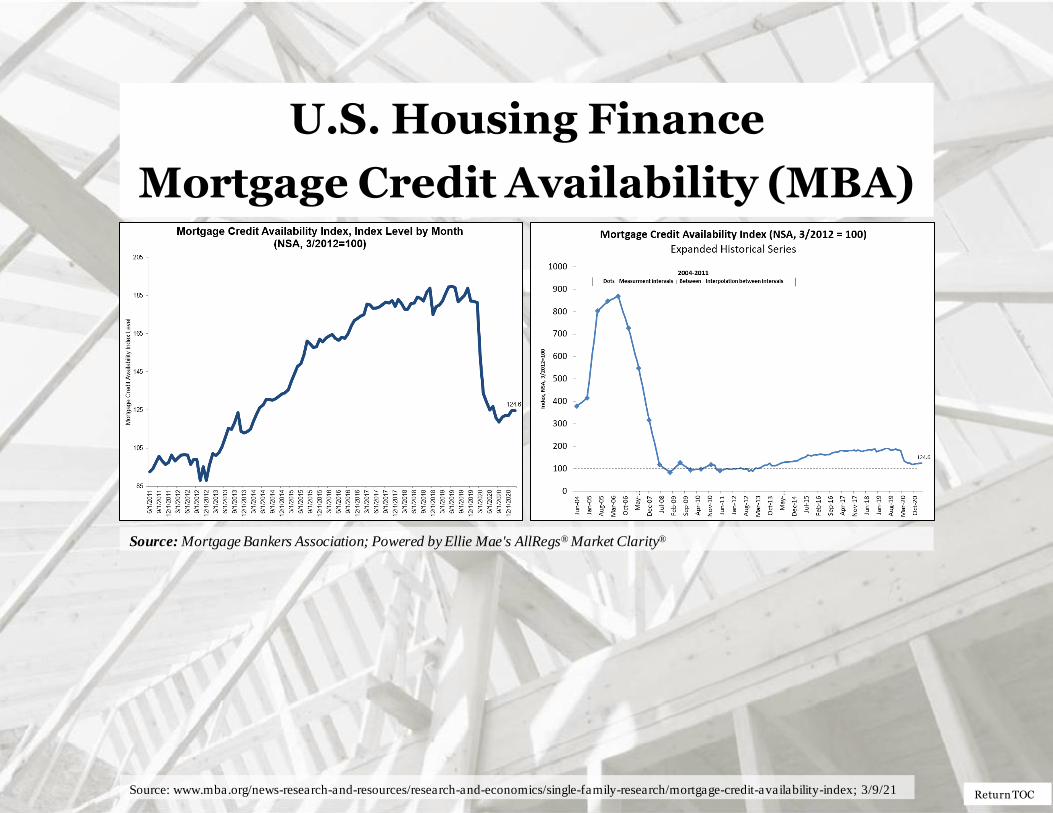
“Mortgage credit availability increased in January according to the Mortgage Credit
Availability Index (MCAI), a report from the Mortgage Bankers Association (MBA) that
analyzes data from Ellie Mae's AllRegs® Market Clarity® business information tool.
The MCAI remained unchanged at 124.6 in February. A decline in the MCAI indicates that
lending standards are tightening, while increases in the index are indicative of loosening
credit. The index was benchmarked to 100 in March 2012. The Conventional MCAI
decreased 0.3 percent, while the Government MCAI increased by 0.3 percent. Of the
component indices of the Conventional MCAI, the Jumbo MCAI increased by 0.2 percent,
and the Conforming MCAI fell by 0.7 percent.
Credit availability in February was unchanged from January, remaining close to its lowest
level since 2014. The housing market is in strong shape heading into the spring, with robust
growth in purchase applications, home sales, and new residential construction. Government
credit supply has increased in five of the past six months, albeit in small increments, but
remains tight by historical standards. This adds another obstacle for many aspiring first-
time buyers who are already navigating supply and affordability constraints. Expected home
sales growth this year is still likely to be driven by first-time buyers, spurred by millennials
reaching peak first-time homebuyer age. Many of these potential buyers will likely utilize
FHA and other low down payment loans to purchase a home.” – Joel Kan, Associate Vice
President of Economic and Industry Forecasting, MBA
Source: www.mba.org/news-research-and-resources/research-and-economics/single-family-research/mortgage-credit-availability-index; 3/9/21
Return TOC
U.S. Housing Finance
Mortgage Credit Availability (MBA)
Source: Mortgage Bankers Association; Powered by Ellie Mae's AllRegs® Market Clarity®
Source: www.mba.org/news-research-and-resources/research-and-economics/single-family-research/mortgage-credit-availability-index; 3/9/21

Return TOC
U.S. Housing Finance
The Federal Reserve Bank of New York
Mortgage Rates Decline and (Prime) Households Take Advantage
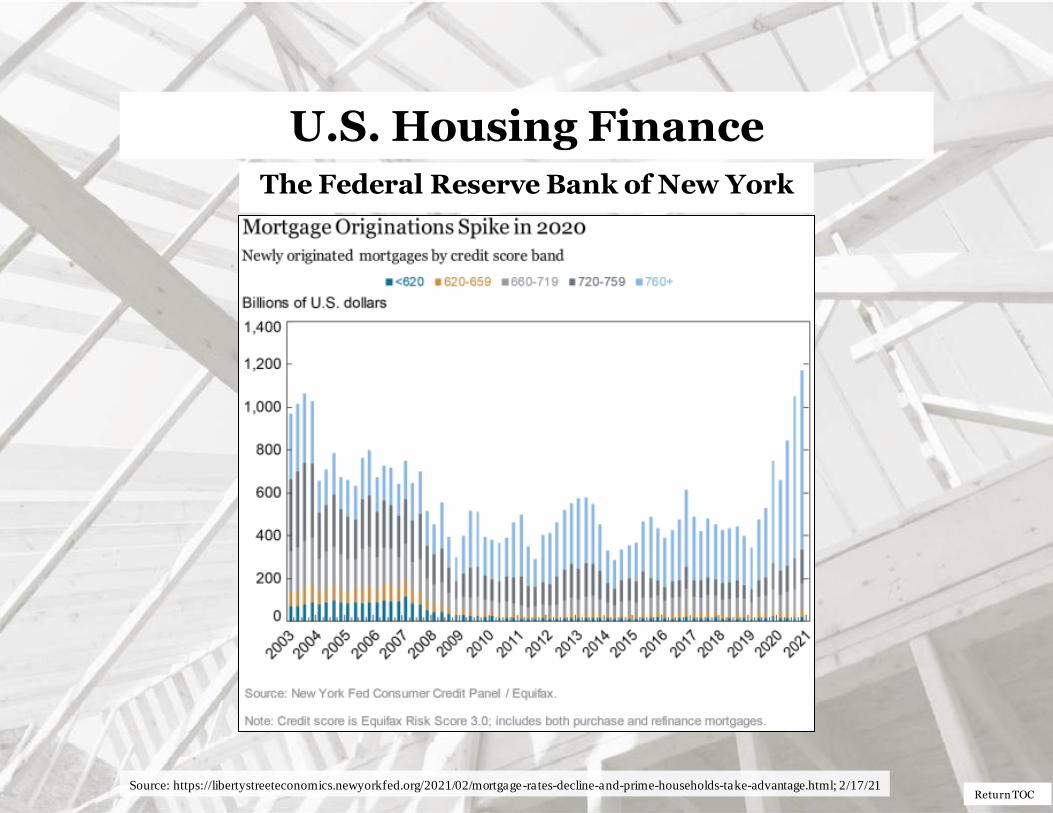
“… One shift in 2020 was a larger bump up in mortgage balances. Mortgage balances grew by
$182 billion, the biggest quarterly uptick since 2007, boosted by historically high volumes of
originations. Here, we take a close look at the composition of mortgage originations, which neared
$1.2 trillion in the fourth quarter of 2020, the highest single-quarter volume seen since our series
begins in 2000. The Quarterly Report on Household Debt and Credit and this analysis are based
on the New York Fed’s Consumer Credit Panel, which is itself based on anonymized Equifax credit
data.
… Here, the boom in originations is starkly visible – originations to the highest credit score
borrowers rose sharply during 2020. (We use the Equifax Risk Score 3.0). The origination volume
in the fourth quarter of 2020 just surpassed the previous high, from 2003, when a dip in mortgage
interest rates prompted a boom in mortgage refinancing. Although these two bumps in mortgage
originations are similar in magnitude, the composition is quite different; 71 percent of originations
in the fourth quarter of 2020 went to borrowers with credit scores over 760, while in the third
quarter of 2003, only 31 percent of those new mortgages went to the most creditworthy borrowers.
Researchers have concluded that the 2003 refi boom had long-running consequences, contributing
to over-leveraged balance sheets as home prices fell.” – Andrew F. Haughwout, Donghoon Lee,
Joelle Scally, and Wilbert van der Klaauw; Federal Reserve Bank of New York
Source: https://libertystreeteconomics.newyorkfed.org/2021/02/mortgage-rates-decline-and-prime-households-take-advantage.html; 2/17/21
Return TOC
U.S. Housing Finance
The Federal Reserve Bank of New York
Source: https://libertystreeteconomics.newyorkfed.org/2021/02/mortgage-rates-decline-and-prime-households-take-advantage.html; 2/17/21
Return TOC
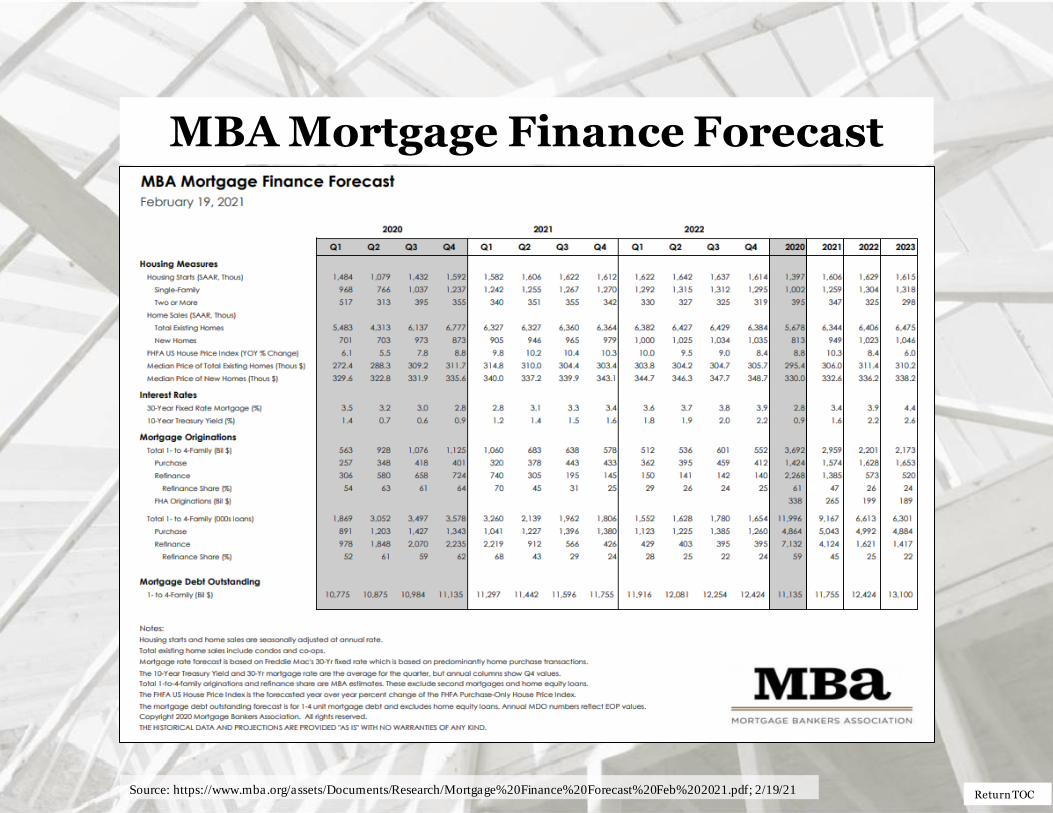
MBA Mortgage Finance Forecast
Source: https://www.mba.org/assets/Documents/Research/Mortgage%20Finance%20Forecast%20Feb%202021.pdf; 2/19/21
Return TOC
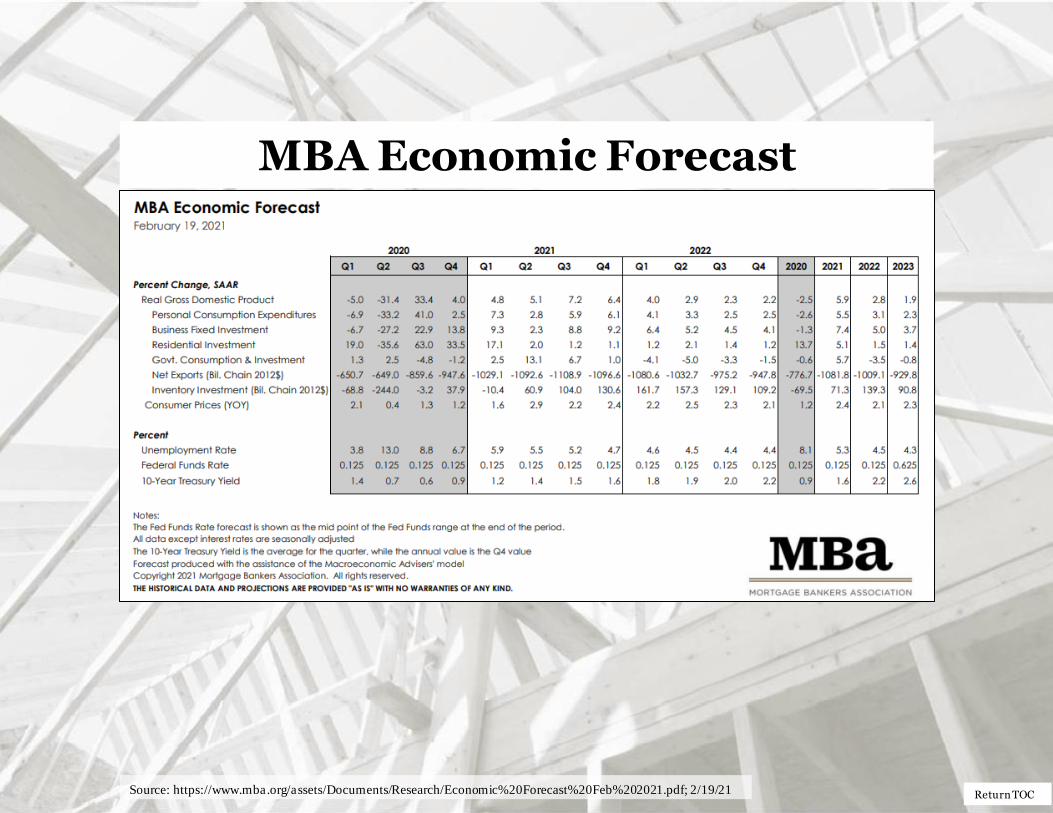
MBA Economic Forecast
Source: https://www.mba.org/assets/Documents/Research/Economic%20Forecast%20Feb%202021.pdf; 2/19/21

Return TOC
U.S. Housing Market
The first 3D-Printed Home for Sale
“$299,9993 bd-2 ba-1,407 sq ft; 34 Millbrook Ln, Riverhead, NY 11901; New construction
Zestimate®: $301,458; Est. payment: $1,812/mo (https://www.zillow.com/homes/34-Millbrook-Ln-
Riverhead,-NY,-11901_rb/2075583035_zpid/)
“A few years ago we shared a story about a prototype house that was being built by a mobile 3D
printer, now fast forward to a new report from CNBC’s Diana Olick about the first ever 3D-printed
homes for sale here in the U.S. Olick says with builders up against skyrocketing lumber costs as
well as a labor shortage, these homes could help alleviate the ongoing housing shortage. Indeed…
by the way, this Long Island, NY property has been listed on Zillow for $299k.” – Brad Beckett,
Real Estate Investing Today
Source: https://realestateinvestingtoday.com/the-first-3d-printed-home-for-sale/; 3/8/21
Return TOC
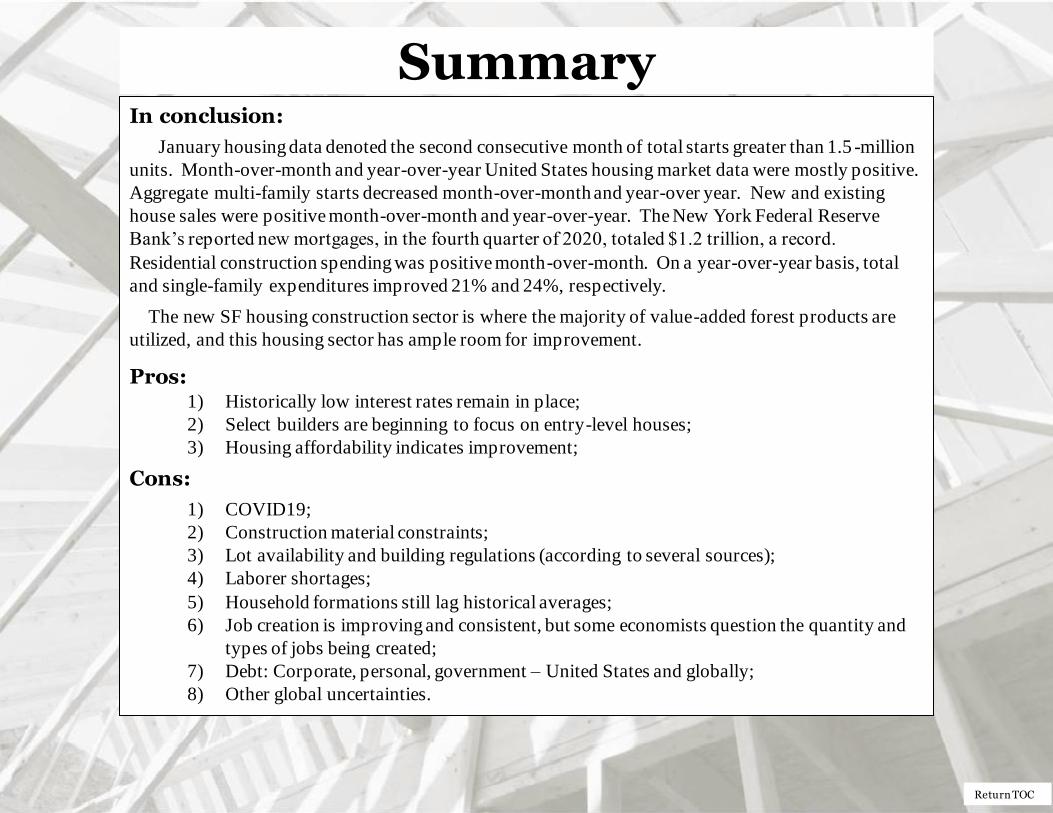
Summary In conclusion:
January housing data denoted the second consecutive month of total starts greater than 1.5 -million
units. Month-over-month and year-over-year United States housing market data were mostly positive.
Aggregate multi-family starts decreased month-over-month and year-over year. New and existing
house sales were positive month-over-month and year-over-year. The New York Federal Reserve
Bank’s reported new mortgages, in the fourth quarter of 2020, totaled $1.2 trillion, a record.
Residential construction spending was positive month-over-month. On a year-over-year basis, total
and single-family expenditures improved 21% and 24%, respectively.
The new SF housing construction sector is where the majority of value-added forest products are
utilized, and this housing sector has ample room for improvement.
Pros: 1) Historically low interest rates remain in place;
2) Select builders are beginning to focus on entry-level houses;
3) Housing affordability indicates improvement;
Cons:
1) COVID19;
2) Construction material constraints;
3) Lot availability and building regulations (according to several sources);
4) Laborer shortages;
5) Household formations still lag historical averages;
6) Job creation is improving and consistent, but some economists question the quantity and
types of jobs being created;
7) Debt: Corporate, personal, government – United States and globally;
8) Other global uncertainties.

Return TOC
Virginia Tech Disclaimer
Disclaimer of Non-endorsement
Reference herein to any specific commercial products, process, or service by trade name, trademark, manufacturer, or
otherwise, does not constitute or imply its endorsement, recommendation, or favoring by Virginia Tech. The views and
opinions of authors expressed herein do not necessarily state or reflect those of Virginia Tech, and shall not be used for
advertising or product endorsement purposes.
Disclaimer of Liability
With respect to documents sent out or made available from this server, neither Virginia Tech nor any of its employees,
makes any warranty, expressed or implied, including the warranties of merchantability and fitness for a particular
purpose, or assumes any legal liability or responsibility for the accuracy, completeness, or usefulness of any information,
apparatus, product, or process disclosed, or represents that its use would not infringe privately owned rights.
Disclaimer for External Links
The appearance of external hyperlinks does not constitute endorsement by Virginia Tech of the linked web sites, or the
information, products or services contained therein. Unless otherwise specified, Virginia Tech does not exercise any
editorial control over the information you January find at these locations. All links are provided with the intent of
meeting the mission of Virginia Tech’s web site. Please let us know about existing external links you believe are
inappropriate and about specific additional external links you believe ought to be included.
Nondiscrimination Notice
Virginia Tech prohibits discrimination in all its programs and activities on the basis of race, color, national origin, age,
disability, and where applicable, sex, marital status, familial status, parental status, religion, sexual orientation, genetic
information, political beliefs, reprisal, or because all or a part of an individual's income is derived from any public
assistance program. Persons with disabilities who require alternative means for communication of program information
(Braille, large print, audiotape, etc.) should contact the author. Virginia Tech is an equal opportunity provider and
employer.
Return TOC
U.S. Department of Agriculture Disclaimer
Disclaimer of Non-endorsement
Reference herein to any specific commercial products, process, or service by trade name, trademark, manufacturer, or
otherwise, does not necessarily constitute or imply its endorsement, recommendation, or favoring by the United States
Government. The views and opinions of authors expressed herein do not necessarily state or reflect those of the United States
Government, and shall not be used for advertising or product endorsement purposes.
Disclaimer of Liability
With respect to documents available from this server, neither the United States Government nor any of its employees, makes
any warranty, express or implied, including the warranties of merchantability and fitness for a particular purpose, or assumes
any legal liability or responsibility for the accuracy, completeness, or usefulness of any information, apparatus, product, or
process disclosed, or represents that its use would not infringe privately owned rights.
Disclaimer for External Links
The appearance of external hyperlinks does not constitute endorsement by the U.S. Department of Agriculture of the linked
web sites, or the information, products or services contained therein. Unless otherwise specified, the Department does not
exercise any editorial control over the information you January find at these locations. All links are provided with the intent
of meeting the mission of the Department and the Forest Service web site. Please let us know about existing external links
you believe are inappropriate and about specific additional external links you believe ought to be included.
Nondiscrimination Notice
The U.S. Department of Agriculture (USDA) prohibits discrimination in all its programs and activities on the basis of race,
color, national origin, age, disability, and where applicable, sex, marital status, familial status, parental status, religion, sexual
orientation, genetic information, political beliefs, reprisal, or because all or a part of an individual's income is derived from
any public assistance program. (Not all prohibited bases apply to all programs.) Persons with disabilities who require
alternative means for communication of program information (Braille, large print, audiotape, etc.) should contact USDA's
TARGET Center at 202.720.2600 (voice and TDD). To file a complaint of discrimination write to USDA, Director, Office of
Civil Rights, 1400 Independence Avenue, S.W., Washington, D.C. 20250-9410 or call 800.795.3272 (voice) or 202.720.6382
(TDD). The USDA is an equal opportunity provider and employer.