Embed Size (px)
Citation preview
THE WELFAREMONITORING SURVEY2017
THE WELFARE MONITORING SURVEY 2017Summary
2018
© United Nations Children’s Fund (UNICEF)June, [email protected]://data.unicef.ge
A summary of the results of the Welfare Monitoring Survey was prepared by the Analysis and Consulting Team (ACT) in partnership with UNICEF The findings, interpretations and conclusions expressed in this paper are those of the author and do not necessarily reflect the policies or views of UNICEF.
Cover photo: Vakhtang Khetaguri
4 THE WELFARE MONITORING SURVEY 2017
INTRODUCTIONThis report presents a summary of the results of the Welfare Monitoring Survey (WMS) conducted from July to August 2017. The WMS 2017 is the fifth report in a series that commenced in 2009. It is part of a concerted effort by the United Nations Children’s Fund (UNICEF) to provide relevant information for monitoring the welfare status of the children and their families in Georgia. WMS is a biennial longitudinal survey covering all government-controlled regions of the country. The results for the fifth round are nationally representative, with 4,697 households having completed the questionnaire. The aim of the study is three-fold: first, to review recent socio-economic trends in Georgia; second, to assess the dynamics of key welfare indicators and compare the findings with the results of earlier rounds of the WMS; and finally, to capture the effects of Georgia’s Targeted Social Assistance (TSA) reform and provide policy-makers detailed information on developments that have taken place since the introduction of the new methodology and benefit scheme.
Based on the data obtained from the fifth round of the survey, the present study examines the prevalence and distribution of issues such as consumption poverty, material deprivation, subjective poverty and social exclusion, and makes a particular reference to the role of social transfers and the well-being of children.
5 THE WELFARE MONITORING SURVEY 2017
SOCIO-ECONOMIC ANALYSIS
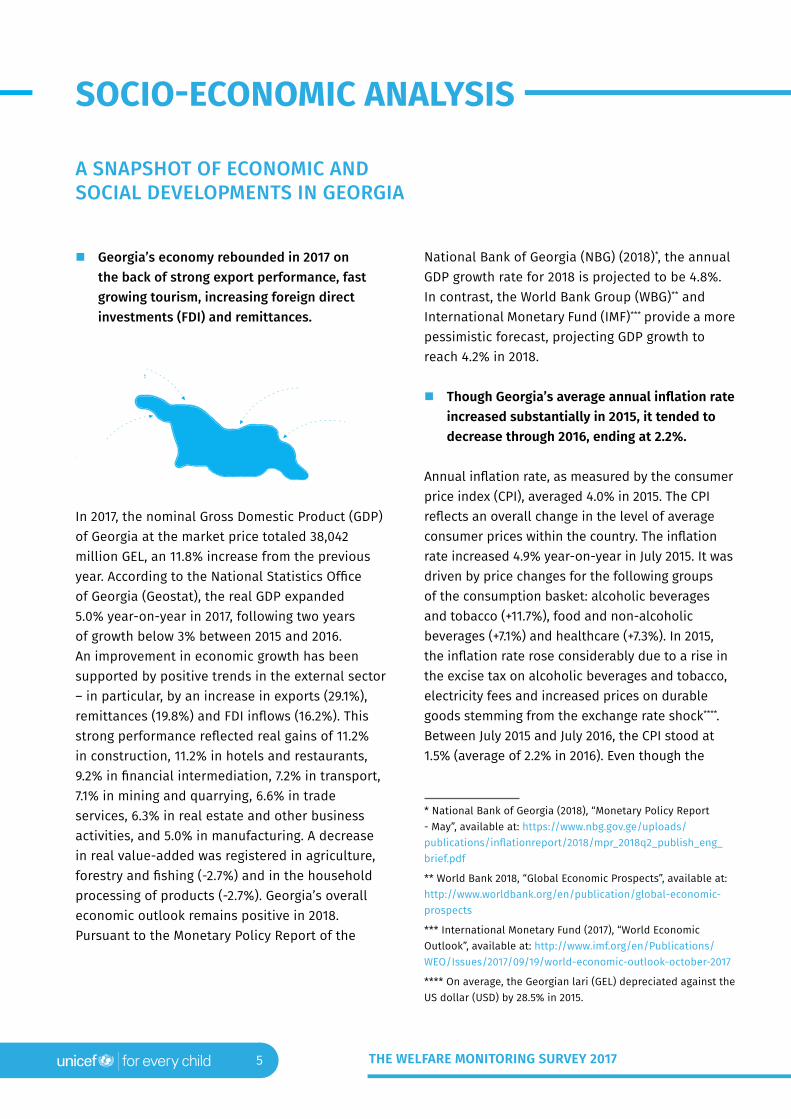
� Georgia’s economy rebounded in 2017 on the back of strong export performance, fast growing tourism, increasing foreign direct investments (FDI) and remittances.
In 2017, the nominal Gross Domestic Product (GDP) of Georgia at the market price totaled 38,042 million GEL, an 11.8% increase from the previous year. According to the National Statistics Office of Georgia (Geostat), the real GDP expanded 5.0% year-on-year in 2017, following two years of growth below 3% between 2015 and 2016. An improvement in economic growth has been supported by positive trends in the external sector – in particular, by an increase in exports (29.1%), remittances (19.8%) and FDI inflows (16.2%). This strong performance reflected real gains of 11.2% in construction, 11.2% in hotels and restaurants, 9.2% in financial intermediation, 7.2% in transport, 7.1% in mining and quarrying, 6.6% in trade services, 6.3% in real estate and other business activities, and 5.0% in manufacturing. A decrease in real value-added was registered in agriculture, forestry and fishing (-2.7%) and in the household processing of products (-2.7%). Georgia’s overall economic outlook remains positive in 2018.Pursuant to the Monetary Policy Report of the
National Bank of Georgia (NBG) (2018)*, the annual GDP growth rate for 2018 is projected to be 4.8%. In contrast, the World Bank Group (WBG)** and International Monetary Fund (IMF)*** provide a more pessimistic forecast, projecting GDP growth to reach 4.2% in 2018.
� Though Georgia’s average annual inflation rate increased substantially in 2015, it tended to decrease through 2016, ending at 2.2%.
Annual inflation rate, as measured by the consumer price index (CPI), averaged 4.0% in 2015. The CPI reflects an overall change in the level of average consumer prices within the country. The inflation rate increased 4.9% year-on-year in July 2015. It was driven by price changes for the following groups of the consumption basket: alcoholic beverages and tobacco (+11.7%), food and non-alcoholic beverages (+7.1%) and healthcare (+7.3%). In 2015, the inflation rate rose considerably due to a rise in the excise tax on alcoholic beverages and tobacco, electricity fees and increased prices on durable goods stemming from the exchange rate shock****. Between July 2015 and July 2016, the CPI stood at 1.5% (average of 2.2% in 2016). Even though the
* National Bank of Georgia (2018), “Monetary Policy Report - May”, available at: https://www.nbg.gov.ge/uploads/publications/inflationreport/2018/mpr_2018q2_publish_eng_brief.pdf
** World Bank 2018, “Global Economic Prospects”, available at: http://www.worldbank.org/en/publication/global-economic-prospects
*** International Monetary Fund (2017), “World Economic Outlook”, available at: http://www.imf.org/en/Publications/WEO/Issues/2017/09/19/world-economic-outlook-october-2017
**** On average, the Georgian lari (GEL) depreciated against the US dollar (USD) by 28.5% in 2015.
A SNAPSHOT OF ECONOMIC AND SOCIAL DEVELOPMENTS IN GEORGIA
6 THE WELFARE MONITORING SURVEY 2017
annual inflation rate slowed, a more detailed examination of individual goods illustrates that the annual change in prices for goods falling into the “alcoholic beverages and tobacco” category reached 13.1%, with prices increasing for both tobacco (+20.5%) and alcoholic beverages (+7.1%). The prices of food and non-alcoholic beverages increased by a mere 1.1%. At the same time, the inflation rate for water, electricity, gas and other fuels rose to 9.2%. It should be noted that, electricity tariffs rose by 27.5% in July 2016, when compared to the same period the previous year. The health group registered an inflation rate of 4.1%, led by an 8.7% increase in outpatient services.
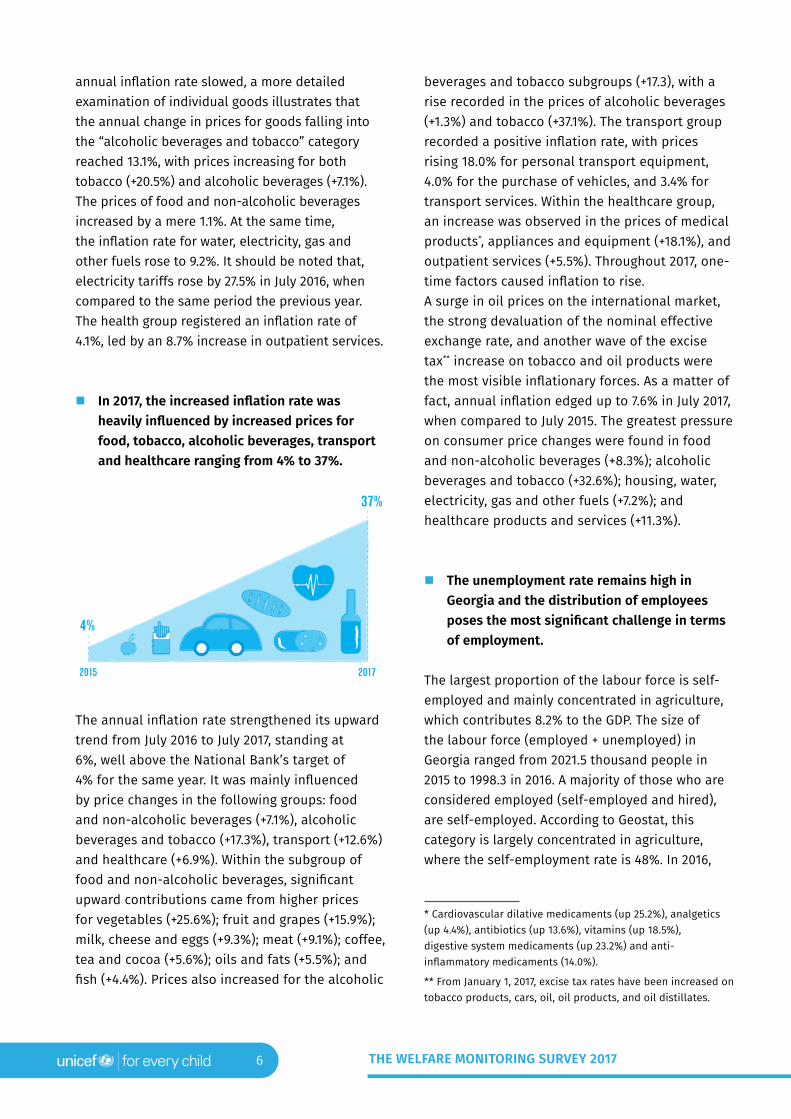
� In 2017, the increased inflation rate was heavily influenced by increased prices for food, tobacco, alcoholic beverages, transport and healthcare ranging from 4% to 37%.
The annual inflation rate strengthened its upward trend from July 2016 to July 2017, standing at 6%, well above the National Bank’s target of 4% for the same year. It was mainly influenced by price changes in the following groups: food and non-alcoholic beverages (+7.1%), alcoholic beverages and tobacco (+17.3%), transport (+12.6%) and healthcare (+6.9%). Within the subgroup of food and non-alcoholic beverages, significant upward contributions came from higher prices for vegetables (+25.6%); fruit and grapes (+15.9%); milk, cheese and eggs (+9.3%); meat (+9.1%); coffee, tea and cocoa (+5.6%); oils and fats (+5.5%); and fish (+4.4%). Prices also increased for the alcoholic
beverages and tobacco subgroups (+17.3), with a rise recorded in the prices of alcoholic beverages (+1.3%) and tobacco (+37.1%). The transport group recorded a positive inflation rate, with prices rising 18.0% for personal transport equipment, 4.0% for the purchase of vehicles, and 3.4% for transport services. Within the healthcare group, an increase was observed in the prices of medical products*, appliances and equipment (+18.1%), and outpatient services (+5.5%). Throughout 2017, one-time factors caused inflation to rise. A surge in oil prices on the international market, the strong devaluation of the nominal effective exchange rate, and another wave of the excise tax** increase on tobacco and oil products were the most visible inflationary forces. As a matter of fact, annual inflation edged up to 7.6% in July 2017, when compared to July 2015. The greatest pressure on consumer price changes were found in food and non-alcoholic beverages (+8.3%); alcoholic beverages and tobacco (+32.6%); housing, water, electricity, gas and other fuels (+7.2%); and healthcare products and services (+11.3%).
� The unemployment rate remains high in Georgia and the distribution of employees poses the most significant challenge in terms of employment.
The largest proportion of the labour force is self-employed and mainly concentrated in agriculture, which contributes 8.2% to the GDP. The size of the labour force (employed + unemployed) in Georgia ranged from 2021.5 thousand people in 2015 to 1998.3 in 2016. A majority of those who are considered employed (self-employed and hired), are self-employed. According to Geostat, this category is largely concentrated in agriculture, where the self-employment rate is 48%. In 2016,
* Cardiovascular dilative medicaments (up 25.2%), analgetics (up 4.4%), antibiotics (up 13.6%), vitamins (up 18.5%), digestive system medicaments (up 23.2%) and anti-inflammatory medicaments (14.0%).
** From January 1, 2017, excise tax rates have been increased on tobacco products, cars, oil, oil products, and oil distillates.
2015 2017
4%
37%
7 THE WELFARE MONITORING SURVEY 2017
the share of self-employed and hired employees equaled 57.3% and 42.3%, respectively. The number of hired employees declined by 1.1%, and the number of self-employed by 0.7% in 2016, when compared to the previous year. Interestingly enough, both the unemployment rate and the employment rate dropped by 0.2 percentage points (unemployment rate in 2016 - 11.8% and in 2015 - 12%; employment rate in 2016 - 59.5% and in 2015 - 59.7%). During the same period, the number of unemployed people decreased by 6.5 thousand. In 2016, the urban unemployment rate was significantly higher than the rural unemployment rate (21.1% vs. 5.0%), mainly because of employment in agriculture.
� A high level of youth unemployment remains the most important problem of the unemployment structure in Georgia.
The unemployment rate by age group shows that in 2016, young people aged 15-19 and 20-24 continued to be the most disadvantaged. The unemployment rate reached the highest level for the age group of 15-19 (31.9%), which is 5.7 percentage points higher than the previous year.
The 20-24 age group also had a high indicator, at 30.0%. Meanwhile, the average Georgian earned 940 GEL per month in 2016, up from 900 GEL in 2015. The annual growth rate of the average monthly real salary adjusted for 2010 prices stood
at 2.2% in 2016. In absolute terms, men benefitted from increased salaries more than women. Men’s average nominal salary increased from 1074.3 GEL in 2015 to 1116.6 GEL in 2016. On the contrary, women’s average nominal salary increased from 692.5 GEL in 2015 to 731.2 GEL in 2016.
� Government spending on healthcare and social protection decreased from 2016 to 2017.
The state budget of Georgia increased by 6.4% and 10.0% in nominal terms in 2016 and 2017, respectively. The share of education expenditures out of the total budget grew by 0.4 percentage points from 2016 to 2017. On the other hand, the share of healthcare expenditures decreased by 0.6 percentage points from 2016 to 2017, and the share of social protection spending dropped by 1 percentage point. Aggregate government spending is projected to be 11.4 billion GEL in 2018, a 9.7% increase compared to the last year. In 2018, the share of education expenditures from the total budget will decrease by 0.4 percentage points. The share of healthcare expenditures is also expected to fall by 0.7 percentage points and social protection spending by 1.0 percentage point.
� Pensions, Targeted Social Assistance (TSA) coupled with the Child Benefit Programme (CBP) and Categorical Benefits are the main social security in Georgia.
It is noteworthy that the, social protection expenditure is the largest spending item in the state budget, accounting for 24.6% of the central public expenditure, (6.7% of GDP) in 2017. Social pensions constituted approximately 62% of social security spending. The pension scheme in Georgia is the largest social assistance programme, costing 4.2% of GDP in 2017. It provides a flat rate benefit to all pensioners – men over 65 and women over 60. In September 2017, 729,162 pensioners received this benefit, totaling 132,268,484 GEL*. In contrast,
* Social Service Agency, 2017
8 THE WELFARE MONITORING SURVEY 2017
Targeted Social Assistance (TSA) is the second largest cash-assistance programme of Georgia’s social security system. It aims to improve the socio-economic conditions of families, experiencing financial and material hardship. At the end of 2013, the government of Georgia (GoG) started a technical review of the TSA. As a result, new legislation was passed that modified the targeting formula and benefit scheme of the TSA alongside a new target programme: the Child Benefit Programme (CPB). Implementation of the new programme started in June 2015*, and compensation measures were adopted in August 2015. The size of the TSA benefit ranges from 30 GEL to 60 GEL depending on vulnerability scores. In addition, each household receives a 10 GEL child benefit (CB) for children under the age of 16. As of September 2017, 324,177 households comprised of 977,055 people were registered in the unified database for socially vulnerable families**. During this time, 132,051 families (12.4% of all households), corresponding to a total of 459,699 people who received a monthly cash benefit. The monthly budget for the TSA programme was 21,128,468 GEL. Categorical benefits are another type of social security assistance in Georgia. These benefits include a social package, family assistance, utilities, and IDP benefits. The categorical benefit is received by survivors, people with a first-degree disability, and war veterans or victims of political repression. In addition, most municipalities also provide cash and in-kind benefits, however their coverage and value are quite low.
With this context in mind, the results of the Welfare Monitoring Survey (WMS) 2017 are further analyzed in the next sections and sub-sections.
* World Bank 2016, “Continuous Improvement: Strengthening Georgia’s Targeted Social Assistance Program”, available at: https://openknowledge.worldbank.org/handle/10986/24812
** Social Service Agency, 2017
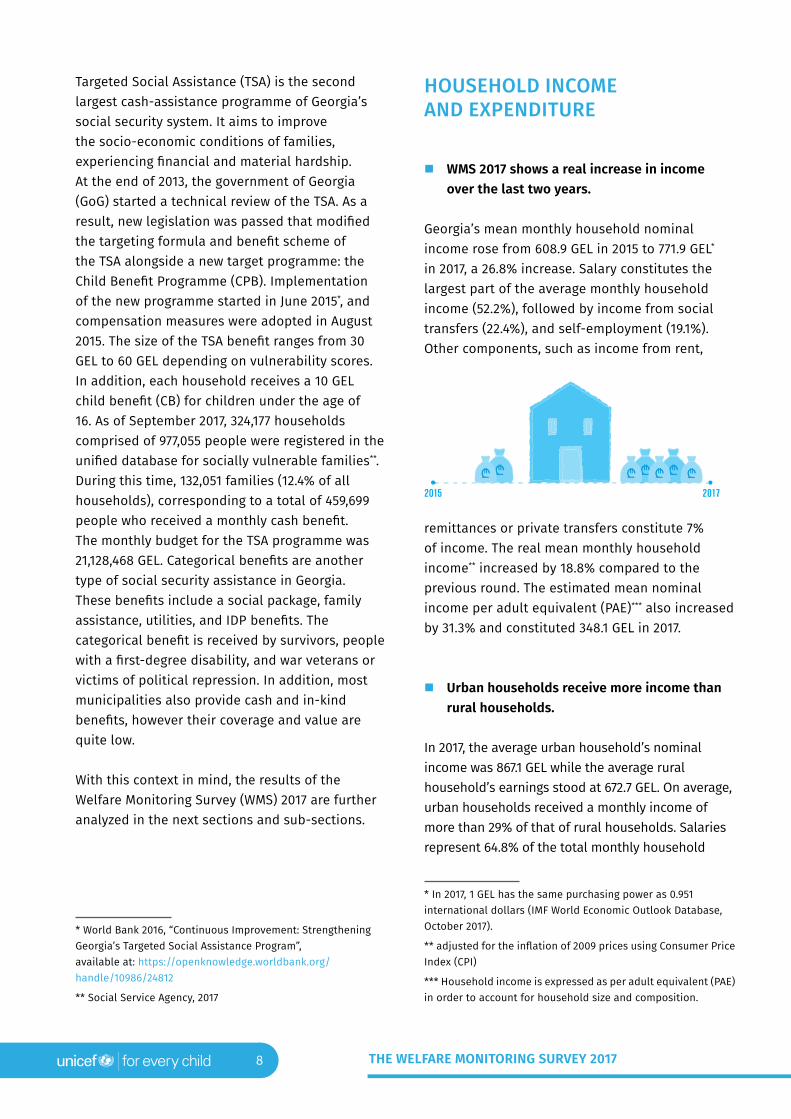
� WMS 2017 shows a real increase in income over the last two years.
Georgia’s mean monthly household nominal income rose from 608.9 GEL in 2015 to 771.9 GEL* in 2017, a 26.8% increase. Salary constitutes the largest part of the average monthly household income (52.2%), followed by income from social transfers (22.4%), and self-employment (19.1%). Other components, such as income from rent,
remittances or private transfers constitute 7% of income. The real mean monthly household income** increased by 18.8% compared to the previous round. The estimated mean nominal income per adult equivalent (PAE)*** also increased by 31.3% and constituted 348.1 GEL in 2017.
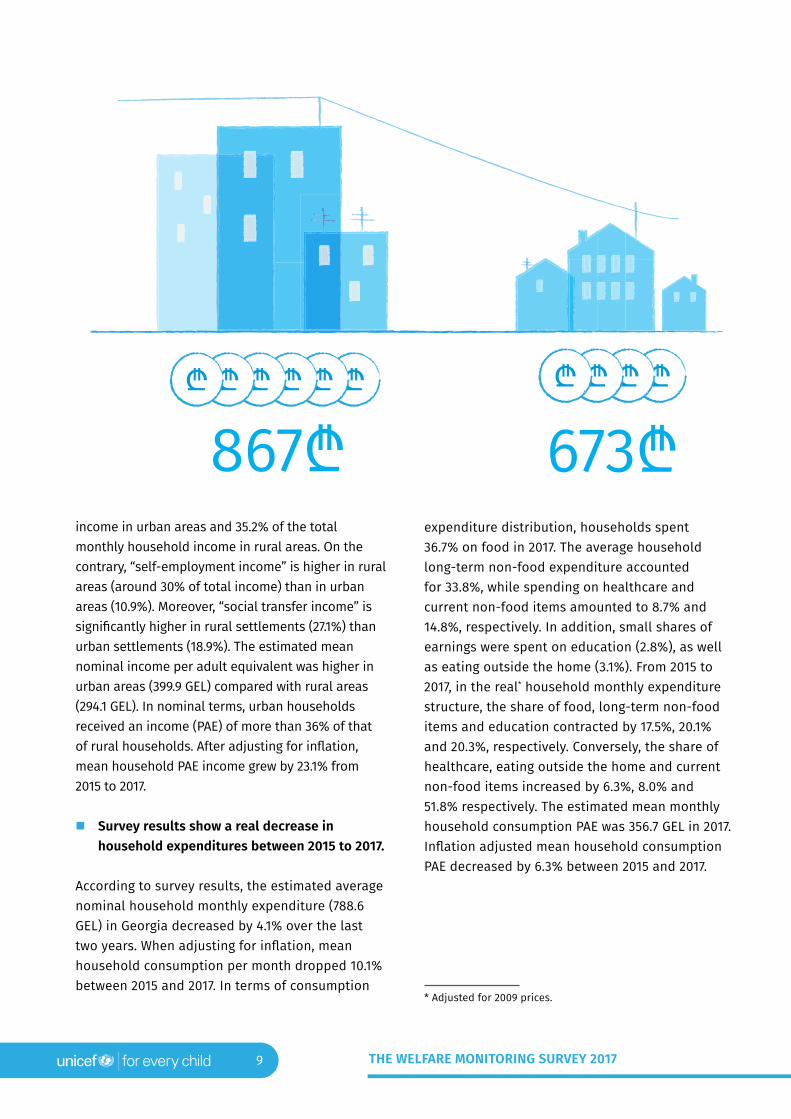
� Urban households receive more income than rural households.
In 2017, the average urban household’s nominal income was 867.1 GEL while the average rural household’s earnings stood at 672.7 GEL. On average, urban households received a monthly income of more than 29% of that of rural households. Salaries represent 64.8% of the total monthly household
* In 2017, 1 GEL has the same purchasing power as 0.951 international dollars (IMF World Economic Outlook Database, October 2017).
** adjusted for the inflation of 2009 prices using Consumer Price Index (CPI)
*** Household income is expressed as per adult equivalent (PAE) in order to account for household size and composition.
HOUSEHOLD INCOME AND EXPENDITURE
2015 2017
ii ii ii i
9 THE WELFARE MONITORING SURVEY 2017
income in urban areas and 35.2% of the total monthly household income in rural areas. On the contrary, “self-employment income” is higher in rural areas (around 30% of total income) than in urban areas (10.9%). Moreover, “social transfer income” is significantly higher in rural settlements (27.1%) than urban settlements (18.9%). The estimated mean nominal income per adult equivalent was higher in urban areas (399.9 GEL) compared with rural areas (294.1 GEL). In nominal terms, urban households received an income (PAE) of more than 36% of that of rural households. After adjusting for inflation, mean household PAE income grew by 23.1% from 2015 to 2017.
� Survey results show a real decrease in household expenditures between 2015 to 2017.
According to survey results, the estimated average nominal household monthly expenditure (788.6 GEL) in Georgia decreased by 4.1% over the last two years. When adjusting for inflation, mean household consumption per month dropped 10.1% between 2015 and 2017. In terms of consumption
expenditure distribution, households spent 36.7% on food in 2017. The average household long-term non-food expenditure accounted for 33.8%, while spending on healthcare and current non-food items amounted to 8.7% and 14.8%, respectively. In addition, small shares of earnings were spent on education (2.8%), as well as eating outside the home (3.1%). From 2015 to 2017, in the real* household monthly expenditure structure, the share of food, long-term non-food items and education contracted by 17.5%, 20.1% and 20.3%, respectively. Conversely, the share of healthcare, eating outside the home and current non-food items increased by 6.3%, 8.0% and 51.8% respectively. The estimated mean monthly household consumption PAE was 356.7 GEL in 2017. Inflation adjusted mean household consumption PAE decreased by 6.3% between 2015 and 2017.
* Adjusted for 2009 prices.
10 THE WELFARE MONITORING SURVEY 2017
� On average, urban households spend more on long-term non-food items, eating outside the home and education, whereas rural households spent more on eating at home and healthcare.
In nominal terms, urban residents spent an average of 827.3 GEL in 2017, which was 10.6% more than the 748.2 GEL spent by rural residents in the same period. Food expenditures for the home represent 32.9% of the total monthly household consumption in urban areas and 41.2% in rural areas. Conversely, “eating outside the home” is higher in urban areas (3.7% of the total expenditure) than in rural areas (2.4%). In addition, “long-term non-food item” and “education” expenditures are significantly higher in urban settlements (36.3% and 3.7%) than rural settlements (30.9% and 1.8%). Spending on healthcare accounts for 8.5% of the total monthly expenditures in urban areas and 8.9% in rural areas. In 2017, the average monthly consumption PAE for urban households was 376.4 GEL compared to 336.3 GEL for rural households. Meanwhile, the real consumption expenditures PAE fell by 0.4% for rural households, and by 10.9% for urban households..
� In Georgia, income inequality decreased, while consumption inequality remained at the same level.
Inequality in income (PAE) has decreased in Georgia from 0.43 in 2015 to 0.42 in 2017. In urban areas, it went down from 0.42 to 0.41, whereas in rural areas it increased from 0.39 to 0.42. In Georgia, overall consumption inequality has not changed since 2015 (2015 - Gini coefficient = 0.36 vs. 2017 - Gini coefficient = 0.36). Nevertheless, inequality in consumption was greater in rural (Gini coefficient = 0.36) areas than in urban areas (Gini coefficient = 0.35).
11 THE WELFARE MONITORING SURVEY 2017
MONETARY DIMENSIONS OF POVERTY
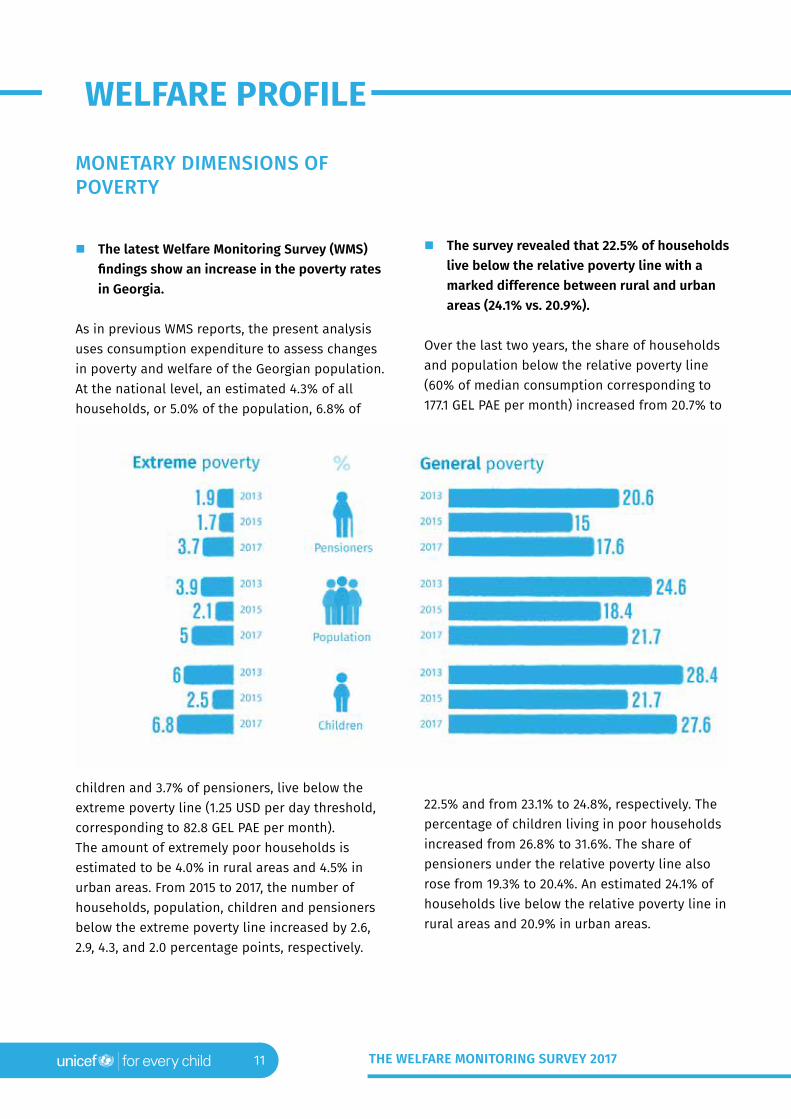
� The latest Welfare Monitoring Survey (WMS) findings show an increase in the poverty rates in Georgia.
As in previous WMS reports, the present analysis uses consumption expenditure to assess changes in poverty and welfare of the Georgian population. At the national level, an estimated 4.3% of all households, or 5.0% of the population, 6.8% of
children and 3.7% of pensioners, live below the extreme poverty line (1.25 USD per day threshold, corresponding to 82.8 GEL PAE per month). The amount of extremely poor households is estimated to be 4.0% in rural areas and 4.5% in urban areas. From 2015 to 2017, the number of households, population, children and pensioners below the extreme poverty line increased by 2.6, 2.9, 4.3, and 2.0 percentage points, respectively.
� The survey revealed that 22.5% of households live below the relative poverty line with a marked difference between rural and urban areas (24.1% vs. 20.9%).
Over the last two years, the share of households and population below the relative poverty line (60% of median consumption corresponding to 177.1 GEL PAE per month) increased from 20.7% to
22.5% and from 23.1% to 24.8%, respectively. The percentage of children living in poor households increased from 26.8% to 31.6%. The share of pensioners under the relative poverty line also rose from 19.3% to 20.4%. An estimated 24.1% of households live below the relative poverty line in rural areas and 20.9% in urban areas.
WELFARE PROFILE
12 THE WELFARE MONITORING SURVEY 2017
� In Georgia, the incidence of general poverty has increased from 16.4% of total households in 2015 to 19.6% in 2017; however, the country is still better off when compared to 2013.
Living below the general poverty threshold (2.5 USD per day, corresponding to 165.5 GEL PAE per month), are 19.6% of households, 21.7% of the population, 27.6% of children and 17.6% of pensioners. The percentage of households living below the general poverty line is estimated to be 20.8% in rural settlements and 18.4% in urban settlements. In 2017, compared to 2015, the number of households, population, children and pensioners below the general poverty line increased by 3.2, 3.3, 5.9 and 2.6 percentage points, respectively. While the recent increase in general poverty is unfortunate, the country is still better off than it was in 2013, when it was estimated that 21.8% of households, 24.6% of the population, 28.4% of children, and 20.6% of pensioners were living below the general poverty line.
� The key findings of this survey indicate that there has been a considerable increase in the share of children living below the subsistence minimum. Every fifth child lives in a household in which the basic needs of household members are not met.
Nationally, an estimated 15.8% of households, 17.5% of the population, 22.1% of children, and 13.9% pensioners live below the subsistence minimum (corresponding to 148.3 GEL PAE per month). Between 2015 and 2017, the number of households, population, children, and pensioners below the subsistence minimum increased by 3.9, 4.2, 6.5 and 3.5 percentage points, respectively.
� Poverty rates are higher in households with children.
In 2017, 33% of all households included at least one child. It should be noted that as the number of children in the household increases, poverty rates
measured on the relative and general thresholds are significantly higher. For instance, 27.2% and 24.1% of households with one or two children live in relative and general poverty, respectively. These figures rise significantly to almost 39.9% for households with three or more children under the relative poverty line, and to 33.4% for households below the general poverty line.
� Higher levels of education and regular paid work of a household member reduces the incidence of child poverty.
For every poverty threshold, the percentage of children living in poor households exceeded the poverty rate for the entire population, including pensioners. Lower poverty rates for households, the population, and children are associated with higher levels of education attained by adults in the household. Additionally, a household member who has regular paid work reduces both the general and relative child poverty incidence by more than twice.
� Low to moderate economic growth and higher consumer prices are likely reasons for increased poverty rates.
While poverty incidence has been declining over 2013-15, existing levels have increased in Georgia. It is assumed that the country’s macroeconomic performance influenced households’ and individuals’ vulnerability to poverty. The economic performance* of the country is commonly regarded as the main determinant of poverty. Georgia’s economy slumped between 2015 and 2016, when the real GDP expanded by less than 3%. Only recently has it returned to its moderate growth rate of around 5%. A high inflation rate, as measured by the Consumer Price Index (CPI),
* Iceland, J., Kenworthy, L., & Scopilliti, M. (2005), Macroeconomic performance and poverty in the 1980s and 1990s: A state level analysis. Discussion Paper, 1299-05. Madison, WI: Institute for Research on Poverty.
13 THE WELFARE MONITORING SURVEY 2017
reduced the impact of economic growth on poverty. Over the last two years, consumer prices significantly increased for food, tobacco, alcoholic beverages, healthcare, utilities, and transport, alongside the strong devaluation of the Georgian lari (GEL). Under this economic pressure, the household expenditure structure has changed. According to the WMS 2015, households tended to spend more with less income (average expenditure 821.8 GEL vs. average income 608.9 GEL). One can assume that such overspending was compensated by savings. In 2017, households began to spend less with substantially higher incomes (average expenditure 788.6 GEL vs. average income 771.9 GEL). Against the backdrop of high consumer prices and reduced purchasing power of the local currency, an increase in income did not translate into household prosperity. In general, household spending patterns reflect both the price of goods and the amount of the good that is consumed. As survey results demonstrate, household expenditures decreased on food, education and long-term non-food items alongside higher consumer prices. It is highly likely that households exhausted savings, had limited access to additional financial resources, and became more vulnerable. Moreover, it is a widespread fact that low-income households spent a higher share of their budgets on food. This means that since 2015, households with low income experienced relatively higher inflation compared to those with higher incomes. The last two years has seen the financial health of Georgian households weaken and more households and individuals slide into poverty.
NON-MONETARY DIMENSIONS OF POVERTY
Poverty is a multidimensional phenomenon. The above analysis of welfare in Georgia relied on consumption information to capture household living conditions and identify those who are poor. Since poverty is not merely about consumption deficits and has multidimensional nature, the present analysis also assesses well-being in Georgia based on the non-monetary dimensions of poverty.
� Material deprivation decreased for children, while housing deprivation reduced for households, the population, children, and pensioners.
Survey results indicate that 6.1% of households were materially deprived* in 2017. Material deprivation tends to affect pensioners (7.1%) more than children (2.4%) or the population as a whole (3.7%). Over the last two years, material deprivation has grown slightly across all groups except for children (down 0.4 percentage points). Housing deprivation** is significantly worse in rural settlements than urban settlements. From 2015 to 2017, the number of households, the population, children and pensioners living in housing deprivation decreased by 4.7, 4.3, 3.5 and 4.8 percentage points, respectively.
* A household is regarded as materially deprived if it lacks five or more of the following items: vacuum cleaner, car, washing machine, refrigerator, cell phone, iron and television.
** Households are deemed to be experiencing housing deprivation if they experience at least two major housing problems from the following list: leaking roof, damaged floors or walls, earth floor, dwelling is damp, broken windows, insufficient light, noise and dwelling is too small. Moreover, dwelling condition should be confirmed by the interviewer to be in bad or very bad condition.
14 THE WELFARE MONITORING SURVEY 2017
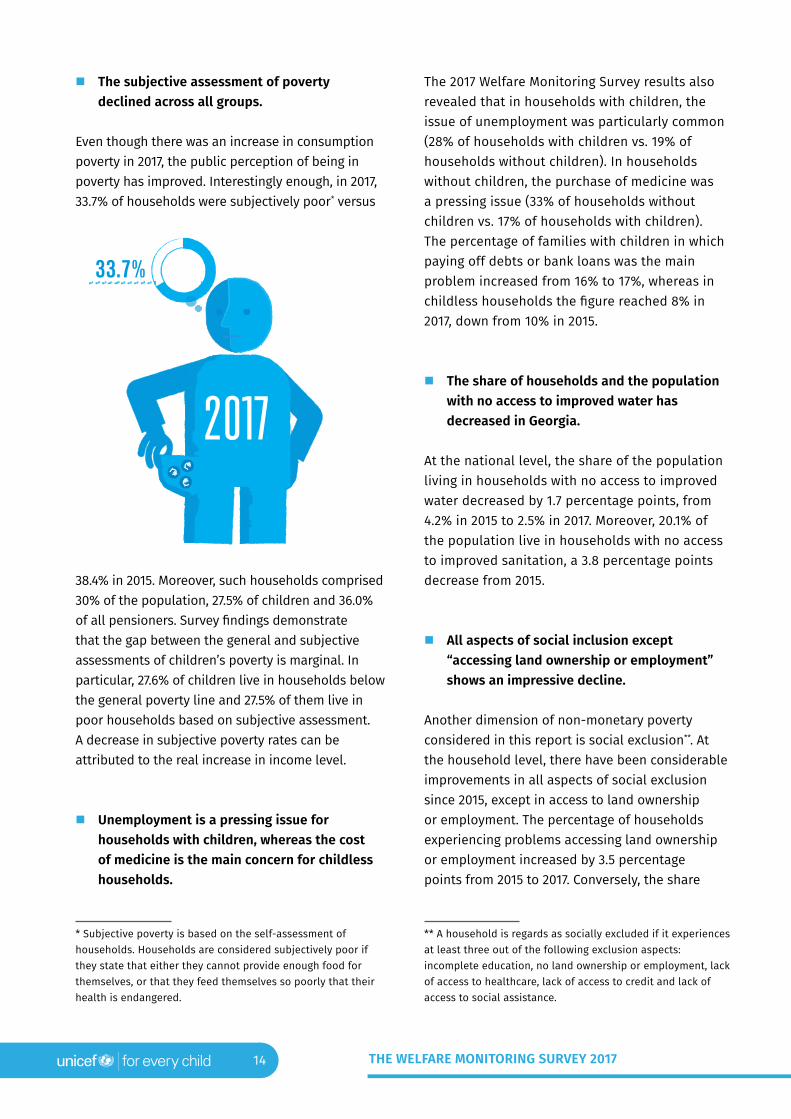
� The subjective assessment of poverty declined across all groups.
Even though there was an increase in consumption poverty in 2017, the public perception of being in poverty has improved. Interestingly enough, in 2017, 33.7% of households were subjectively poor* versus
38.4% in 2015. Moreover, such households comprised 30% of the population, 27.5% of children and 36.0% of all pensioners. Survey findings demonstrate that the gap between the general and subjective assessments of children’s poverty is marginal. In particular, 27.6% of children live in households below the general poverty line and 27.5% of them live in poor households based on subjective assessment. A decrease in subjective poverty rates can be attributed to the real increase in income level.
� Unemployment is a pressing issue for households with children, whereas the cost of medicine is the main concern for childless households.
* Subjective poverty is based on the self-assessment of households. Households are considered subjectively poor if they state that either they cannot provide enough food for themselves, or that they feed themselves so poorly that their health is endangered.
The 2017 Welfare Monitoring Survey results also revealed that in households with children, the issue of unemployment was particularly common (28% of households with children vs. 19% of households without children). In households without children, the purchase of medicine was a pressing issue (33% of households without children vs. 17% of households with children). The percentage of families with children in which paying off debts or bank loans was the main problem increased from 16% to 17%, whereas in childless households the figure reached 8% in 2017, down from 10% in 2015.
� The share of households and the population with no access to improved water has decreased in Georgia.
At the national level, the share of the population living in households with no access to improved water decreased by 1.7 percentage points, from 4.2% in 2015 to 2.5% in 2017. Moreover, 20.1% of the population live in households with no access to improved sanitation, a 3.8 percentage points decrease from 2015.
� All aspects of social inclusion except “accessing land ownership or employment” shows an impressive decline.
Another dimension of non-monetary poverty considered in this report is social exclusion**. At the household level, there have been considerable improvements in all aspects of social exclusion since 2015, except in access to land ownership or employment. The percentage of households experiencing problems accessing land ownership or employment increased by 3.5 percentage points from 2015 to 2017. Conversely, the share
** A household is regards as socially excluded if it experiences at least three out of the following exclusion aspects: incomplete education, no land ownership or employment, lack of access to healthcare, lack of access to credit and lack of access to social assistance.
33.7%
2017
15 THE WELFARE MONITORING SURVEY 2017
of households experiencing difficulties in access to healthcare decreased from 44.1% to 22.9%, and the share of households with limited access to education decreased from 15.3% to 8.2%. In addition, the share of households with a lack of access to credit declined from 5.0% to 3.6%, and the share of households with limited access to social assistance decreased from 11.9% to 9.5%. Overall, in 2017, 2.8% of households, including 2.6% of the total population, 2.9% of all children and 2.5% of all pensioners were socially excluded.
CHARACTERISTICS OF NEWLY-POOR HOUSEHOLDS
� At the general poverty threshold, significantly more panel households became newly poor than rose out of poverty from 2015 to 2017.
Households that participated in the WMS survey in 2015 and in 2017 are considered to be panel households. Survey results show that only 9.4% of all panel households rose out of general poverty over these two years, while 13.5% of all panel households became newly poor.
� Children remain the least dynamic group in terms of movement across consumption quintiles.
An estimated 44% of first quintile households in 2015 remained in the first quintile in 2017, whereas 11% and 3% of first quintile households moved to the fourth and fifth quintiles respectively, in 2017. When comparing the dynamics of households, the population, children and pensioners, poor children are the least dynamic group. Particularly, the highest share of children from the first quintile in 2015 remained in the first quintile in 2017 (56%).
� More than half of the families in general poverty are chronically poor.
Based on the panel data of the Welfare Monitoring Survey (WMS), chronic poverty has been assessed.
A household is defined as being chronically poor if it falls under the poverty threshold three or more times since the WMS 2011. Results indicate that an estimated 12.2% of households, 14.5% of the population, 18.2% of children, and 10.1% of pensioners are chronically poor and live below the general poverty line. Results suggest that policy instruments should be elaborated and integrated into development and social assistance programmes in order to more effectively support the chronically poor.
SOCIAL TRANSFERS
� According to the survey findings, 67.5% of all households received some form of social transfer in 2017.
The analysis of WMS 2017 focuses on three main classes of benefits: pensions, targeted social assistance (TSA) with child benefits (hereinafter referred as TSA+CB), and categorical benefits. An estimated 57.8% of households received pension. The number of families receiving TSA+CB stood at 10%, while categorical benefits were received by 11.7% in 2017.
IMPACT OF PENSIONS AND TSA+CB ON POVERTY
� Income from pensions constitutes more than 60% of consumption in single pensioner or pensioner only households.
More than half of all households (58.9%) in Georgia include at least one person of pension age. In households that include people of pension age, the average amount of the pension received was 234 GEL per month per household in 2017. In households with a single pensioner, the average total pension received constituted 61.3% of the mean consumption (up 10.1 percentage points from 2015), and in households with more than one pensioner, it constituted 68.7% (up 11.7 percentage
16 THE WELFARE MONITORING SURVEY 2017
points from 2015). If pension income was removed from household consumption, extreme poverty among pensioners would have risen sharply from 3.7% to 34.1% and among children from 6.8% to 13.1%. The survey results suggest that pensions have the highest impact on pensioners. In 2017, the government spent 1.6 billion GEL on pensions.
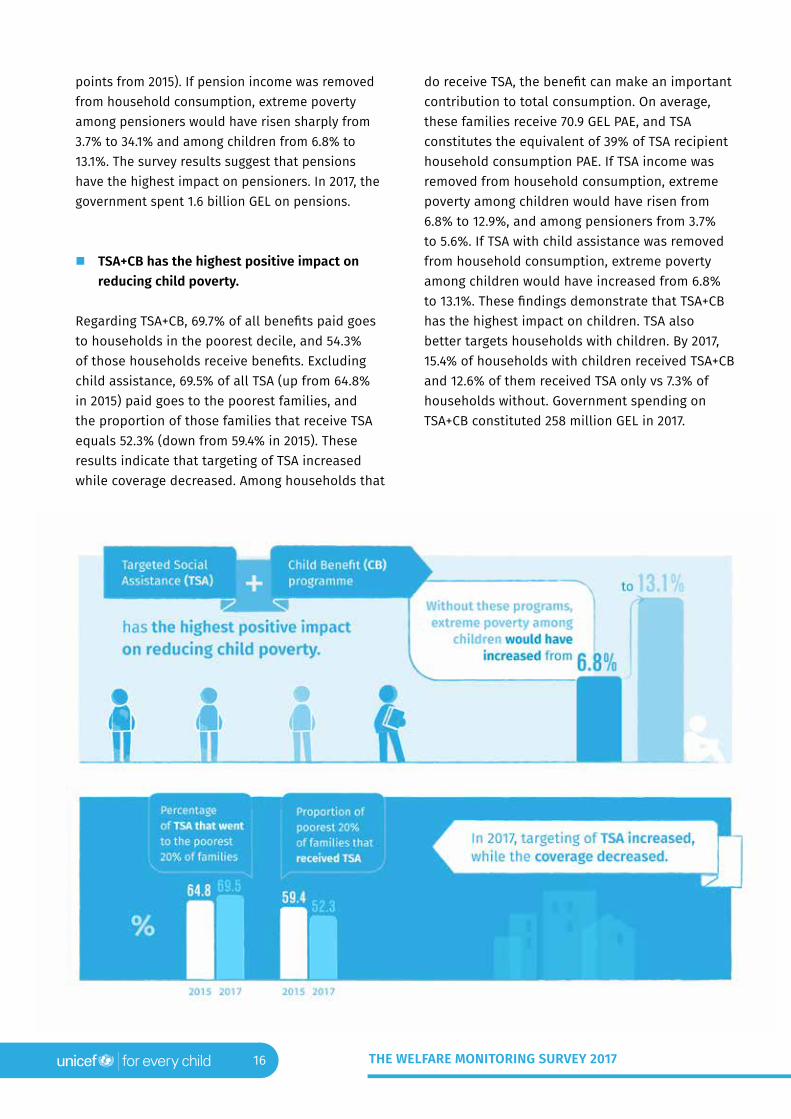
� TSA+CB has the highest positive impact on reducing child poverty.
Regarding TSA+CB, 69.7% of all benefits paid goes to households in the poorest decile, and 54.3% of those households receive benefits. Excluding child assistance, 69.5% of all TSA (up from 64.8% in 2015) paid goes to the poorest families, and the proportion of those families that receive TSA equals 52.3% (down from 59.4% in 2015). These results indicate that targeting of TSA increased while coverage decreased. Among households that
do receive TSA, the benefit can make an important contribution to total consumption. On average, these families receive 70.9 GEL PAE, and TSA constitutes the equivalent of 39% of TSA recipient household consumption PAE. If TSA income was removed from household consumption, extreme poverty among children would have risen from 6.8% to 12.9%, and among pensioners from 3.7% to 5.6%. If TSA with child assistance was removed from household consumption, extreme poverty among children would have increased from 6.8% to 13.1%. These findings demonstrate that TSA+CB has the highest impact on children. TSA also better targets households with children. By 2017, 15.4% of households with children received TSA+CB and 12.6% of them received TSA only vs 7.3% of households without. Government spending on TSA+CB constituted 258 million GEL in 2017.
17 THE WELFARE MONITORING SURVEY 2017
IMPACT OF CATEGORICAL BENEFITS ON POVERTY
� In 2017, 11.7% of households received at least one kind of categorical benefit.
In WMS 2017, categorical benefits are no longer comparable with the findings of the previous rounds, since the database has been corrected and updated. The coverage of categorical benefits is substantially high in the poorest tenth of households, 34.2% of which receive this benefit. The average amount of categorical benefits in recipient households is 79.7 GEL per month PAE. Recipient households with orphans receive 72.7 GEL per month PAE. Among households that contain a person with a disability, 62.4% receive categorical benefits at an average rate of 75.7 GEL PAE per month; and 75.4% of households with an IDP receive categorical benefits at a rate of 67.5 GEL PAE per month. The annual government spending on categorical benefits equaled 525.5 million GEL in 2017.
� Categorical Benefits Significantly Reduce the Incidence of poverty.
If categorical benefits were removed from household consumption, extreme poverty among households with a disabled person would have increased from 11.2% to 23.8%. For those households including an internally displaced person (IDP), extreme poverty rate would have risen from 8.5% to 15.6%. It should be emphasized that around 60% of all households receiving categorical benefits also receive either pensions or TSA, so the net effect of social transfers is underestimated.
HEALTHCARE
� An estimated 82% of the population is covered by the universal health programme; however, about 11% of the population is not aware of health coverage plans.
From 2013, the government of Georgia introduced a universal health programme that, guarantees state support to all citizens in need of health treatment. About 82% of the population is covered by universal health coverage. Corporate, employer sponsored, or private insurance is more common in urban areas than it is in rural areas. Almost 11% of the population is unaware of health coverage plans and assume that they are not enrolled in any.
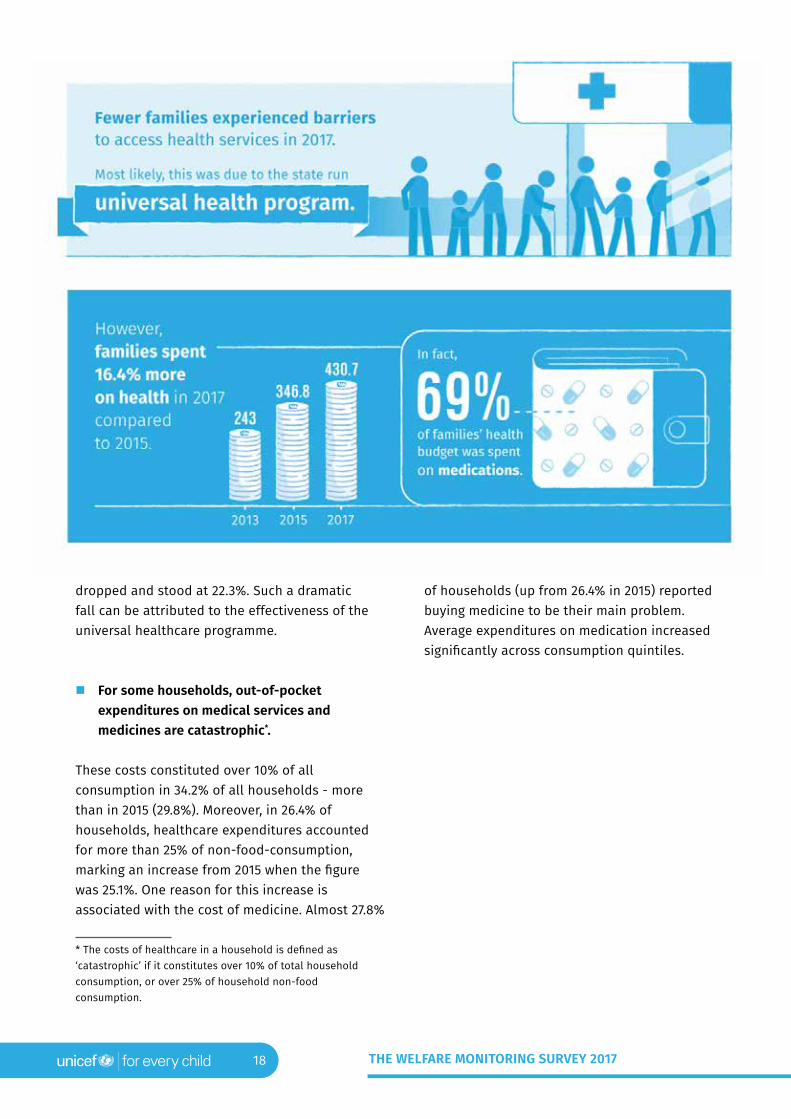
� The WMS 2017 results show a significant drop in the percentage of households with barriers to accessing health services.
The mean annual household expenditure* on healthcare in 2017 was 430.7 GEL per equivalent adult (median 200.9 GEL PAE). Adjusted for 2015 prices, this shows an increase of 16.4% from the mean expenditure of 346.8 GEL, and a 6.4% increase from the median expenditure of 177 GEL in 2015. On average, urban households spent 448.7 GEL annually on healthcare while rural households spent 412 GEL. Only 3.6% of households in the survey incurred no health costs at all. With respect to annual healthcare expenditure distribution, households spent the highest share (69%) on medicine. About 43.1% of all households in 2015 included at least one person who needed medical services that, the household could not afford. Two years later, the percentage of households with barriers to accessing health services substantially
* Expenditures on healthcare covers emergency medical assistance (including transportation costs), visits to doctors, medical procedures, surgical operations, hospital services, maternity care fees, women’s consultations, regular checkups, immunization costs, nursing and care fees, purchase of medicine, medical insurance premiums, and other informal costs.
18 THE WELFARE MONITORING SURVEY 2017
dropped and stood at 22.3%. Such a dramatic fall can be attributed to the effectiveness of the universal healthcare programme.
� For some households, out-of-pocket expenditures on medical services and medicines are catastrophic*.
These costs constituted over 10% of all consumption in 34.2% of all households - more than in 2015 (29.8%). Moreover, in 26.4% of households, healthcare expenditures accounted for more than 25% of non-food-consumption, marking an increase from 2015 when the figure was 25.1%. One reason for this increase is associated with the cost of medicine. Almost 27.8%
* The costs of healthcare in a household is defined as ‘catastrophic’ if it constitutes over 10% of total household consumption, or over 25% of household non-food consumption.
of households (up from 26.4% in 2015) reported buying medicine to be their main problem. Average expenditures on medication increased significantly across consumption quintiles.
19 THE WELFARE MONITORING SURVEY 2017
HOUSEHOLD COPING STRATEGIES
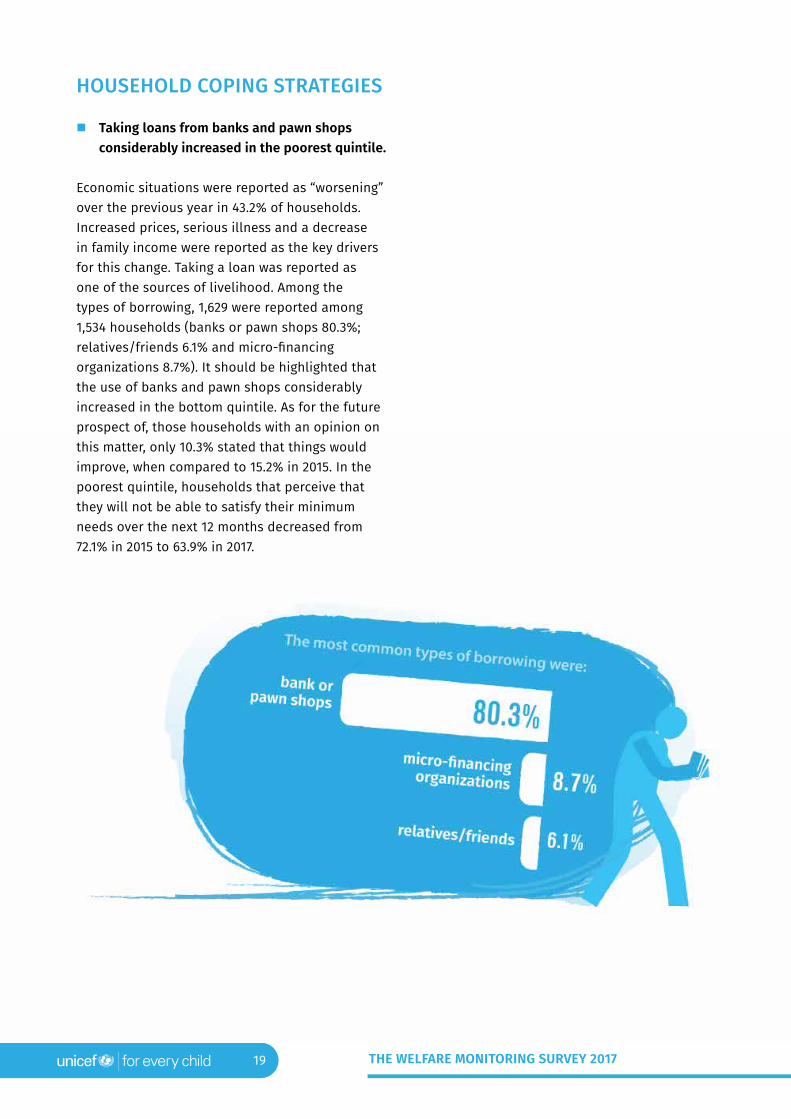
� Taking loans from banks and pawn shops considerably increased in the poorest quintile.
Economic situations were reported as “worsening” over the previous year in 43.2% of households. Increased prices, serious illness and a decrease in family income were reported as the key drivers for this change. Taking a loan was reported as one of the sources of livelihood. Among the types of borrowing, 1,629 were reported among 1,534 households (banks or pawn shops 80.3%; relatives/friends 6.1% and micro-financing organizations 8.7%). It should be highlighted that the use of banks and pawn shops considerably increased in the bottom quintile. As for the future prospect of, those households with an opinion on this matter, only 10.3% stated that things would improve, when compared to 15.2% in 2015. In the poorest quintile, households that perceive that they will not be able to satisfy their minimum needs over the next 12 months decreased from 72.1% in 2015 to 63.9% in 2017.
20 THE WELFARE MONITORING SURVEY 2017
� Consumption poverty for children is on the rise, while non-monetary indicators of child poverty have improved.
In the WMS 2017 sample, 33.4% of households include at least one child under 16 years of age, and 50% of all households with children are situated in rural areas. As survey findings show, children are more likely to be poor than the general population or pensioners. The material living conditions of children have improved in terms of durable goods in households and there are substantial reductions in the proportion of children living in dwellings that are in poor condition. Subjective poverty and social exclusion have also decreased for children, however, monetary poverty indicators are on the rise in 2017. Furthermore, 4.1% of children in rural Georgia live in households in which there is no improved source of drinking water. Almost 9.3% of urban children live in households with unimproved sanitation facilities vs. 32.9% of rural children. Households without children receive on average of 122.8 GEL PAE/month as social assistance, whereas households with children receive an average of 50.5 GEL PAE/month. Average household consumption is 53% higher in households with children than it is in households without children. In contrast, PAE consumption is 19.5% lower in households with children.
� Due to absence of kindergartens, around 14 000 children do not attend preschool services.
Among children aged 3-5 years-old in the WMS 2017 sample, 63.7% attended kindergarten and the vast majority of kindergartners attended public institutions. The overall kindergarten attendance rate of 3-5 year-olds in urban areas is higher than in rural areas (78% vs. 51%). While almost 64% of 3 to 5-year-olds in the richest fifth of
households attended kindergarten, only 57.7% in the poorest fifth attended kindergarten. Among all children aged 3 to 5 years old, 8.9% did not attend preschool services due to the absence of kindergartens in their districts. The absence of infrastructure is more common in rural (16.8%) areas, and because of the absence of places in existing kindergartens, nearly 5.1% of all children are unable to attend.
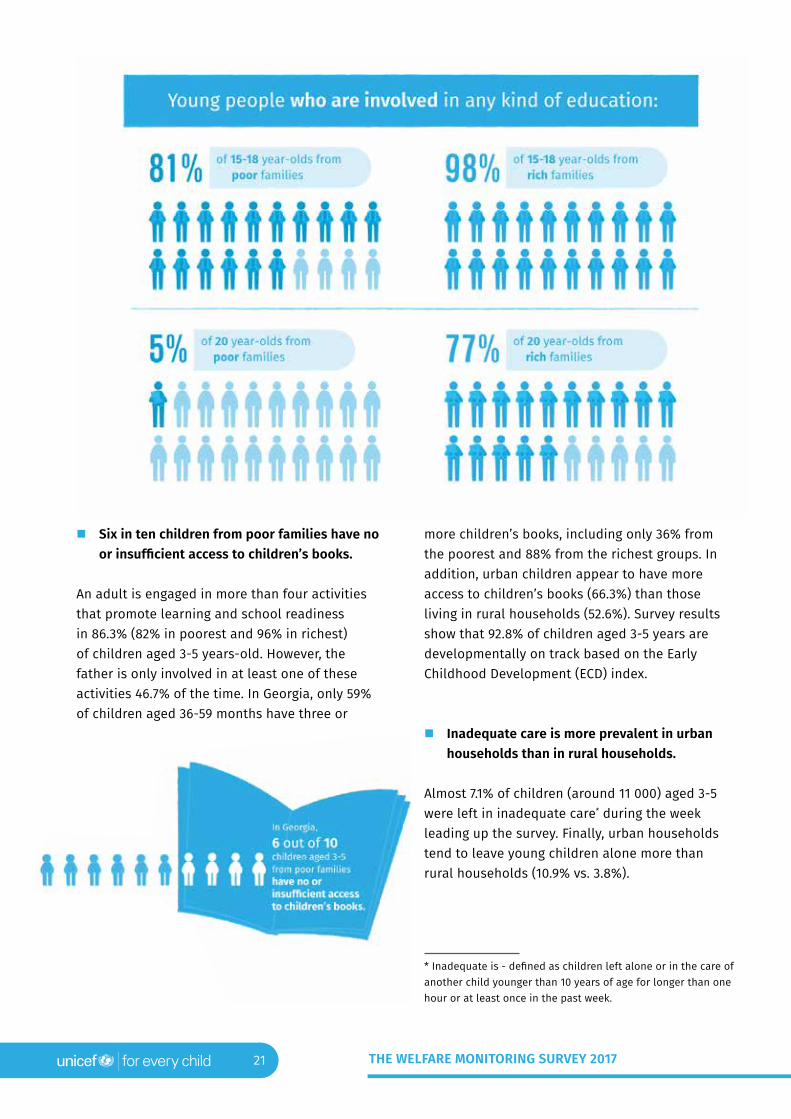
� School attendance in mandatory education is 97%; however, every fifth poor child aged 15-18 is no longer involved in education.
The formal education attendance rate significantly differs between the poorest and the wealthiest quintiles. Children from poor households tend not to attend preschool or primary school. Nearly 81% of worse-off children aged 15-18 attended school, whereas in the wealthiest quintile, 98% of the same age group continues to pursue an education. The difference becomes more evident after the age of 18, when children from poor households drop out of educational institution. Only about 5% of 20-year-olds from the poorest quintile attended some type of educational institution versus 77% from the richest quintile.
CHILD DEVELOPMENT
21 THE WELFARE MONITORING SURVEY 2017
� Six in ten children from poor families have no or insufficient access to children’s books.
An adult is engaged in more than four activities that promote learning and school readiness in 86.3% (82% in poorest and 96% in richest) of children aged 3-5 years-old. However, the father is only involved in at least one of these activities 46.7% of the time. In Georgia, only 59% of children aged 36-59 months have three or
more children’s books, including only 36% from the poorest and 88% from the richest groups. In addition, urban children appear to have more access to children’s books (66.3%) than those living in rural households (52.6%). Survey results show that 92.8% of children aged 3-5 years are developmentally on track based on the Early Childhood Development (ECD) index.
� Inadequate care is more prevalent in urban households than in rural households.
Almost 7.1% of children (around 11 000) aged 3-5 were left in inadequate care* during the week leading up the survey. Finally, urban households tend to leave young children alone more than rural households (10.9% vs. 3.8%).
* Inadequate is - defined as children left alone or in the care of another child younger than 10 years of age for longer than one hour or at least once in the past week.