Embed Size (px)
Citation preview
Int J Thermophys (2010) 31:2059–2077DOI 10.1007/s10765-010-0889-3
Thermal Conductivity of Ionic Liquids: Measurementand Prediction
A. P. Fröba · M. H. Rausch · K. Krzeminski ·D. Assenbaum · P. Wasserscheid · A. Leipertz
Received: 22 September 2010 / Accepted: 15 November 2010 / Published online: 1 December 2010© Springer Science+Business Media, LLC 2010
Abstract This study reports thermal-conductivity data for a series of [EMIM](1-ethyl-3-methylimidazolium)-based ionic liquids (ILs) having the anions [NTf2](bis(trifluoromethylsulfonyl)imide), [OAc] (acetate), [N(CN)2] (dicyanimide),[C(CN)3] (tricyanomethide), [MeOHPO2] (methylphosphonate), [EtSO4] (ethylsul-fate), or [OcSO4] (octylsulfate), and in addition for ILs with the [NTf2]-anion havingthe cations [HMIM] (1-hexyl-3-methylimidazolium), [OMA] (methyltrioctylammo-nium), or [BBIM] (1,3-dibutylimidazolium). Measurements were performed in thetemperature range between (273.15 and 333.15) K by a stationary guarded parallel-plate instrument with a total measurement uncertainty of 3 % (k = 2). For all ILs, thetemperature dependence of the thermal conductivity can well be represented by a linearequation. While for the [NTf2]-based ILs, a slight increase of the thermal conductivitywith increasing molar mass of the cation is found at a given temperature, the [EMIM]-based ILs show a pronounced, approximately linear decrease with increasing molarmass of the different probed anions. Based on the experimental data obtained in this
Electronic supplementary material The online version of this article(doi:10.1007/s10765-010-0889-3) contains supplementary material, which is available to authorized users.
A. P. Fröba (B) · A. LeipertzErlangen Graduate School in Advanced Optical Technologies (SAOT),University of Erlangen-Nuremberg, Paul-Gordan-Straße 6, 91052 Erlangen, Germanye-mail: [email protected]
A. P. Fröba · M. H. Rausch · K. Krzeminski · A. LeipertzInstitute of Engineering Thermodynamics (LTT), University of Erlangen-Nuremberg,Am Weichselgarten 8, 91058 Erlangen, Germany
D. Assenbaum · P. WasserscheidInstitute of Chemical Reaction Engineering (CRT), University of Erlangen-Nuremberg,Egerlandstraße 3, 91058 Erlangen, Germany
123
2060 Int J Thermophys (2010) 31:2059–2077
study, a simple relationship between the thermal conductivity, molar mass, and densityis proposed for the prediction of the thermal-conductivity data of ILs. For this, alsodensities were measured for [EMIM][OAc], [EMIM][C(CN)3], and [HMIM][NTf2].The mean absolute percentage deviation of all thermal-conductivity data for ILs foundin the literature from the proposed prediction is about 7 %. This result represents aconvenient simplification in the acquisition of thermal conductivity information forthe enormous amount of structurally different IL cation/anion combinations available.
Keywords Density · Ionic liquids · Parallel-plate method · Prediction ·Refractive index · Thermal conductivity
1 Introduction
The number of potential fields of application for ionic liquids (ILs) has stronglyincreased in recent years [1–6]. Beside their unique properties, this is mainly dueto an almost unlimited number of possible IL cation/anion combinations which canbe structurally tailored for a specific application. Current estimates of the number ofpossible ILs range between ten to the fourteenth to ten to the eighteenth [7]. To ver-ify the applicability of a certain IL structure, e.g., as a solvent in catalytic reactions[8], entrainer in distillative separation [9], electrolyte in batteries [10], lubricant indifficult metal–metal wear contacts [11], or heat transfer fluid in energy technology[12], a detailed knowledge of its physical and chemical property profiles is required.The properties of every conceivable IL cannot be obtained by carrying out appropri-ate measurements, since this would represent a substantial investment in time andresources. Alternatively, an approach predicting the structure of an IL exhibitingthe required set of properties would be very useful [13]. For this purpose, quanti-tative prediction methods with a reasonable uncertainty must be developed, see, e.g.,[14–17]. Yet, all prediction methods can only be as accurate as the experimental dataused for the evaluation of their performance. Although many physicochemical proper-ties including equilibrium and transport properties of ILs have been studied extensively,a fundamental lack of reliable data still exists. In particular, only limited informationon the thermal conductivity of ILs is available in the literature, although it is a keyproperty in many engineering disciplines, e.g., in chemical process design [18]. Atthe present, a total amount of 242 experimental thermal-conductivity data points isavailable in the open literature for 28 pure ILs at atmospheric pressure [12,19–25].
The major aim of this study is to provide accurate and reliable data for thethermal conductivity of a set of pure ILs selected to cover a certain range ofmolecular weights from (170 to 650) g · mol−1. In detail, [EMIM] (1-ethyl-3-methylimidazolium)-based ILs carrying the anions [NTf2] (bis(trifluoromethylsul-fonyl)imide), [OAc] (acetate), [N(CN)2] (dicyanimide), [C(CN)3] (tricyanomethide),[MeOHPO2] (methylphosphonate), [EtSO4] (ethylsulfate), or [OcSO4] (octylsulfate)were selected. Moreover, a series of ILs with the [NTf2]-anion combined with the cat-ions [HMIM] (1-hexyl-3-methylimidazolium), [OMA] (methyltrioctylammonium), or[BBIM] (1,3-dibutylimidazolium) was investigated. With the obtained experimentaldata, a simple prediction method for the thermal conductivity of ILs is developed andcompared with the thermal-conductivity data of other ILs available from the literature.
123
Int J Thermophys (2010) 31:2059–2077 2061
2 Experimental
2.1 Materials and Sample Preparation
[EMIM][N(CN)2], [EMIM][MeOHPO2], and [EMIM][NTf2] were purchased fromSolvent Innovation GmbH, Cologne, Germany. [EMIM][OAc] and [EMIM][C(CN)3]were purchased from BASF AG, Germany, and Lonza Cologne AG, Germany.[EMIM][EtSO4] was obtained by the synthesis procedure described by Maieret al. [26]. [EMIM][OcSO4] was synthesized by reacting [EMIM][EtSO4] withn-octanol with the procedure described by Himmler et al. [27]. For the synthe-sis of [BBIM][NTf2], the procedure described in our former work [28] was used.[HMIM][NTf2] was obtained by applying the same method using the reactants[HMIM][Cl] (1-hexyl-3-methylimidazolium chloride) and [Li][NTf2] (lithium bis(tri-fluoromethylsulfonyl)imide). [HMIM][Cl] was previously synthesized by reaction ofmethylimidazole with 1-chlorohexane as described by Davis et al. [29]. [OMA][NTf2]was obtained by a two-step synthesis. First, methyltrioctylammonium methylsulfatewas produced by reacting trioctylamine with dimethylsulfate at equimolar conditions.This procedure has to be carried out very carefully with cooling due to the stronglyexothermic character of the reaction. The second step is an ion exchange in distilledwater with lithium bis(trifluoromethylsulfonyl)imide. The resulting denser phase isthe formed product [OMA][NTf2], and the upper phase consists of the exchangedions and water. To improve purity, the product was washed with distilled water severaltimes and dried under vacuum at 60 ◦C.
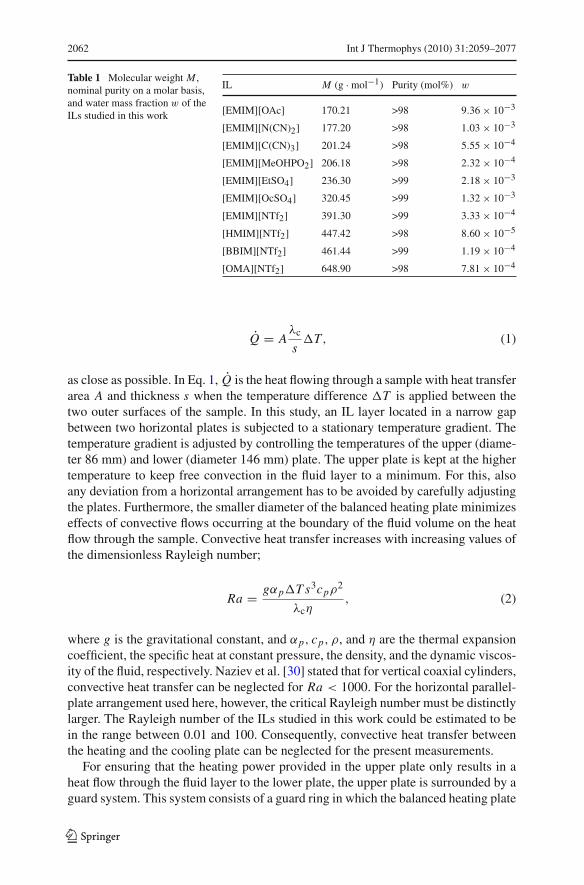
The purities of the synthesized ILs were proven by 1H NMR analysis (JEOL, ECX+400 spectrometer) with dimethylsulfoxide-d6 (DMSO-d6) as a solvent. The totalpeak integral in the 1H NMR spectrum was used to determine the nominal purities ofthe ILs on a molar basis. Prior to use, all ILs were dried at about 333.15 K for a timeperiod of at least 4 h on a vacuum line (0.5 mbar) with an oil-sealed vacuum pump anda liquid nitrogen trap. For the dried ILs, the water mass fraction was determined byKarl Fischer coulometric titration (Metrohm, 756 KF Coulometer) directly before fill-ing the sample cell of the parallel-plate instrument. The expanded relative uncertainty(k = 2) of the water content determinations performed within this work depends onthe water mass fraction and is estimated to be between ±20 % and ±5 %, correspond-ing to water mass fractions ranging from 4.0 × 10⁻⁴ to 5.0 × 10⁻². For lower massfractions, the relative uncertainty was about ±20 %. The molecular weights, nominalpurities, and water mass fractions of the studied ILs are summarized in Table 1. Allparts of the measuring devices which were in contact with the sample as well as allglassware used for sample handling were cleaned, rinsed with double-distilled water,and oven-dried.
2.2 Parallel-Plate Instrument for Measuring the Thermal Conductivity
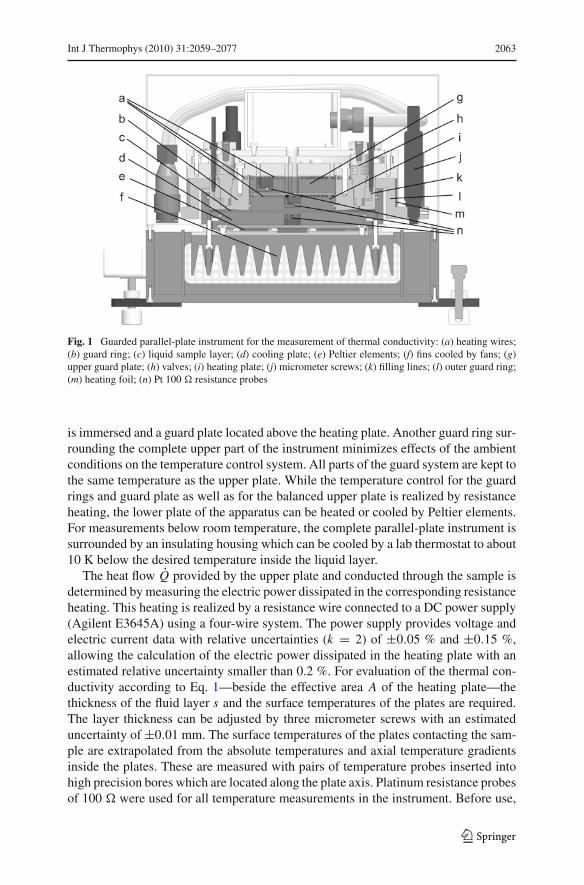
For measuring the thermal conductivity λc of the ILs, a parallel-plate instrument appli-cable to fluids as well as thin solid bodies and bulk solids was used, see Fig. 1. It isdesigned to fulfill the ideal one-dimensional form of the Fourier law of heat conductionfor a planar sample,
123
2062 Int J Thermophys (2010) 31:2059–2077
Table 1 Molecular weight M ,nominal purity on a molar basis,and water mass fraction w of theILs studied in this work
IL M (g · mol−1) Purity (mol%) w
[EMIM][OAc] 170.21 >98 9.36 × 10⁻³
[EMIM][N(CN)2] 177.20 >98 1.03 × 10⁻³
[EMIM][C(CN)3] 201.24 >98 5.55 × 10⁻⁴
[EMIM][MeOHPO2] 206.18 >98 2.32 × 10⁻⁴
[EMIM][EtSO4] 236.30 >99 2.18 × 10⁻³
[EMIM][OcSO4] 320.45 >99 1.32 × 10⁻³
[EMIM][NTf2] 391.30 >99 3.33 × 10⁻⁴
[HMIM][NTf2] 447.42 >98 8.60 × 10⁻⁵
[BBIM][NTf2] 461.44 >99 1.19 × 10⁻⁴
[OMA][NTf2] 648.90 >98 7.81 × 10⁻⁴
Q̇ = Aλc
s�T, (1)
as close as possible. In Eq. 1, Q̇ is the heat flowing through a sample with heat transferarea A and thickness s when the temperature difference �T is applied between thetwo outer surfaces of the sample. In this study, an IL layer located in a narrow gapbetween two horizontal plates is subjected to a stationary temperature gradient. Thetemperature gradient is adjusted by controlling the temperatures of the upper (diame-ter 86 mm) and lower (diameter 146 mm) plate. The upper plate is kept at the highertemperature to keep free convection in the fluid layer to a minimum. For this, alsoany deviation from a horizontal arrangement has to be avoided by carefully adjustingthe plates. Furthermore, the smaller diameter of the balanced heating plate minimizeseffects of convective flows occurring at the boundary of the fluid volume on the heatflow through the sample. Convective heat transfer increases with increasing values ofthe dimensionless Rayleigh number;
Ra = gαp�T s3cpρ2
λcη, (2)
where g is the gravitational constant, and αp, cp, ρ, and η are the thermal expansioncoefficient, the specific heat at constant pressure, the density, and the dynamic viscos-ity of the fluid, respectively. Naziev et al. [30] stated that for vertical coaxial cylinders,convective heat transfer can be neglected for Ra < 1000. For the horizontal parallel-plate arrangement used here, however, the critical Rayleigh number must be distinctlylarger. The Rayleigh number of the ILs studied in this work could be estimated to bein the range between 0.01 and 100. Consequently, convective heat transfer betweenthe heating and the cooling plate can be neglected for the present measurements.
For ensuring that the heating power provided in the upper plate only results in aheat flow through the fluid layer to the lower plate, the upper plate is surrounded by aguard system. This system consists of a guard ring in which the balanced heating plate
123
Int J Thermophys (2010) 31:2059–2077 2063
Fig. 1 Guarded parallel-plate instrument for the measurement of thermal conductivity: (a) heating wires;(b) guard ring; (c) liquid sample layer; (d) cooling plate; (e) Peltier elements; (f) fins cooled by fans; (g)upper guard plate; (h) valves; (i) heating plate; (j) micrometer screws; (k) filling lines; (l) outer guard ring;(m) heating foil; (n) Pt 100 � resistance probes
is immersed and a guard plate located above the heating plate. Another guard ring sur-rounding the complete upper part of the instrument minimizes effects of the ambientconditions on the temperature control system. All parts of the guard system are kept tothe same temperature as the upper plate. While the temperature control for the guardrings and guard plate as well as for the balanced upper plate is realized by resistanceheating, the lower plate of the apparatus can be heated or cooled by Peltier elements.For measurements below room temperature, the complete parallel-plate instrument issurrounded by an insulating housing which can be cooled by a lab thermostat to about10 K below the desired temperature inside the liquid layer.
The heat flow Q̇ provided by the upper plate and conducted through the sample isdetermined by measuring the electric power dissipated in the corresponding resistanceheating. This heating is realized by a resistance wire connected to a DC power supply(Agilent E3645A) using a four-wire system. The power supply provides voltage andelectric current data with relative uncertainties (k = 2) of ±0.05 % and ±0.15 %,allowing the calculation of the electric power dissipated in the heating plate with anestimated relative uncertainty smaller than 0.2 %. For evaluation of the thermal con-ductivity according to Eq. 1—beside the effective area A of the heating plate—thethickness of the fluid layer s and the surface temperatures of the plates are required.The layer thickness can be adjusted by three micrometer screws with an estimateduncertainty of ±0.01 mm. The surface temperatures of the plates contacting the sam-ple are extrapolated from the absolute temperatures and axial temperature gradientsinside the plates. These are measured with pairs of temperature probes inserted intohigh precision bores which are located along the plate axis. Platinum resistance probesof 100 � were used for all temperature measurements in the instrument. Before use,
123
2064 Int J Thermophys (2010) 31:2059–2077
the resistance probes including the whole cabling of the four-wire system were cal-ibrated, resulting in an absolute uncertainty of ±0.01 K. The relative uncertainty ofthe resistance probes among each other was smaller than ±0.005 K.
The parallel plates and the bodies of the guard system are made of copper. Thecopper surfaces which are in contact with the sample fluid were polished and coveredwith a thin chrome layer. Thus, the radiative contribution to the total heat flow is smallwhen compared to that caused by heat conduction. Nevertheless, radiation correctionsare necessary for obtaining precise thermal-conductivity data for weakly absorbingfluids such as ILs. For these fluids, the effective thermal conductivity λeff measured ina parallel-plate instrument consists of contributions of conductive (λc) and radiative(λr) heat transfer,
λeff = λc + λr. (3)
For the determination of λr, an approximate calculation method proposed by Braunet al. [31] can be used. It is based on a mathematical model for small temperaturedifferences developed by Kohler [32] and Poltz [33] and implies some simplifica-tions. The latter include a linear temperature distribution in the sample and a constantemission coefficient of ε = 0.04 for the polished and chromed plate walls which arein contact with the fluid. With the transmissions D(ν) for the wave numbers, ν, λr canbe determined,
λr = 4
3c1c2n2
0∫
ν=∞s0
Y (τ,ε)ln D(ν)
ν4 exp(
ν c2T̄
)
T̄ 2[exp
(νc2T̄
)−1
]2 dν. (4)
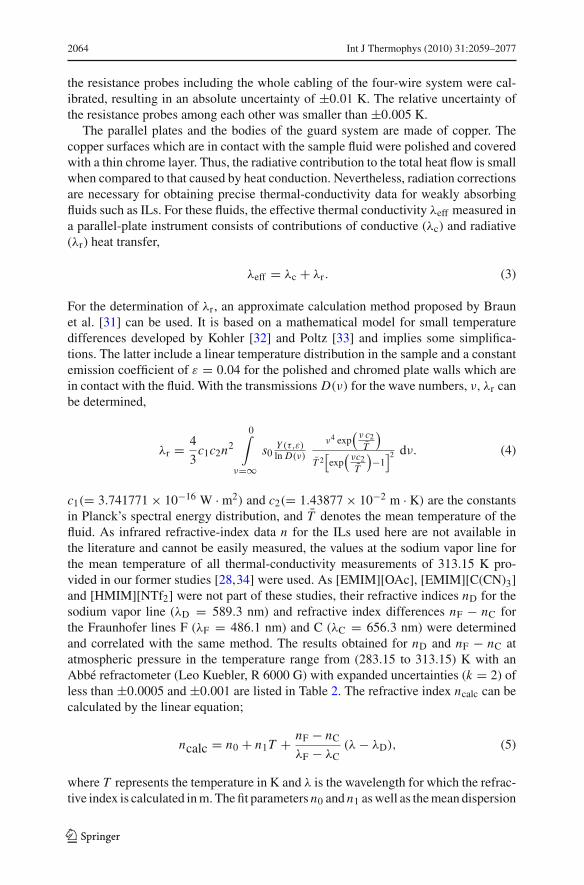
c1(= 3.741771 × 10⁻¹⁶ W · m2) and c2(= 1.43877 × 10⁻² m · K) are the constantsin Planck’s spectral energy distribution, and T̄ denotes the mean temperature of thefluid. As infrared refractive-index data n for the ILs used here are not available inthe literature and cannot be easily measured, the values at the sodium vapor line forthe mean temperature of all thermal-conductivity measurements of 313.15 K pro-vided in our former studies [28,34] were used. As [EMIM][OAc], [EMIM][C(CN)3]and [HMIM][NTf2] were not part of these studies, their refractive indices nD for thesodium vapor line (λD = 589.3 nm) and refractive index differences nF − nC forthe Fraunhofer lines F (λF = 486.1 nm) and C (λC = 656.3 nm) were determinedand correlated with the same method. The results obtained for nD and nF − nC atatmospheric pressure in the temperature range from (283.15 to 313.15) K with anAbbé refractometer (Leo Kuebler, R 6000 G) with expanded uncertainties (k = 2) ofless than ±0.0005 and ±0.001 are listed in Table 2. The refractive index ncalc can becalculated by the linear equation;
ncalc = n0 + n1T + nF − nC
λF − λC(λ − λD), (5)
where T represents the temperature in K and λ is the wavelength for which the refrac-tive index is calculated in m. The fit parameters n0 and n1 as well as the mean dispersion
123
Int J Thermophys (2010) 31:2059–2077 2065
Table 2 Refractive index nD and refractive-index difference nF−nC of [EMIM][OAc], [EMIM][C(CN)3],and [HMIM][NTf2] at temperature T and atmospheric pressure
T (K) [EMIM][OAc] [EMIM][C(CN)3] [HMIM][NTf2]
nD nF − nC nD nF − nC nD nF − nC
283.15 1.5030 0.0124 1.5154 0.0143 1.4355 0.0096
293.15 1.5002 0.0121 1.5139 0.0140 1.4324 0.0098
303.15 1.4981 0.0118 1.5110 0.0142 1.4298 0.0080
313.15 1.4950 0.0116 1.5084 0.0143 1.4271 0.0080
Table 3 Coefficients of Eq. 5 for the refractive index ncalc of [EMIM][OAc], [EMIM][C(CN)3], and[HMIM][NTf2]
n0 n1 (K−1) (�n/�λ) (m−1) rmsa
[EMIM][OAc] 1.57689 −0.000261 −70347 0.014
[EMIM][C(CN)3] 1.58343 −0.000239 −83320 0.022
[HMIM][NTf2] 1.51409 −0.000278 −51988 0.008a Standard percentage deviation of nD to the fit
(nF − nC)/(λF − λC) are given in Table 3. The mean dispersion corresponds to theaverage value of the refractive index differences nF −nC and is assumed to be indepen-dent of the temperature. For all ILs, the deviations of the experimental refractive-indexdata nD from the correlation according to Eq. 5 are clearly within the measurementuncertainty.
In Eq. 4, the reflectance of the fluid Y is a function of the emission coefficient ε andthe optical thickness τ and has been calculated and tabulated by Poltz [33]. τ can bedetermined with the layer thickness s0 used for the measurement of the transmissionspectra,
τ = − s
s0ln D. (6)
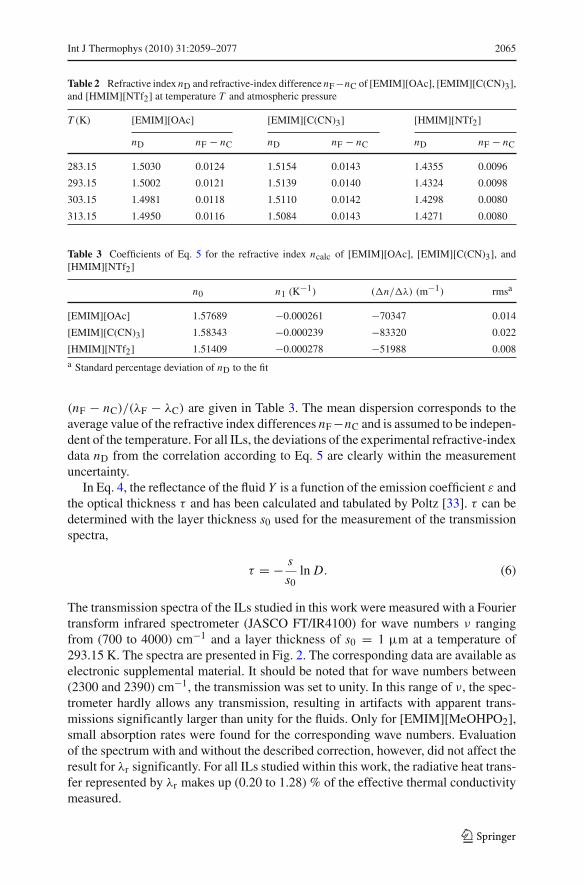
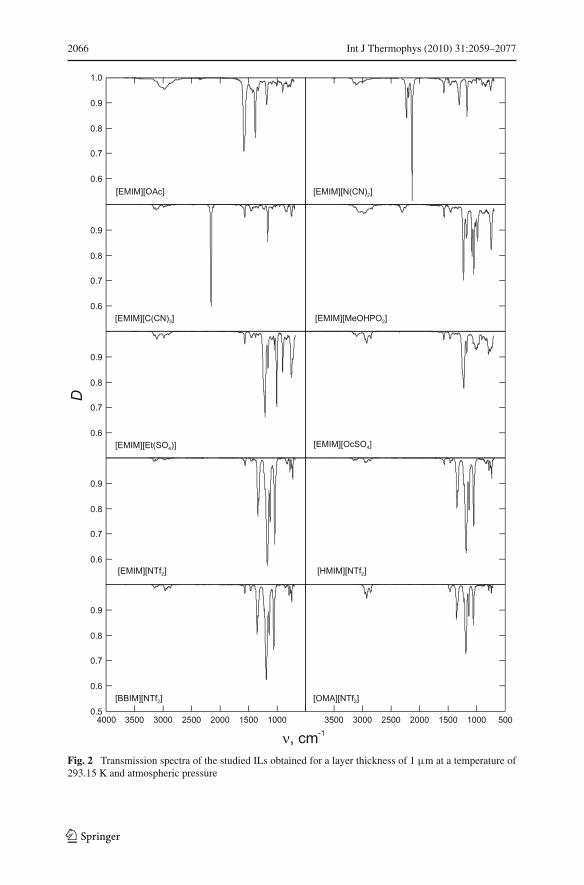
The transmission spectra of the ILs studied in this work were measured with a Fouriertransform infrared spectrometer (JASCO FT/IR4100) for wave numbers ν rangingfrom (700 to 4000) cm−1 and a layer thickness of s0 = 1 µm at a temperature of293.15 K. The spectra are presented in Fig. 2. The corresponding data are available aselectronic supplemental material. It should be noted that for wave numbers between(2300 and 2390) cm−1, the transmission was set to unity. In this range of ν, the spec-trometer hardly allows any transmission, resulting in artifacts with apparent trans-missions significantly larger than unity for the fluids. Only for [EMIM][MeOHPO2],small absorption rates were found for the corresponding wave numbers. Evaluationof the spectrum with and without the described correction, however, did not affect theresult for λr significantly. For all ILs studied within this work, the radiative heat trans-fer represented by λr makes up (0.20 to 1.28) % of the effective thermal conductivitymeasured.
123
2066 Int J Thermophys (2010) 31:2059–2077
Fig. 2 Transmission spectra of the studied ILs obtained for a layer thickness of 1 µm at a temperature of293.15 K and atmospheric pressure
123
Int J Thermophys (2010) 31:2059–2077 2067
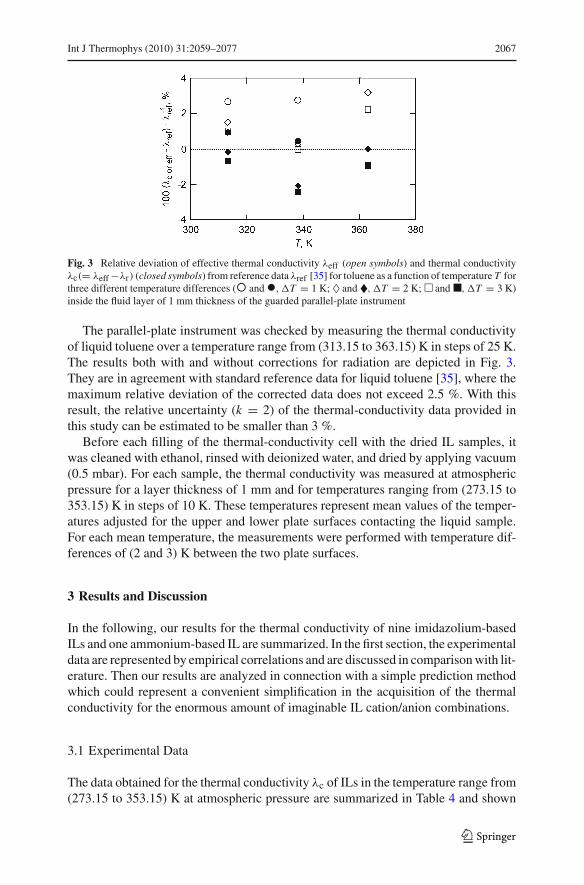
Fig. 3 Relative deviation of effective thermal conductivity λeff (open symbols) and thermal conductivityλc(= λeff −λr) (closed symbols) from reference data λref [35] for toluene as a function of temperature T forthree different temperature differences (� and�, �T = 1 K; ♦ and �, �T = 2 K; � and �, �T = 3 K)inside the fluid layer of 1 mm thickness of the guarded parallel-plate instrument
The parallel-plate instrument was checked by measuring the thermal conductivityof liquid toluene over a temperature range from (313.15 to 363.15) K in steps of 25 K.The results both with and without corrections for radiation are depicted in Fig. 3.They are in agreement with standard reference data for liquid toluene [35], where themaximum relative deviation of the corrected data does not exceed 2.5 %. With thisresult, the relative uncertainty (k = 2) of the thermal-conductivity data provided inthis study can be estimated to be smaller than 3 %.
Before each filling of the thermal-conductivity cell with the dried IL samples, itwas cleaned with ethanol, rinsed with deionized water, and dried by applying vacuum(0.5 mbar). For each sample, the thermal conductivity was measured at atmosphericpressure for a layer thickness of 1 mm and for temperatures ranging from (273.15 to353.15) K in steps of 10 K. These temperatures represent mean values of the temper-atures adjusted for the upper and lower plate surfaces contacting the liquid sample.For each mean temperature, the measurements were performed with temperature dif-ferences of (2 and 3) K between the two plate surfaces.
3 Results and Discussion
In the following, our results for the thermal conductivity of nine imidazolium-basedILs and one ammonium-based IL are summarized. In the first section, the experimentaldata are represented by empirical correlations and are discussed in comparison with lit-erature. Then our results are analyzed in connection with a simple prediction methodwhich could represent a convenient simplification in the acquisition of the thermalconductivity for the enormous amount of imaginable IL cation/anion combinations.
3.1 Experimental Data
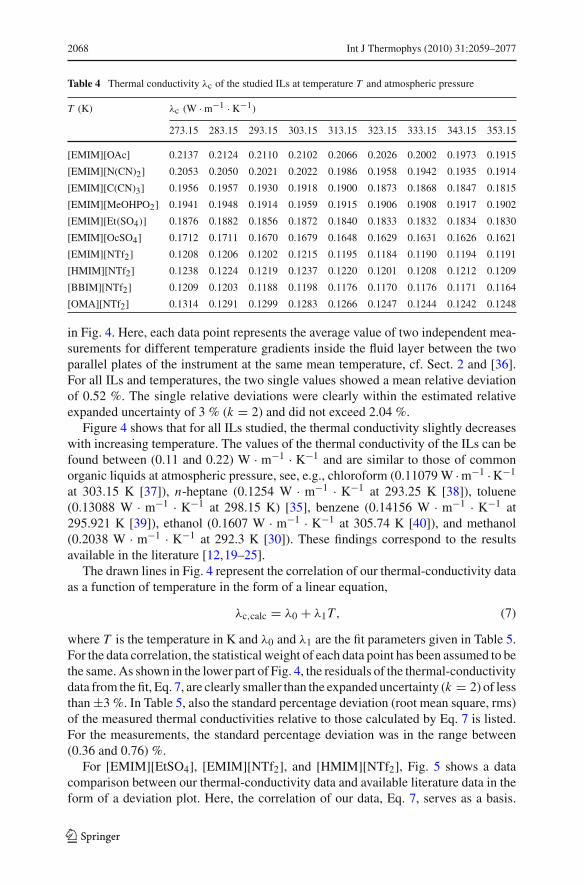
The data obtained for the thermal conductivity λc of ILs in the temperature range from(273.15 to 353.15) K at atmospheric pressure are summarized in Table 4 and shown
123
2068 Int J Thermophys (2010) 31:2059–2077
Table 4 Thermal conductivity λc of the studied ILs at temperature T and atmospheric pressure
T (K) λc (W · m−1 · K−1)
273.15 283.15 293.15 303.15 313.15 323.15 333.15 343.15 353.15
[EMIM][OAc] 0.2137 0.2124 0.2110 0.2102 0.2066 0.2026 0.2002 0.1973 0.1915
[EMIM][N(CN)2] 0.2053 0.2050 0.2021 0.2022 0.1986 0.1958 0.1942 0.1935 0.1914
[EMIM][C(CN)3] 0.1956 0.1957 0.1930 0.1918 0.1900 0.1873 0.1868 0.1847 0.1815
[EMIM][MeOHPO2] 0.1941 0.1948 0.1914 0.1959 0.1915 0.1906 0.1908 0.1917 0.1902
[EMIM][Et(SO4)] 0.1876 0.1882 0.1856 0.1872 0.1840 0.1833 0.1832 0.1834 0.1830
[EMIM][OcSO4] 0.1712 0.1711 0.1670 0.1679 0.1648 0.1629 0.1631 0.1626 0.1621
[EMIM][NTf2] 0.1208 0.1206 0.1202 0.1215 0.1195 0.1184 0.1190 0.1194 0.1191
[HMIM][NTf2] 0.1238 0.1224 0.1219 0.1237 0.1220 0.1201 0.1208 0.1212 0.1209
[BBIM][NTf2] 0.1209 0.1203 0.1188 0.1198 0.1176 0.1170 0.1176 0.1171 0.1164
[OMA][NTf2] 0.1314 0.1291 0.1299 0.1283 0.1266 0.1247 0.1244 0.1242 0.1248
in Fig. 4. Here, each data point represents the average value of two independent mea-surements for different temperature gradients inside the fluid layer between the twoparallel plates of the instrument at the same mean temperature, cf. Sect. 2 and [36].For all ILs and temperatures, the two single values showed a mean relative deviationof 0.52 %. The single relative deviations were clearly within the estimated relativeexpanded uncertainty of 3 % (k = 2) and did not exceed 2.04 %.
Figure 4 shows that for all ILs studied, the thermal conductivity slightly decreaseswith increasing temperature. The values of the thermal conductivity of the ILs can befound between (0.11 and 0.22) W · m−1 · K−1 and are similar to those of commonorganic liquids at atmospheric pressure, see, e.g., chloroform (0.11079 W · m−1 · K−1
at 303.15 K [37]), n-heptane (0.1254 W · m−1 · K−1 at 293.25 K [38]), toluene(0.13088 W · m−1 · K−1 at 298.15 K) [35], benzene (0.14156 W · m−1 · K−1 at295.921 K [39]), ethanol (0.1607 W · m−1 · K−1 at 305.74 K [40]), and methanol(0.2038 W · m−1 · K−1 at 292.3 K [30]). These findings correspond to the resultsavailable in the literature [12,19–25].
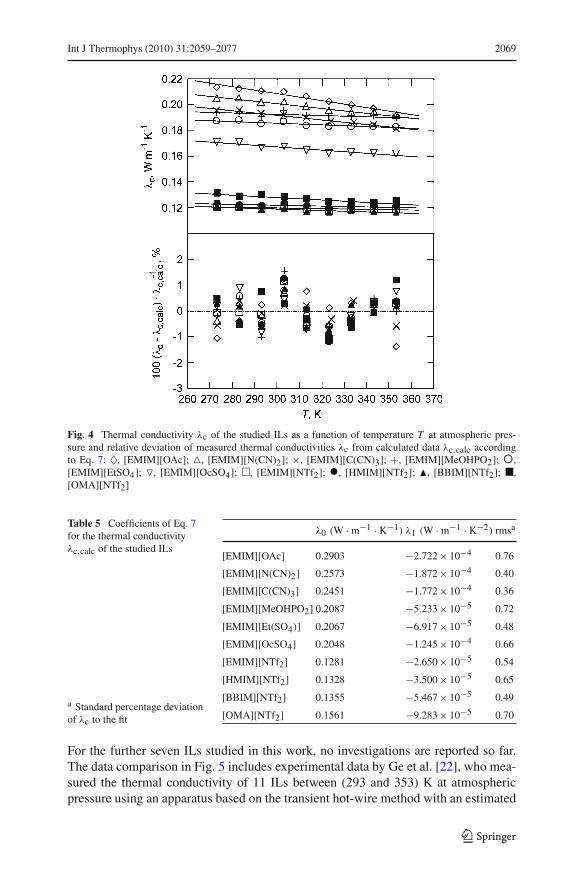
The drawn lines in Fig. 4 represent the correlation of our thermal-conductivity dataas a function of temperature in the form of a linear equation,
λc,calc = λ0 + λ1T, (7)
where T is the temperature in K and λ0 and λ1 are the fit parameters given in Table 5.For the data correlation, the statistical weight of each data point has been assumed to bethe same. As shown in the lower part of Fig. 4, the residuals of the thermal-conductivitydata from the fit, Eq. 7, are clearly smaller than the expanded uncertainty (k = 2) of lessthan ±3 %. In Table 5, also the standard percentage deviation (root mean square, rms)of the measured thermal conductivities relative to those calculated by Eq. 7 is listed.For the measurements, the standard percentage deviation was in the range between(0.36 and 0.76) %.
For [EMIM][EtSO4], [EMIM][NTf2], and [HMIM][NTf2], Fig. 5 shows a datacomparison between our thermal-conductivity data and available literature data in theform of a deviation plot. Here, the correlation of our data, Eq. 7, serves as a basis.
123
Int J Thermophys (2010) 31:2059–2077 2069
Fig. 4 Thermal conductivity λc of the studied ILs as a function of temperature T at atmospheric pres-sure and relative deviation of measured thermal conductivities λc from calculated data λc,calc accordingto Eq. 7: ♦, [EMIM][OAc]; �, [EMIM][N(CN)2]; ×, [EMIM][C(CN)3]; +, [EMIM][MeOHPO2]; �,[EMIM][EtSO4]; �, [EMIM][OcSO4]; �, [EMIM][NTf2]; �, [HMIM][NTf2]; �, [BBIM][NTf2]; �,[OMA][NTf2]
Table 5 Coefficients of Eq. 7for the thermal conductivityλc,calc of the studied ILs
a Standard percentage deviationof λc to the fit
λ0 (W · m−1 · K−1) λ1 (W · m−1 · K−2) rmsa
[EMIM][OAc] 0.2903 −2.722 × 10⁻⁴ 0.76
[EMIM][N(CN)2] 0.2573 −1.872 × 10⁻⁴ 0.40
[EMIM][C(CN)3] 0.2451 −1.772 × 10⁻⁴ 0.36
[EMIM][MeOHPO2] 0.2087 −5.233 × 10⁻⁵ 0.72
[EMIM][Et(SO4)] 0.2067 −6.917 × 10⁻⁵ 0.48
[EMIM][OcSO4] 0.2048 −1.245 × 10⁻⁴ 0.66
[EMIM][NTf2] 0.1281 −2.650 × 10⁻⁵ 0.54
[HMIM][NTf2] 0.1328 −3.500 × 10⁻⁵ 0.65
[BBIM][NTf2] 0.1355 −5.467 × 10⁻⁵ 0.49
[OMA][NTf2] 0.1561 −9.283 × 10⁻⁵ 0.70
For the further seven ILs studied in this work, no investigations are reported so far.The data comparison in Fig. 5 includes experimental data by Ge et al. [22], who mea-sured the thermal conductivity of 11 ILs between (293 and 353) K at atmosphericpressure using an apparatus based on the transient hot-wire method with an estimated
123
2070 Int J Thermophys (2010) 31:2059–2077
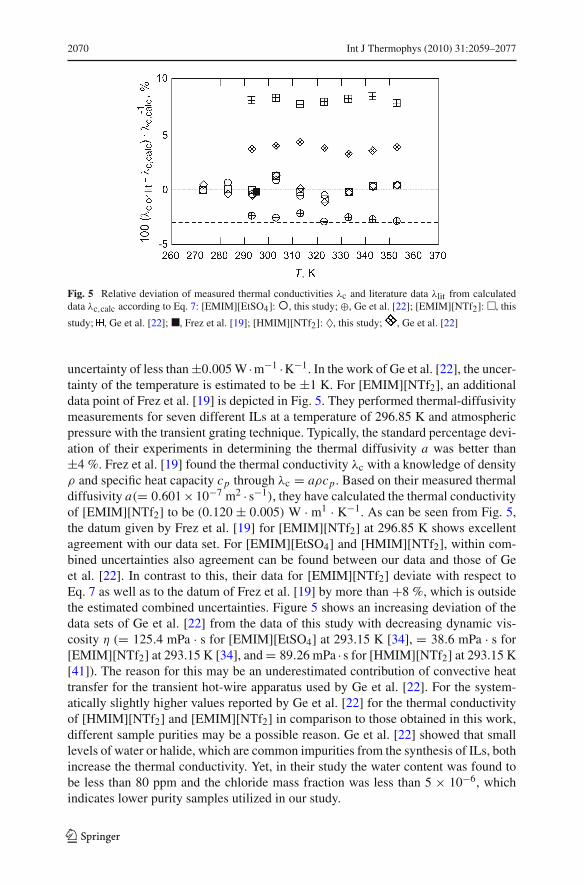
Fig. 5 Relative deviation of measured thermal conductivities λc and literature data λlit from calculateddata λc,calc according to Eq. 7: [EMIM][EtSO4]:�, this study; ⊕, Ge et al. [22]; [EMIM][NTf2]: �, this
study; , Ge et al. [22]; �, Frez et al. [19]; [HMIM][NTf2]: ♦, this study; , Ge et al. [22]
uncertainty of less than ±0.005 W ·m−1 ·K−1. In the work of Ge et al. [22], the uncer-tainty of the temperature is estimated to be ±1 K. For [EMIM][NTf2], an additionaldata point of Frez et al. [19] is depicted in Fig. 5. They performed thermal-diffusivitymeasurements for seven different ILs at a temperature of 296.85 K and atmosphericpressure with the transient grating technique. Typically, the standard percentage devi-ation of their experiments in determining the thermal diffusivity a was better than±4 %. Frez et al. [19] found the thermal conductivity λc with a knowledge of densityρ and specific heat capacity cp through λc = aρcp . Based on their measured thermaldiffusivity a(= 0.601×10⁻⁷ m2 · s−1), they have calculated the thermal conductivityof [EMIM][NTf2] to be (0.120 ± 0.005) W · m1 · K−1. As can be seen from Fig. 5,the datum given by Frez et al. [19] for [EMIM][NTf2] at 296.85 K shows excellentagreement with our data set. For [EMIM][EtSO4] and [HMIM][NTf2], within com-bined uncertainties also agreement can be found between our data and those of Geet al. [22]. In contrast to this, their data for [EMIM][NTf2] deviate with respect toEq. 7 as well as to the datum of Frez et al. [19] by more than +8 %, which is outsidethe estimated combined uncertainties. Figure 5 shows an increasing deviation of thedata sets of Ge et al. [22] from the data of this study with decreasing dynamic vis-cosity η (= 125.4 mPa · s for [EMIM][EtSO4] at 293.15 K [34], = 38.6 mPa · s for[EMIM][NTf2] at 293.15 K [34], and = 89.26 mPa · s for [HMIM][NTf2] at 293.15 K[41]). The reason for this may be an underestimated contribution of convective heattransfer for the transient hot-wire apparatus used by Ge et al. [22]. For the system-atically slightly higher values reported by Ge et al. [22] for the thermal conductivityof [HMIM][NTf2] and [EMIM][NTf2] in comparison to those obtained in this work,different sample purities may be a possible reason. Ge et al. [22] showed that smalllevels of water or halide, which are common impurities from the synthesis of ILs, bothincrease the thermal conductivity. Yet, in their study the water content was found tobe less than 80 ppm and the chloride mass fraction was less than 5 × 10⁻⁶, whichindicates lower purity samples utilized in our study.
123
Int J Thermophys (2010) 31:2059–2077 2071
3.2 Prediction of the Thermal Conductivity of ILs
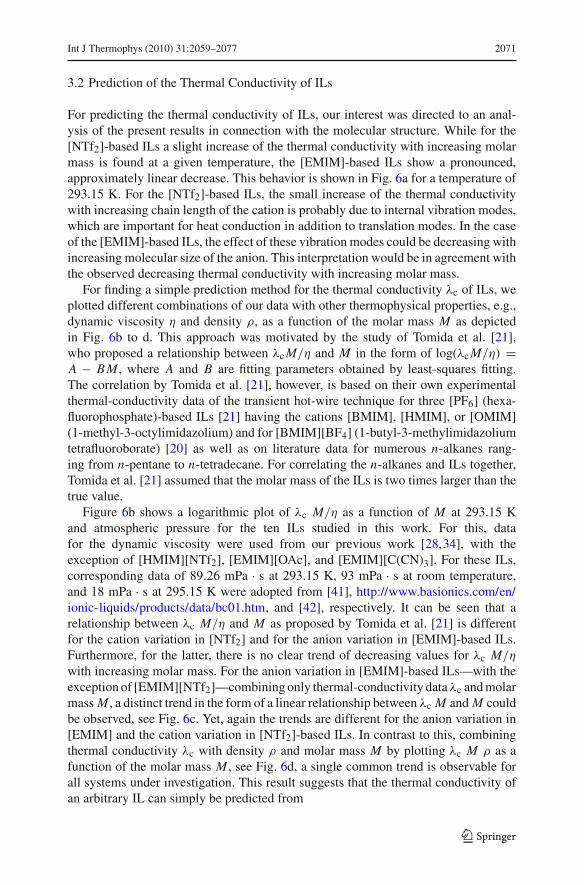
For predicting the thermal conductivity of ILs, our interest was directed to an anal-ysis of the present results in connection with the molecular structure. While for the[NTf2]-based ILs a slight increase of the thermal conductivity with increasing molarmass is found at a given temperature, the [EMIM]-based ILs show a pronounced,approximately linear decrease. This behavior is shown in Fig. 6a for a temperature of293.15 K. For the [NTf2]-based ILs, the small increase of the thermal conductivitywith increasing chain length of the cation is probably due to internal vibration modes,which are important for heat conduction in addition to translation modes. In the caseof the [EMIM]-based ILs, the effect of these vibration modes could be decreasing withincreasing molecular size of the anion. This interpretation would be in agreement withthe observed decreasing thermal conductivity with increasing molar mass.
For finding a simple prediction method for the thermal conductivity λc of ILs, weplotted different combinations of our data with other thermophysical properties, e.g.,dynamic viscosity η and density ρ, as a function of the molar mass M as depictedin Fig. 6b to d. This approach was motivated by the study of Tomida et al. [21],who proposed a relationship between λc M/η and M in the form of log(λc M/η) =A − B M , where A and B are fitting parameters obtained by least-squares fitting.The correlation by Tomida et al. [21], however, is based on their own experimentalthermal-conductivity data of the transient hot-wire technique for three [PF6] (hexa-fluorophosphate)-based ILs [21] having the cations [BMIM], [HMIM], or [OMIM](1-methyl-3-octylimidazolium) and for [BMIM][BF4] (1-butyl-3-methylimidazoliumtetrafluoroborate) [20] as well as on literature data for numerous n-alkanes rang-ing from n-pentane to n-tetradecane. For correlating the n-alkanes and ILs together,Tomida et al. [21] assumed that the molar mass of the ILs is two times larger than thetrue value.
Figure 6b shows a logarithmic plot of λc M/η as a function of M at 293.15 Kand atmospheric pressure for the ten ILs studied in this work. For this, datafor the dynamic viscosity were used from our previous work [28,34], with theexception of [HMIM][NTf2], [EMIM][OAc], and [EMIM][C(CN)3]. For these ILs,corresponding data of 89.26 mPa · s at 293.15 K, 93 mPa · s at room temperature,and 18 mPa · s at 295.15 K were adopted from [41], http://www.basionics.com/en/ionic-liquids/products/data/bc01.htm, and [42], respectively. It can be seen that arelationship between λc M/η and M as proposed by Tomida et al. [21] is differentfor the cation variation in [NTf2] and for the anion variation in [EMIM]-based ILs.Furthermore, for the latter, there is no clear trend of decreasing values for λc M/η
with increasing molar mass. For the anion variation in [EMIM]-based ILs—with theexception of [EMIM][NTf2]—combining only thermal-conductivity data λc and molarmass M , a distinct trend in the form of a linear relationship between λc M and M couldbe observed, see Fig. 6c. Yet, again the trends are different for the anion variation in[EMIM] and the cation variation in [NTf2]-based ILs. In contrast to this, combiningthermal conductivity λc with density ρ and molar mass M by plotting λc M ρ as afunction of the molar mass M , see Fig. 6d, a single common trend is observable forall systems under investigation. This result suggests that the thermal conductivity ofan arbitrary IL can simply be predicted from
123
2072 Int J Thermophys (2010) 31:2059–2077
Fig. 6 Thermal conductivity λc and its combination with further thermophysical properties for the studiedILs at T = 293.15 K and atmospheric pressure as a function of the molar mass M : (a) thermal conductivityλc; (b) product of thermal conductivity λc and molar mass M divided by dynamic viscosity η; (c) productof thermal conductivity λc and molar mass M ; and (d) product of thermal conductivity λc, molar mass M ,and density ρ; ♦, [EMIM][OAc]; �, [EMIM][N(CN)2]; × , [EMIM][C(CN)3]; +, [EMIM][MeOHPO2];�, [EMIM][EtSO4]; �, [EMIM][OcSO4]; �, [EMIM][NTf2];�, [HMIM][NTf2]; �, [BBIM][NTf2]; �,[OMA][NTf2]
123
Int J Thermophys (2010) 31:2059–2077 2073
λc,prediction Mρ = AM + B, (8)
where the parameters A = 0.1130 g · cm−3 · W · m−1 · K−1 and B = 22.65 g2 ·cm−3 · W · m−1 · K−1 · mol−1 were obtained by least-squares fitting of our results ata temperature of 293.15 K and atmospheric pressure. For a quantitative prediction ofthe thermal conductivity in units of W · m−1 · K−1 by Eq. 8, the molar mass M anddensity ρ have to be used in units of g · mol−1 and g · cm−3. For all ILs studied in thiswork, the standard percentage deviation and mean absolute percentage deviation of theexperimental thermal-conductivity data at a temperature of 293.15 K and atmosphericpressure from those calculated with Eq. 8 are 5.5 and 4.6. For [EMIM][EtSO4], a max-imum relative deviation of 10.2 % is found. Due to the low temperature dependenceof the thermal conductivity in the studied temperature range, no reasonable correla-tion for this dependence in connection with the molecular structure could be found.The simple prediction method suggested here, however, seems to be able to providevaluable tendencies for the thermal conductivity of arbitrary ILs in the temperaturerange considered here.
For setting up Eq. 8, density data provided in our former studies [28,36] could beused, except for [EMIM][OAc], [EMIM][C(CN)3], and [HMIM][NTf2]. For the lat-ter, densities were measured within this study using the vibrating-tube method with anestimated expanded relative uncertainty (k = 2) of less than ±0.02 %. More details onthe method and the used instrument (DMA 5000, Anton Paar) can be found in [28,36].The measurements were performed at atmospheric pressure starting from (273.15 to363.15) K in steps of 5 K. The density data are given in Table 6 and were correlatedwith second-order polynomial functions,
ρcalc = ρ0 + ρ1T + ρ2T 2. (9)
Table 7 shows the correlation coefficients ρ0, ρ1, and ρ2 as well as the standard percent-age deviation (rms) of the experimental density data to the fit. The resulting rms valueswere distinctly smaller than the relative uncertainty for the density measurements.
To the best of our knowledge, no density data for [EMIM][OAc] and [EMIM][C(CN)3] are available in the literature to date. [HMIM][NTf2] is an IUPAC ref-erence substance, for which densities were measured in a round-robin study usinghigh-purity samples from the same batch with a nominal purity of >99.5 % on a molarbasis [43,44]. The recommended values were expressed by a linear equation for thetemperature range from (258 to 373) K. For all temperatures, the combined expandeduncertainty (k = 2) of this equation was estimated to be 0.1 % [44]. In addition, itwas shown that the deviations of nearly all further data sets available in the literatureare negative. This was mainly attributed to impurities in the corresponding samples.The presented deviations from the IUPAC equation range from about (+0.05 % to−0.6) %, and one datum even deviates by more than −1.2 % [44]. The deviations ofother recent density data for [HMIM][NTf2] provided by Jacquemin et al. [45], Tariqet al. [46], and Ahosseini et al. [47] are in the range between (−0.03 and −0.24) %.Our data presented in Table 6 deviates by (−0.50 to −0.58) % from the equation rec-ommended in the IUPAC study, which is distinctly outside the combined uncertainties.As the calibration of our densimeter was successfully checked with deionized water
123
2074 Int J Thermophys (2010) 31:2059–2077
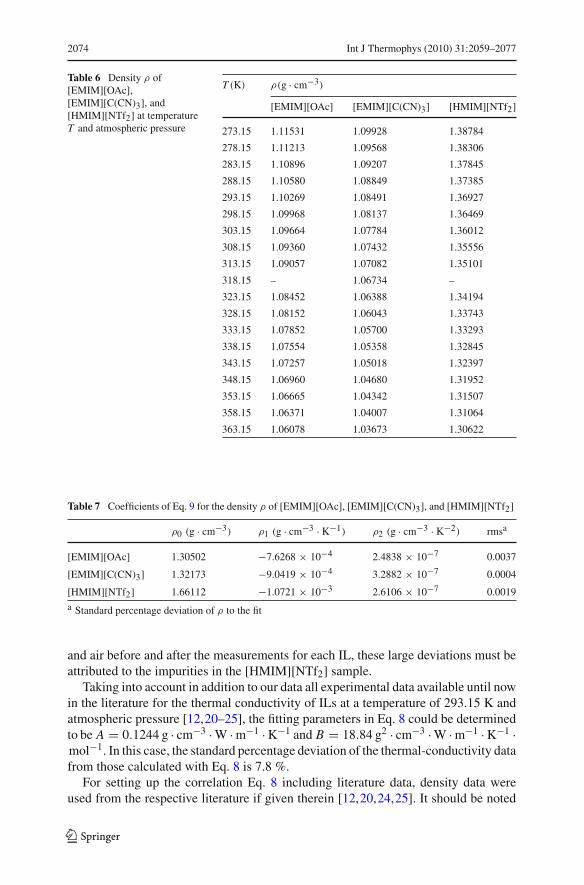
Table 6 Density ρ of[EMIM][OAc],[EMIM][C(CN)3], and[HMIM][NTf2] at temperatureT and atmospheric pressure
T (K) ρ(g · cm−3)
[EMIM][OAc] [EMIM][C(CN)3] [HMIM][NTf2]
273.15 1.11531 1.09928 1.38784
278.15 1.11213 1.09568 1.38306
283.15 1.10896 1.09207 1.37845
288.15 1.10580 1.08849 1.37385
293.15 1.10269 1.08491 1.36927
298.15 1.09968 1.08137 1.36469
303.15 1.09664 1.07784 1.36012
308.15 1.09360 1.07432 1.35556
313.15 1.09057 1.07082 1.35101
318.15 – 1.06734 –
323.15 1.08452 1.06388 1.34194
328.15 1.08152 1.06043 1.33743
333.15 1.07852 1.05700 1.33293
338.15 1.07554 1.05358 1.32845
343.15 1.07257 1.05018 1.32397
348.15 1.06960 1.04680 1.31952
353.15 1.06665 1.04342 1.31507
358.15 1.06371 1.04007 1.31064
363.15 1.06078 1.03673 1.30622
Table 7 Coefficients of Eq. 9 for the density ρ of [EMIM][OAc], [EMIM][C(CN)3], and [HMIM][NTf2]
ρ0 (g · cm−3) ρ1 (g · cm−3 · K−1) ρ2 (g · cm−3 · K−2) rmsa
[EMIM][OAc] 1.30502 −7.6268 × 10⁻⁴ 2.4838 × 10⁻⁷ 0.0037
[EMIM][C(CN)3] 1.32173 −9.0419 × 10⁻⁴ 3.2882 × 10⁻⁷ 0.0004
[HMIM][NTf2] 1.66112 −1.0721 × 10⁻³ 2.6106 × 10⁻⁷ 0.0019a Standard percentage deviation of ρ to the fit
and air before and after the measurements for each IL, these large deviations must beattributed to the impurities in the [HMIM][NTf2] sample.
Taking into account in addition to our data all experimental data available until nowin the literature for the thermal conductivity of ILs at a temperature of 293.15 K andatmospheric pressure [12,20–25], the fitting parameters in Eq. 8 could be determinedto be A = 0.1244 g · cm−3 · W · m−1 · K−1 and B = 18.84 g2 · cm−3 · W · m−1 · K−1 ·mol−1. In this case, the standard percentage deviation of the thermal-conductivity datafrom those calculated with Eq. 8 is 7.8 %.
For setting up the correlation Eq. 8 including literature data, density data wereused from the respective literature if given therein [12,20,24,25]. It should be noted
123
Int J Thermophys (2010) 31:2059–2077 2075
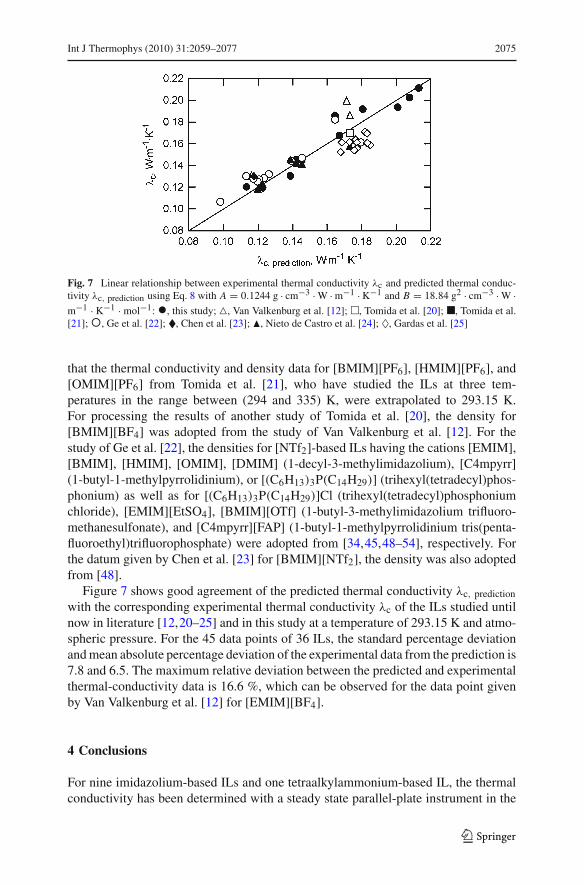
Fig. 7 Linear relationship between experimental thermal conductivity λc and predicted thermal conduc-tivity λc, prediction using Eq. 8 with A = 0.1244 g · cm−3 · W · m−1 · K−1 and B = 18.84 g2 · cm−3 · W ·m−1 · K−1 · mol−1: �, this study; �, Van Valkenburg et al. [12]; �, Tomida et al. [20]; �, Tomida et al.[21];�, Ge et al. [22]; �, Chen et al. [23]; �, Nieto de Castro et al. [24]; ♦, Gardas et al. [25]
that the thermal conductivity and density data for [BMIM][PF6], [HMIM][PF6], and[OMIM][PF6] from Tomida et al. [21], who have studied the ILs at three tem-peratures in the range between (294 and 335) K, were extrapolated to 293.15 K.For processing the results of another study of Tomida et al. [20], the density for[BMIM][BF4] was adopted from the study of Van Valkenburg et al. [12]. For thestudy of Ge et al. [22], the densities for [NTf2]-based ILs having the cations [EMIM],[BMIM], [HMIM], [OMIM], [DMIM] (1-decyl-3-methylimidazolium), [C4mpyrr](1-butyl-1-methylpyrrolidinium), or [(C6H13)3P(C14H29)] (trihexyl(tetradecyl)phos-phonium) as well as for [(C6H13)3P(C14H29)]Cl (trihexyl(tetradecyl)phosphoniumchloride), [EMIM][EtSO4], [BMIM][OTf] (1-butyl-3-methylimidazolium trifluoro-methanesulfonate), and [C4mpyrr][FAP] (1-butyl-1-methylpyrrolidinium tris(penta-fluoroethyl)trifluorophosphate) were adopted from [34,45,48–54], respectively. Forthe datum given by Chen et al. [23] for [BMIM][NTf2], the density was also adoptedfrom [48].
Figure 7 shows good agreement of the predicted thermal conductivity λc, predictionwith the corresponding experimental thermal conductivity λc of the ILs studied untilnow in literature [12,20–25] and in this study at a temperature of 293.15 K and atmo-spheric pressure. For the 45 data points of 36 ILs, the standard percentage deviationand mean absolute percentage deviation of the experimental data from the prediction is7.8 and 6.5. The maximum relative deviation between the predicted and experimentalthermal-conductivity data is 16.6 %, which can be observed for the data point givenby Van Valkenburg et al. [12] for [EMIM][BF4].
4 Conclusions
For nine imidazolium-based ILs and one tetraalkylammonium-based IL, the thermalconductivity has been determined with a steady state parallel-plate instrument in the
123
2076 Int J Thermophys (2010) 31:2059–2077
temperature range between (273.15 and 353.15) K at atmospheric pressure with anuncertainty of ±3 %. The thermal conductivity of the ILs is only weakly dependenton temperature. The decrease of the thermal conductivity with increasing temperaturecan well be represented by a linear correlation. For the anion variation in [EMIM]-based ILs, the thermal conductivity decreases with the size of the anion. For the cationvariation in [NTf2]-based ILs, the thermal conductivity increases somewhat with thesize of the cation. Thus, for the dependence of the thermal conductivity of ILs on theirmolar mass, two different trends are observable. For all ILs, the thermal conductivitycould be predicted from a linear relation between thermal conductivity, molar mass,and density. The simple prediction represents all experimental thermal-conductivitydata available in the literature until now with a standard deviation of less than 8 %.Thus, it seems to conveniently provide reliable estimates for the thermal conductivityof arbitrary ILs.
Acknowledgments This work was supported by the German Research Foundation (DeutscheForschungsgemeinschaft, DFG) by funding the Erlangen Graduate School in Advanced Optical Technolo-gies (SAOT) within the German Excellence Initiative and via the DFG-SPP1191 priority program, grantsFR 1709/9-1 and WA 1615/8-2, and by the Max-Buchner-Forschungsstiftung. We thank Solvent Innova-tion GmbH, Germany, BASF AG, Germany, and Lonza Cologne AG, Germany, for providing some of theinvestigated ILs.
References
1. T. Torimoto, T. Tsuda, K. Okazaki, S. Kuwabata, Adv. Mater. 22, 1196 (2010)2. M. Armand, F. Endres, D.R. MacFarlane, H. Ohno, B. Scrosati, Nat. Mater. 8, 621 (2009)3. J.F. Wishart, Energy Environ. Sci. 2, 956 (2009)4. N.V. Plechkova, K.R. Seddon, Chem. Soc. Rev. 37, 123 (2008)5. O.A. El Seoud, A. Koschella, L.C. Fidale, S. Dorn, T. Heinze, Biomacromolecules 8, 2629 (2007)6. H. Zhao, Chem. Eng. Commun. 193, 1660 (2006)7. C. Chiappe, D. Pieraccini, J. Phys. Org. Chem. 18, 275 (2005)8. P. Wasserscheid, W. Keim, Angew. Chem. Int. Ed. 39, 3772 (2000)9. C. Jork, C. Kristen, D. Pieraccini, A. Stark, C. Chiappe, Y.A. Beste, W. Arlt, J. Chem. Thermo-
dyn. 37, 537 (2005)10. H. Sakaebe, H. Matsumoto, K. Tatsumi, Electrochim. Acta 53, 1048 (2007)11. A.-E. Jiménez, M.-D. Bermúdez, Tribol. Lett. 26, 53 (2007)12. M.E. Van Valkenburg, R.L. Vaughn, M. Williams, J.S. Wilkes, Thermochim. Acta 425, 181 (2005)13. J.S. Wilkes, in Ionic Liquids in Synthesis, ed. by P. Wasserscheid, T. Welton (Wiley-VCH, Weinheim,
2003), p. 214. K. Tochigi, H. Yamamoto, J. Phys. Chem. C 111, 15989 (2007)15. S. Zhang, N. Sun, X. He, X. Lu, X. Zhang, J. Phys. Chem. Ref. Data 35, 1475 (2006)16. M. Deetlefs, K.R. Seddon, M. Shara, Phys. Chem. Chem. Phys. 8, 642 (2006)17. R.L. Gardas, J.A.P. Coutinho, AIChE J. 55, 1274 (2009)18. J.M.P. França, C.A. Nieto de Castro, M.M. Lopes, V.M.B. Nunes, J. Chem. Eng. Data 54, 2569 (2009)19. C. Frez, G.J. Diebold, C.D. Tran, S. Yu, J. Chem. Eng. Data 51, 1250 (2006)20. D. Tomida, S. Kenmochi, T. Tsukada, C. Yokoyama, Netsu Bussei 20, 173 (2006)21. D. Tomida, S. Kenmochi, T. Tsukada, K. Qiao, C. Yokoyama, Int. J. Thermophys. 28, 1147 (2007)22. R. Ge, C. Hardacre, P. Nancarrow, D.W. Rooney, J. Chem. Eng. Data 52, 1819 (2007)23. H. Chen, Y. He, J. Zhu, H. Alias, Y. Ding, P. Nancarrow, C. Hardacre, D. Rooney, C. Tan, Int. J.
Heat Fluid Flow 29, 149 (2008)24. C.A. Nieto de Castro, M.J.V. Lourenço, A.P.C. Ribeiro, S.I.C. Vieira, P. Goodrich, C. Hardacre,
J. Chem. Eng. Data 55, 653 (2010)
123
Int J Thermophys (2010) 31:2059–2077 2077
25. R.L. Gardas, R. Ge, P. Goodrich, C. Hardacre, A. Hussain, D.W. Rooney, J. Chem. Eng. Data55, 1505 (2010)
26. F. Maier, J.M. Gottfried, J. Rossa, D. Gerhard, P.S. Schulz, W. Schwieger, P. Wasserscheid,H.-P. Steinrück, Angew. Chem. Int. Ed. 45, 7778 (2006)
27. S. Himmler, S. Hörmann, R. van Hal, P.S. Schulz, P. Wasserscheid, Green Chem. 8, 887 (2006)28. B. Hasse, J. Lehmann, D. Assenbaum, P. Wasserscheid, A. Leipertz, A.P. Fröba, J. Chem. Eng. Data
54, 2576 (2009)29. J.H. Davis, C.M. Gordon Jr., C. Hilgers, P. Wasserscheid, in Ionic Liquids in Synthesis, ed. by
P. Wasserscheid, T. Welton (Wiley-VCH, Weinheim, 2006), p. 730. Ya.M. Naziev, M.M. Bashirov, I.M. Abdulagatov, Fluid Phase Equilib. 226, 221 (2004)31. R. Braun, S. Fischer, A. Schaber, Wärme Stoffübertrag. 17, 121 (1983)32. M. Kohler, Z. Angew. Phys. 18, 356 (1965)33. H. Poltz, Int. J. Heat Mass Transf. 8, 515 (1965)34. A.P. Fröba, H. Kremer, A. Leipertz, J. Phys. Chem. B 112, 12420 (2008)35. M.L.V. Ramires, C.A. Nieto de Castro, R.A. Perkins, Y. Nagasaka, A. Nagashima, M.J. Assael,
W.A. Wakeham, J. Phys. Chem. Ref. Data 29, 133 (2000)36. A.P. Fröba, M.H. Rausch, K. Krzeminski, A. Leipertz, Int. J. Heat Mass Transfer (to be submitted)
(2011)37. R.L. Rowley, S.-C. Yi, D.V. Gubier, J.M. Stoker, J. Chem. Eng. Data 33, 362 (1988)38. C.A. Nieto de Castro, J.C.G. Calado, W.A. Wakeham, M. Dix, J. Phys. E 9, 1073 (1976)39. H. Watanabe, H. Kato, J. Chem. Eng. Data 49, 809 (2004)40. M.J. Assael, E. Charitidou, C.A. Nieto de Castro, Int. J. Thermophys. 9, 813 (1988)41. J.A. Widegren, J.W. Magee, J. Chem. Eng. Data 52, 2331 (2007)42. Y. Yoshida, K. Muroi, A. Otsuka, G. Saito, M. Takahashi, T. Yoko, Inorg. Chem. 43, 1458 (2004)43. K.N. Marsh, J.F. Brennecke, R.D. Chirico, M. Frenkel, A. Heintz, J.W. Magee, C.J. Peters,
L.P.N. Rebelo, K.R. Seddon, Pure Appl. Chem. 81, 781 (2009)44. R.D. Chirico, V. Diky, J.W. Magee, M. Frenkel, K.N. Marsh, Pure Appl. Chem. 81, 791 (2009)45. J. Jacquemin, R. Ge, P. Nancarrow, D.W. Rooney, M.F. Costa Gomes, A.A.H. Pádua, C. Hardacre,
J. Chem. Eng. Data 53, 716 (2008)46. M. Tariq, P.A.S. Forte, M.F. Costa Gomes, J.N. Canongia Lopes, L.P.N. Rebelo, J. Chem. Thermo-
dyn. 41, 790 (2009)47. A. Ahosseini, B. Sensenich, L.R. Weatherley, A.M. Scurto, J. Chem. Eng. Data 55, 1611 (2010)48. K.R. Harris, M. Kanakubo, L.A. Woolf, J. Chem. Eng. Data 52, 1080 (2007)49. J.M.S.S. Esperança, H.J.R. Guedes, J.N.Ganongia Lopes, L.P.N. Rebelo, J. Chem. Eng.
Data 53, 867 (2008)50. R.L. Gardas, M.G. Freire, P.J. Carvalho, I.M. Marrucho, I.M.A. Fonseca, A.G.M. Ferreira,
J.A.P. Coutinho, J. Chem. Eng. Data 52, 1881 (2007)51. L.I.N. Tome, P.J. Carvalho, M.G. Freire, I.M. Marrucho, I.M.A. Fonseca, A.G.M. Ferreira,
J.A.P. Coutinho, R.L. Gardas, J. Chem. Eng. Data 53, 1914 (2008)52. R.L. Gardas, H.F. Costa, M.G. Freire, P.J. Carvalho, I.M. Marrucho, I.M.A. Fonseca, A.G.M. Ferreira,
J.A.P. Coutinho, J. Chem. Eng. Data 53, 805 (2008)53. J.M.S.S. Esperança, H.J.R. Guedes, M. Blesic, L.P.N. Rebelo, J. Chem. Eng. Data 51, 237 (2006)54. R.L. Gardas, M.G. Freire, P.J. Carvalho, I.M. Marrucho, I.M.A. Fonseca, A.G.M. Ferreira,
J.A.P. Coutinho, J. Chem. Eng. Data 52, 80 (2007)
123