Embed Size (px)
Citation preview
NASA CR-159164
(NASA-CR-159164) THELINOPHYSTCAL PROPEBTISS N80-14197 DATA 08 CR?iPRI'IE/POLYIHIDE CCRPOSITE tlATERIALS F i n a l Report (General Bpnamics/Convair) 6q p HC AOU/HP A01 nncl as
CSCL 1 ID G3/24 46484
THERMOPHYSICAL PROPERTIES DATA ON GRAPYITE/POLYIMIDE COMPOSITE MATERIALS
GENEK.4 L D YN.-IAIICS C0NI':lIR DIVISION P.O. BOX 808.1 7 , M Z 43 6332 Si1N DIECO. C.lLIFOKNl.4 41158
CONTRACT N.4S 1-1 5 103
NOVEMBER 1979
Langley Research Center ti,1!11~1!r~n V 1 r ~ 1 1 t i 1 , i :: <,,t',:,
If:, do 1 )I,'; \OtY>
https://ntrs.nasa.gov/search.jsp?R=19800005940 2018-07-20T18:15:36+00:00Z
ABSTRACT
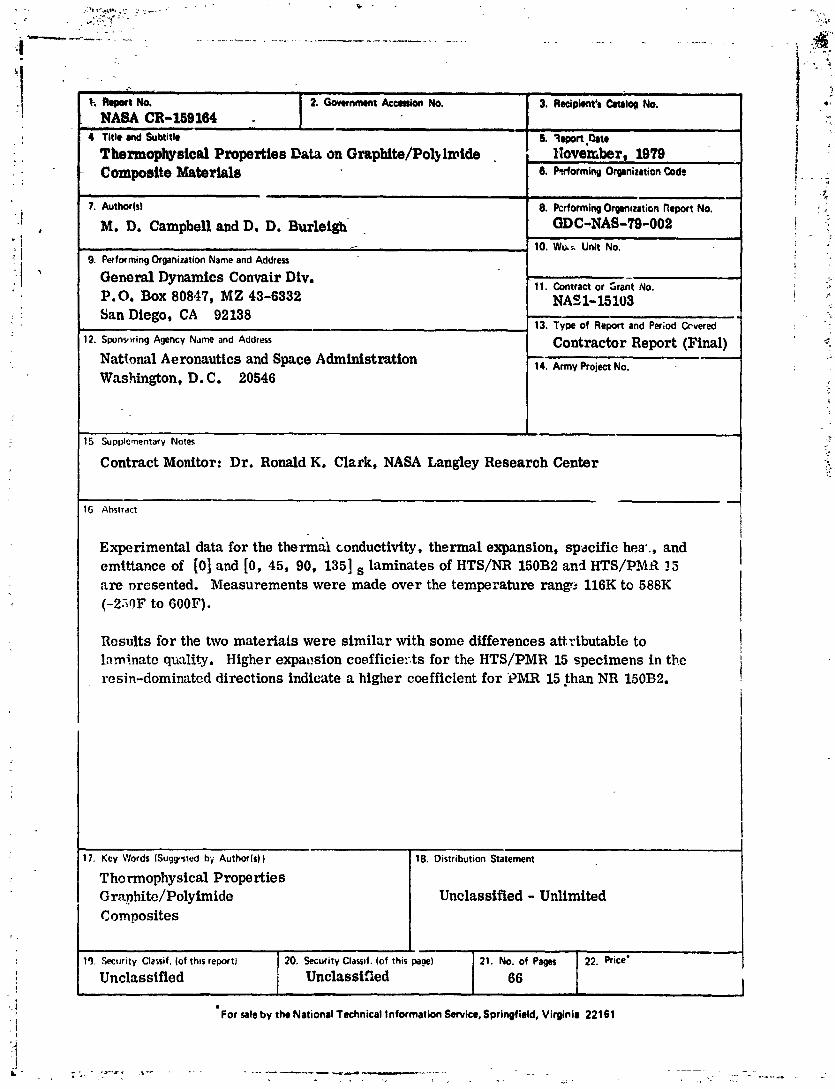
Experimental data for the thermal conductivity, thermal expansion, specific hat, and emithncc of [01 and 10, 45, 90, 1351, laminates of HTS/NR 150B2 and ETSDMR 15 ore presented. Measurements werc made over the temperature range 116K to 588K (-25OF to GGOF).
Results for the two materials were similar with some differences attributable to laminate quality. Higher expansim coefficicnts for the HTS/PMR 15 specimens in the resin-dominated directions indicate a higher cae.Xcient for PMR 15 than NR 150B2.
THERMOPHY SICAL' PROPERTE S DATA ON
GRAPHITEiPOLYIMIDE COMPOSITE MATERIALS
Malcolm D. Campbell and Douglas D. Burleigh
General Dynamics, Convair Division
SUMhl ARY
Measurements of the thermal properties of HTS/NR 150B2 a d HTS/PMR 15 laminates were made over the temperature range l lGK to 5881C (-250°F to 60O0F). Properties investigated included thermal conductivity, thermal expansion, specific heat and emittance. JAYUPS of [O] and [O, 45, 90, 1351, were measured in two directiom for both materials.
Both materials produced somewhat poorer quality laminates than generally achievable \nth lower temperature resins such as epoxies. This is typical of these systems at this time. It was expected that, for a given layup and direction, results mould be comparable for the two materials. In general, this was the case with some diffcrcnces ~ttribl-ltable to laminate quality rather than diffcrcnces in basic materials pmycrtics. H o m c ~ x , higher cxpansion coefficicnts for the HTS/PMR 15 specimens in the rcsin- eominatcd directions indicate a highcr coefficient for PMR 15 than NR 150B3. Eratic variatiotls in thermal cxpansion results from thc same specimen were obscrred at times. Althouzh these were tentatively attrilnltcd to laminate quality, additional war!; is ncccssary to fi~lly understand this bchavior.
INTRODUCTION
Graphite fiber reinforced polyimide composites are a potential solution to the need for high temperature organic matrix composites for aerospace applicattons. Being relatively new in the world of composites, their thermal properties are not well known.
The pwpose of this program was to conduct a preliminary investigation of the thermal c?rpansion, thermal conductivity, specific heat and emittame of two prominent graphite/ polyimides. 1
The work was performed in the Physical Properties Laboratories at General Dynamics Convair Division's Kearny Mesa Plant, S n Diqo , CA and was sponsored by NASA Langley Research Center under Contract No. NAS-1-15103.
The NASA Technical Monitor was Dr. Ronald K. Clark; Program Manager was Malcolm D. Campbell.
- 'certain commnrcinl materiais ;lime idcntifkd in this report in order to specify ;,4cqi1:1?~'.~: 1.vhich m dcri:~is wcrc itiv::sti.qt~:d in :,h? rcscarch effort. ' In no Pasn ('99:; S I I P ~ Iclentificiition imply recommendation o r endorsement of the product b:; M S A , nor does it imply that the mateiials a rc necessarily the only ones o r the best ones available for the purpose.
TEST MATERIALS
Measurements were made on two materials, cdch in a [O, 45, 90, 1351 quasi-isotroptc Iayup and in a unidirectional layup.
The HTS/PMR 15 panels were furnished to thc program by NASA Langley Research Centcr. The HTS/NR 150B2 pancls werc fabricated by General Dynamics, Convair Division. As a check of laminate quality, resin content and tensile strength werc mcasured for both layups of both materials. Results are shown i n Table 1.
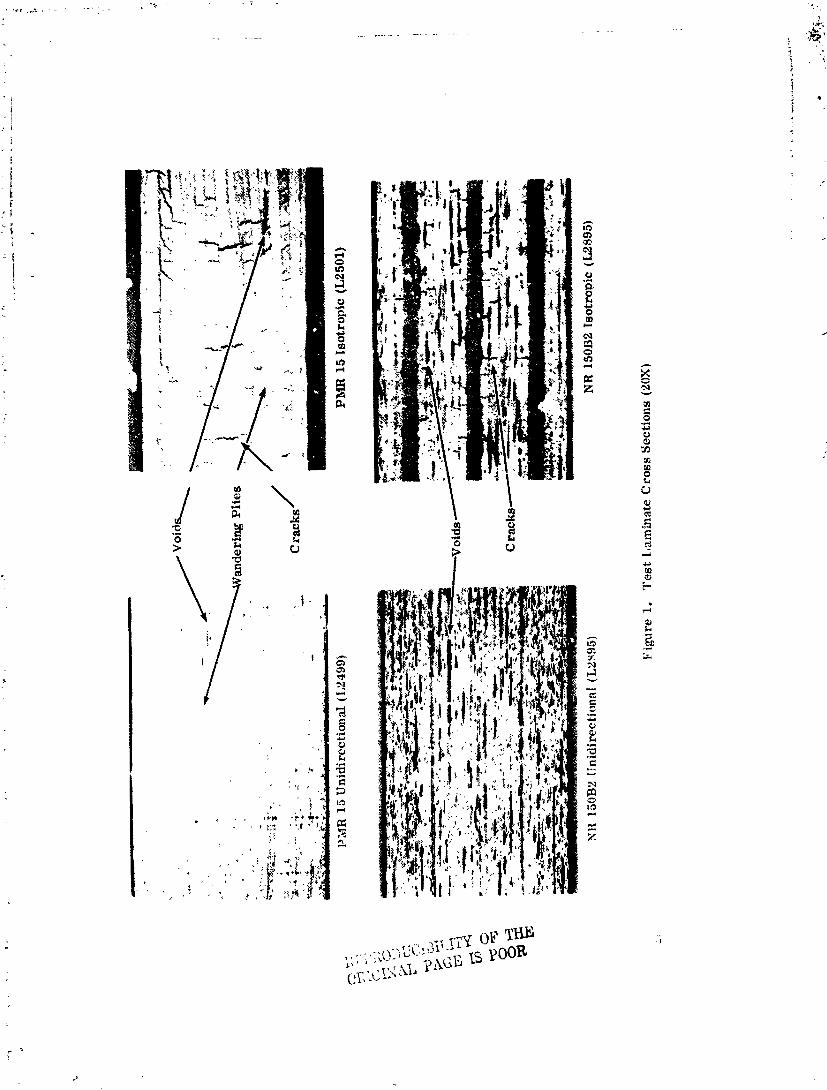
Figures 1 shows c r o s s sections of both layups of both materials at 20x. These were all takcn from thermal expansion specimens after testing. Both materials showed extensive mi~roc rack i :~g in the quasi-isotopic hyup. Samples of untested material (no thermal cycle exposure) werc also examined and appearcd similar. Void content of the HTS/ PMR 15 panels was low; void content as high in the HTS/NR 150B2 panels.
Compared to laminates made with lower temperature resins such as epoxies, individnal plies in both materials wandered considerably. The photos in Figure 1 show arms where tSe plies are significantly unpamllel. It is assumed that this effect is caused by the relatively poor impregnation of the yarn by the matrix in the pre-preg, L e e , the resin is lying on the surface of the yarn rather than being homogeneously distributed with the f h r s .
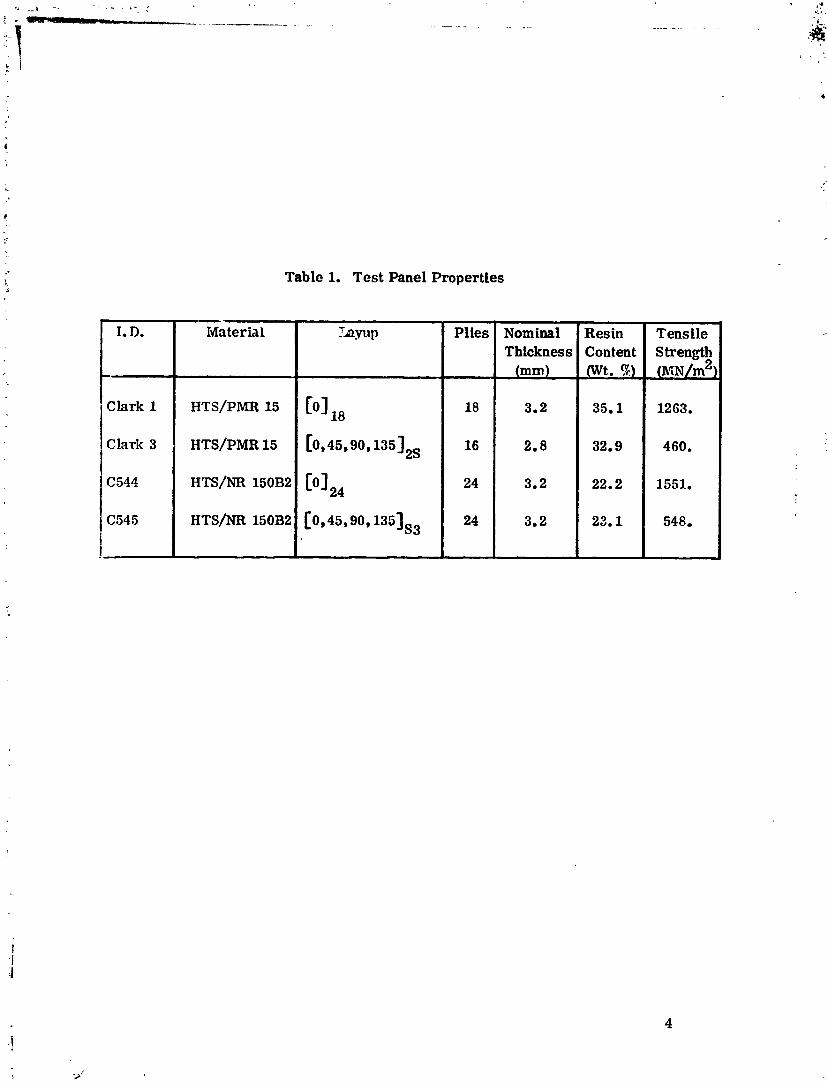
Table 1. Test Panel Properties
I. D.
Clark 1
C 1-ark 3
Idaterial
HTS/PMR 15
HTS/PMR 15
Resin Content (Wt. $1
35.1
32.9
22.2
23.1
Plies
18
16
24
24
Tensile Strength (nm/m2
1263.
460.
1551.
548.
Nominal Thickness (mm)
3.2
2.8
3.2
3.2
TEST MATRIX AND M ETIIODS
Table 2 shows a matrix of the tests performed. Designations of test directions corres- pond to those commonly used to designate principle axes of a laminate, i.e., X is parallel to the planes of the plies and in the direction of the 0. fibers;Y is parallel to the planes of the plies and normal to the 0. fibers; Z is normal to the plies.
Thermal Conductivity
Differences in thermal conductivities of the materials between test directions parallel to and across the high conductivity graphite fibers required two test methods. The high conductivities were in the X directions of both the unidirectional and luasi-isotropic layups. Conductivities were low in the Y direction of the unidirectional !a):ws and in the Z direction of the isotropic layups.
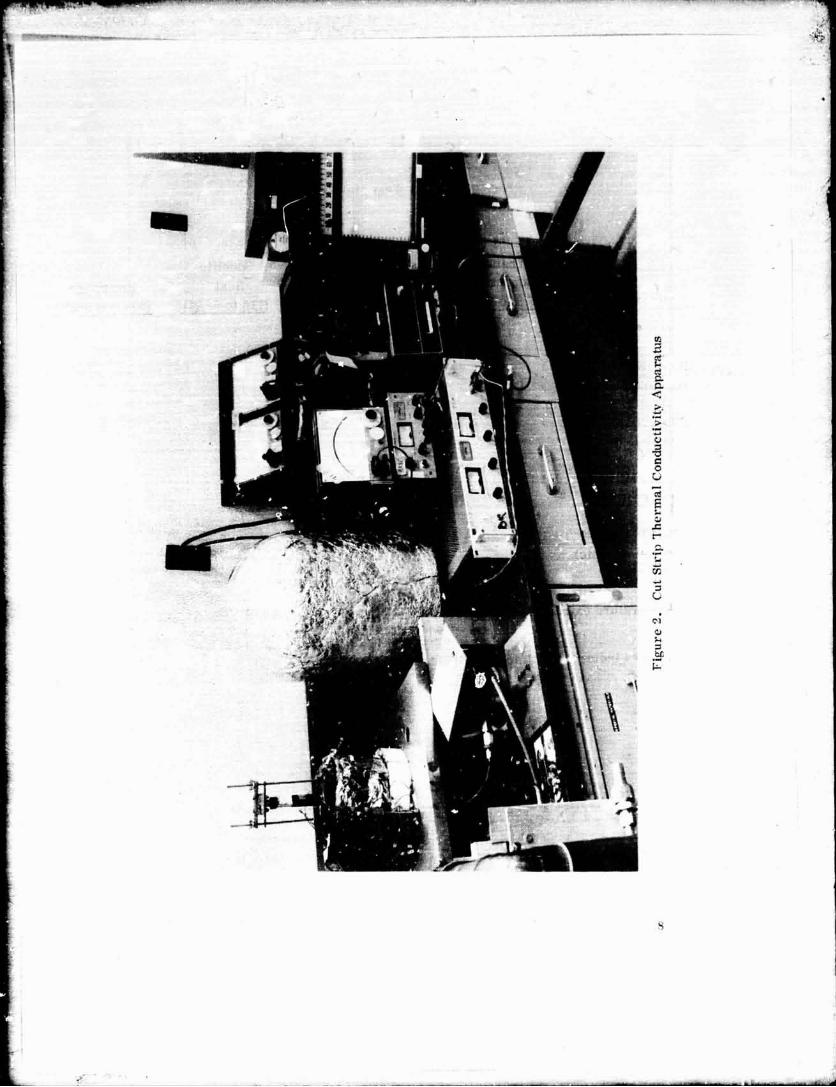
For the X directions, the cut strip apparatus shown in Figures 2 and 3 was used. IL this method, a test specimen is built up from alternate strips of the material under test and a standard material. One end of the stack is attached to a heat sink through an electrically heated plate. A second heater is attached to the free end. Thermocouples a r e installed in each segment. The entire assembly is radiation-shielded and maintained in a high vacuum to minimize heat losses. The heat sink is cooled by LN2.
Measurements are made by establishing the desired mean temperature and a temperature riiffcrcntial of approximately 6 to 20K across the stack with the two heaters. When cquilibril-~rn is reached, the temperature differences across the specimen aud t ! ~ standards a r e recorded.
Thermal conductivity is then calculatcd using the relationship:
I< =I; (AT /AT )(X /X )(A /A ) X S S x x s x x
K = thermal conductivity of test material X
K = thermal conductivity of standard material S
AT = temperature differencc across standards (average of two) s
AT = temperature differencc across test specimen X
X = distance between thermocouples on standards (average of two) S
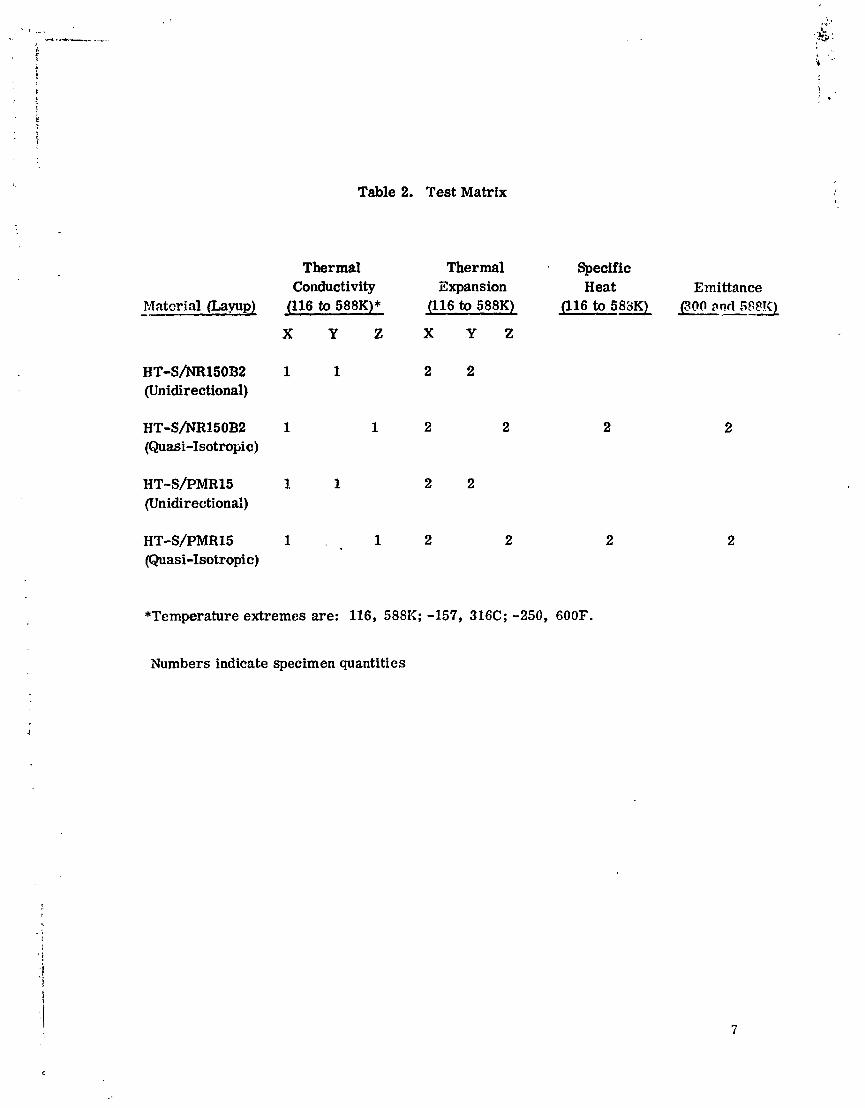
Mntcrid (Layup) -
HT-SJM15OB2 (Unidirectional)
HT-S/NRl5OB2 (Quasi-Isotropic)
HT-S/PMR15 (Unidirectional)
HT-S/pMR15 (Quasi-Isotropic)
Table 2. Test Matrix
Thermal Thermal Specific Conductivity Expansion Heat Emittance
(116 to 588K)* j l l 6 to 588K) (116 to 588K) $300 3 r d Sw - X Y z X Y Z
*Temperature extremes are: 116, 588K; -157, 316C; -250, 600F.
Numbers indicate specimen quantities
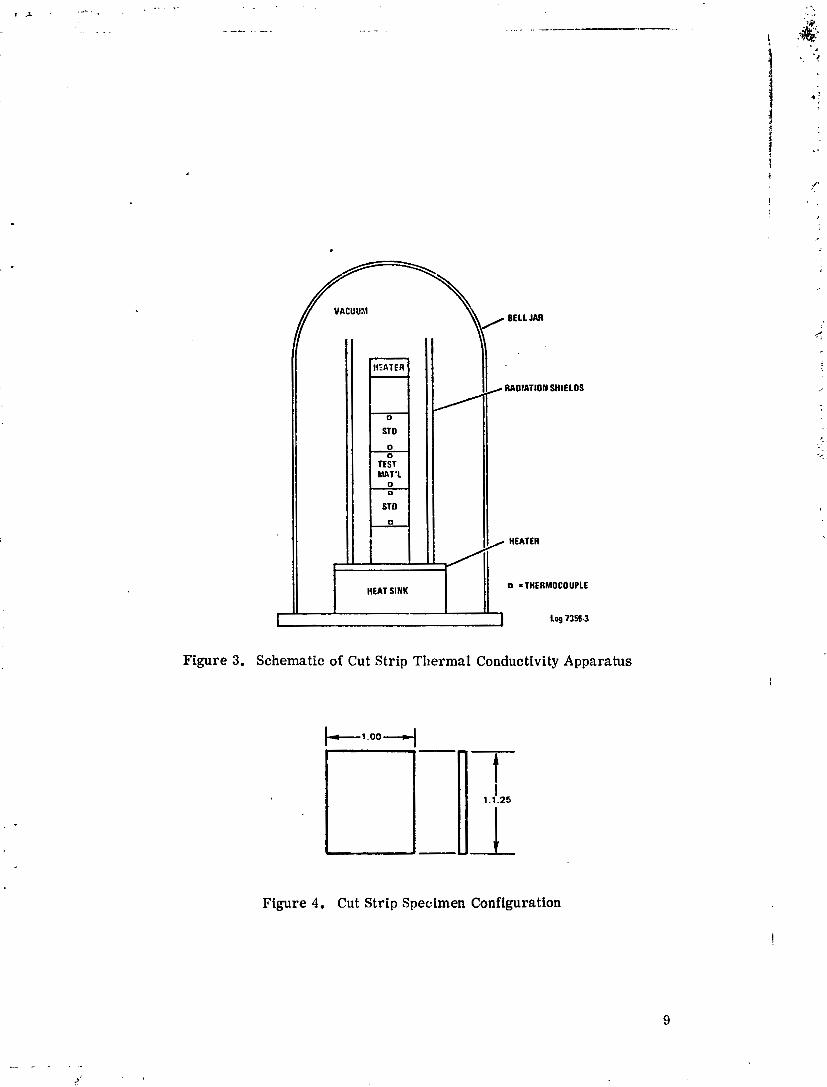
BELL JAR
RAOlATlOlD SHIELDS
) HEATER
0 =THERMOCOUPLE
Figure 3. Schematic of Cut Strip Thermal Conductivity Apparatus
Figure 4. Cut Strip Specimen Configuration
X = distance between thermocouples on test specimen X
A = cross-sectional area of standards (average of two) S
A = cross-sectional area of test specimen X
The test specimen configuration is shown in Figure 4. Standards for each measurement were chosen to produce AT'S comparable to those across the test material to m i~ imize errors due to unequal heat losses. Standards were machined from 321'steel certiliecl and calibrated by NBS. Overall accuracy of the measurement is estimated to be within ~ 5 % over the full temperature range.
Thsrmal conductivity data was taken at mean temperatures of approximately 116, 180, 245, 310, 375, 440, 505 and 569K.
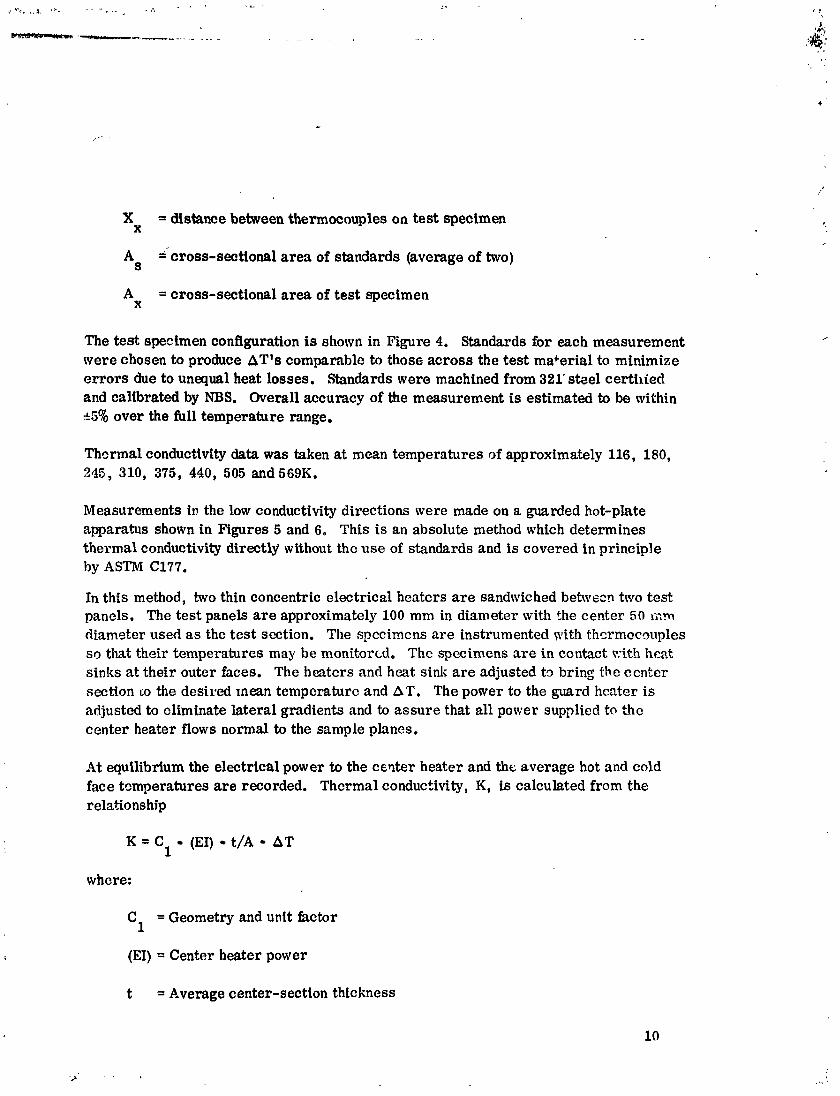
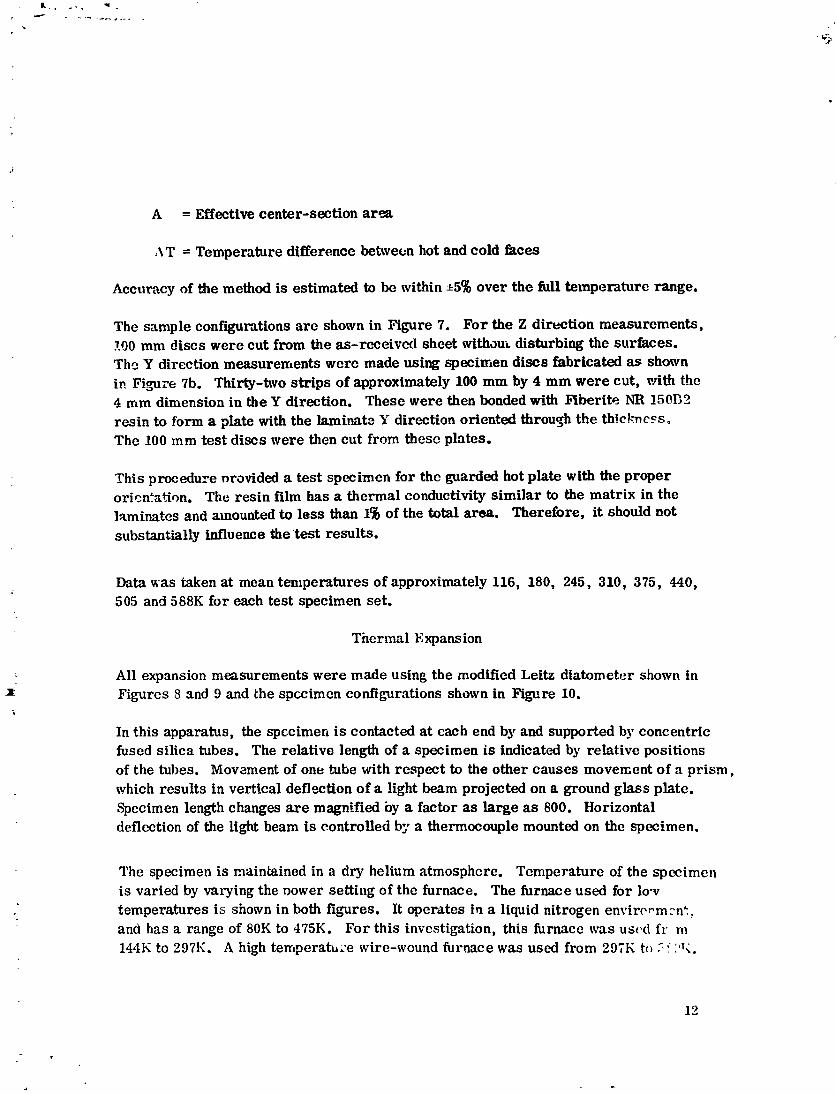
Measurements in the low conductivity directions were made on a guarded hot-plate apparatus shown in Figures 5 and 6, This is an absolute method which determines thermal conductivity directly' without thc use of standards and is covered in principle by ASTM C177.
In this method, two thin concentric electrical heaters a r e sandwiched between two test panels. The test panels a r e approximately 100 mm in diameter with the center 50 diameter used a s the test section. The spccimens a re instrumented with thsrmccouples so that their temperatures may be monitored. The specimens a r e in contact ~ i t h hcat sinks at, their outer faces. The heaters and heat sink a r e adjusted t~ bring the ccnter section to the desired m a n tempcraturc and AT. The power to the guard heater is adjusted to eliminate lateral gradients and to assure that all power supplied to the center heater flows normal to the sample planes.
.4t equilibrium the electrical power to the center heater and the average hot and cold face temperatures a re recorded. Thcrmal conductivity, K, is calculated from the rela.tions hip
K = C1 (EI) t/A AT
where:
C1 = Geometry and unit hctor
(EI) = Center heater power
t = Average center-section thickness
A = Effective center-section area
, \T = Temperature difference between hot and cold h e s
Accuracy of the method is estimated to be within ~ 5 % over the full temperature range.
The sample configurations a r c shown in Figure 7. Fo r the Z direction measurements, 1-90 mm discs were cut from the as-receivcd sheet witham disturbing the surfaces. Thc Y direction measurements were made using specimen discs fabricated as shown ir. Figure 7b. Thirty-two s t r ips of approximately 100 mm by 4 m m were cut, with the 4 mm dimension in the Y direction. These were then bonded with Flberite NR 15CC2 rosin t o form a plate with the laminate Y direction oriented through the thfclmccs. The 100 mm test discs were then cut from thesc plates.
This procedure ~ rav ided a test specimen for thc guarded hot plate with the proper oricntatim. The resin film has a thermal conductivity similar to the matrix in the laminates and amounted to less than 1% of the total area. Therefore, it should not
substantially influence the 'test results.
Data was taken at mean temperatures of approximately 116, 180, 245, 310, 375, 440, 505 and 588K for each test specimen set.
Tnerinal Expans ion
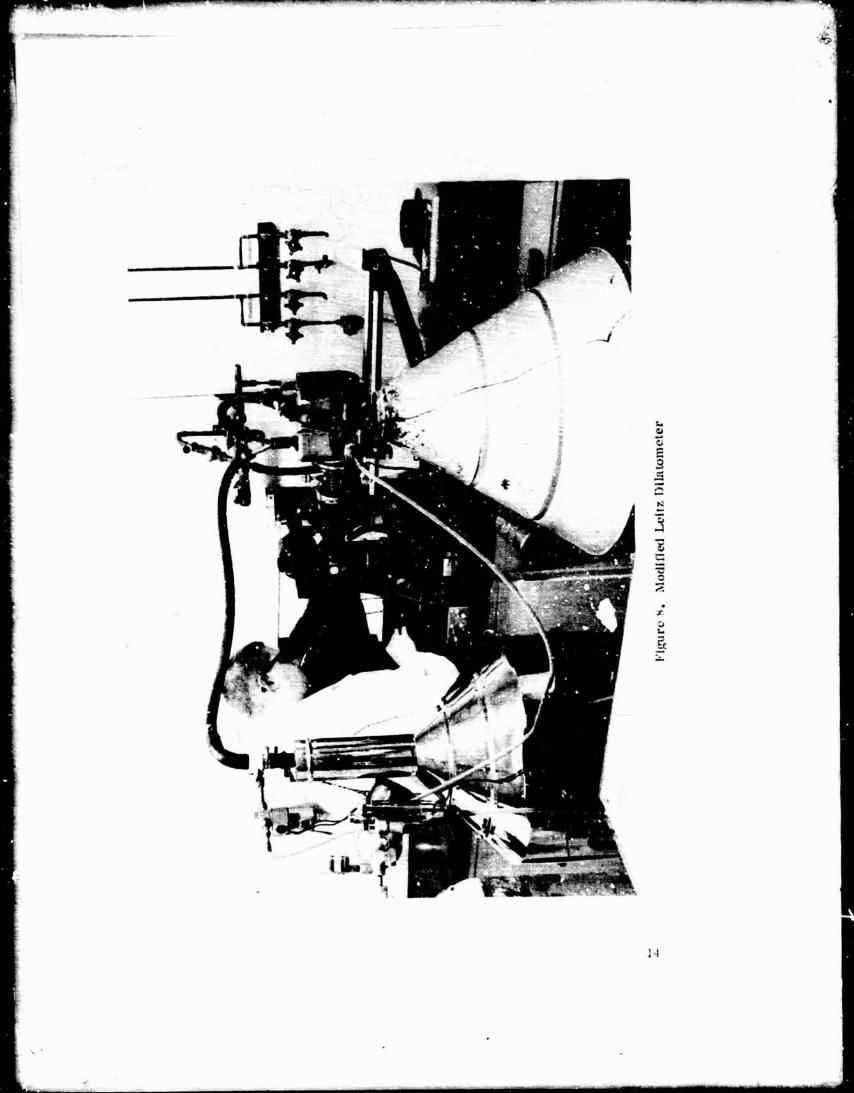
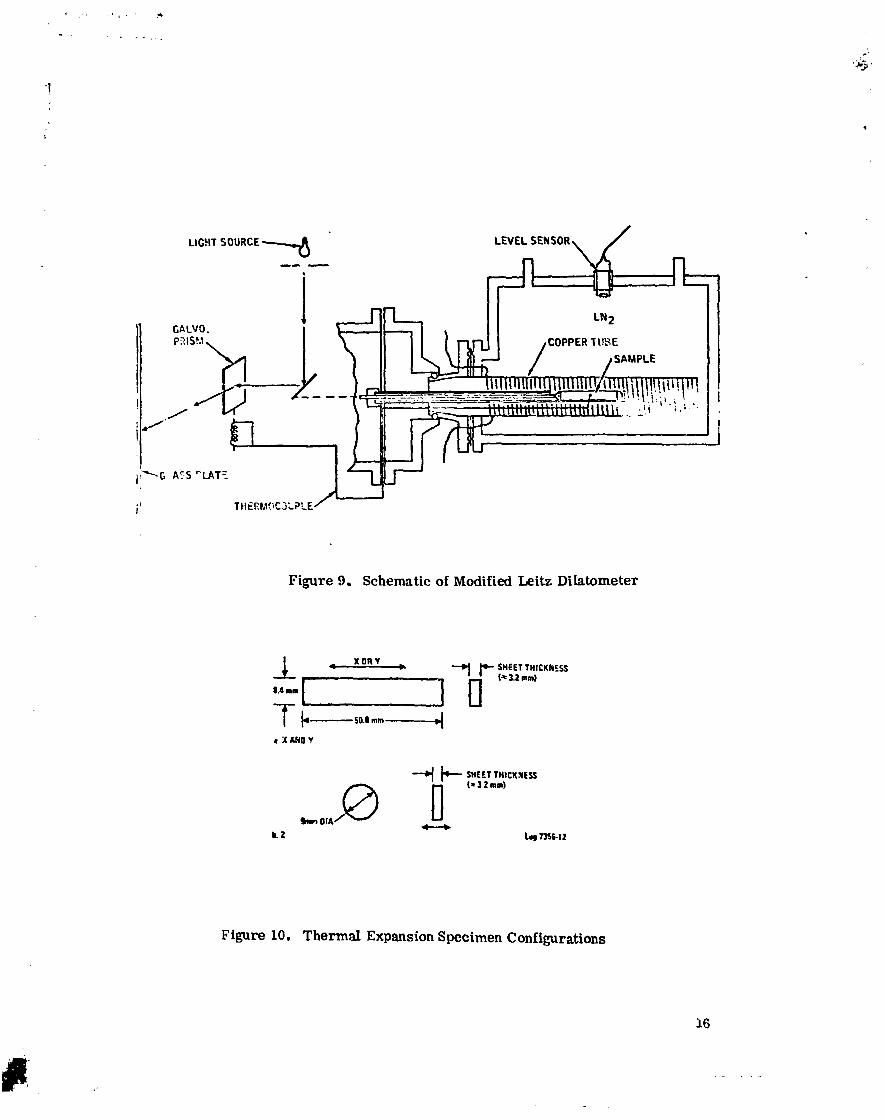
All expansion measurements were made using the modified Leitz diatometer shown i n Figures 8 and 9 and the spccimcn configurations shown in Figure 10.
In this apparatus, the spccimen is contacted at each end by and supported by concentric fused silica tubes. The relative length of a specimen is indicated by relative positions of the tubes. Movament of one tube with respect to the other causes movement of a pr ism, which results in vertical deflection of a light beam projected on a ground glass plate. Specimen length changes are magnified by a factor as large as 800. Horizontal deflection of the light beam is controlled bj a thermocouple mounted on the specimen.
The specimen is maintained in a dry helium atmosphere. Temperature of the specimen i s varied by valying the Dower setting of the furnace. The furnace used for lov temperatures i s shown in both figures. It operates in a liquid nitrogen e n v i r c ~ m x f ? and has a range of 80K to 475K. For this invcstigation, this furnacc mas u w d fr m 144K to 297Il;. A high ternperatxe wire-wound furnace was used from 29iK to L ! :K.
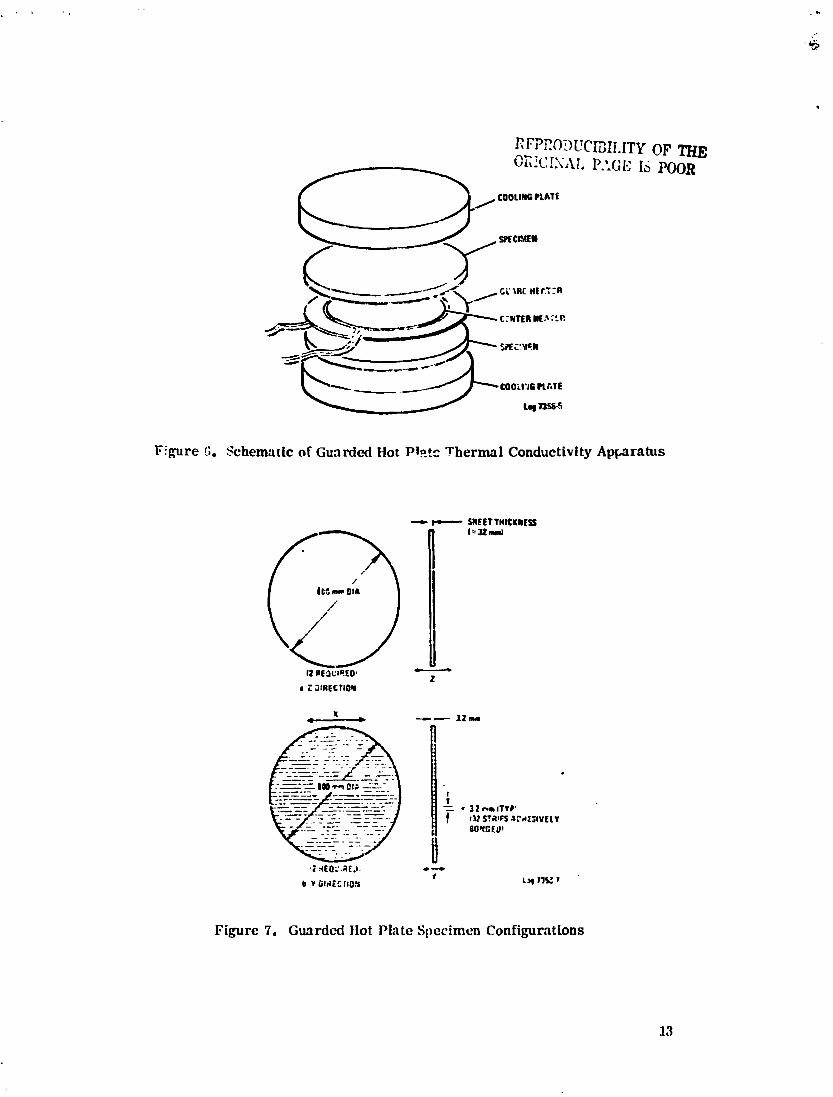
Figure !;. Schematic of Guarded Hot P l ~ t t Thermal Conductivity Apparatus
Figure 7. Guard& Hot Plate Specimen Configurations
Power changes necespary to achieve the desired specimen temperature were made, and the specimen was permitted to come to thcrmal and structural equilibrium. Tcmpemturcs were changed approximately cvcry 10 to 20 minutes. When equilibrium ~-;..;ns rc;?ched, vertjcal displacement of thc light beam and specimen temperature werc recorded, nnd the powcr sc t for thc ncxt desired temperature. Displaccmcnt was !~c?nd mnrkcd on thc g1.w~ phtc .
At thc conclusion of a iwn, the soccirnen di.~!acement data was read using a c,?.lihr~.fcc! 'yave?in= tdcscope, converted to \1/l with respect to the original rcferencr length F?
?.~bi*:?t tcmpcrah~rc, and plottcd as n function of temperature.
The apynmtus is rmtincly calibmtcd us i tg ?n NBS-certified fused-silica standard. Accvraq- gas-r thr full tempcrnture n n g c i s better than *7 x m/m. This in a --:-:a? c n ~ ~ f f i c i c ~ t uncertainty of *C. 016 x lo-' m,'m/K (0. do9 r lo-' in/inlF) over 47:X (S59F).
For the X and P directions, a 50.8 mm length in the test direction was used. For thc I, direction, %e original sheet thickness (3.2 mm) was used (Figure 10). Because of the high expansion in the Z direction, the short sample did not crrrpromise the accura To eliminate the possibility of length changes due t o changes in moisture content during the expansion test , all specimens werc vacuum-dried and desiccant-stored pr ior to test. For al l specimens .\1 data was taken at the following temperatures in sequence: 297, 116, 176, 236, 297, 347, 39?, 447, 497, 547, 588, 297, 116, 588, 297K. This resulted in two complete cycles from room temperature to cryogenic temperatures to elevated temperahires and back to room temperature.
Specific Heat
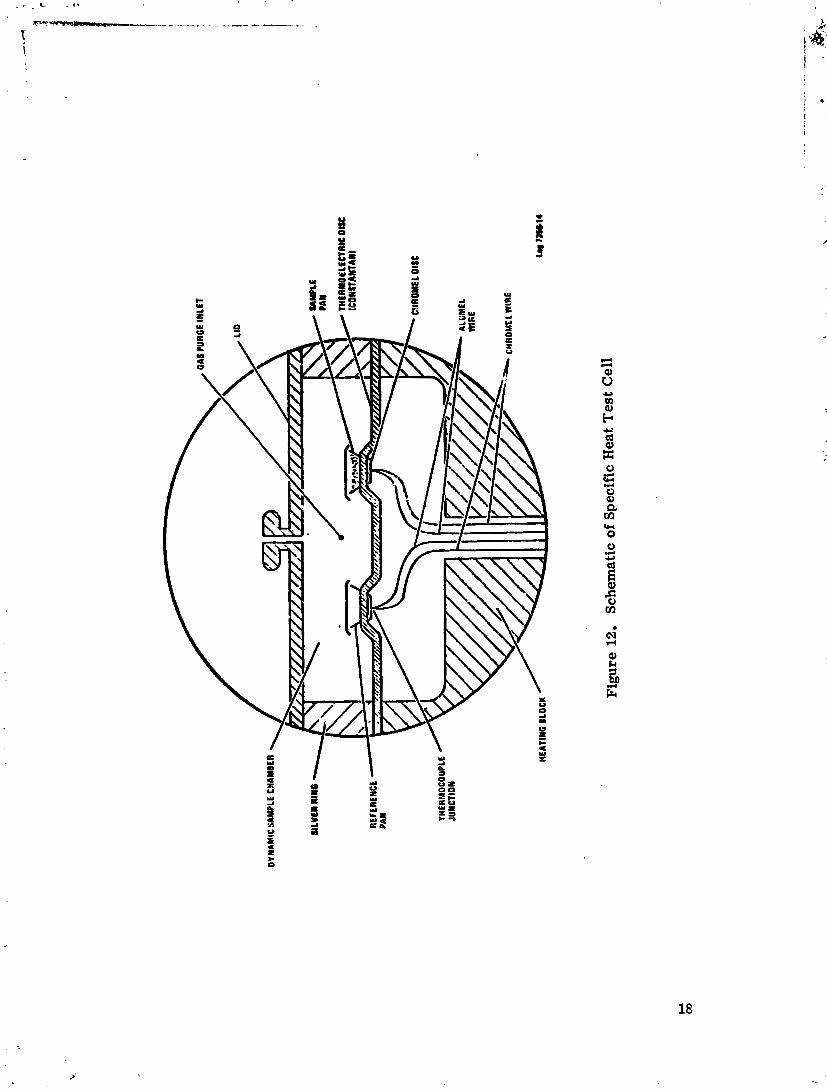
Specific heats were measured using the DuPont 910 Differential Scanning Calorimeter shown in Figures 11 and 12. In this appaz tus , a reierence pan and a sample pan con- taining a small tes t specimen a r e equilibrated at the lowest temperature of interest, and then heated through the tetnperaturc range of interest. The qpparatus is constructed to supply the same heat input to boti! pans at all times. As the two pans heat, thc . \T between them 1s recorded. This AT i s used to calculate the specific heat of the unknown at any temperature through which the :ell is heated. With proper calibration using an NBS-certified synthetic sapphire standard, uncertainties in the results a r c held to less than *a. For this program, data were taken over the temperature range llGK to 588K. Spccific heats of each sample were calculated a t 116, 180, 245, 310, 375, 440, 505 and S88L and plotted against temperature.
LIGHT SOURCE LEVEL SENSOR
Figure 9. Schematic of Modified ZRitz Dilatometer
+ X O R Y SHEET THICKNESS
SHEET THlCIIEff ( 2 3 2 mm)
h m OIA - b. z
Figure 10. Thermd Expansion Specimen Configurations
DYN
AM
IC S
AMPL
E CH
AMBE
R
TMER
MO
LLC
CTA
IC D
ISC
REF
EREN
CE
PAN TH
ERM
OCO
UPLE
JU
NC
TIO
N
HEA
TIN
G B
LOCK
Fig
ure
12.
Sc
hem
atic
of
Sp
ecif
ic H
eat
Tes
t C
ell
A test specimen approximately 1 mm x 6 mm diameter was used. Test specimens were vacuum-oven dried prior to test so that thc energy necessary to drive off the mtcr was not included in the specific hcnt measurement.
v-hcr e
A -- spectral reflectiT:ity, and
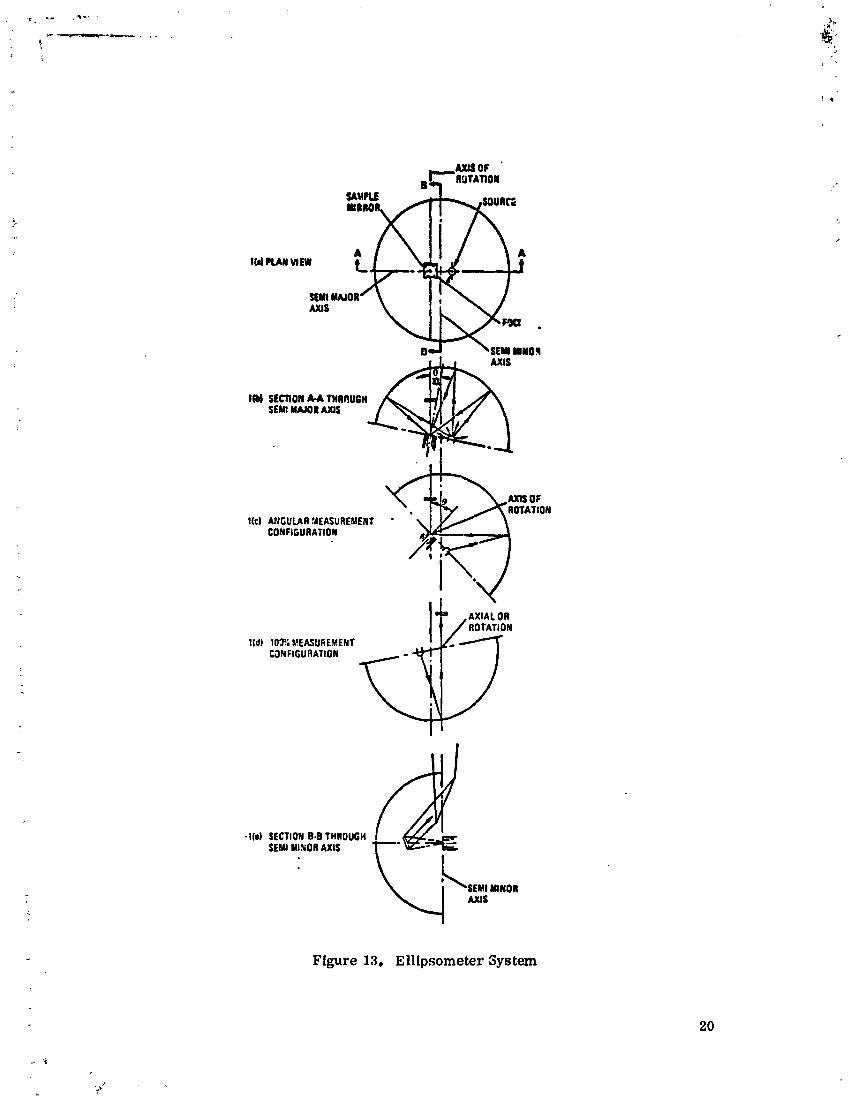
Tpec'.--TI ~.;f:-\.: ti.iity mcasureme-ts wzre made a t n.mbient from 2.5 to 30 p m nsil;.; - ,* qdl:*p.;ome'ler (Ffgures 13 and 14). The emittance, E , was th:-n calculated at ambient and 588K as follows:
whe-e N is the Planc k blac k b d y radiation function. AT
Figure 13 shows the optical system of the ellipsometer. The pyrex ellipsoid has a h-ghly polished inner surface upon which a film of aluminum has been evaporated. 3 has a semi-major axis of 15.2 cm and a semi-minor axis of 15.0 cm, with foci 50.8 mm apart. The source is placed on the semi-major axis with its center at one focus; the sample is centered at the other focus, as shown in Figure 13. The focusing characteristics of the ellipsoid a r e such that a point source of light emanating from one focus is imaged at the other. Using a properly sized radiation source, the sample is uniformly illuminated over a hemisphere of 2 w steradians.
The source system - including the source, ellipsoid, sample holder, and chopper - form an integral unit that is designated to rotate about an axis through the center of
lfcl AtdGULAR !hEASUREMENf ' CONFIGURATION
.If01 SECTION B-8 THROUGH SEW MINOR AXIS
Figure 13, Ellipsometer System
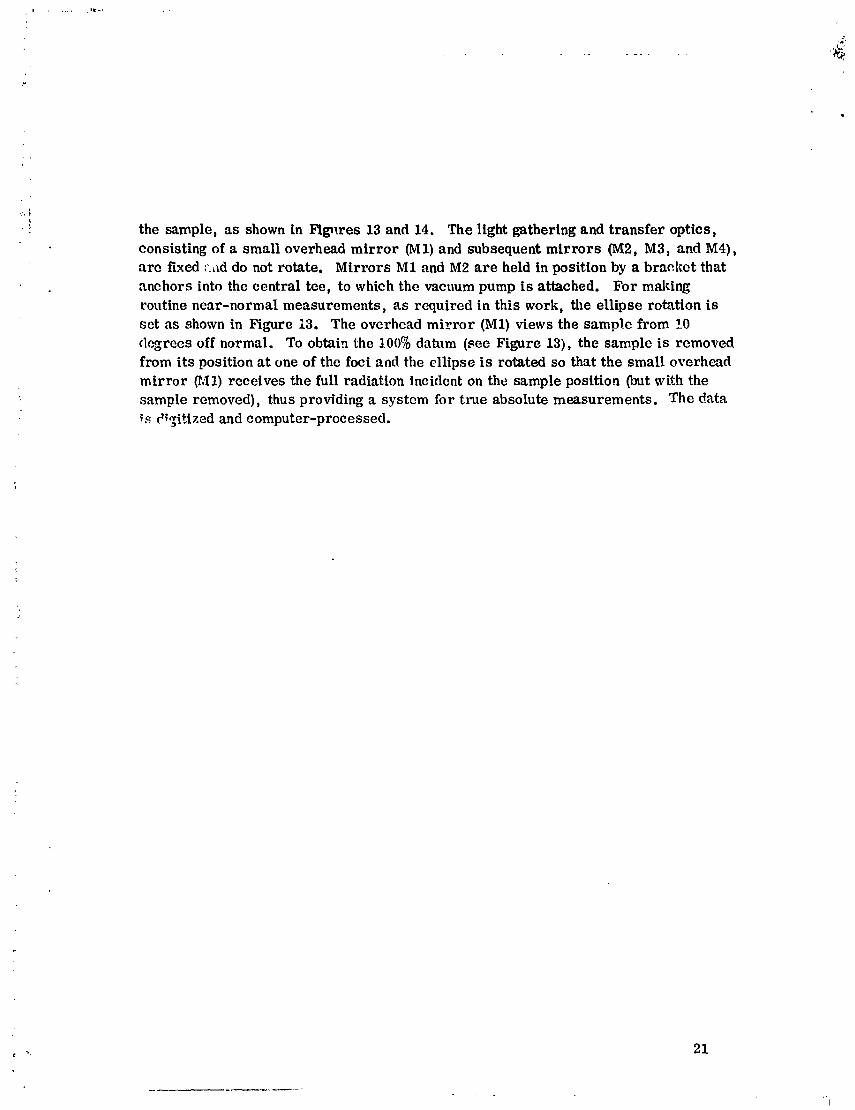
the sample, a s shown in Flgnres 13 and 14. The light gathering and transfer optics, consisting of a small overhead mirror (MI) and subsequent mirrors (M2, M3, and M4), are fixed :lnd do not rotate. Mirrors M1 and M2 a r e held in position by a bracket that anchors into the central tee, to which the vacuum pump is attached. For making routine near-normal measurements, a s required in this work, the ellipse rotation is set a s shown in Figure 13. The overhcad mirror (MI) views the sample from 10 rlcgrees off normal. To obtain the 100% datum (see Figure 13), the sample is removed from its position a t one of the foci and the ellipse is rotated so that the small overhead mirror (MI) receives the full radiation incident on the sample position (but with the sample removed), thus providing a system for true absolute measurements. The data f s r'q~itiized and computer-processed.
TEST RESULTS
Thermal Conductivity
REPRODUCIBII,I?RI' OF THE ORIGINAL P.1GE IS POOR
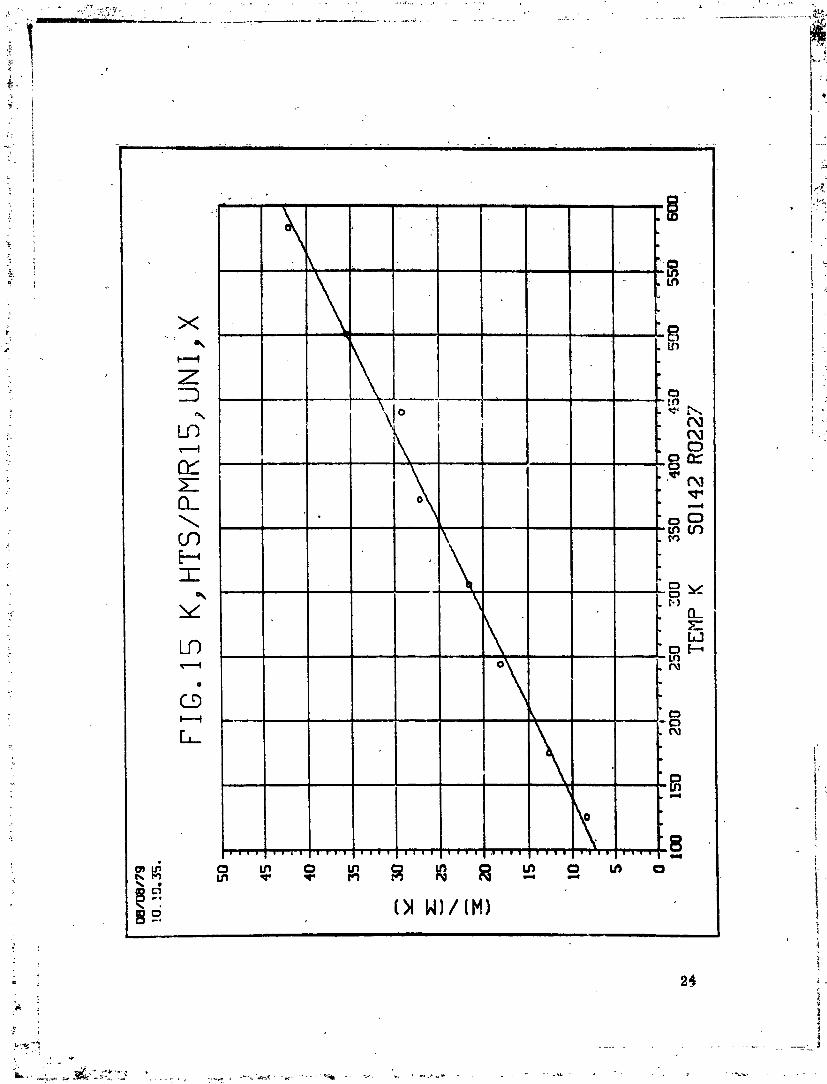
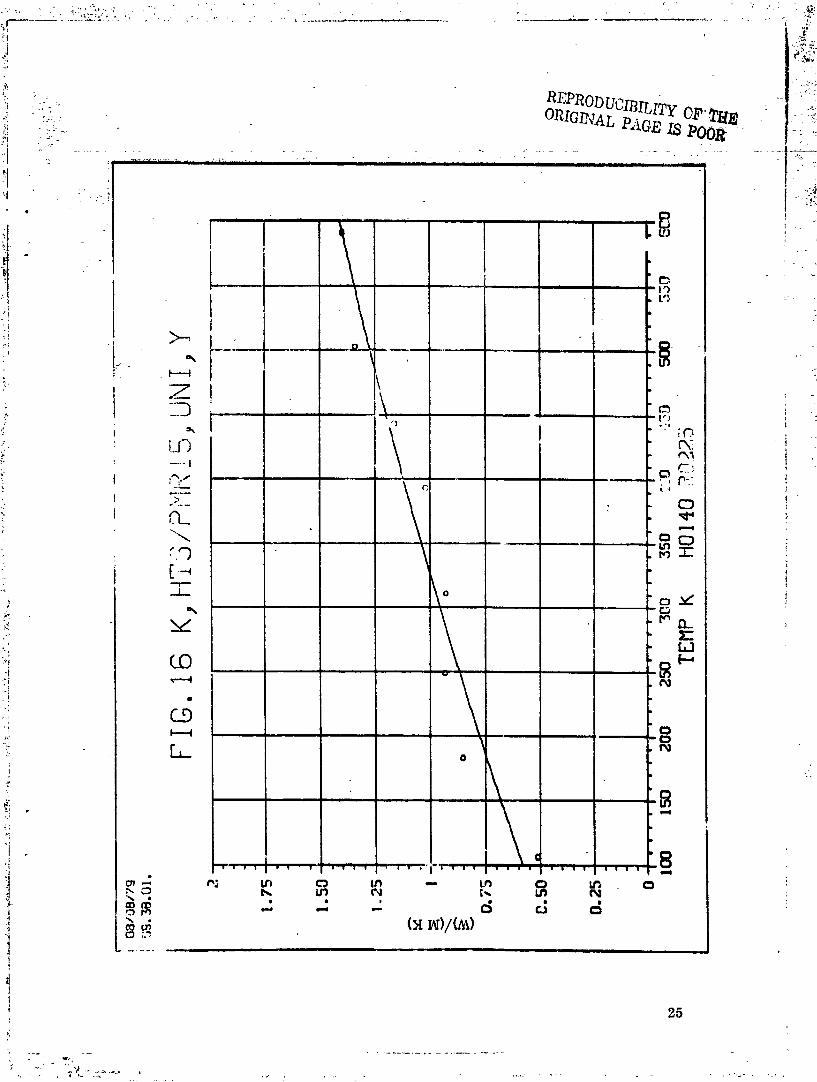
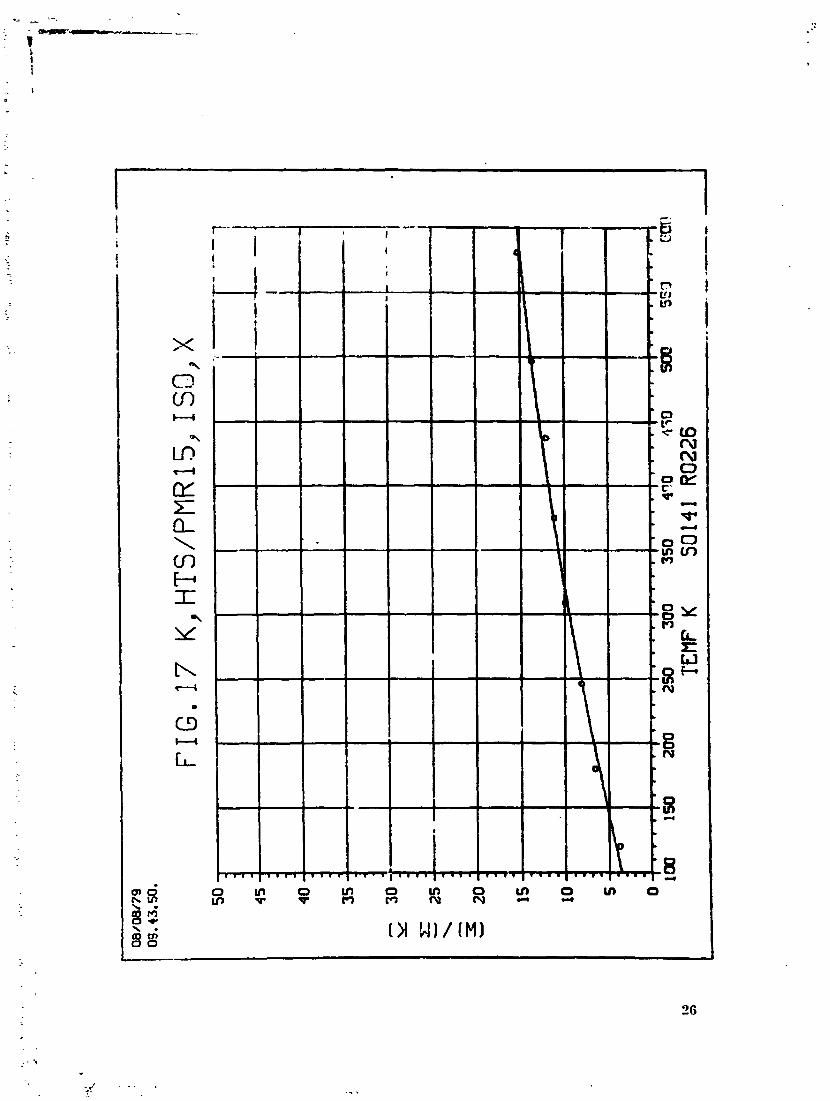
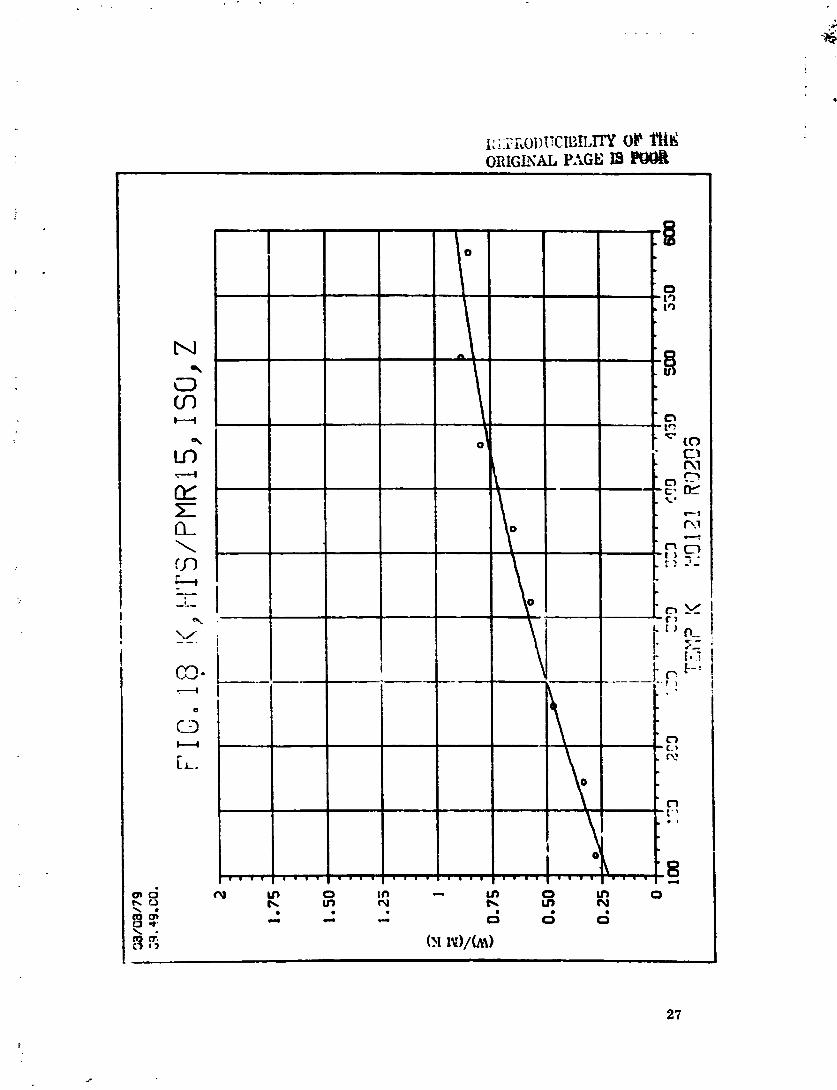
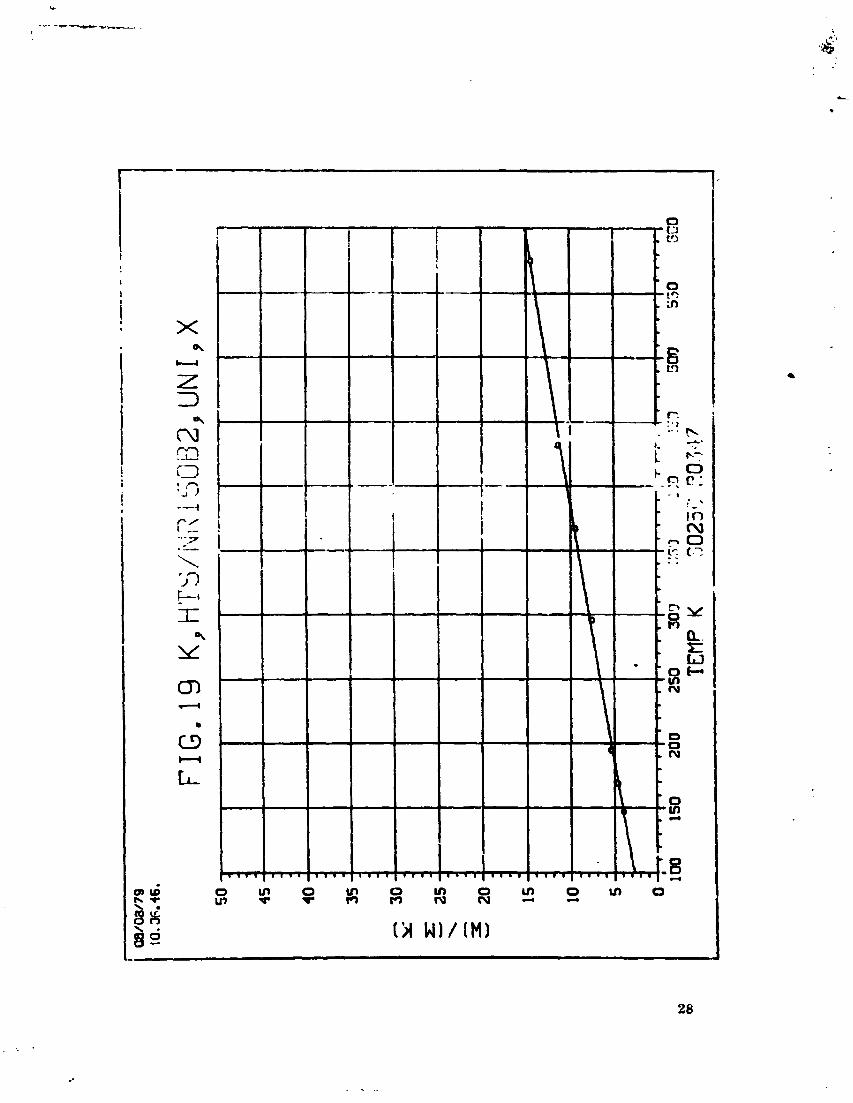
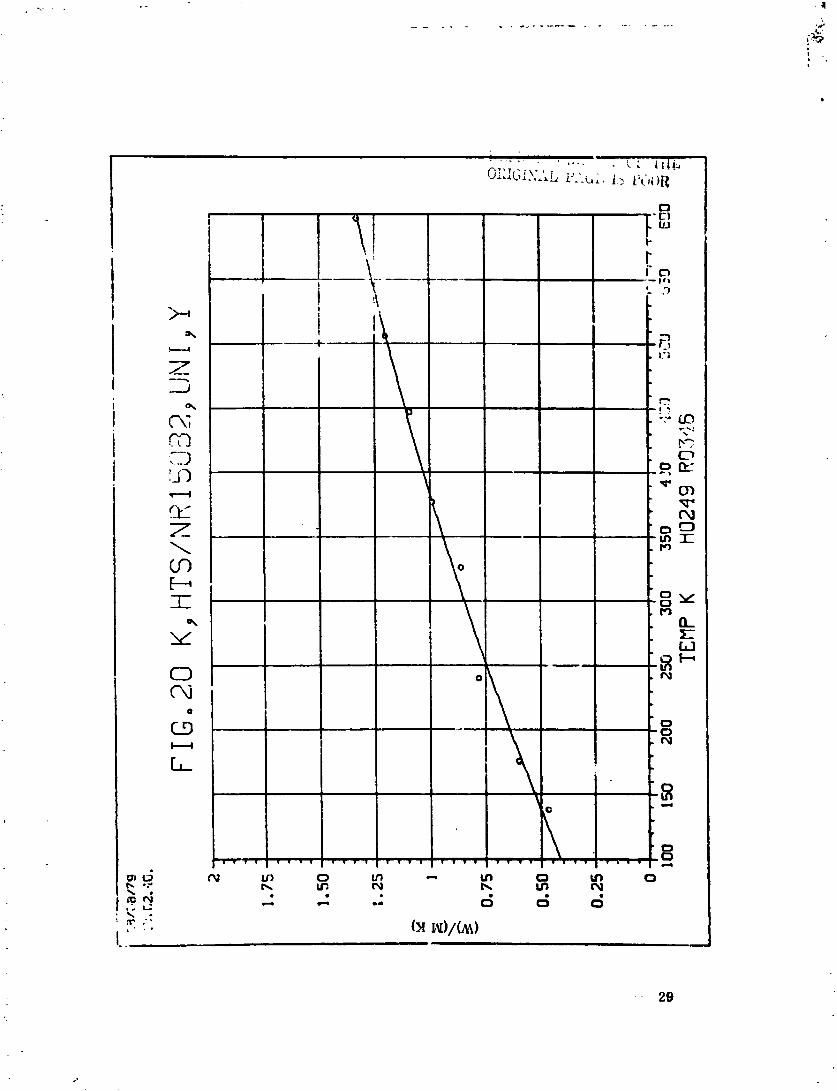
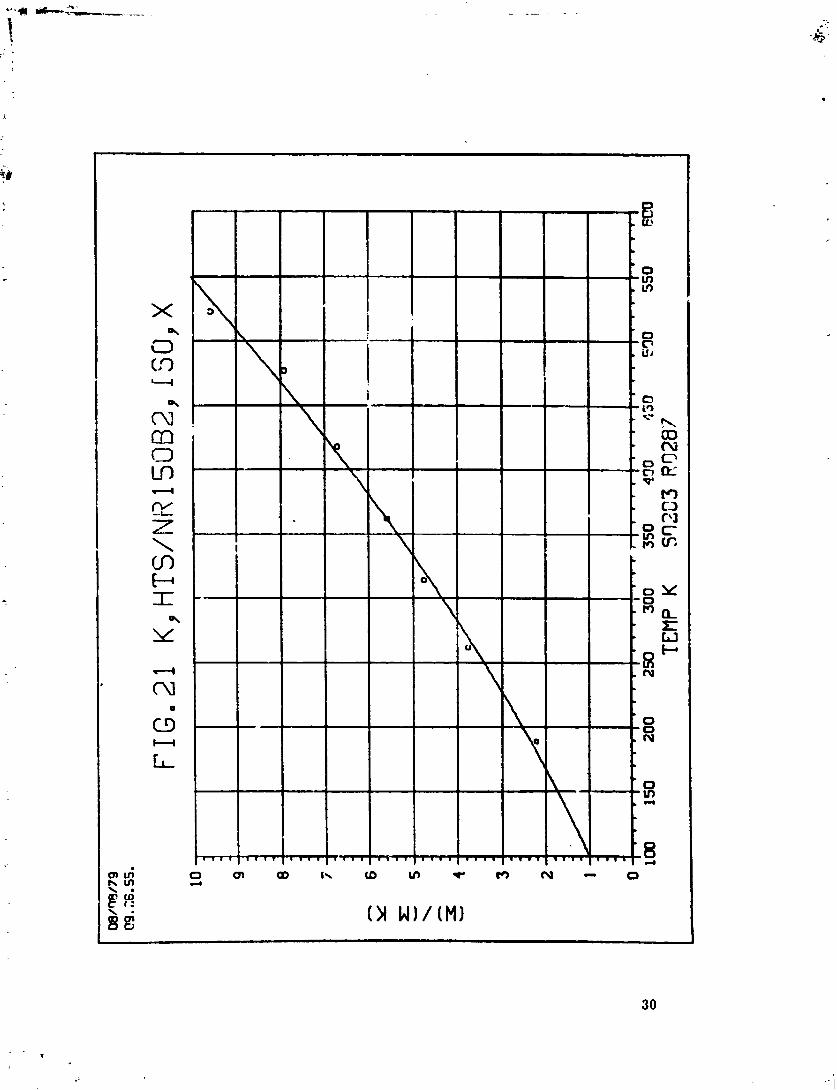
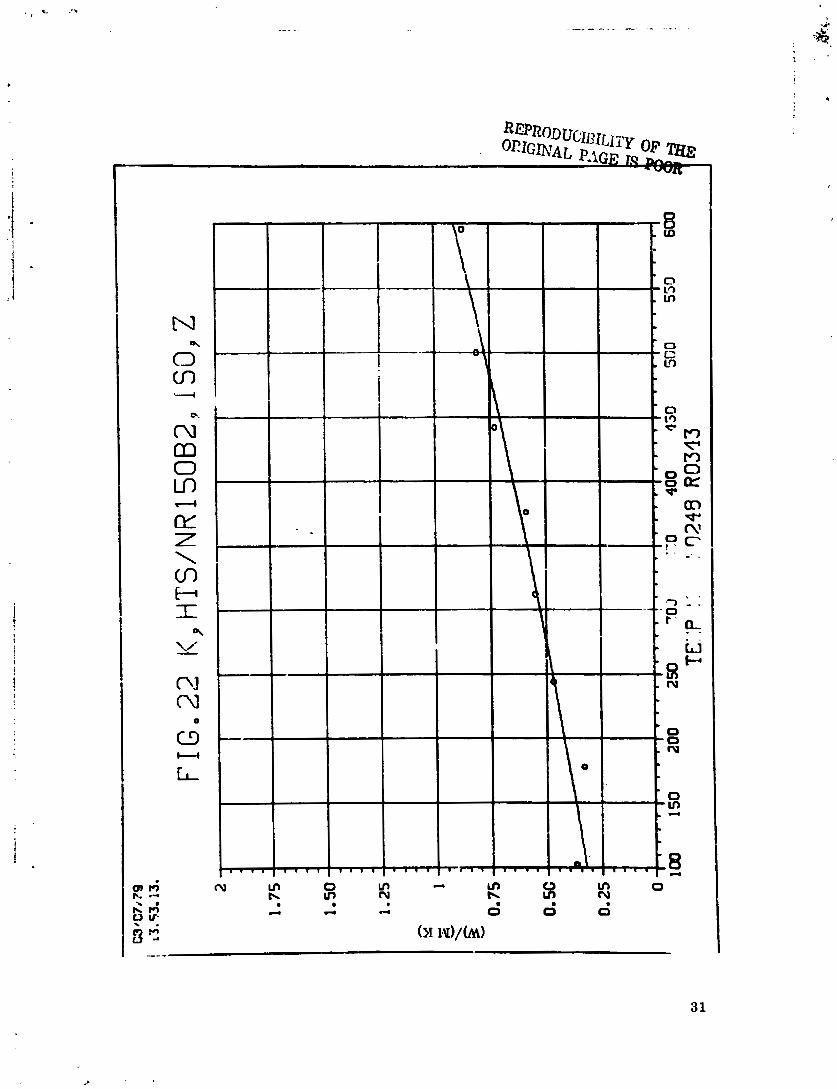
Test results for each specimen were plotted against mean specimen temperature and best-fit quadratics drawn through the data. These curves a r e presented in Figures 15 through 22. Tabular data is contained in the Appendix.
It was expected that both materials would have nearly the same thermal conductivities. The fiber was the same in both cases and the resins were generically the same. As the data indicates, this mas the case in the directions where the matrix dominates, i. e., mi directional Y (Figures 16 and 20) and isotropic Z (Ngures 18 and ??).
Conductivity in the unidirectional Y direction was higher than the isotropic Z for both materials (Figures 16 and 18 and Figures 20 and 22). This is the result of fibers in the pre-preg crossing each other and providing higher conduction paths across the ply than those provided by the matrix alone.
Results for the directions where the fiber properties dominate, however, were not similar. Near room temperature, values for the HTS/PMR 15 specimens were higher than the HTS/NR 150B2 specimens by a factor of 2-3 in the unidirectional X (Figures 15 and 19) and isotropic X directions (Figures 17 and 21).
If there wcrc significant differences in fiber properties o r effective geometry in thesc directions, it would be expected to also show a s differences in expansion a d tensile strength in thesc directions. Review of that data does not support this. The one significant difference between the materials observed is the high porosity of the MTS/NR 150B2. In the thermal conductivity measurement for these directions, heat is intmduced into the end of the specimen through mechanical clan;,~s. Every attempt is mndc, using condmtive coatings and special clamps, to obtain good thermal contact. Jlowcver, only the specimen outer surfaces a r e contacted. Little, if any, direct contact to fibers is made. Heat must he carried through some matrix before entering t h e fibers which a r e the primary conductors.
Normally, thermal gradients through the specimen become small a short distance from the ends which means that heat flow is mostly longitudinal and that most fibers a r e equally involved. High porosity, however, could change this. If these short paths from the heat so-,irce to the flbers a r c through voids rather than matrix then fibers down from the surface may have little contribution to the total heat flow making the conductivity look low. However, voids in the matrix should also affect the unidirectiond v and isotropic Z conductivity but, in this case, they appear not t o have.
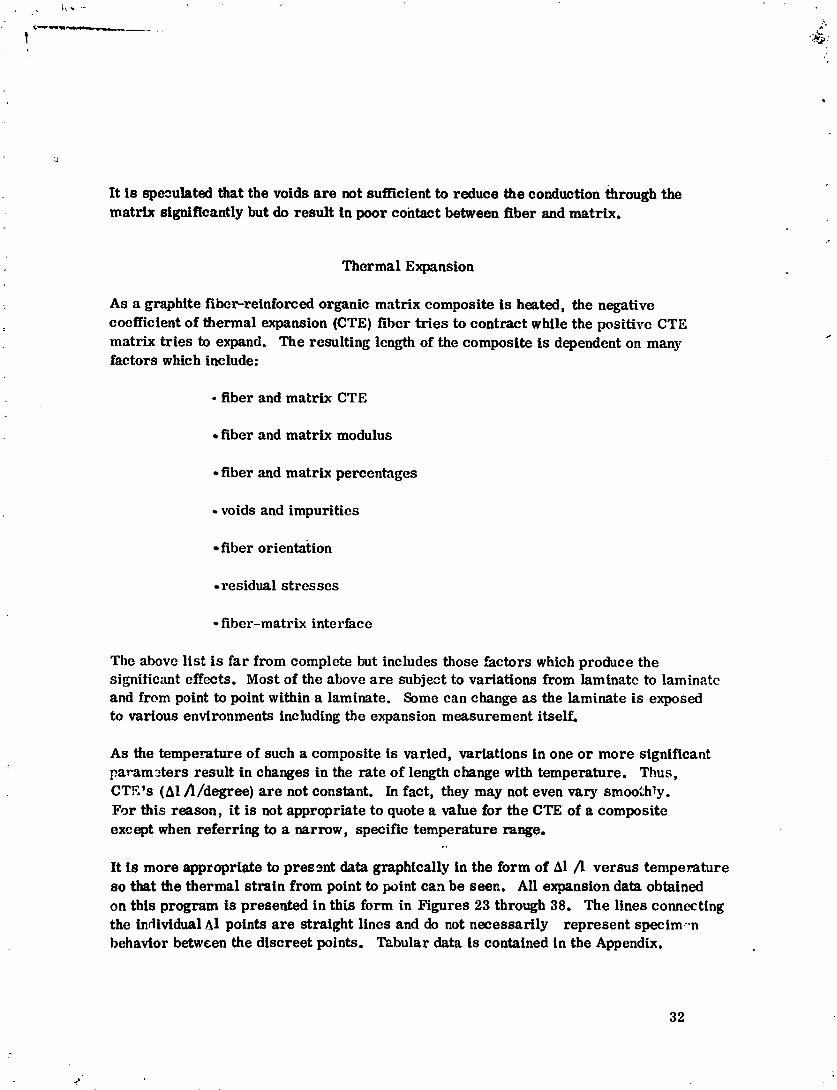
It is speculated that the voids are not sufficient to reduce the conduction through the matrix significantly but do result in poor contact between fiber and matrix.
Thermal Expansion
As a graphite fiber-reinforced organic matrix composite is heated, the negative cocfficient of thermal expansion (CTE) fiber tries to contract while the positivc CTE matrix tries to expand. The resulting length of the composite is dependent on many factors which include:
fiber and matrix CTE
fiber and matrix modulus
fiber and matrix percentages
voids and impuritics
fiber orientation
residual s t rcsscs
fiber-matrix in te rkcc
The above list is fa r from complete but includes those factors which produce the signitic,mt effects. Most of the above are subject to variations from laminate to laminate and from point to point within a laminate. Some can change as the laminate is exposed to various environments including the expansion measurement itself.
As the temperature of such a composite is varied, variations in one o r more significant param3ters result in changes in the ra te of length change with temperature. Thus, CTE1s (A1 /b'degree) are not constant. In fact, they may not even vary smoo';hly. Fm this reason, it is not appropriate to quote a value for the CTE of a composite except when referring to a narrow, specific temperature range.
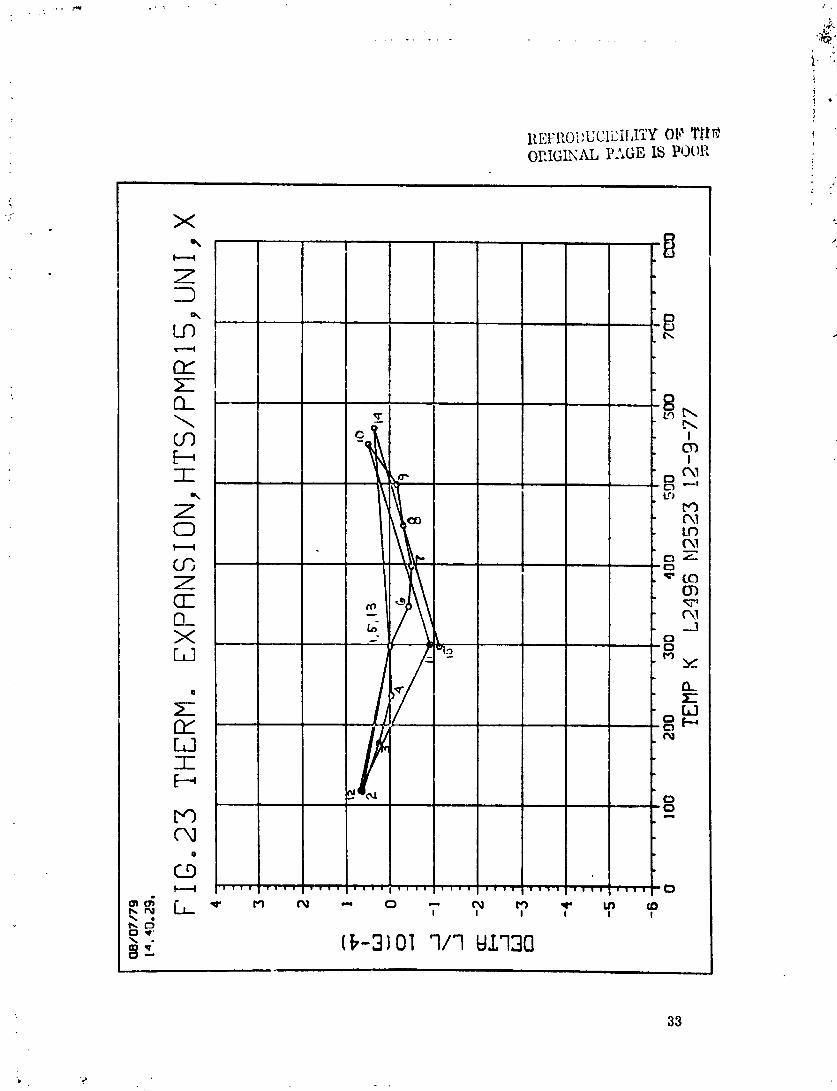
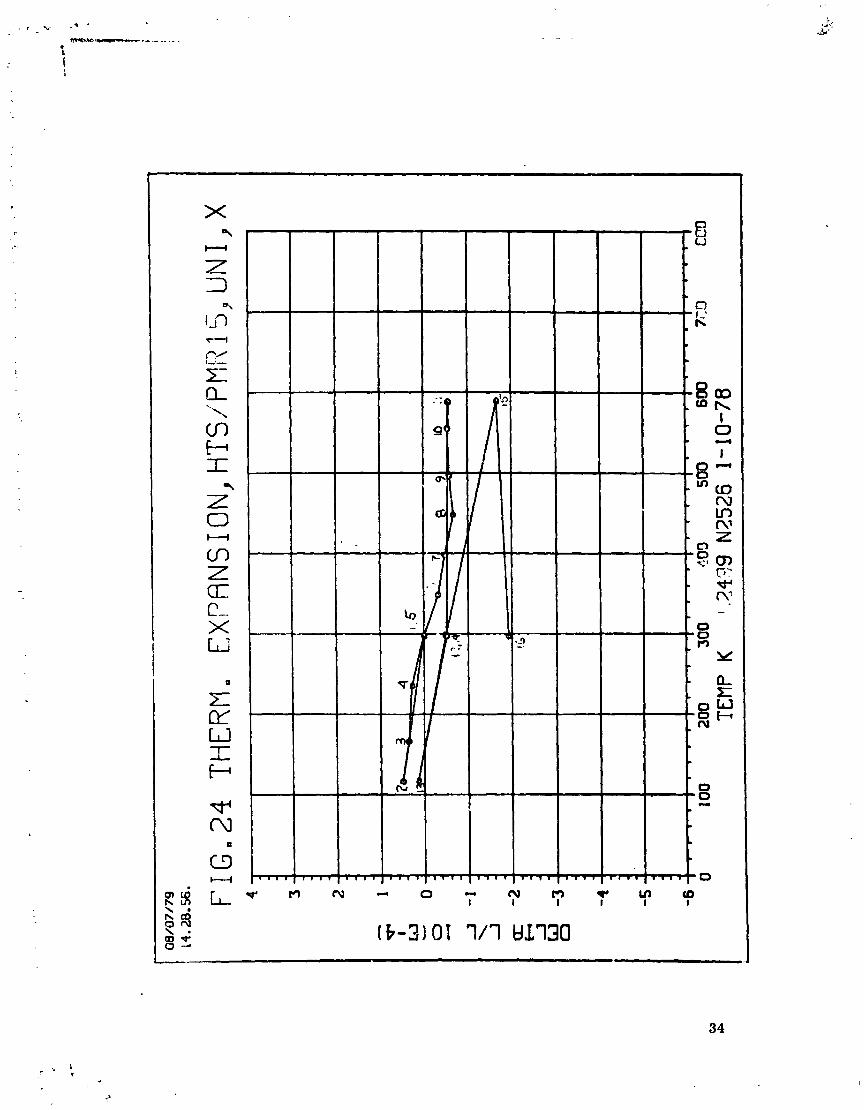
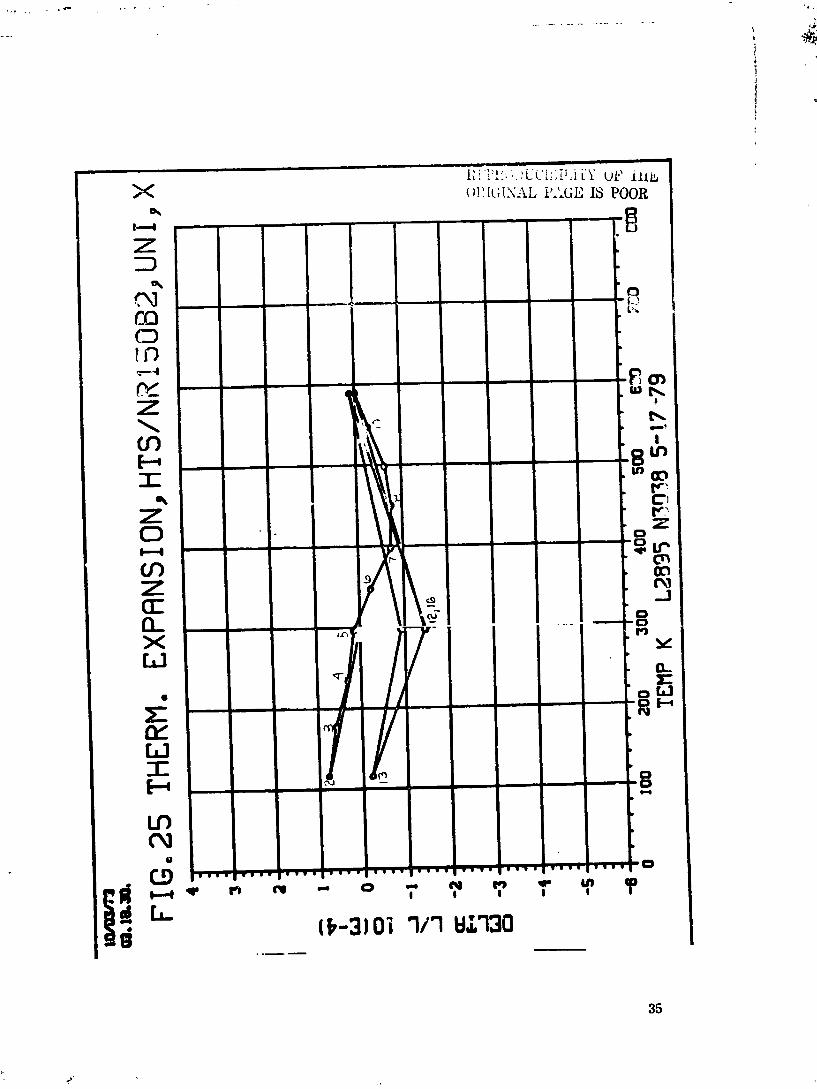
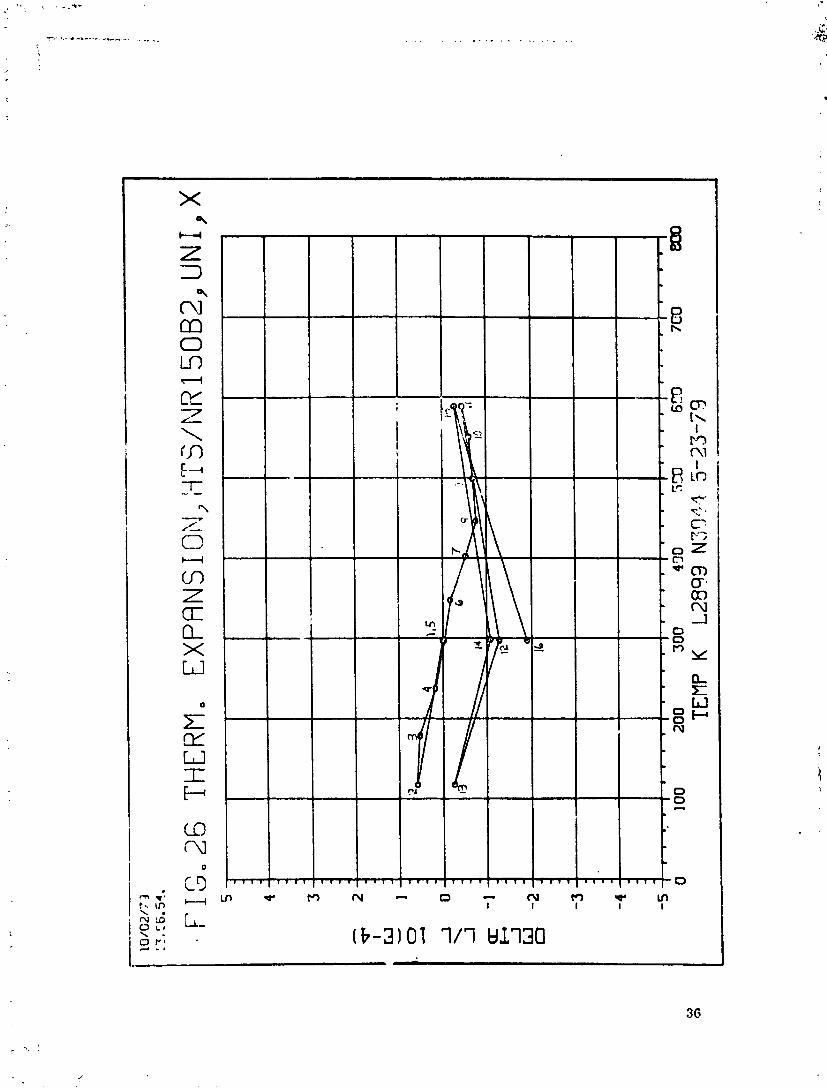
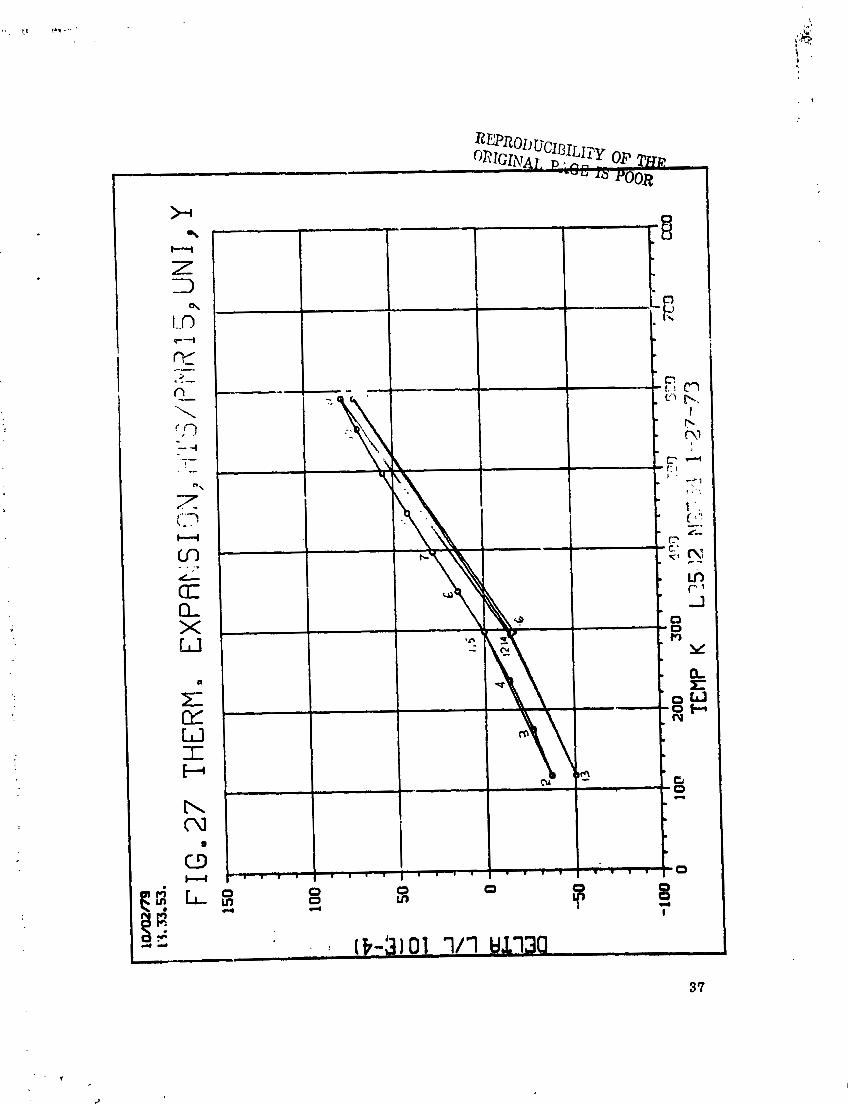
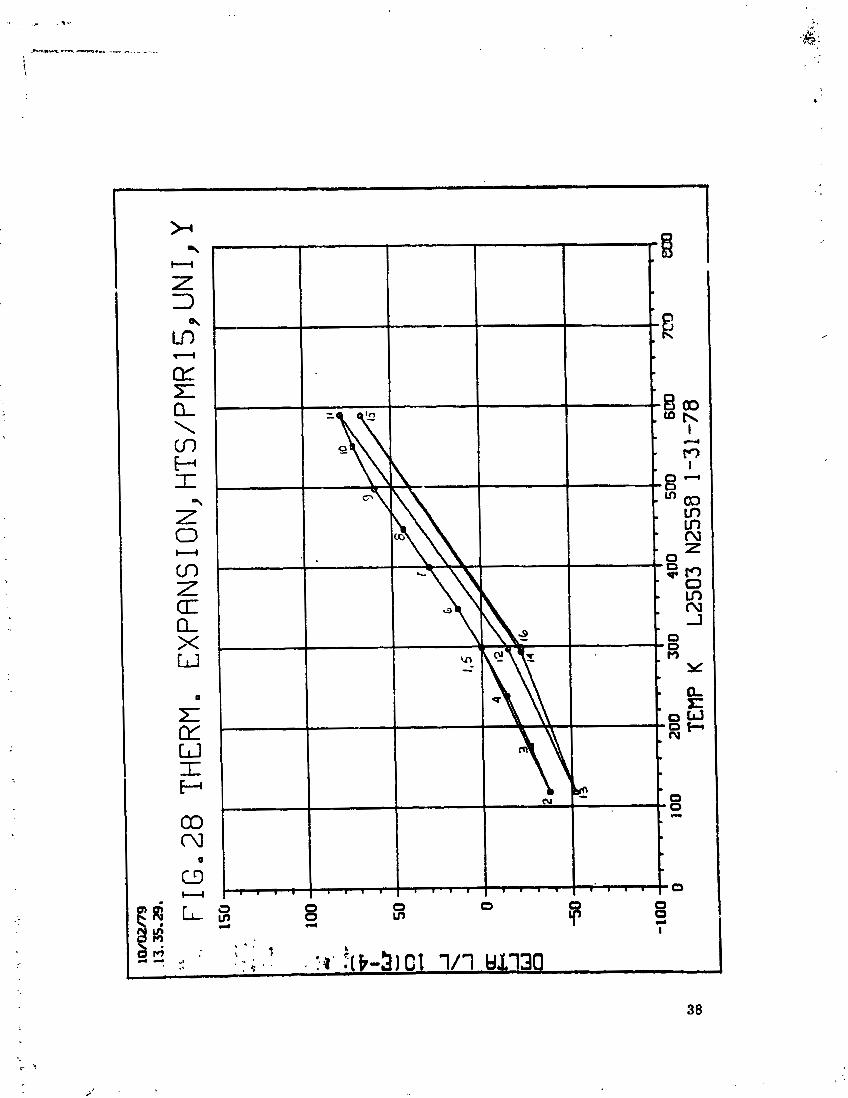
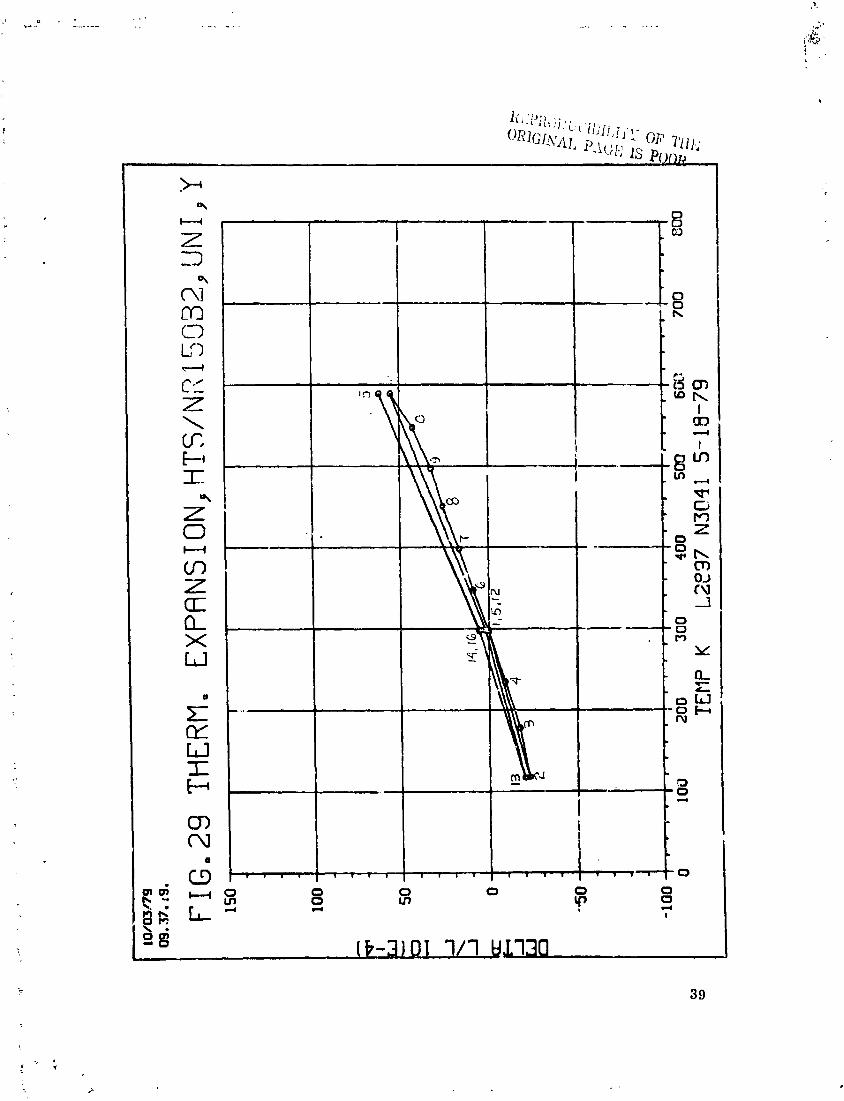
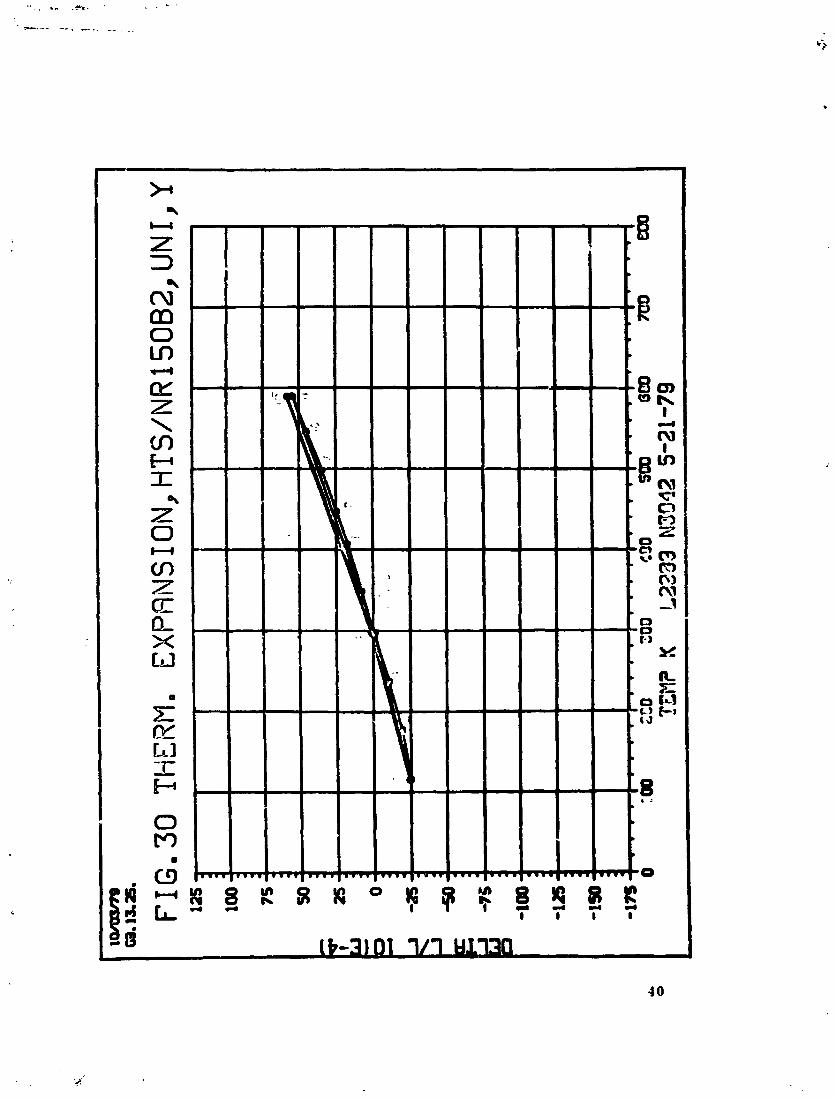
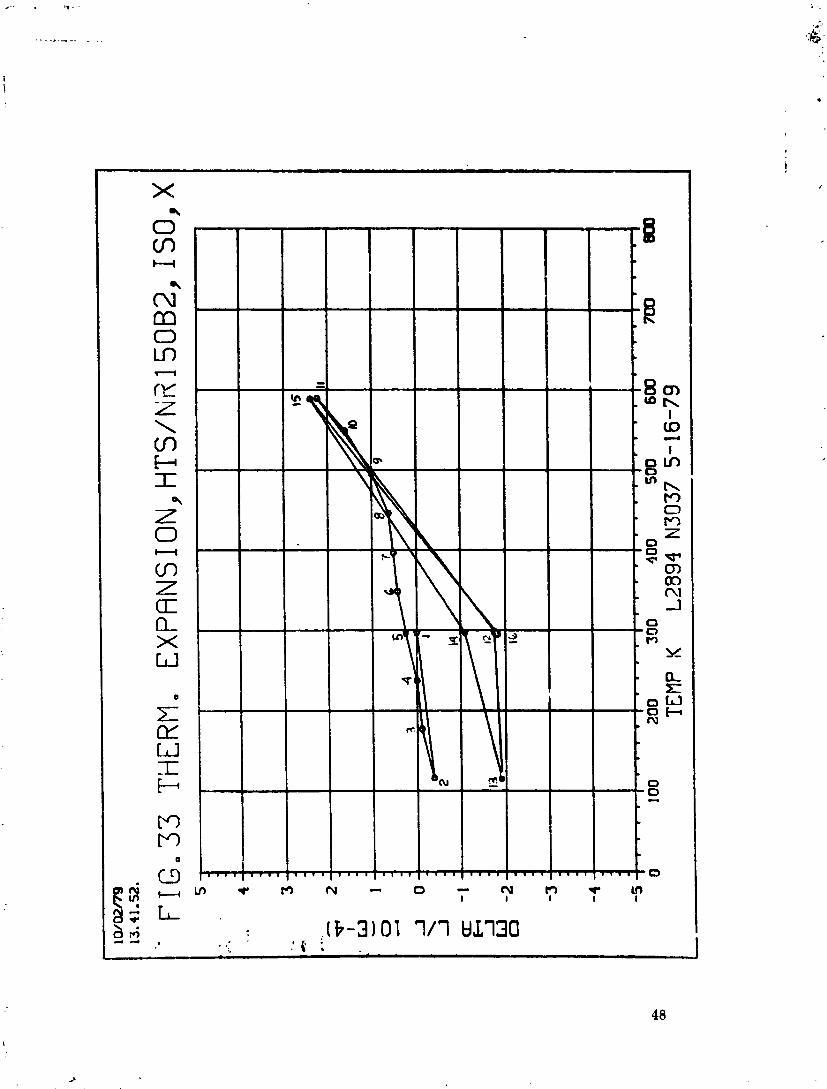
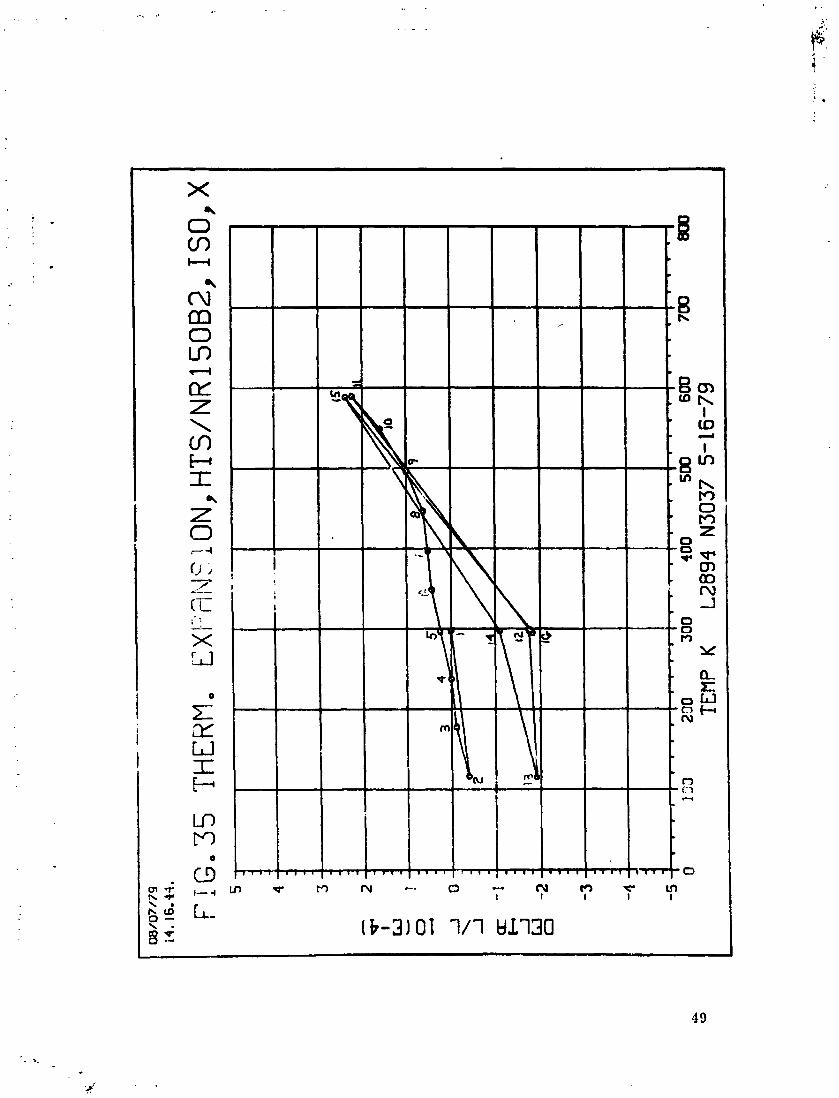
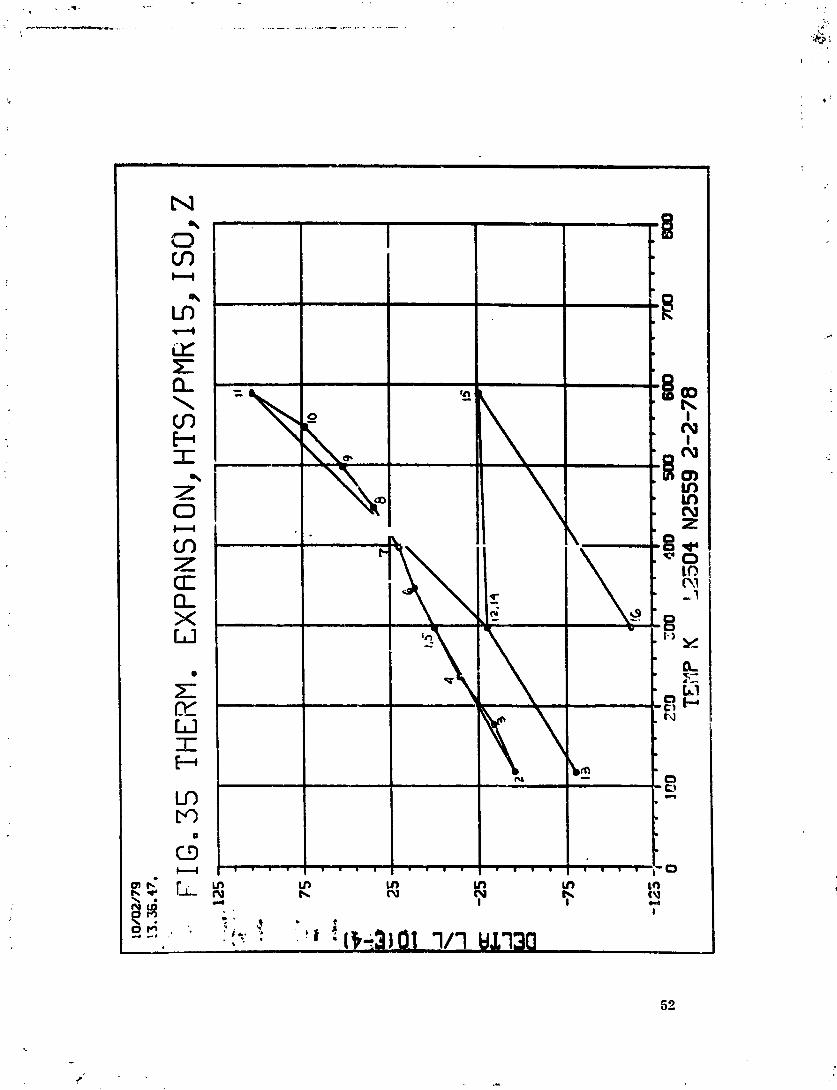
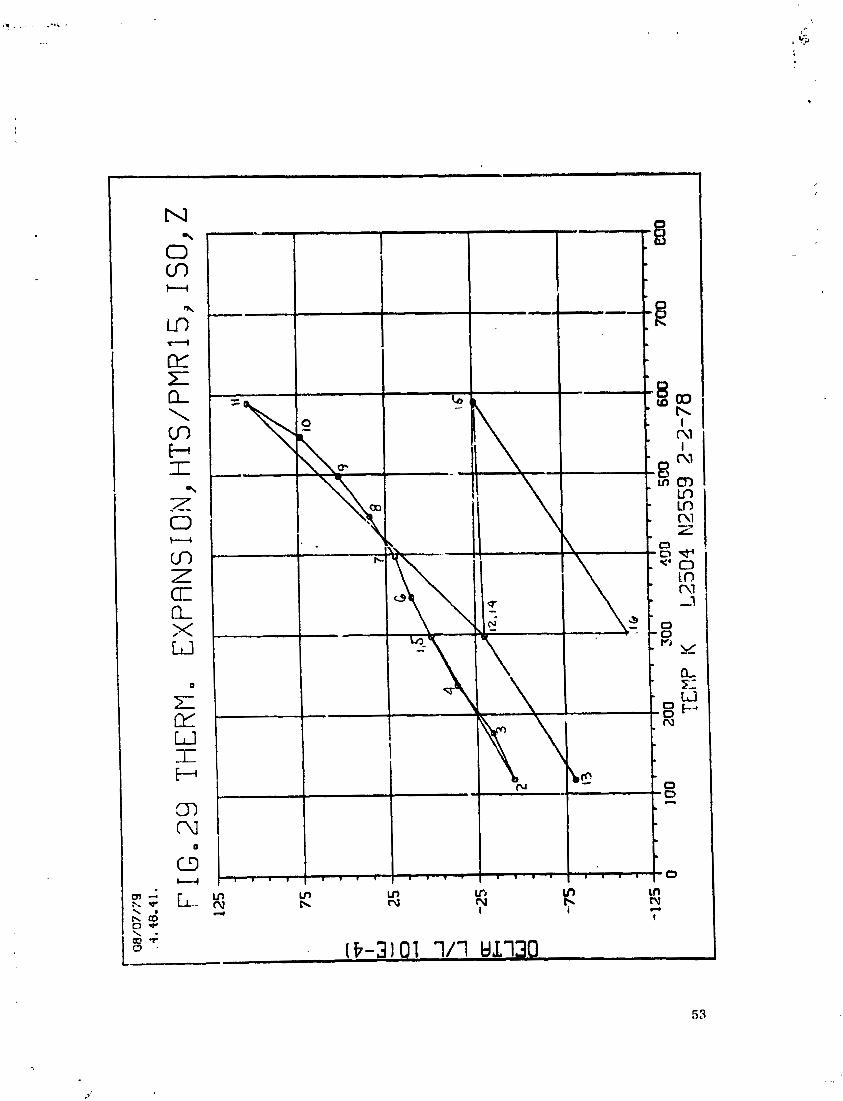
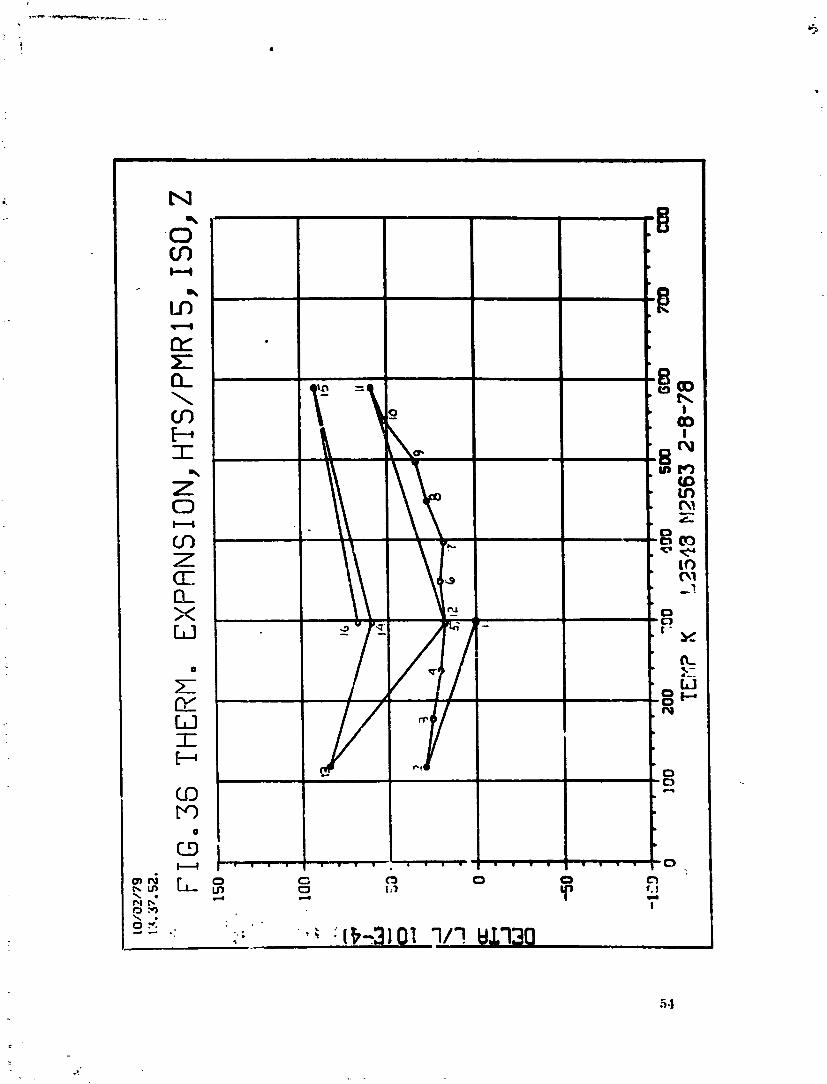
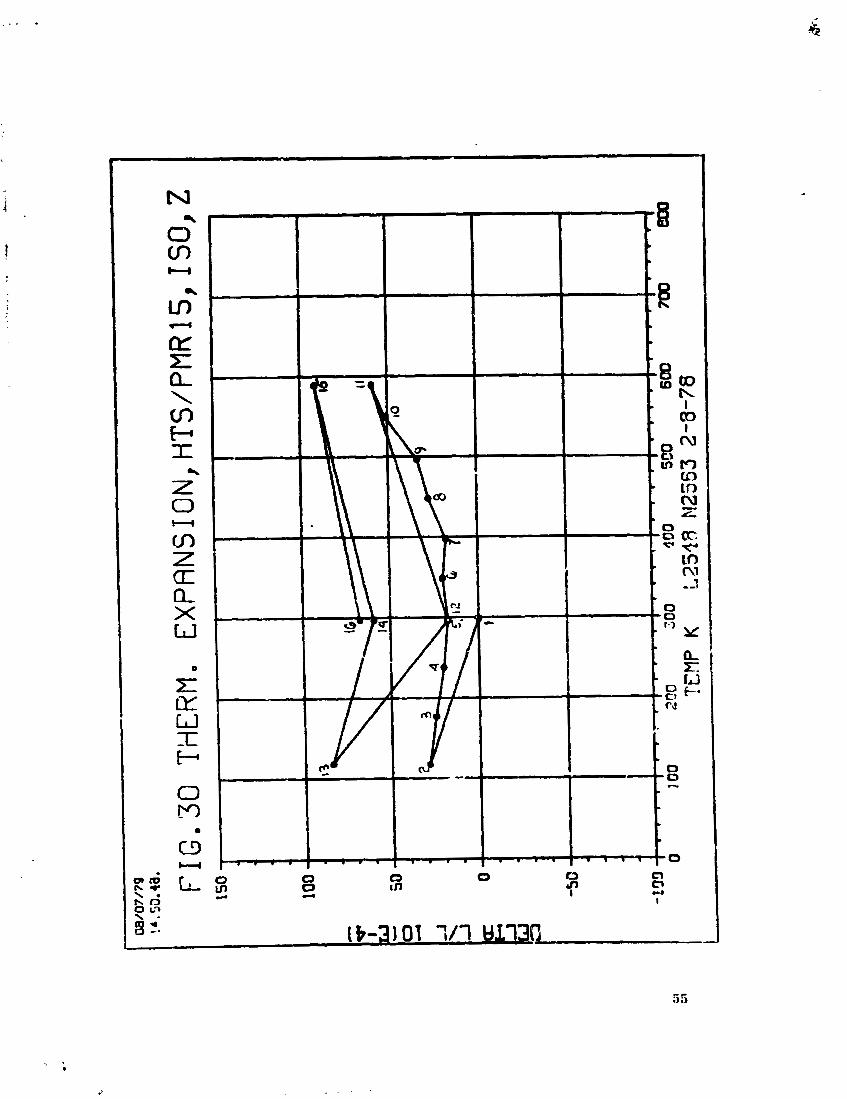
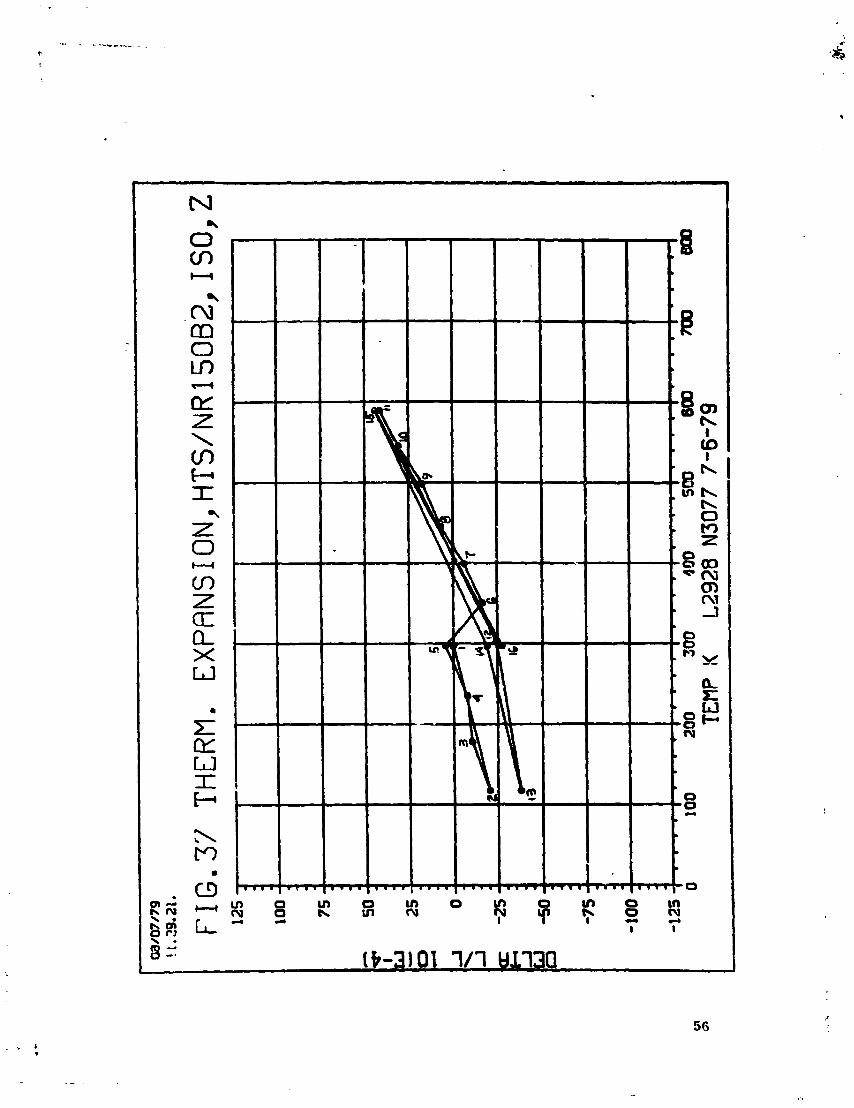
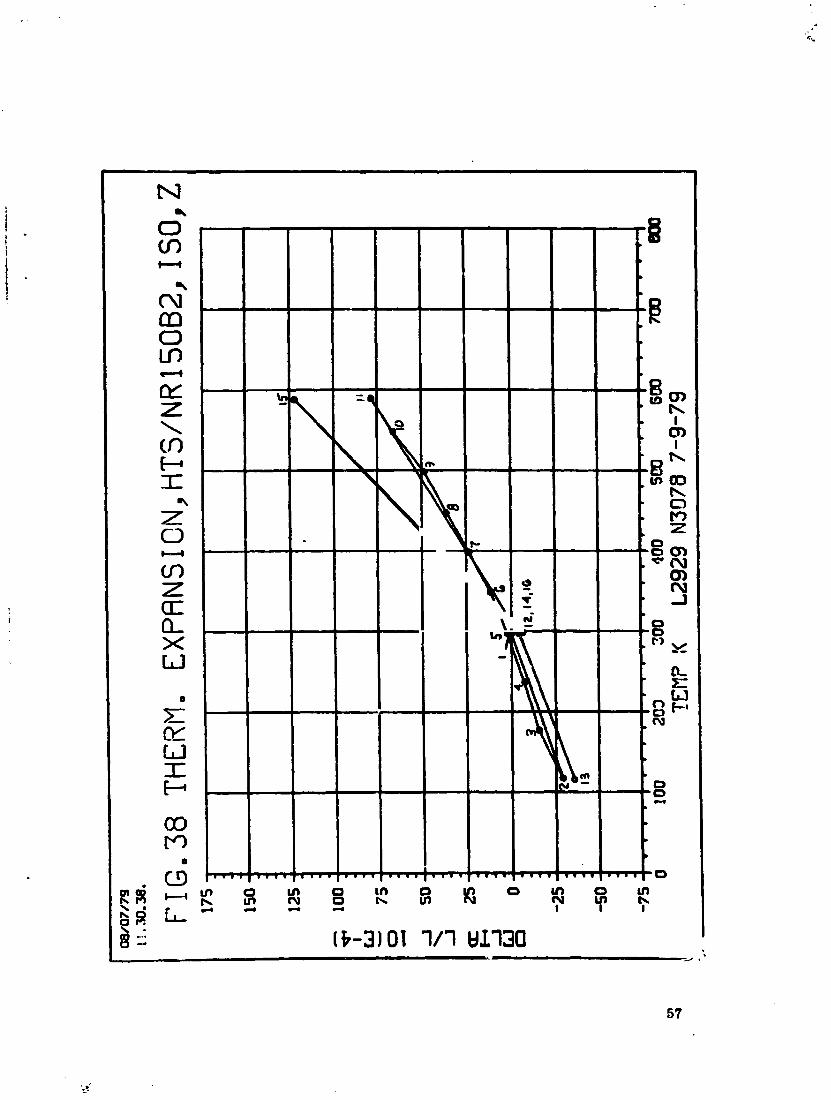
It is more appropriate to p r e s m t data graphically in the form of A1 /I versus tempemture s o that the thermal strain from point to point can be seen. All expansion data obtained on this program is presented in this form in Figures 23 through 38. The li.nes connecting the individual bl points are straight lincs and do not necessarily represent specim.-n behavior between the discreet points. Tabular data is contained in the Appendix.
For compviem purposes, CTE value6 Qplcal of the reeults bbr each specimen are given in lhble 3. me the reeulte often varied from cycle b cycle, they are only rqresenta t tve values to indicate the gross behavior of the sample. Where there were sigdficaut differeaces between slopes above and below ambient tempexature two values are listed.
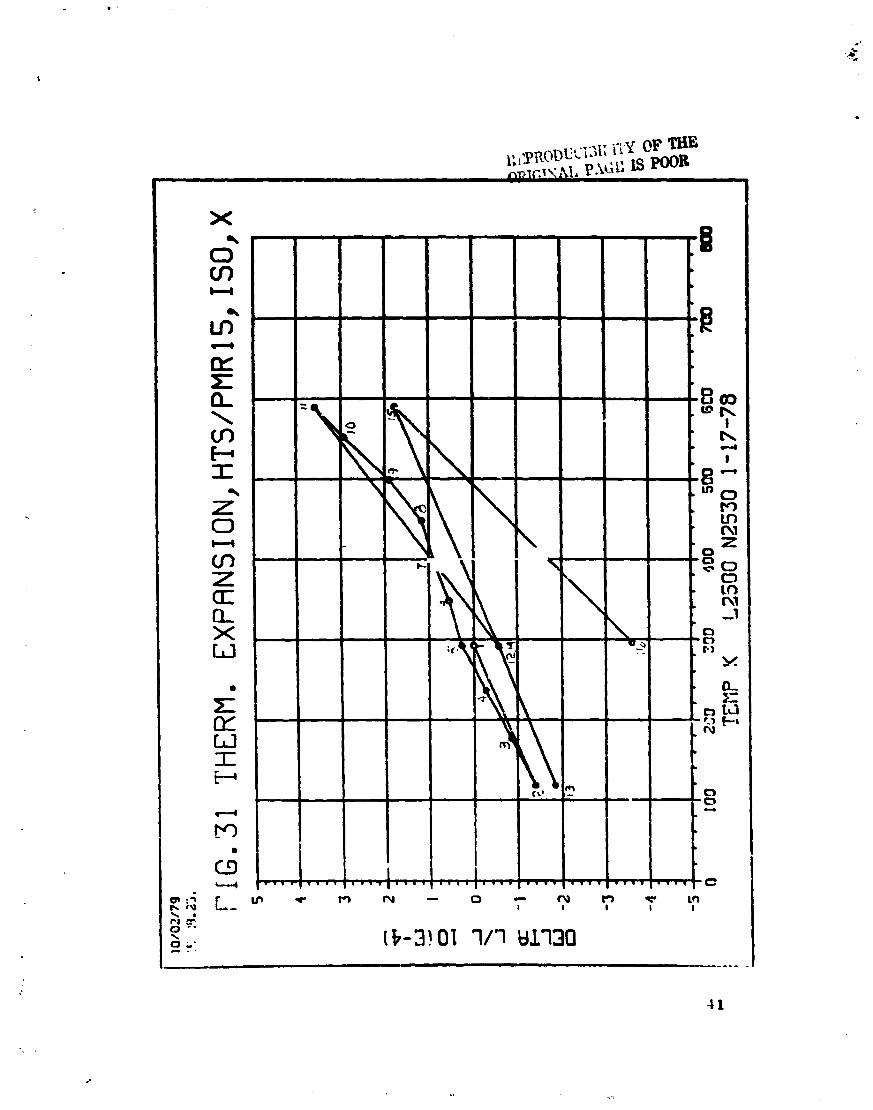
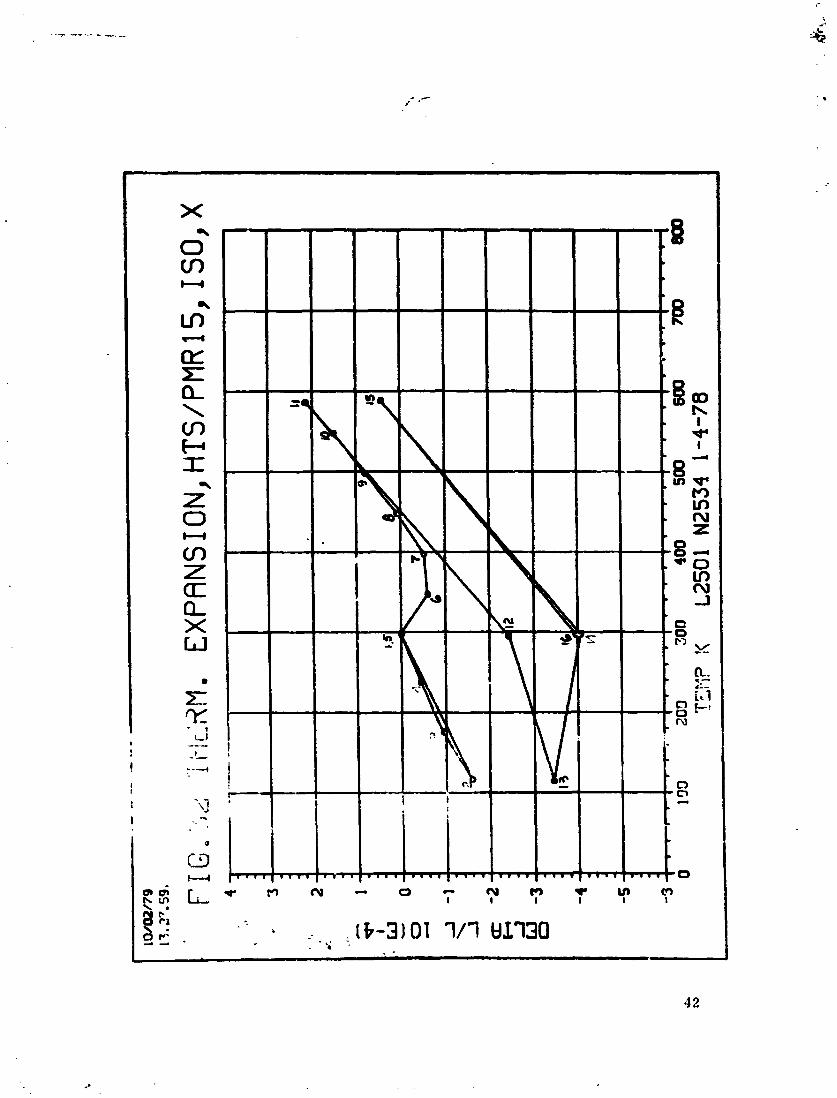
The combtoation of the negative CTE fiber and the positive CTE res in produced very low cqxuwion in the X direction lif both unidirectional layups. Here, the full effect of ths fibers is exhibited, During the initial t h e d cycle both materials had slope sign changes f iom m i m e to plus in the 400 - 450 K m e . Slopes ranged from approximately -.4 x m/m& to +.6 x m/m/K fo r the PMR 15 specimens and from -.5 x ~/ni1< to -.5 x m/m/K for the NR 150 specimens.
Both materials showcd a tendeacy to not return to the original length on w~ccessive thermal cycles. Mffcrences b e t w c e ~ values at 300K were as great as 2 x 1 ~ - ~ m/m for the N? 150 specimens (Piguros 25 3fit-l 26). With the exception of the final cycle on C2.133, this scattcr was roughly half for Ehc PMR 15 q e c f m e n s (Figures 23 and 24).
'Ihc f i rs t 11 points of each run (one fill1 cycle) were taken to define details of the bch:; i~r of the specimcn over the full temperature range. The remaining points werc taken to asses thc reproducibility of the behavior between end points. Points were takcn only at ambient (300K) and the extremes. The rate of temperature change I)ebvecn these points was considerably highcr than for the first 11 points because a greater range was covered in approximately the same time. It is not uncommcn for fiber rcinforccd composites to behave diffcrently as the cycling rate varies, particvlarly in thc CI.?~ccLLions w h c ~ thc CTE i s close to zcm.
In the Y direction of the unidirectional laminates where the matrix CTL dominates, the matrix differences are evident (Figurcs 27-30). CTE's werc approxin~ate!y 24 x 16 ' m/m/K for the PMR 1 spccimcns and 16 x lo-' m/m/K for the M 150. Thcse differences did not show in thc X direction where the common fiber dcvminatcs.
Scatter in the A1 data for the PMR 15 specimens was nearly twice as great as fo r the NR EO specimens.
With fcwcr fibers oriented in the X dirc-tion thc CTE in the X direction of a quasi- isotropic laminate should be more positivc than the X direction of a unidirectional laminate for the same graphite Bbcr and matrix. This was, Indeed, the case for Imth
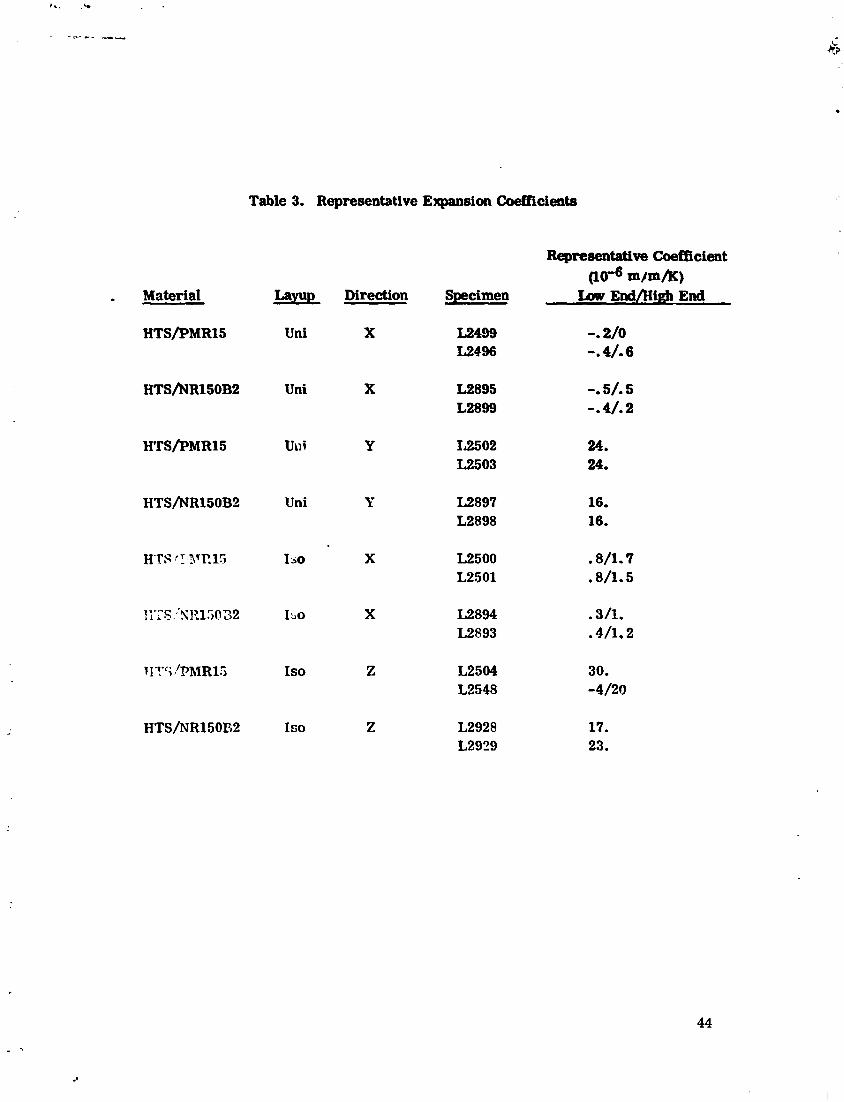
Table 3. Representative Expansion Coefncients
Representative Coefficient (10-6 m/mfi)
. Material Layup Direction Specimen l a w Eld/)Iigb End
H T S ~ ~ M R ~ ~ Uni X L2499 -. 2/0 L2496 -. 4/.6
~'I'ShlR150B2 Uni X L2895 -. 5/. 5 L2899 -. 4/. 2
H T s h ~ R 1 5 Uui Y I5502 24. L2503 24.
HTS/NRISOBB Uni I' L2897 16. L2898 16.
HTS ' I .3Tll j 150 X L2500 .8/1.7 L2.501 .8/1.5
materials with the CTE tecding to be positive over most of the temperature raagrt rather than negative at the low m d and slightly positlve at the high end for the unidirectional layups (Figures 23-26 and 31-34).
Expanston of the PMR 15 specimens was considerabb greeter than that of the NR 150B2 specimens with the former yielding slopes in the orde r o f . 8 to 1.7 r m / m / ~ and the latter .3 to 1.2 x m/rn/K.
Both materials exhibited a large amount of scatter over the thermal cycles. Differences in ambient length9 were approximately 2 x m/m fbr the NR 15002 and 4 x 10-* m/m for the PMR 15. Both NR 15082 sprcimees produced about the same results. Results for the two PMR 15 specimens were different from each other both in shapes of the b 1 /I curves and total change in length from 113K to 588K.
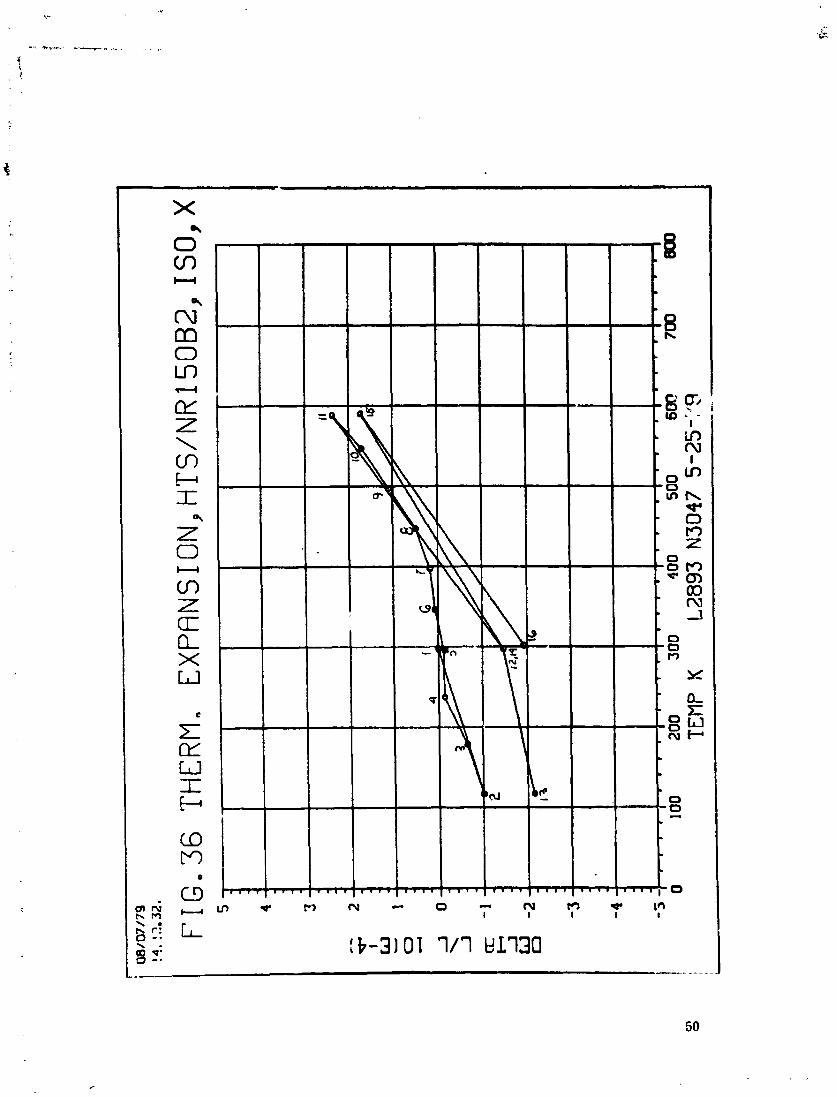
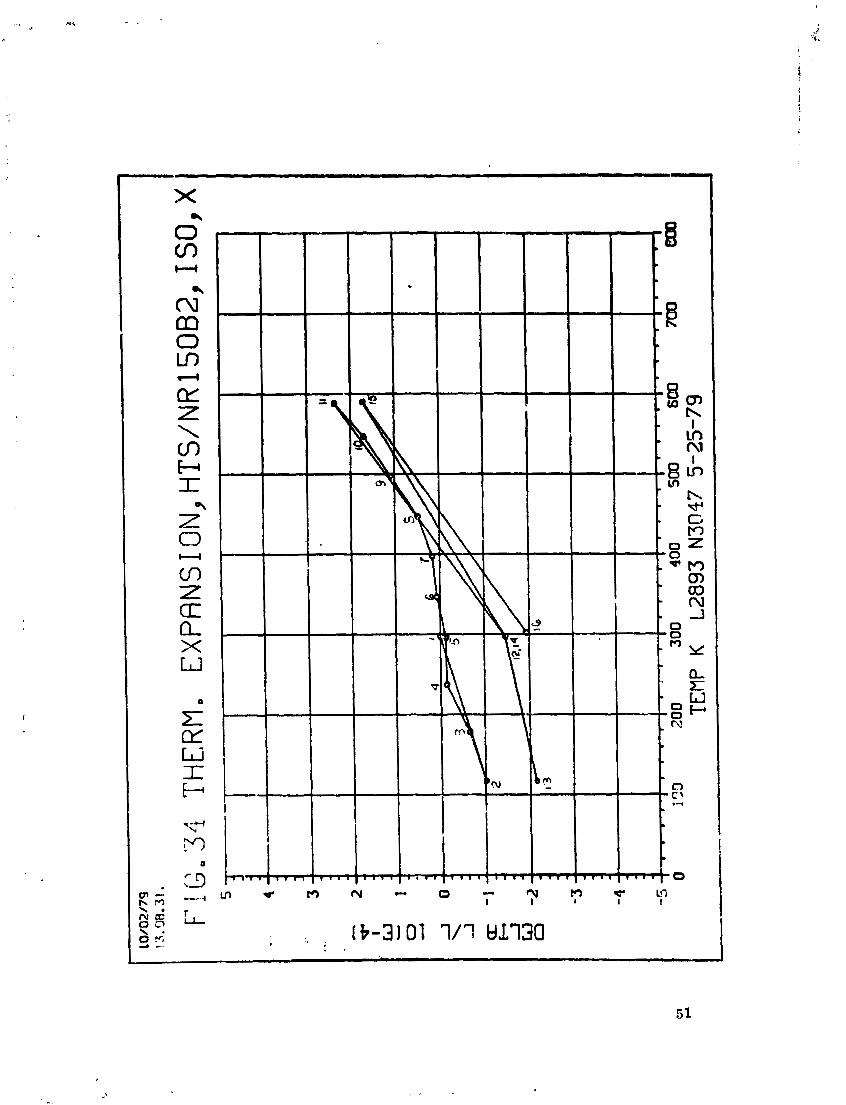
It is generally assumed that the Z direction in any laminate is similar in CTE to the Y direction in the unidirectional lamlnatc since no fibers run in either of these directions. In reality, the lack of pcrfect alignment of the fibers in the prepreg creates some fiber effectiveness in the unirlircctional Y direction and n lower CTE. This was the case for both msterials, with the exception of the very low values fo r one HTS/PRIR 15 isotropic Z specimen, L2538 (Figures 35-38).
Microscopic examination of this specimen revealed it was d e l a m i m t d in some areas , had cxccssivdy non-paraIlel plies and high void content. The latter two defects would tend to minimize the contribution of the matrix and hence, lower the C1E.
Specific Heat
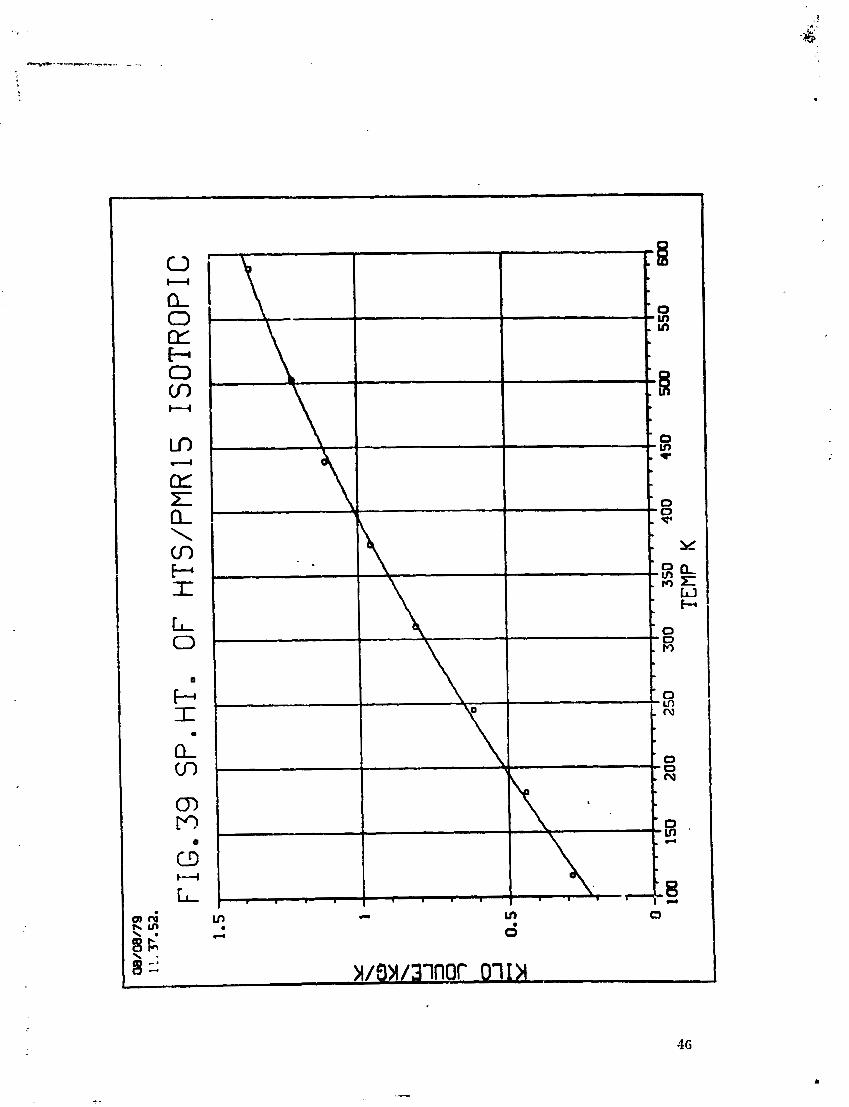
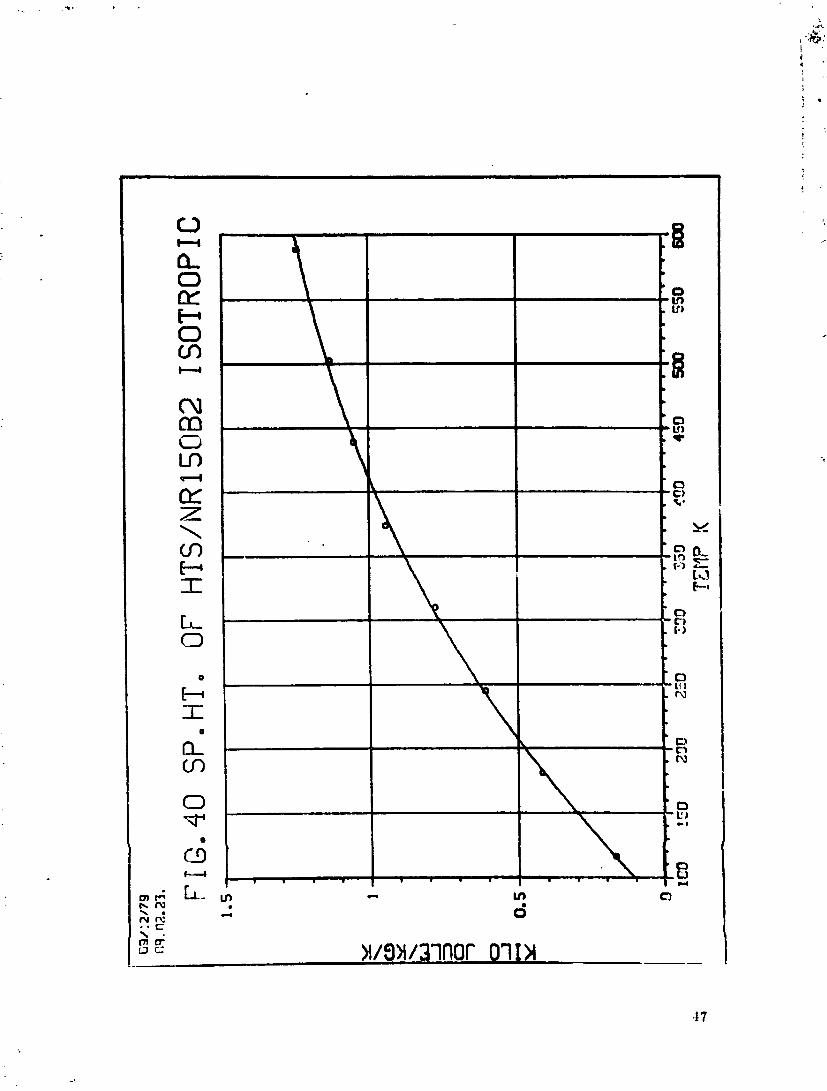
Specific heat results for both materials arc plottcd in Figures 39 and 40. The curves a r e best fit quadratics, The individual data poirlts a r e tahtlated in the Appendix.
Although the fiber is the same in both materials (HTS), the resins a r e ~ u ~ c i c n t l y diflcrent in structure to result in a diffcrcnce in their specific heats. As the dn.tn
shows, average specific heat of thc PhIR 15 samples was consistently higher than that for the NR150 B2.
LC) z
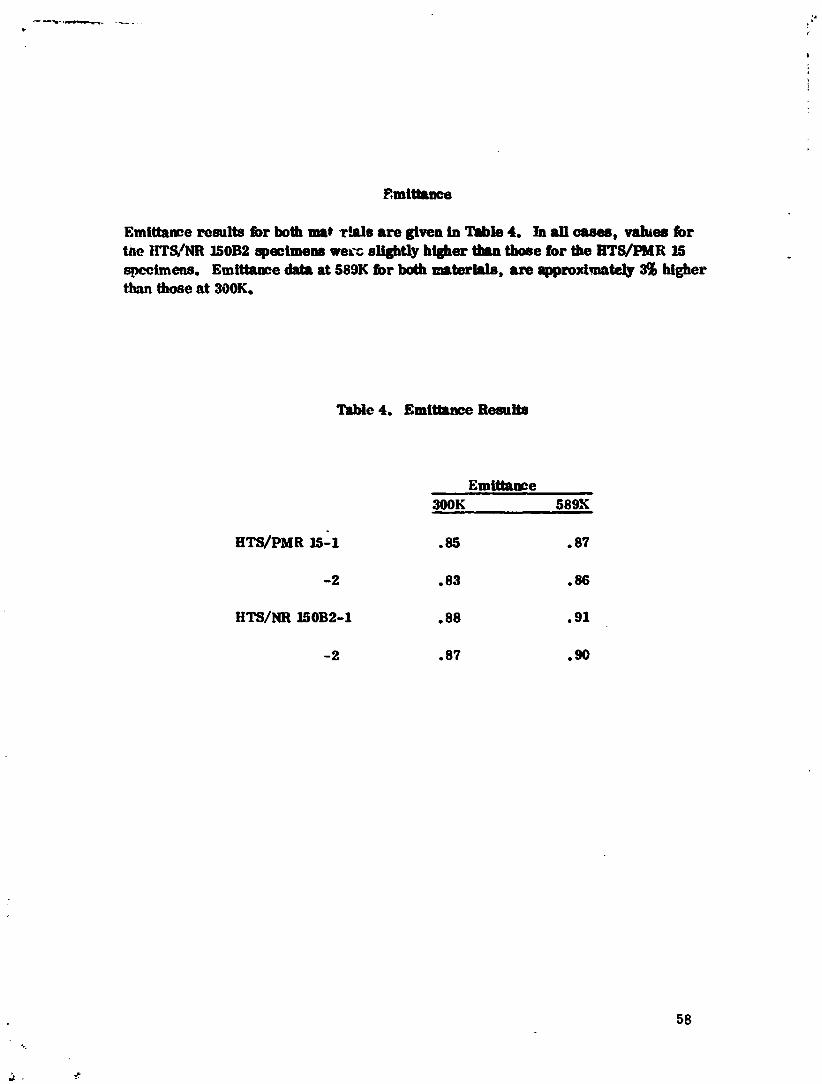
Emittance result8 fix both mat ~ i a l e are given in 'Ikble 4. In an caees, value8 fbr the B T S / M 150B2 speeimena w e ~ x elightly higher tban W e for the HTS/PMR 15 specimens. Emittance data at 589K bor both materials, are apprort?111~Wy 3% higher than those at 300K.
CONCLUSIONS
FolboPing are coachrstons which can be drawn from the test reslllts Bor erch prqpsrtp.
Thermal conQctlvitles of BTS/PMR 15 and HTS/NR WOB2 are vary similar io the irratropic Z a d unidirectional Y dilpectlon where the r d n pmgerth Q m W .
Significant differences bdiween the two materials were observed i n the unldirectimal X and isotropic X dimctions whew the fiber properties dominate. It is euspected that the differences result from the higher void content of the HTS/NRlWB2 contrih~tbg to artiflcally low test results.
Thermal Expansion
Scatter was high and reproducibility was poor for both materialr, leading to the conclusion that laminate quality when compared to those BDF lower temperature resin systems, was not optimum in either case.
Higher expaneion of the PMR 15 laminates in all except the uuidirectional X direction where the fiber dominates, indLcateb a higher coeificient for PMR 15 than NR 15OB2.
*ecific Heat
Differencies between speciflc heats for the two materials were expected due t;. differences in structures of the resins. Vdues fir the HTS/PMR 15 specimetis were consistently higher thrur those for the HTS/NR 150B2 epecimene with the difference being approximately 4% at 300K.
Values for the HTS/LNR 150B2 samples were approximately 4% higher than those for HTS/PMR 15. In both cases, 589K resiilts were approximately 3% higher than the rcsults at 300K.
APPENDIX
Tabular Test Data
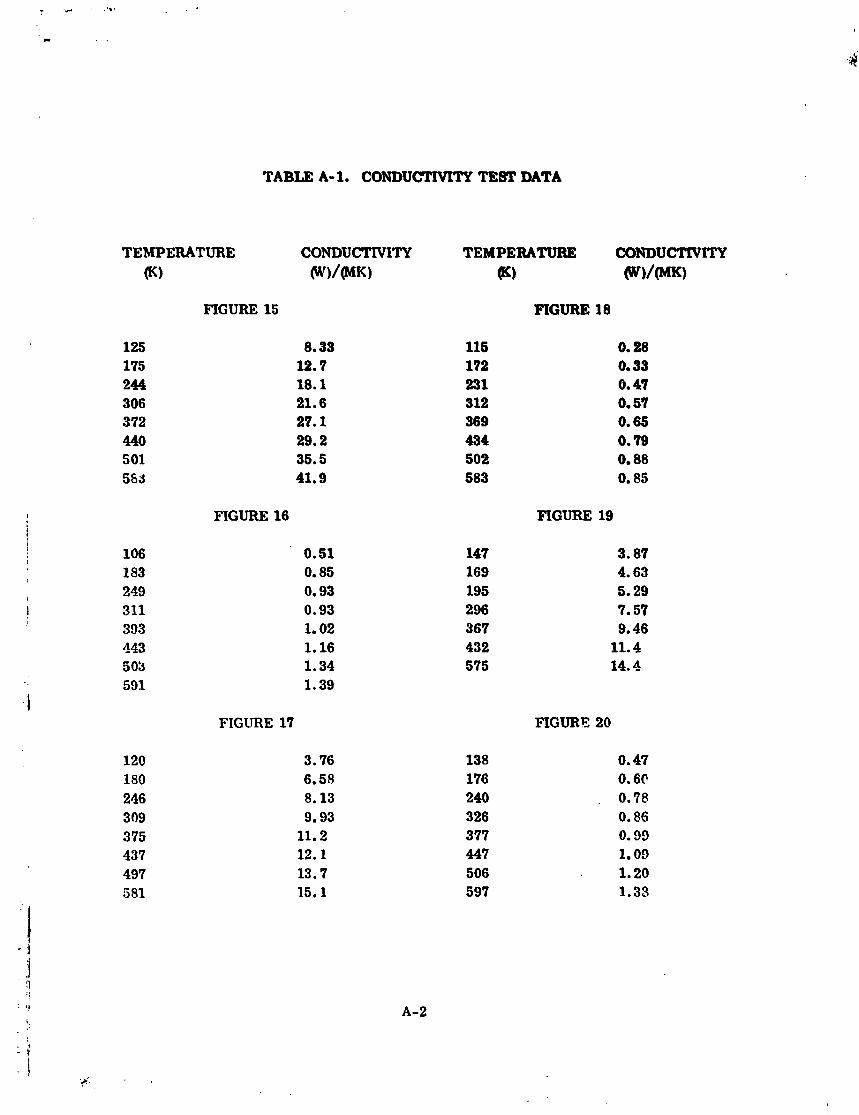
TABLE A-1. CONDUCTIVITY TEST DATA
TEMPERATURE CONDUCTMTY TEMPERATURE
FIGURE 15
FIGURE 16
FIGURE 17
FIGURE 18
FIGURE 19
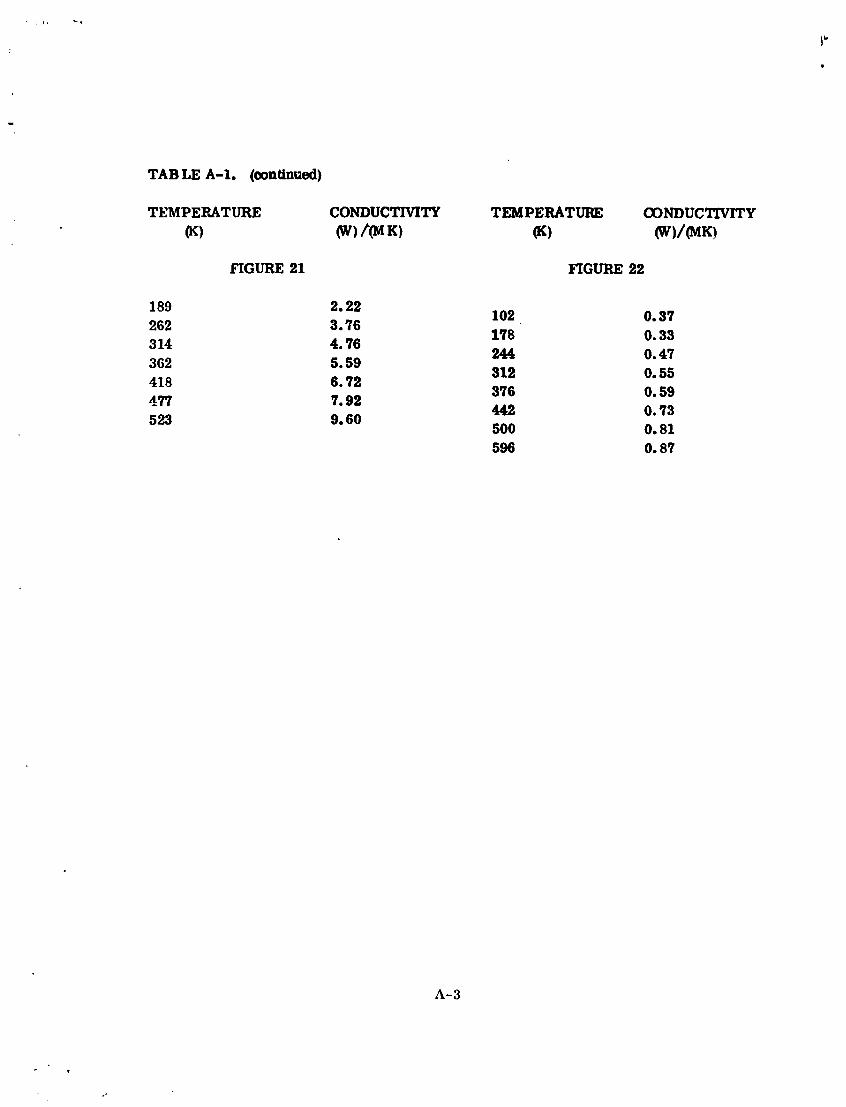
T A B LE A-1. (continued)
TEMPERATURE CONDUCTMTY W) (W) IW K)
FIGURE 22
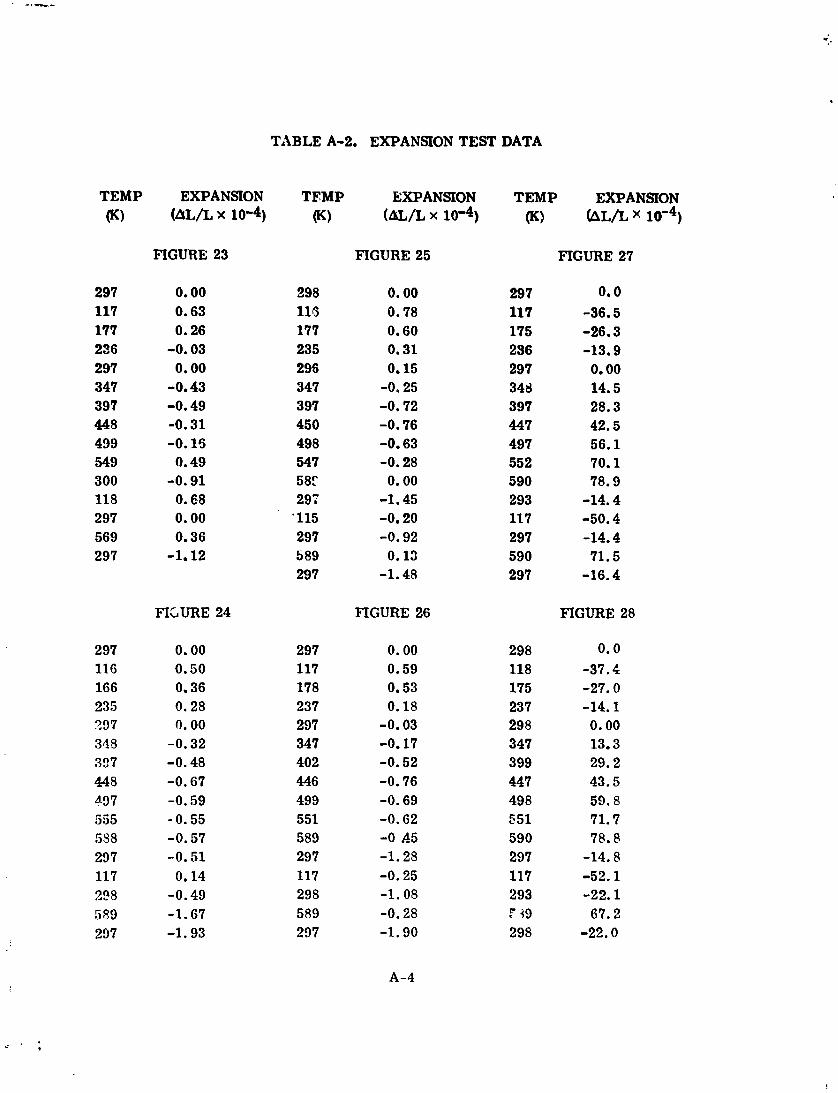
TABLE A-2. EXPANSION TEST DATA
TEMP EXPANSION TEMP EXPANSION TEMP EXPANSION (K) @L/L x 10-4) v) (U/L x 10-4) (10 ~ L I L x 10-4)
FIGURE 23 FIGURE 25 FIGURE 27
FIGURE 24 FIGURE 26 FIGURE 28
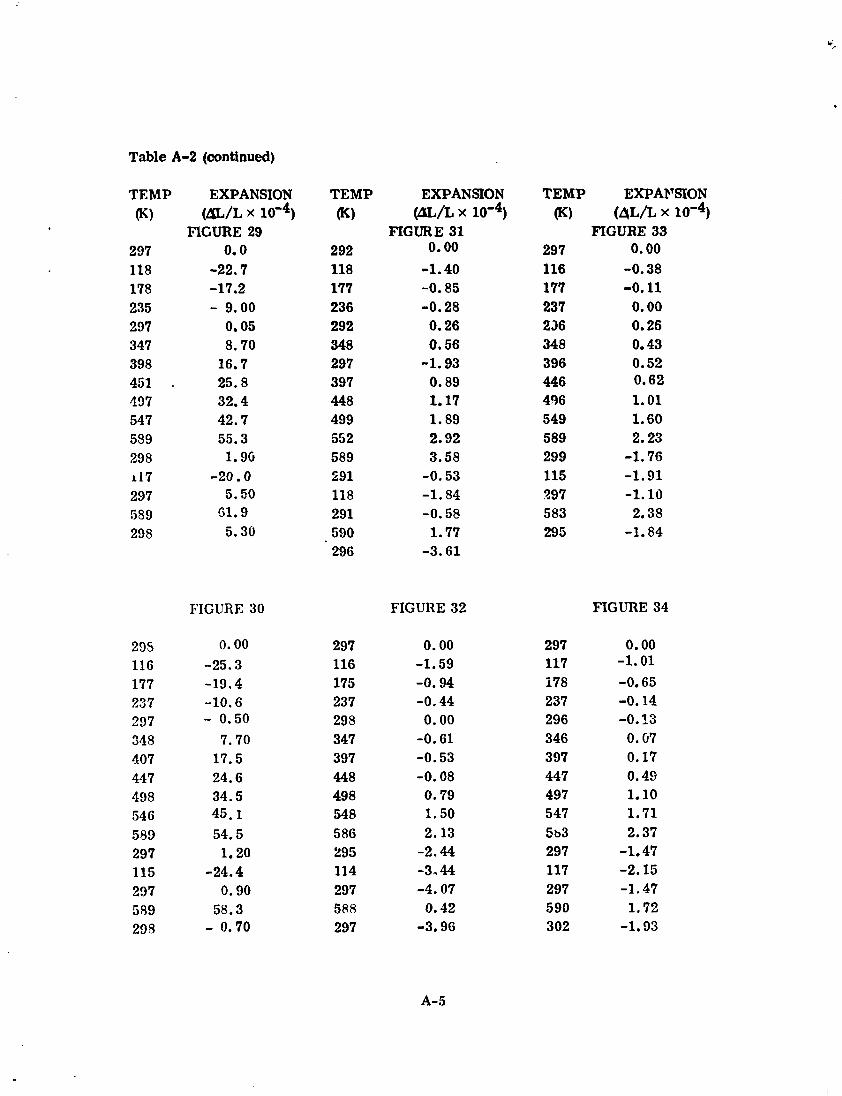
Table A-2 (continued)
TEMP (K)
297 118 178 235 297 347 398 451 . 497 547 589 29 8 117 297 589 298
29s 116 177 23 7 297 348 107 447 498 546 559 297 115 207 589 29 8
EXPANSION (WL x 10'4)
FlGURE 29 0.0
-22.7 -17.2 - 9.00
0.05 8.70
16.7 25.8 32.4 42.7 55.3
1.9G -20.0
5.50 51.9 5.30
FIGURE 30
0.00 -25.3 -19.4 -10.6 - 0.50
7.70 17.5 24.6 34.5 45.1 54.5
1.20 -24.4
0.90 58.3
- 0.70
TEMP W)
292 118 177 236 292 348 297 397 448 499 552 589 291 118 291 590 296
297 116 175 237 298 347 397 448 498 548 5 86 295 114 297 588 297
EXPANSION (&/L x 10'~)
FIGURE 31 0.00
-1.40 -0.85 -0.28 0.26 0.56
-1.93 0.89 1.17 1.89 2.92 3.58
-0.53 -1.84 -0.58 1.77
-3.61
FIGURE 32
TEMP EXPAFSION (K) ( 4 ~ 1 ~ x 10-4)
FIGURE 33 297 0.00 116 -0.38 177 -0.11 237 0.00 236 0.25 348 0.43 396 0.52 446 0.62 496 1.01 549 1.60 589 2.23 299 -1.76 115 -1.91 297 -1.10 583 2.38 295 -1.84
FIGURE 34
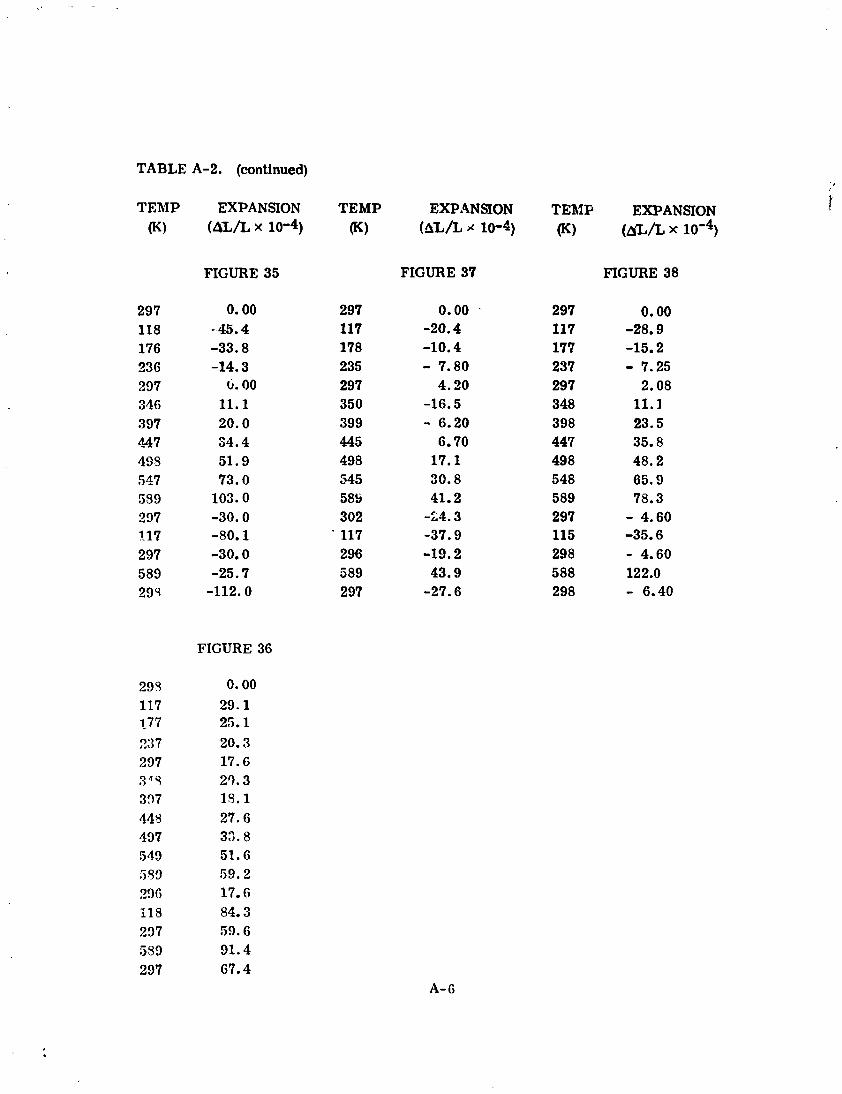
TABLE A-2. (continued)
TEMP EXPANSION
FIGURE 35
FIGURE 36
TEMP (10
297 117 178 235 297 350 399 445 498 545 589 302 117 296 589 297
EXPANSION (4L/II ,: 10-4)
FIGURE 37
TEMP EXPANSION
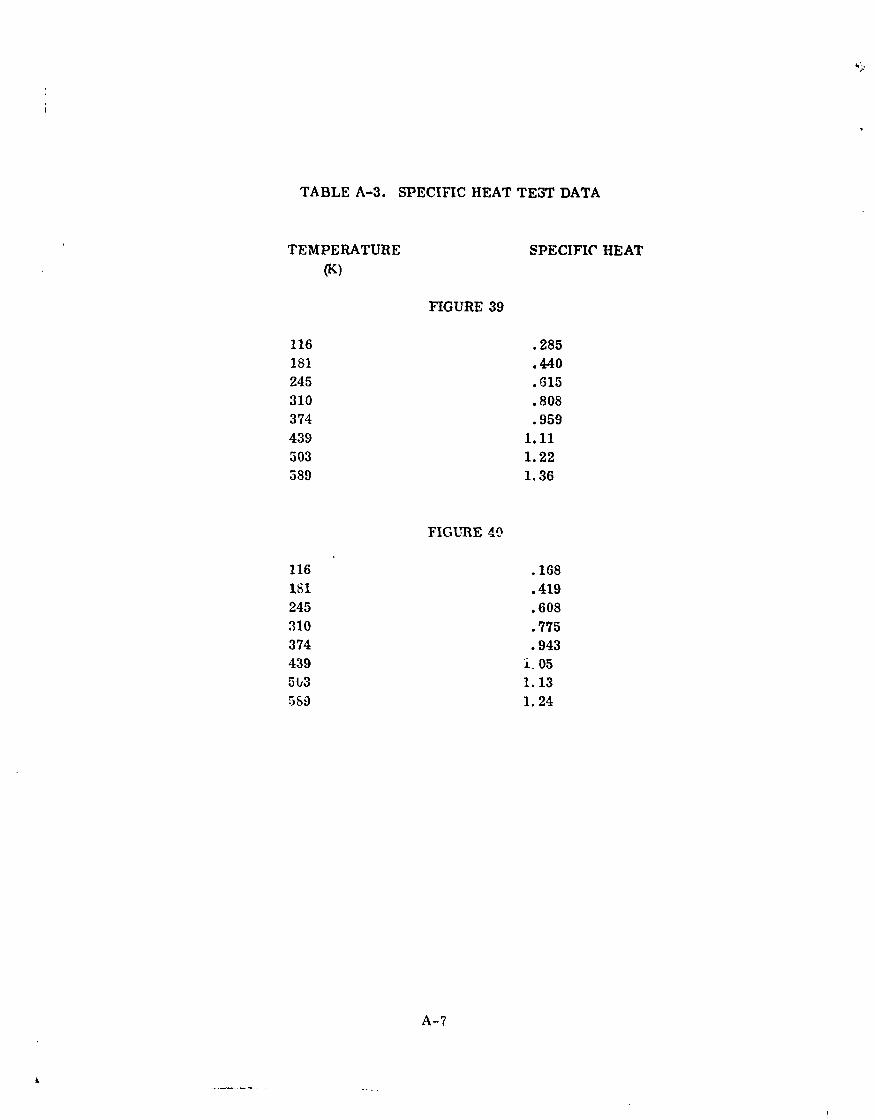
TABLE A-3. SPECIFIC HEAT TEST DATA
TEMPERATURE (K)
FIGURE 39
FIGURE 49
SPECIFIC HEAT
.- .
t. kart No. 2. Gomnment Accmion No. 3, Recipknt'~ Catalog No.
NASA CR-158164 - 4 Title md Subtitle 6. 7rport .bee
Thermophysioal Properties Data an Oraphite/PolS. iwide . 1 130ve1liber, 1979 .I Composite Materiala 8. Pwforming Organization ode
7. Author(s) 8. Performing Orgen~zaticn Report No.
M. D. Campbell and D. D. Burleigh - 10. Wo,:. Unit No.
9. Performing Organization Name and Address
General Dynamics Convair Div. 11. Contract or Grant No.
P. 0, Box 80847, MZ 43-6332 NAS 1-15 108 San Diego, CA 92138 - 13. Type of Report and Period Ccvered
12. Spunswing Agency Ndme and Address Contr&.~r Report (Final) National Aeronautics and Space Administration 14. Army Project No. Washington, D. C. 20546
I
15 Supplementary Notes I Contract Monitor: Dr. Ronald K, Clark, NASA Langley Research Center
- If3 Abstract .-f
i Experimental data for the t hem& conductivity, thermal expansion, specific heaa., and emittance of [o] and [o, 45, 90, 1351 laminates of HTS/NR 150B2 and HTS/PNH 1.5 are nresented. Measurements were made over the temperature rang: 116K to 588K
i (-2.7OF to GOOF).
Results for the two materials were similar with some differences attributable to I 1nmi.natc quality. Higher expamion coefficiests for the HTS/PMR 15 specimens in the rcsin-dominated directions indicate a higher coefficient for PMR 15 than NR 150B2. 1
17. Key lVords (Suygrsted bL. Authork)) 18. Distribution Statement
Thcrmophysical Properties GraphitdPolyimide Unclassified - Unlimited Composites
1 - 13. P%curity Ctawif. (of th~s report) ) 20. Security Clars~f. (of this pap) ] 21. No. of Pages 1 22. Price'
I
Unclassified Unclassified 66 1 . For sale by the National Technical Information Service, Springfield, Virginia 22161

![Physical Origins of Thermal Properties of Cement Paste · are inversely proportional to the thermal diffusivity of cement paste [1]. During the use phase, the thermophysical characteristics](https://img.pdfslide.net/doc/110x75/5e7f3dbd4d823774c40e3e75/physical-origins-of-thermal-properties-of-cement-paste-are-inversely-proportional.jpg)