Embed Size (px)
Citation preview
DIPLOMARBEIT
Titel der Diplomarbeit
Expression of OATP Transporters
in Human Colorectal, Lung and Ovarial Cancer:
Impact on Therapy
angestrebter akademischer Grad
Magistra der Pharmazie (Mag.pharm.) Verfasserin / Verfasser: Angela Johanna Schöffmann
Matrikel-Nummer: 0400865
Studienrichtung /Studienzweig (lt. Studienblatt):
A449 Pharmazie
Betreuerin / Betreuer: Ao. Univ.-Prof. Mag. Dr. Walter Jäger
Wien, am 1. September 09


ACKNOWLEDGEMENTS
First and foremost, I would like to express my sincere gratitude to my supervisor Ao.
Univ.-Prof. Dr. Walter Jäger (Department of Clinical Pharmacy and Diagnostics,
University of Vienna) for the possibility to undertake my research, and all his
capacious support during my diploma thesis.
I would like to thank my supervisor Ao. Univ.-Prof. Dr. Theresia Thalhammer
(Institute of Pathophysiology, Medical University of Vienna) for all her support,
patience and understanding during the course of my work, and her guidance in every
concern.
All my research work would not have been feasible without the help and guidance of
my doctoral students and lab mates, Mag. Martin Svoboda, Mag. Katrin Wlcek, and
DI (FH). Richard Liedauer, who never got tired of answering all my questions and
providing me with all the help and information I needed throughout the course of my
thesis.
I would also like to thank Stefanie Psaier and Claus Schanab for their company, help
and motivation.
Thanks to all other staff of the Department of Pathophysiology. I really appreciated
the work with all my colleagues and cherish their support whenever I could not go
further on my own.
Finally, I deeply thank my parents, my sister and brother, my grandmother, Stefan
Gattereder and Daniela Zweiner for all their continuous and never ending
encouragement during the course of my diploma thesis, especially during the
exhausting last semester of my studies.
To these precious people I dedicate this work.

TABLE OF CONTENTS
1 ABSTRACT ........................................... .................................... 1
2 AIMS OF THE THESIS ................................. .............................. 4
3 INTRODUCTION ....................................... ................................. 6
3.1 The Organic Anion Transporting Polypeptides OATPs.. ............................ 6
3.1.1 General Information .............................................................................. 6
3.1.2 Classification and Nomenclature........................................................... 7
3.1.3 Function, physiological importance and pharmacological aspects ........ 9
3.1.4 OATP sub-families and their members – functional properties ........... 12
3.1.5 Aspects for OATPs in Drug Response ................................................ 15
3.1.6 Drug-drug interactions......................................................................... 17
3.1.7 Drug-food Interactions......................................................................... 17
3.1.8 OATPs and Cancer ............................................................................. 18
4 METHODS AND MATERIALS .............................. ..................... 19
4.1 Colorectal Tumor Tissue Samples .................... ......................................... 19
4.2 Cell Culture – Maintenance of Cells ................ ........................................... 19
4.2.1 General ............................................................................................... 20
4.2.2 Thawing of Cells.................................................................................. 20
4.2.3 Maintaining Cells in Culture – Washing and Feeding.......................... 21
4.2.4 Splitting of Cells .................................................................................. 21
4.2.5 Freezing of Cells ................................................................................. 21
4.3 Mycoplasma Testing................................. ................................................... 22
4.4 Spheroid Inducing Cell Culture ..................... ............................................. 25
4.5 Protein Purification............................... ....................................................... 26
4.5.1 Protein Purification 1 – Total Protein................................................... 26
4.5.2 Protein Purification 2 – Cytosolic and Membrane Protein ................... 27
4.6 Bradford Protein Assay............................. .................................................. 28
4.7 Polymerase chain reaction (PCR).................... ........................................... 30
4.7.1 General Information ............................................................................ 30
4.7.2 Phases of PCR.................................................................................... 31
4.7.3 Data Analysis ...................................................................................... 32
4.7.4 Calculation .......................................................................................... 33
4.7.5 Detection............................................................................................. 36
4.7.6 Implementation.................................................................................... 37
5 RESULTS AND DISCUSSION ............................. ...................... 40
5.1 Cell Lines – A Short Characterization .............. .......................................... 40
5.2 Expression of OATPs in Human Colon Carcinoma Cell L ines................. 41
5.3 Expression of OATPs in Colorectal Cancer Samples... ............................ 45
5.4 Expression of OATPs in Human Lung Cell Lines ....... .............................. 50
5.5 Expression of OATPs in Ovary Cell Lines ............ ..................................... 53
5.6 Discussion and Conclusion.......................... .............................................. 55
6 SUMMARY ............................................ .................................. 59
7 LIST OF TABLES ..................................... ............................... 61
8 LIST OF FIGURES.................................... ............................... 62
9 REFERENCES......................................... ................................ 63
CURRICULUM VITAE ................................... .................................. 71
1
1 ABSTRACT
Colorectal cancer is one of the most frequent malign diseases worldwide, accounting
for thousands of incidences every year. The investigation of the expression of
transporters capable of influencing cancer treatment could be more than a small
contribution to better therapy and lead to a better prognosis of colorectal cancer in
the future.
In this respect, transporters of the organic anion transporting polypeptides
(OATP) are interesting, as they mediate the transport of a broad spectrum of anionic
substances, also including anticancer drugs to cancer cells.
Until now, 11 human OATPs have been detected. Their distribution in normal
tissue as well as in neoplastic tissue has been the subject of many recent studies.
Nevertheless little knowledge about their expression in colorectal cancer has been
gained so far. However, the OATP superfamily is assumed to play an important role
in efficacy of chemotherapy. Therefore, the subject of the present thesis was to
investigate the expression of human OATPs on the mRNA level in three different
sample types of tumor, namely human colorectal cancer (human colorectal cancer
samples, with the adjacent healthy tissue, and colon cancer cell lines), human lung
cancer, and human ovary carcinoma. Investigations are done by real time PCR and
data are analyzed using Microsoft Excel®. The expression rates are expressed as
MNE (mean normalized expression value), and consistently refer to the calibrators’
mean MNE value.
In colorectal carcinoma samples six transporters show upregulation in
cancerous tissue, i.e. 1B3, 2A1, 3A1, 4C1, 4A1 and 5A1. Most remarkably,
OATP1B3 exceeds the second threshold in four samples, showing expression rates
ranging from MNE 4.32 up to MNE 8.27. The most conspicuous expression level
could be demonstrated for OATP4A1, reaching a MNE value of 9.85. Remarkably, in
the adjacent normal tissue from the colon cancer patients, upregulation of these
OATPs is not detectable.
Real time PCR studies in lung and ovary carcinoma cell lines show that
OATPs 3A1, 1A2, 4A1, 4C1, and 5A1 are up regulated, but the expression rates are
rather homogenous. The most surprising result is demonstrated for OATP3A1 in
2
DMS 456 cells (i.e. human small cell lung carcinoma cells). It shows a 14.7 fold
upregulation.
Taken together, the data shows that OATPs are widely expressed in colon
cancer and the OATP superfamily might be taken as a marker during anticancer
therapy.
Das Kolorektalkarzinom stellt eine der häufigsten malignen Krankheiten weltweit dar,
und zeichnet für tausende Krankheitsfälle jährlich verantwortlich. Die Expression von
Transportern, die fähig sind die Effektivität von Chemotherapien zu beeinflussen, zu
untersuchen könnte daher in Zukunft ein logischer und erforderlicher Beitrag zur
Optimierung der Behandlung und Verbesserung der Prognose sein.
In dieser Hinsicht sind Transporter der organische Anionen transportierende
Proteine („Organic anion transporting polypeptides“, OATPs) interessant, da sie die
den Transport eines breiten Spektrums an oranischen, anionischen Substanzen
vermitteln. Selbsterklärend zählen zu diesen auch die in der Krebstherapie
verwendeten Arzneistoffe.
Bis zum jetzigen Zeitpunkt wurden 11 humane OATPs entdeckt. Ihre Expression,
sowohl in gesundem, als auch in entartetem Gewebe, war und ist Gegenstand vieler
rezenter Studien. Nichtsdestotrotz ist bisher nur wenig über ihr Auftreten in
Tumorgeweben bekannt. Da den Transportern jedoch eine große Rolle im Rahmen
der Wirksamkeit von Chemotherapien zugeschrieben wird, war es Ziel der
vorliegenden Arbeit die Expression der einzelnen OATPs auf mRNA Level zu
untersuchen.
Als Material fanden drei verschiedene Tumortypen Verwendung: humanes
Kolonkarzinom und dessen umliegendes gesundes Gewebe, humanes Lungen- und
Ovarialkarzinom. Die Forschungsergebnisse werden unter Verwendung der Real
Time PCR Technik erzielt, und die Daten mit Hilfe von Microsoft Excel® ausgewertet.
Die Ergebnisse werden durchwegs als „MNE“ (mean normalized expression value)
und in Abhängigkeit vom mittleren MNE-Wert zweier Kalibratoren angegeben.
In den untersuchten Kolorektalkarzinomproben der Patienten kann Hochregulierung
von sechs Transportern, 1B3, 2A1, 3A1, 4C1, 4A1 und 5A1 nachgewiesen werden.
Der Transporter OATP1B3 zeigt mit MNE-Werten zwischen 4.32 und 8.27 in vier
3
Proben signifikante Hochregulierung, wobei die bemerkenswertesten Ergebnisse von
OATP4A1 (MNE 9.85) erzielt werden. Interessanter Weise ist im umliegenden
gesunden Gewebe der Kolonkarzinompatienten keine Hochregulierung dieser
OATPs feststellbar.
Zusätzliche Real Time PCR Screenings von Lungenkarzinom- und
Ovarialkarzinom-Zelllinien zeigen, dass auch die Transportergene 3A1, 1A2, 4A1,
4C1 und 5A1 hoch reguliert werden. Ungeachtet dessen sind die Expressionsraten
durchwegs eher homogen. Besonders sticht allerdings die Expression des OATP3A1
in der Zelllinie DMS 456 (Zelllinie des humanen kleinzelligen Lungenkarziom) mit
14.7-facher Hochregulierung hervor.
Zusammenfassend zeigen die erhaltenen Daten, dass die Transporter der
OATP Superfamilie im Kolorektalkarzinom weit verbreitet vorkommen, und daher
zukünftig als Marker im Zuge einer Krebstherapie verwendet werden könnten.
4
2 AIMS OF THE THESIS
Colorectal cancer is one of the most frequent malign diseases worldwide, accounting
for thousands of cases every year. As dietary factors seem to play a vicious role in
the formation of cancerous colorectal tissue, the highest incidence can be observed
in the civilized Western countries.
Colorectal cancer can be of hereditary origin, or it can be caused by inflammations in
the gastrointestinal tract. In most cases, however, it appears without predisposition.
The treatment of colorectal carcinoma is primarily surgical, obtaining a rate of
success of approximately 75 %. In cases where surgical intervention does not lead to
satisfying results, either palliative resection can be applied, or the patient needs to
undergo chemotherapy. Most frequently, the fluoropyrimidines 5-fluoruracil (5-FU)
and floxuridine, and thiotepa are applied (Lui et al., 2005).
The organic anion transporting polypeptides form a group of transporter proteins of
which 11 different human subtypes are known until now. They account for the
transport of organic anionic substances, for instance bile salts or thyroid hormones.
However, the most important aspect of this transporter superfamily is the fact that
they are closely associated with drug absorption and excretion. Hence, they are
considered to play an important role referring to drug-drug or drug-food interactions,
drug side effects and drug efficacy in general. As the transporters’ expression is up-
regulated in certain tumors they might be the reason for inefficient chemotherapy,
leading to poor prognosis for the patients, and also increased side effects.
The expression of the 11 known human SLCO (solute carrier organic anion
transporter family) genes is the objective of the present thesis. By investigating the
expression rates in four different types of samples, including samples from cancer
patients as well as established cancer cell lines, additional knowledge about the
upregulation of the OATP family in cancerous tissues should be achieved.
The aim of the thesis will be to elucidate the expression pattern of OATPs on the
mRNA level by real time PCR. The results obtained by real time PCR then are
analyzed by calculation programs. In addition attention will be paid on the distribution
of the OATPs within the different sections of the colon to show whether upregulation
of the transporter might be coupled not only with tumor stage but as well with the
5
tumor’s localization within the gut. OATP transporters therefore may act as tumor
markers in future anticancer treatment.
6
3 INTRODUCTION
3.1 The Organic Anion Transporting Polypeptides OAT Ps
3.1.1 General Information
The organic anion transporting polypeptides (OATPs in human, Oatps in rodents) are
sodium-independent membrane transport proteins mediating the transport of various
generally amphipathic organic compounds, including bile salts, organic dyes, thyroid
hormones, steroid conjugates, anionic oligopeptides and numerous drugs, and other
xenobiotics (Hagenbuch and Meier, 2003).
In general, OATPs’ substrates are of high molecular weight (>450 KD) and
show high plasma albumin binding under physiological conditions.
Some OATPs are involved in the hepatic clearance of albumin-bound
compounds (Meier and Stieger, 2002). However, most OATPs are expressed in a
great number of tissues, including the blood-brain barrier, choroids plexus, heart,
lung, kidney, placenta, testes and intestine. The liver specific OATPs/Oatps are
localized at the sinusoidal (basolateral) plasma membrane domain of the
hepatocytes.
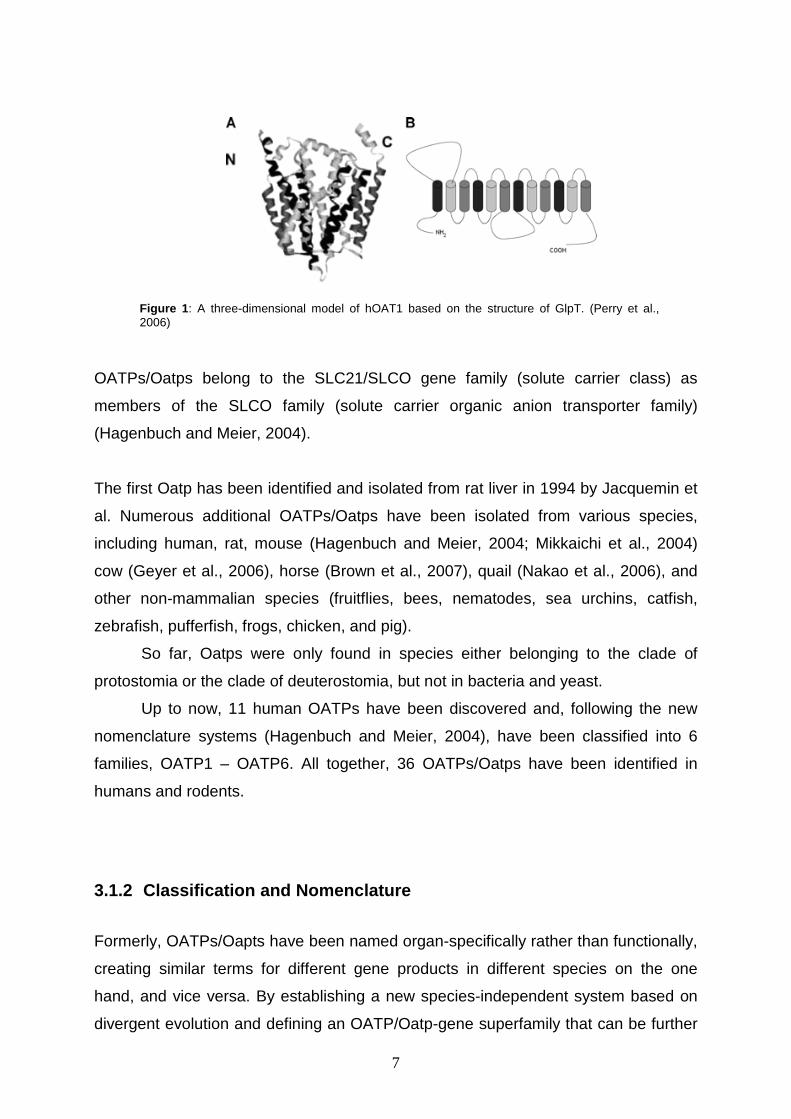
OATPs show 12 transmembrane domains (TM). All of them represent a large
extracellular domain (extracellular loop 5, between TM 9 and 10) containing mostly
conserved cystein residues with disulfide bonds, N-glycosylation sites in extracellular
loops 2 and 5, and the consensus superfamily signature between loop 3 and TM 6
(Hagenbuch and Meier, 2003).
In addition, Hagenbuch and Meier (2004) described that it consists of 643–722
amino acids, and are glycosylated. Glycosylation has been demonstrated to influence
membrane localization and transport function. Also intact disulfide bonds in
extracellular loop 5 are important. Without these requirements the transporter is not
expressed and shows no transport function (Hänggi et al., 2004).
7
OATPs/Oatps belong to the SLC21/SLCO gene family (solute carrier class) as
members of the SLCO family (solute carrier organic anion transporter family)
(Hagenbuch and Meier, 2004).
The first Oatp has been identified and isolated from rat liver in 1994 by Jacquemin et
al. Numerous additional OATPs/Oatps have been isolated from various species,
including human, rat, mouse (Hagenbuch and Meier, 2004; Mikkaichi et al., 2004)
cow (Geyer et al., 2006), horse (Brown et al., 2007), quail (Nakao et al., 2006), and
other non-mammalian species (fruitflies, bees, nematodes, sea urchins, catfish,
zebrafish, pufferfish, frogs, chicken, and pig).
So far, Oatps were only found in species either belonging to the clade of
protostomia or the clade of deuterostomia, but not in bacteria and yeast.
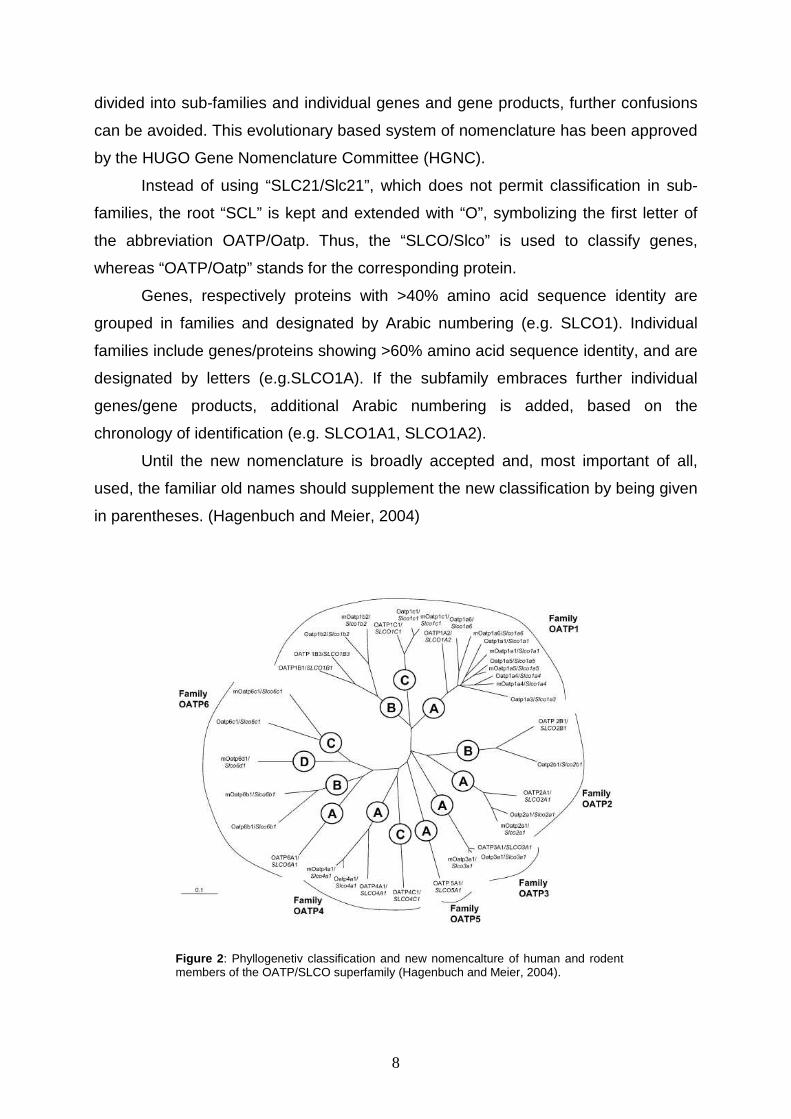
Up to now, 11 human OATPs have been discovered and, following the new
nomenclature systems (Hagenbuch and Meier, 2004), have been classified into 6
families, OATP1 – OATP6. All together, 36 OATPs/Oatps have been identified in
humans and rodents.
3.1.2 Classification and Nomenclature
Formerly, OATPs/Oapts have been named organ-specifically rather than functionally,
creating similar terms for different gene products in different species on the one
hand, and vice versa. By establishing a new species-independent system based on
divergent evolution and defining an OATP/Oatp-gene superfamily that can be further
Figure 1 : A three-dimensional model of hOAT1 based on the structure of GlpT. (Perry et al., 2006)
8
divided into sub-families and individual genes and gene products, further confusions
can be avoided. This evolutionary based system of nomenclature has been approved
by the HUGO Gene Nomenclature Committee (HGNC).
Instead of using “SLC21/Slc21”, which does not permit classification in sub-
families, the root “SCL” is kept and extended with “O”, symbolizing the first letter of
the abbreviation OATP/Oatp. Thus, the “SLCO/Slco” is used to classify genes,
whereas “OATP/Oatp” stands for the corresponding protein.
Genes, respectively proteins with >40% amino acid sequence identity are
grouped in families and designated by Arabic numbering (e.g. SLCO1). Individual
families include genes/proteins showing >60% amino acid sequence identity, and are
designated by letters (e.g.SLCO1A). If the subfamily embraces further individual
genes/gene products, additional Arabic numbering is added, based on the
chronology of identification (e.g. SLCO1A1, SLCO1A2).
Until the new nomenclature is broadly accepted and, most important of all,
used, the familiar old names should supplement the new classification by being given
in parentheses. (Hagenbuch and Meier, 2004)
Figure 2 : Phyllogenetiv classification and new nomencalture of human and rodent members of the OATP/SLCO superfamily (Hagenbuch and Meier, 2004).
9
3.1.3 Function, physiological importance and pharma cological aspects
As their name already indicates, OATPs/Oatps mediate sodium-independent
transport (Jacquemin et al., 1994; Kullack-Ublick et al., 1995; Noé et al., 1997;
Walters et al., 2000) of organic anionic compounds, but the mechanism of transport
is not fully understood yet. It seems to be anionic exchange, coupling the uptake of
organic compounds with the efflux of another (e.g. bicarbonate, glutathione and/or
glutathione-S-conjugates) (Shi et al., 1995; Satlin et al., 1997; Li et al., 2000; Li et al.
1998).
All members of the OATP/Oatp superfamily seem to be able to mediate
bidirectional transport while the direction of the substrates’ transport likely depends
on the substrates’ local concentration gradients. In addition, the transport appears to
be pH-dependent and electroneutral (Nakao et al., 2006).
Most OATPs/Oatps mediate the transport of a wide range of amphipathic
compounds. This broad and partially overlapping substrate specificity has been
documented for mostly all members of the OATP1A- and OATP1B-subfamilies.
Therefore, they might play an important role in overall drug absorption and
disposition, together with the P-glycoproteins (MDRs/Mdrs) and the muldtidrug
resistance associated proteins (MRPs, Mrps).
Data provided by Fattinger et al. and Vavricka et al. (2000) indicate that co-
administration of specific OATP inhibitors may increase bioavailability of drugs
otherwise being highly metabolized by hepatic first-pass effect.
As a conclusion, OATPs/Oatps may have important effects on drug development and
therapy.
10
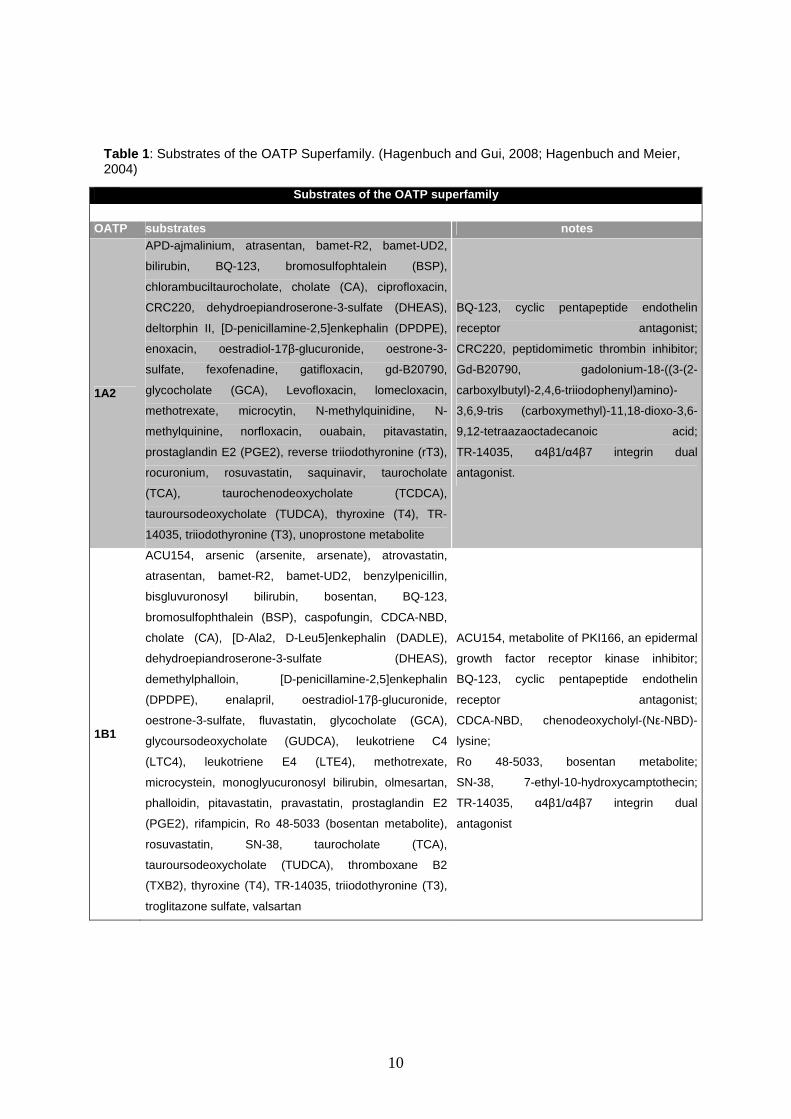
Substrates of the OATP superfamily OATP substrates notes
1A2
APD-ajmalinium, atrasentan, bamet-R2, bamet-UD2,
bilirubin, BQ-123, bromosulfophtalein (BSP),
chlorambuciltaurocholate, cholate (CA), ciprofloxacin,
CRC220, dehydroepiandroserone-3-sulfate (DHEAS),
deltorphin II, [D-penicillamine-2,5]enkephalin (DPDPE),
enoxacin, oestradiol-17β-glucuronide, oestrone-3-
sulfate, fexofenadine, gatifloxacin, gd-B20790,
glycocholate (GCA), Levofloxacin, lomecloxacin,
methotrexate, microcytin, N-methylquinidine, N-
methylquinine, norfloxacin, ouabain, pitavastatin,
prostaglandin E2 (PGE2), reverse triiodothyronine (rT3),
rocuronium, rosuvastatin, saquinavir, taurocholate
(TCA), taurochenodeoxycholate (TCDCA),
tauroursodeoxycholate (TUDCA), thyroxine (T4), TR-
14035, triiodothyronine (T3), unoprostone metabolite
BQ-123, cyclic pentapeptide endothelin
receptor antagonist;
CRC220, peptidomimetic thrombin inhibitor;
Gd-B20790, gadolonium-18-((3-(2-
carboxylbutyl)-2,4,6-triiodophenyl)amino)-
3,6,9-tris (carboxymethyl)-11,18-dioxo-3,6-
9,12-tetraazaoctadecanoic acid;
TR-14035, α4β1/α4β7 integrin dual
antagonist.
1B1
ACU154, arsenic (arsenite, arsenate), atrovastatin,
atrasentan, bamet-R2, bamet-UD2, benzylpenicillin,
bisgluvuronosyl bilirubin, bosentan, BQ-123,
bromosulfophthalein (BSP), caspofungin, CDCA-NBD,
cholate (CA), [D-Ala2, D-Leu5]enkephalin (DADLE),
dehydroepiandroserone-3-sulfate (DHEAS),
demethylphalloin, [D-penicillamine-2,5]enkephalin
(DPDPE), enalapril, oestradiol-17β-glucuronide,
oestrone-3-sulfate, fluvastatin, glycocholate (GCA),
glycoursodeoxycholate (GUDCA), leukotriene C4
(LTC4), leukotriene E4 (LTE4), methotrexate,
microcystein, monoglyucuronosyl bilirubin, olmesartan,
phalloidin, pitavastatin, pravastatin, prostaglandin E2
(PGE2), rifampicin, Ro 48-5033 (bosentan metabolite),
rosuvastatin, SN-38, taurocholate (TCA),
tauroursodeoxycholate (TUDCA), thromboxane B2
(TXB2), thyroxine (T4), TR-14035, triiodothyronine (T3),
troglitazone sulfate, valsartan
ACU154, metabolite of PKI166, an epidermal
growth factor receptor kinase inhibitor;
BQ-123, cyclic pentapeptide endothelin
receptor antagonist;
CDCA-NBD, chenodeoxycholyl-(Nε-NBD)-
lysine;
Ro 48-5033, bosentan metabolite;
SN-38, 7-ethyl-10-hydroxycamptothecin;
TR-14035, α4β1/α4β7 integrin dual
antagonist
Table 1 : Substrates of the OATP Superfamily. (Hagenbuch and Gui, 2008; Hagenbuch and Meier, 2004)
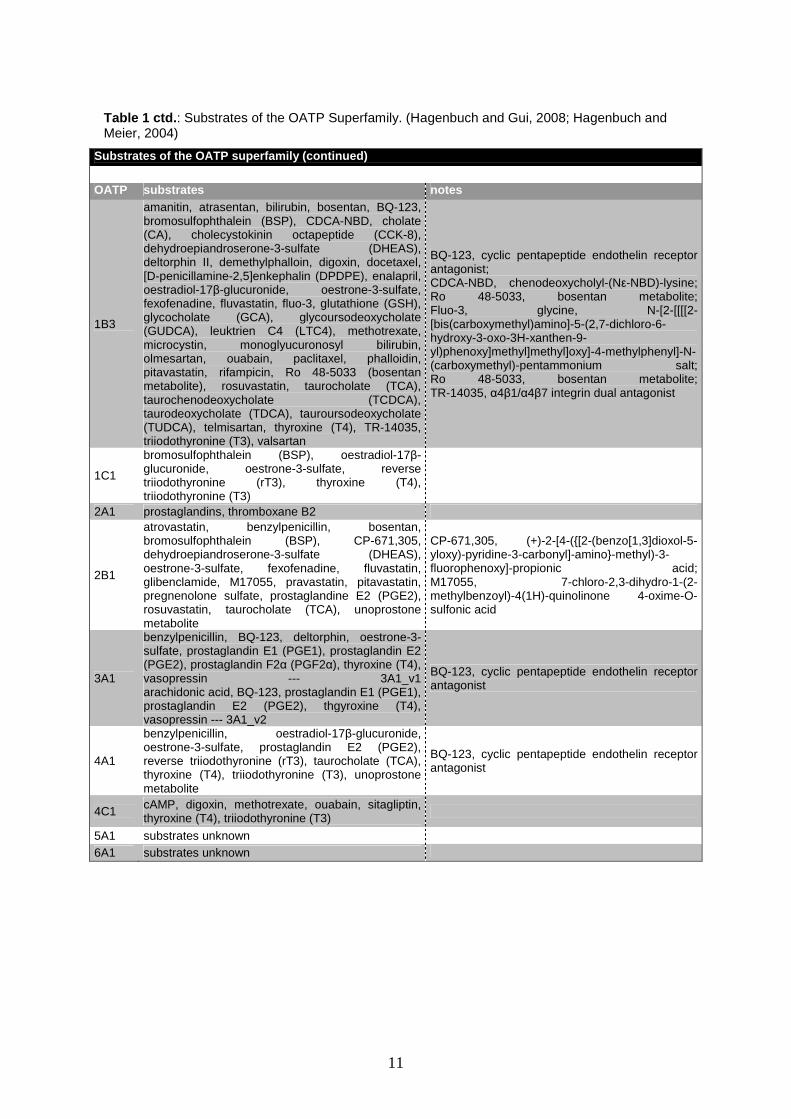
11
Substrates of the OATP superfamily (continued)
OATP substrates notes
1B3
amanitin, atrasentan, bilirubin, bosentan, BQ-123, bromosulfophthalein (BSP), CDCA-NBD, cholate (CA), cholecystokinin octapeptide (CCK-8), dehydroepiandroserone-3-sulfate (DHEAS), deltorphin II, demethylphalloin, digoxin, docetaxel, [D-penicillamine-2,5]enkephalin (DPDPE), enalapril, oestradiol-17β-glucuronide, oestrone-3-sulfate, fexofenadine, fluvastatin, fluo-3, glutathione (GSH), glycocholate (GCA), glycoursodeoxycholate (GUDCA), leuktrien C4 (LTC4), methotrexate, microcystin, monoglyucuronosyl bilirubin, olmesartan, ouabain, paclitaxel, phalloidin, pitavastatin, rifampicin, Ro 48-5033 (bosentan metabolite), rosuvastatin, taurocholate (TCA), taurochenodeoxycholate (TCDCA), taurodeoxycholate (TDCA), tauroursodeoxycholate (TUDCA), telmisartan, thyroxine (T4), TR-14035, triiodothyronine (T3), valsartan
BQ-123, cyclic pentapeptide endothelin receptor antagonist; CDCA-NBD, chenodeoxycholyl-(Nε-NBD)-lysine; Ro 48-5033, bosentan metabolite; Fluo-3, glycine, N-[2-[[[[2-[bis(carboxymethyl)amino]-5-(2,7-dichloro-6-hydroxy-3-oxo-3H-xanthen-9-yl)phenoxy]methyl]methyl]oxy]-4-methylphenyl]-N-(carboxymethyl)-pentammonium salt; Ro 48-5033, bosentan metabolite; TR-14035, α4β1/α4β7 integrin dual antagonist
1C1
bromosulfophthalein (BSP), oestradiol-17β-glucuronide, oestrone-3-sulfate, reverse triiodothyronine (rT3), thyroxine (T4), triiodothyronine (T3)
2A1 prostaglandins, thromboxane B2
2B1
atrovastatin, benzylpenicillin, bosentan, bromosulfophthalein (BSP), CP-671,305, dehydroepiandroserone-3-sulfate (DHEAS), oestrone-3-sulfate, fexofenadine, fluvastatin, glibenclamide, M17055, pravastatin, pitavastatin, pregnenolone sulfate, prostaglandine E2 (PGE2), rosuvastatin, taurocholate (TCA), unoprostone metabolite
CP-671,305, (+)-2-[4-({[2-(benzo[1,3]dioxol-5-yloxy)-pyridine-3-carbonyl]-amino}-methyl)-3-fluorophenoxy]-propionic acid; M17055, 7-chloro-2,3-dihydro-1-(2-methylbenzoyl)-4(1H)-quinolinone 4-oxime-O-sulfonic acid
3A1
benzylpenicillin, BQ-123, deltorphin, oestrone-3-sulfate, prostaglandin E1 (PGE1), prostaglandin E2 (PGE2), prostaglandin F2α (PGF2α), thyroxine (T4), vasopressin --- 3A1_v1 arachidonic acid, BQ-123, prostaglandin E1 (PGE1), prostaglandin E2 (PGE2), thgyroxine (T4), vasopressin --- 3A1_v2
BQ-123, cyclic pentapeptide endothelin receptor antagonist
4A1
benzylpenicillin, oestradiol-17β-glucuronide, oestrone-3-sulfate, prostaglandin E2 (PGE2), reverse triiodothyronine (rT3), taurocholate (TCA), thyroxine (T4), triiodothyronine (T3), unoprostone metabolite
BQ-123, cyclic pentapeptide endothelin receptor antagonist
4C1 cAMP, digoxin, methotrexate, ouabain, sitagliptin, thyroxine (T4), triiodothyronine (T3)
5A1 substrates unknown
6A1 substrates unknown
Table 1 ctd. : Substrates of the OATP Superfamily. (Hagenbuch and Gui, 2008; Hagenbuch and Meier, 2004)
12
3.1.4 OATP sub-families and their members – functio nal properties
OATP1A2, formerly named OATP-A, contains several rat and mouse members
(Hagenbuch and Meier, 2004), and also one bovine homologue (Geyer et al., 2006).
It is expressed at highest levels in brain (Kullack-Ublick, 1995; Gao et al. 2000),
followed by liver (present in cholangiocytes, but not in hepatocytes (Lee et al., 2005)),
the brush border of the distal nephron (Lee et al., 2005) and the apical membrane of
enterocytes (Glaeser et al., 2007). It mediates the transport of a wide range of endo-
and exogenous mainly amphipathic compounds, including bile salts, hormones and
their conjugates, cyclic and linear peptides, toxins, organic cations and numerous
drugs. Briefly, these are common OATP/Oatp substrates.
OATP1B1 (OATP-C) was cloned from human liver (Tamai et al., 2000; Hsiang
et al., 1999; Abe et al. 1999; König et al., 2000a) with orthologues in rat and mouse
(Hagenbuch and Meier, 2004). It is considered to be a liver specific transporter (Abe
et al 1999; Hsiang et al., 1999; König et al., 2000b), expressed in the basolateral
membrane of the hepatocytes (Shi et al., 1995; Satlin et al., 1997; Li et al., 2000; Li
et al., 1998; König et al., 2000b), as usual for liver specific OATPs/Oatps. The
transport functions have been characterized in Xenopus laevis oocytes (Satlin et al.,
1997; Kullack-Ublick et al., 2001) and in stably transfected HEK-293 cells (Shi et al.,
1995; Satlin et al., 1997; Li et al., 2000). Its substrates include the common
OATP/Oatp substrates, but are extended by eicosanoids, drugs such as benzyl
penicillin, methotrexate, pravastatin and rifampicin, as well as the natural toxins
microcystin and phalloidin (Hagenbuch and Meier, 2003). In addition, several
polymorphisms in the SLCO1B1 gene have been described (Tirona et al., 2001;
Nozawa et al., 2002) identifying a number of alleles with dramatically reduced
Vmax/Km values indicating significantly decreased transport function. The basolateral
expression of OATP1B1 depends on the liver-enriched transcription factor HNF-1α
(Jung et al., 2001) explaining the 50% decrease of transcriptional expression of the
transporter due to primary sclerosing cholangitis (Oswald et al., 2001).
OATP1B3 (OATP8, LST-2) was cloned from human liver (Abe et al. 2001,
König et al. 2000a) and holds 80 % amino acid identity to OATP1B1. It has also been
detected to be a liver specific OATP (Tamai et al., 2000; Hsiang et al., 1999) which is
highly expressed around the central vein (Abe et al. 2001; König et al. 2000a). In
13
neoplastic tissue, the transporter was found in different tumour cell lines (gastric,
colon, pancreas, gallbladder, lung and brain (Tamai et al., 2000)). It transports the
same substrates as OATP1B1, exclusive of the intestinal peptide cholecystokinin 8
(CCK-8) (Isamair et al., 2001) deltorphin and the cardiac glycosides digoxin and
oubain (Fattinger et al., 2000). The substrate range has been investigated, as for
OATP1B1, in Xenopus laevis oocytes and in stably transfected HEK-293 cells.
Whether the increased expression around the central vein of the liver is related to a
specific physiological function has not been investigated yet. The transporter is
hepatically expressed depending on the levels of HNF-1α (Lee et al., 2005) and the
bile acid nuclear receptor FXR/BAR (Jung et al., 2002).
OATP1C1 (OATP-F) has one human and one rodent member (Hagenbuch
and Meier, 2004). This transporter is expressed at the highest levels in brain and
testes (Pizzagalli et al., 2002). In the latter, it is found in Leydig cells and the blood-
brain barrier (Tamai et al., 2000). Despite the common great variety of substrates, the
OATP1C1 transports only a narrow range of compounds, including thyroid hormones,
sulfobromophathalein (BSP), oestradiol-17β-glucuronide, and oestrone-3-sulfate. Its
physiological role seems to be the delivery of thyroid hormones to their target tissues
(Hagenbuch et al., 2007).
OATP2A1 (the prostaglandin transporter PGT) contains single orthologues in
rat and mouse (Hagenbuch and Meier, 2004; Schuster 2002). It has been cloned
from adult human kidney and is expressed in numerous other tissues (brain, colon,
heart, liver, lung, ovary, pancreas, placenta, prostate, skeletal muscle, spleen, small
intestine). It mediates the transport of none of the typical OATP-substrates, but
prostaglandins. The transporters’ physiological role is supposed to be the transport of
prostaglandins and other eicosanoids. In addition, it possibly is involved in regulation
of pericellular prostaglandin levels (Abe et al., 1999).
OATP2B1 (OATP-B) shows orthologues in rat and mouse (Hagenbuch and
Meier, 2004), and is ubiquitously expressed. It is found in human kidney (Abe et al.,
2001), lung, heart (Grube et al., 2006) liver (Pizzagalli et al., 2001), placenta (St-
Pierre et al., 2002) brain, spleen, testes, ovary, colon (Pizzagalli et al., 2001), and the
ciliary body (Gao et al. 2005)).
At physiological pH, it transports only a narrow range of substrates, including BSP,
oestrone-3-sulfate, and dihydroepiandrosteron (DHEAS).
14
At acidic pH, however, also taurocholate, bilirubin conjugates, fexofenadine, statins,
glibenclamide, and the loop diuretic M17055 are substrates (Hagenbuch and Gui,
2008).
OATP3A1 (OATP-D) contains orthologues in rat and mouse (Hagenbuch and
Meier 2004), showing 97% amino acid sequence identity. Therefore, OATP3A1 is the
most conserved protein within the OATP superfamily. Highest expression levels were
reported from testes, brain, heart, lung, spleen, peripheral blood leukocytes, and
thyroid gland (Adachi et al. 2003; Huber et al. 2007). It transports prostaglandins,
thyroid hormones, the cyclic peptide BQ-123, and vasopressin. OATP3A1 might play
an important role in transport of neuron-active peptides or thyroid hormones.
However, additional studies are required to proof this hypothesis.
OATP4A1 (OATP-E), with members in rat and mouse, is expressed in various
tissues, reaching highest levels in heart, placenta, lung, liver, skeletal muscle, kidney,
and pancreas. Additionally it has also been detected in brain. It mediates the
transport of a narrow range of substrates including oestrone-3-sulfate, oestradiol-
17β-glucuronide, benzyl penicillin, PGE2, thyroid hormones (Fujiwara et al. 2001;
Tamai et al. 2000), and might be important for the transport of thyroid hormones to
the foetus, at least in the placenta. (Hagenbuch and Meier, 2004)
OATP4C1 (OATP-H), contains orthologues in rat and mouse with 80% amino
acid sequence identity in rat, and is kidney specific. It transports a narrow range of
compounds, including digoxin, oubain, thyroxine, methotrexate, cAMP, and the
dipeptidyl peptidase-4 inhibitor sitagliptin. As it also transports thyroid hormones, it
might be important for their delivery to the kidney (Hagenbuch and Meier, 2004).
OATP5A1 (OATP-J) represents the only member of the OATP5A subfamily. It
consists of 848 amino acids. There is no further information available yet concerning
its transport properties (Hagenbuch and Meier, 2004).
OATP6A1 (OATP-I) shows highest expression levels in normal testes, and
additional weak signals in spleen, brain, foetal brain, and placenta. It has been found
in several lung tumours, lung cancer cell lines, and bladder and oesophageal
tumours. Orthologues have been discovered in rat (Oatp6b1 and Oatp6c1). They
transport taurocholate, dehydroepiandrosteron sulphate (DHEAS), T3 and T4.
However, additional research is required to proof relatedness of the rat homologue to
the human OATP6A1 (Hagenbuch and Meier, 2004).
15
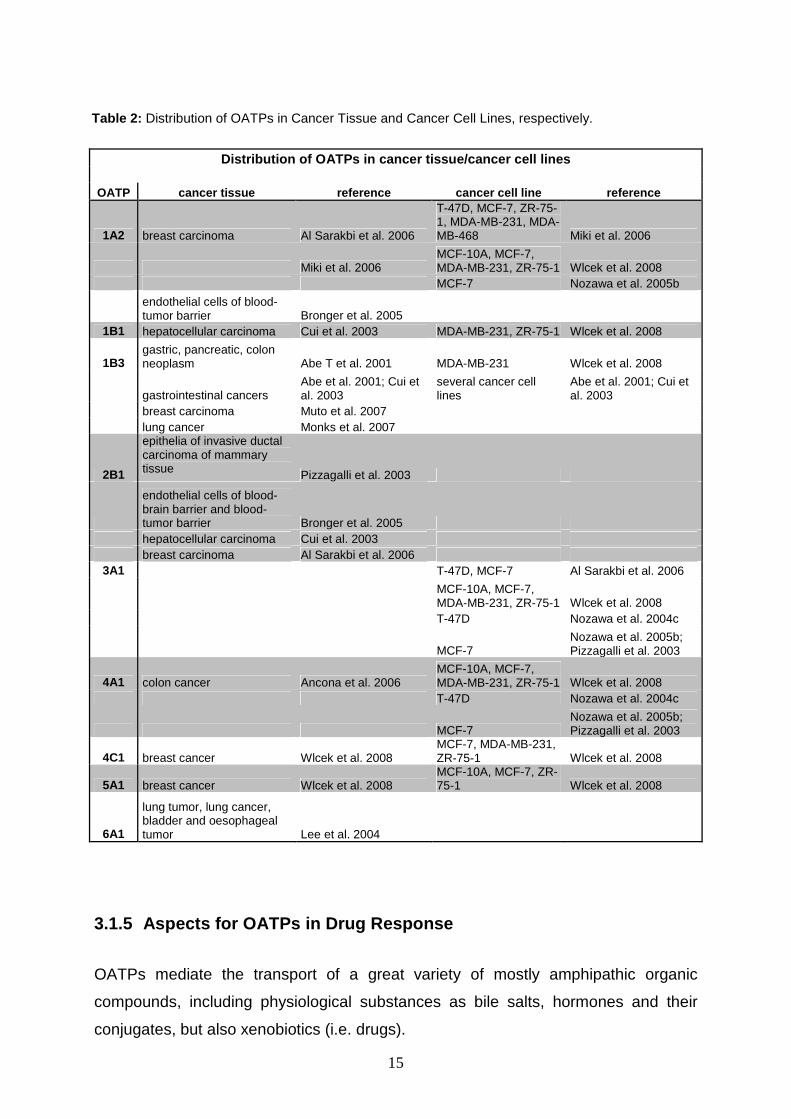
Distribution of OATPs in cancer tissue/cancer cell lines
OATP cancer tissue reference cancer cell line refer ence
1A2 breast carcinoma Al Sarakbi et al. 2006
T-47D, MCF-7, ZR-75-1, MDA-MB-231, MDA-MB-468 Miki et al. 2006
Miki et al. 2006 MCF-10A, MCF-7, MDA-MB-231, ZR-75-1 Wlcek et al. 2008
MCF-7 Nozawa et al. 2005b
endothelial cells of blood-tumor barrier Bronger et al. 2005
1B1 hepatocellular carcinoma Cui et al. 2003 MDA-MB-231, ZR-75-1 Wlcek et al. 2008
1B3 gastric, pancreatic, colon neoplasm Abe T et al. 2001 MDA-MB-231 Wlcek et al. 2008
gastrointestinal cancers Abe et al. 2001; Cui et al. 2003
several cancer cell lines
Abe et al. 2001; Cui et al. 2003
breast carcinoma Muto et al. 2007 lung cancer Monks et al. 2007
2B1
epithelia of invasive ductal carcinoma of mammary tissue Pizzagalli et al. 2003
endothelial cells of blood-brain barrier and blood-tumor barrier Bronger et al. 2005
hepatocellular carcinoma Cui et al. 2003 breast carcinoma Al Sarakbi et al. 2006
3A1 T-47D, MCF-7 Al Sarakbi et al. 2006
MCF-10A, MCF-7, MDA-MB-231, ZR-75-1 Wlcek et al. 2008
T-47D Nozawa et al. 2004c
MCF-7 Nozawa et al. 2005b; Pizzagalli et al. 2003
4A1 colon cancer Ancona et al. 2006 MCF-10A, MCF-7, MDA-MB-231, ZR-75-1 Wlcek et al. 2008
T-47D Nozawa et al. 2004c
MCF-7 Nozawa et al. 2005b; Pizzagalli et al. 2003
4C1 breast cancer Wlcek et al. 2008 MCF-7, MDA-MB-231, ZR-75-1 Wlcek et al. 2008
5A1 breast cancer Wlcek et al. 2008 MCF-10A, MCF-7, ZR-75-1 Wlcek et al. 2008
6A1
lung tumor, lung cancer, bladder and oesophageal tumor Lee et al. 2004
3.1.5 Aspects for OATPs in Drug Response
OATPs mediate the transport of a great variety of mostly amphipathic organic
compounds, including physiological substances as bile salts, hormones and their
conjugates, but also xenobiotics (i.e. drugs).
Table 2: Distribution of OATPs in Cancer Tissue and Cancer Cell Lines, respectively.
16
As uptake of drugs into cells is crucial for their therapeutic efficacy, altered function,
OATPs may account for drug-drug interactions (inhibition/induction) or drug-food-
interaction. This needs to be closely investigated (Hagenbuch and Gui, 2008; Shitara
et al. 2005; Smith et al. 2005b; Poirier et al. 2007).
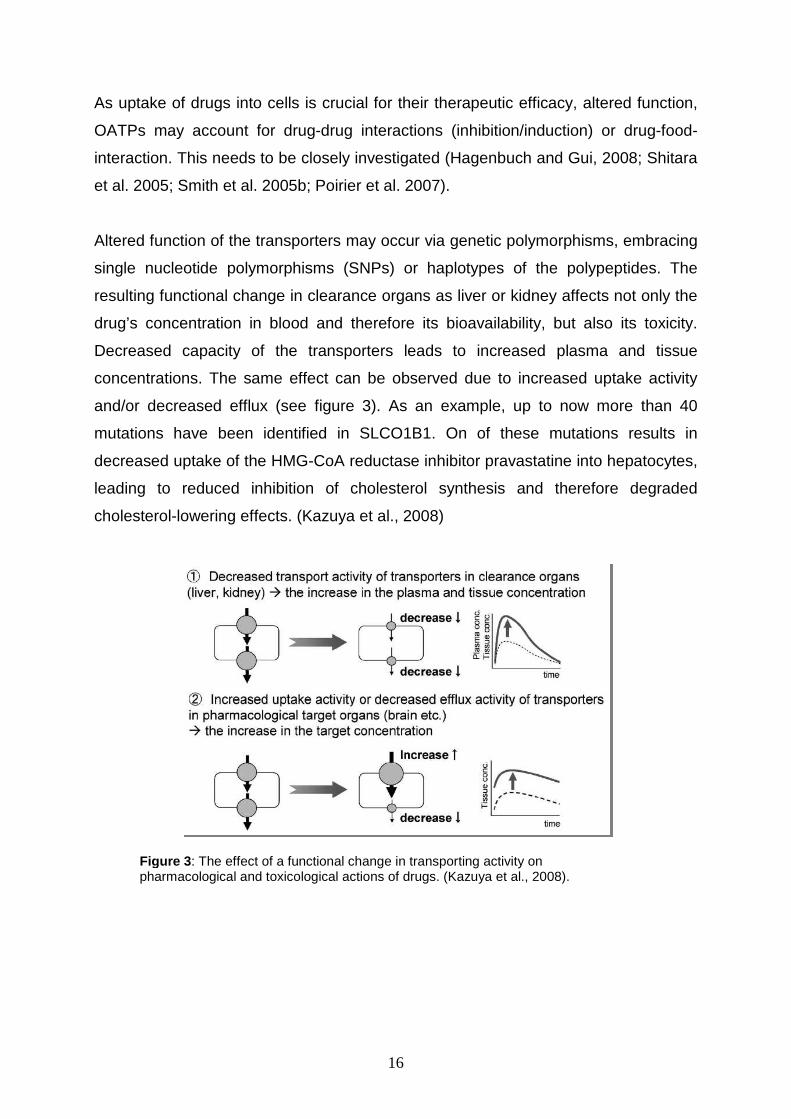
Altered function of the transporters may occur via genetic polymorphisms, embracing
single nucleotide polymorphisms (SNPs) or haplotypes of the polypeptides. The
resulting functional change in clearance organs as liver or kidney affects not only the
drug’s concentration in blood and therefore its bioavailability, but also its toxicity.
Decreased capacity of the transporters leads to increased plasma and tissue
concentrations. The same effect can be observed due to increased uptake activity
and/or decreased efflux (see figure 3). As an example, up to now more than 40
mutations have been identified in SLCO1B1. On of these mutations results in
decreased uptake of the HMG-CoA reductase inhibitor pravastatine into hepatocytes,
leading to reduced inhibition of cholesterol synthesis and therefore degraded
cholesterol-lowering effects. (Kazuya et al., 2008)
Figure 3: The effect of a functional change in transporting activity on pharmacological and toxicological actions of drugs. (Kazuya et al., 2008).
17
3.1.6 Drug-drug interactions
As OATPs/Oatps play an important role in the hepatic first pass clearance of
numerous drugs, co-administration of specific OATP modulators may rise or lower
oral bioavailability of highly metabolized compounds.
Organic anion transporting polypeptides show broad substrate specificity with a
certain degree of overlapping. By examining the Ki values of inhibitors of both OATPs
and OAT (organic anion transporter) it could be demonstrated that cephalosporins,
probenecid, cyclosporine A and rifampicin have the potential to lead to clinically
significant drug-drug interactions (Shitara et al., 2005).
Poirier et al. (2007) stated that inhibition of OATPs may result in altered
pharmacokinetics, possibly interfering with drug safety and efficacy. However, the
influence of the CYP enzyme family has to be considered as another factor of
important influence on drug-drug interactions in the course of drug metabolism.
Inhibition of some OATP/Oatp gene expression by rifampicin occurs via PXR-
receptors (i.e. pregnan X receptors). Therefore rifamycin may cause higher plasma
levels, which on the one hand is desirable – concerning drugs being highly
metabolized via OATP/Oatp mediated transport –, or on the other hand might lead to
(more) adverse drug effects, decreased efficacy and/or therapeutic failure due to
lowered uptake of the compound into its target tissue. Otherwise, induction may even
increase the already strong first pass effect of OATPs/Oatps and lead to insufficient
plasma levels. (Hagenbuch and Meier, 2004; Fattinger et al. 2000)
3.1.7 Drug-food Interactions
Dresser et al. (2002) reported for the first time that fruit juices are able to inhibit
OATP1A2. Subsequently, studies have been performed on the effect of citrus juice
and its components as well as of the influence of diverse flavonoids and herbal
extracts on OATP1A2, OATP1B1, OATP1B3 and OATP2B1 (Hagenbuch and Gui,
2008; Ismair et al. 2003; Satoh et al. 2005; Wang et al. 2005b; Fuchikami et al. 2006;
Lu et al. 2006a; Bailey et al. 2007; Glaeser et al. 2007).
Most flavonoids indeed inhibited the OATPs stated above. For instance, naringin
inhibited the transport of fexofenadine via OATP2A1 (Bailey et al. 2007). Other
18
compounds, such as hesperidin from grapefruit juice (Bailey et al. 2007), biochanin
A, genistein, and epigallocatechin-3-gallate (Wang et al. 2005), glycyrrhizin (Ismair et
al. 2003), green tea and ginkgo extract (Fuchikami et al. 2006) showed an additional
inhibitory potential on OATP1B1, OATP1B3 and OATP2B1 mediated transport.
Hence, these results clearly suggest that transport via OATPs can be affected by the
intake of fruit juices and this may lead to unexpected side effects and changes in
bioavailability (Hagenbuch and Gui, 2008).
3.1.8 OATPs and Cancer
The organic anion transporting polypeptides family is broadly expressed in human
tissue, in most members ubiquitously. They play a fundamental role in uptake of
various substrates into cells, as well as their excretion and, therefore, in the course of
body detoxification.
Many studies have been performed yet to investigate the OATPs’ distribution not only
in normal tissue, but also in cancer tissue and cancer cell lines.
The majority of OATPs was found to be expressed in at least one malign tissue or
cancer cell line. Their frequent expression of OATPs might play a key role in tumour
genesis, possibly by rendering cells sensitive to hormonal growth stimuli.
Further information about the individual OATP expressed in a certain tumor might
bring useful information and improve the specific targeting of cytotoxic drugs
(Hagenbuch and Gui, 2008).
19
4 METHODS AND MATERIALS
4.1 Colorectal Tumor Tissue Samples
Samples of stages of colorectal cancer are obtained from patients suffering from
different stages of colorectal carcinoma, and are kindly provided by Prof. Dr. Enikö
Kállay (Department of Pathophysiology, AKH Wien). Research investigation is
approved by the hospital’s Ethics Committee.
4.2 Cell Culture – Maintenance of Cells
Materials
� Roswell Park Memorail Institute (RPMI) 1640 Medium (PAN™ Biotech GmbH,
Aidenbach, GER)
� Fetal bovine serum (FBS) (PAN™ Biotech GmbH)
� Penicillin (10.000 U/ml) – Streptomycin (10.000 U/ml) Solution (P/S)
(Gibco/Invitrogen, Carlsbad, CA)
� Trypsin/EDTA Solution (10x) (Gibco, Carlsbad, CA)
� 10x PBS (phosphate buffered saline) pH 7.4
Potassium chloride (Merck, Darmstadt, GER) 2g
Sodium chloride (Merck) 80g
Potassium dihydrogen phosphate (Merck) 2g
Disodium hydrogen phosphate (Merck) 14.4g
ddH2O ad 1 l
� Dimethyl sulfoxide (DMSO) (Sigma, St. Louis, MO)
� Cell culture flasks 25 cm² and 75 cm² with vented cap (Iwaki scitech div., Asahi
Technoglass, Ltd., Tokyo, JP)
� Sterile pipettes 10 ml (Bibby Sterilin Ltd., Stone, Staffordshire, UK)
� Sterile centrifuge tubes 15 ml and 50 ml (TPP Techno Plastic Products AG,
Trasadingen, CH)
� Sterile Pasteur pipettes (VWR International, Darmstadt, GER)
� Cryovials /Bibby Sterilin Ltd., Stone, Staffordshire, UK)
20
� Incubator Cytoperm Heraeus (Kendro Laboratories GmbH, Vienna, AT)
� Centrifuge Hettich Rotixa/RP (Hettich AG, Bäch, CH)
� Laminar air flow (Heraeus, Hanau, GER)
� Mikroscope Olympus CK2
� Cell strainers, 40 µm (Falcon™, Becton Dickinson Biosciences, San Jose, CA)
� Eppendorf pipettes (Eppendorf AG, Hamburg, GER)
4.2.1 General
All cells are from the C205 cell line, i.e. human colorectal adenocarcinoma cells
derived from a 70 years old person. Cell culture work is performed exclusively in the
cell culture room, where access is only allowed to people wearing a lab coat. Every
action performed on the cells needs to be done in a sterile cabinet, the laminar air
flow (Heraeus, Hanau, GER).
The cells were cultivated in either 25 cm² or 75 cm² flasks. They were incubated at
standardized conditions (37°C, 5 % CO 2, 95 % relative humidity; incubator: Heraeus
cytoperm 2). To avoid contamination of the cells with microorganisms, sterile
conditions are applied and hands are disinfected with ethanol (70 %) before work.
4.2.2 Thawing of Cells
For long term storage cells are put into liquid nitrogen (– 196°C). When needed, cells
should be thawed at 37°C at approximately the same velocity as they have been
frozen. The thawed cell suspension is centrifuged at 1000 rpm for 3 minutes at room
temperature and the supernatant is discarded. The cell pellet is resolved in 4 ml
medium (RPMI-1640, containing 10 % FBS and 1 % penicillin/streptomycin (P/S)) by
pipetting the suspension up and down several times. It is then transferred into a
sterile culture flask (either 25 cm² or 75 cm²) and incubated at 37°C.
21
4.2.3 Maintaining Cells in Culture – Washing and Fe eding
To culture cells, RPMI 1640 (PAN™ Biotech GmbH) supplemented with 10 % FBS
(fetal bovine serum) and 1 % P/S is used. The medium is exchanged approximately
every third day. For this purpose, the cells need to be washed with PBS first. Both,
PBS and the RPMI medium, shall be brought to room temperature before being put
onto the cells to avoid stress for the cells. Cells are washed routinely once with the
same amount of PBS as medium used. PBS is aspirated and fresh medium was
added to the cells. When adding either PBS or medium, it is important to avoid
putting the reagents directly onto the cells to avoid detaching them from the flask.
Cells shall not be kept outside the incubator for a long time. To guarantee sufficient
CO2 exchange in the incubator, the flasks are either closed with gas permeable
screwtops, or non-permeable screwtops are left partially open.
When the cells reach confluence (80–90%), they have to be split in order to avoid
overgrowing and decease of cell growth.
4.2.4 Splitting of Cells
Before splitting cells, confluence must be checked by light microscopy. Cells are
washed twice with PBS to remove dead cells and cell parts. To detach the cells from
the flask, 1 ml (25 cm²) trypsin is added and the flask is incubated at 37°C for
approximately 3 minutes. Afterwards the flask is rocked gently several times and
detaching of the cells is watched under light microscope.
After adding new medium (4 ml for a 25 cm² flask, 12 ml for a 75 cm² flask), two
drops of cell suspension are put into a flask of small size. For a flask of medium size
approximately 6 drops have to be added. The flasks then are incubated at 37°C
again.
4.2.5 Freezing of Cells
For long term deposit cells are frozen when confluence is up to 80%.
22
The medium is aspirated and the cells are washed with PBS twice, which is aspirated
again. Trypsin is added (1 ml for a small flask), followed by 3 minutes of incubation at
37°C. The flask is agitated and detaching of cells is checked under light microscope.
Thereafter, 4 ml medium are added to the trypsinized cells (serum inactivates
trypsin), the cells are re-suspended by pipetting them up and down several times,
and then transferred into a 15 ml centrifugal tube. The suspension is centrifuged at
200 x g for 5 minutes at 4°C. The supernatant is di scarded and the tube containing
the pellet is placed on ice.
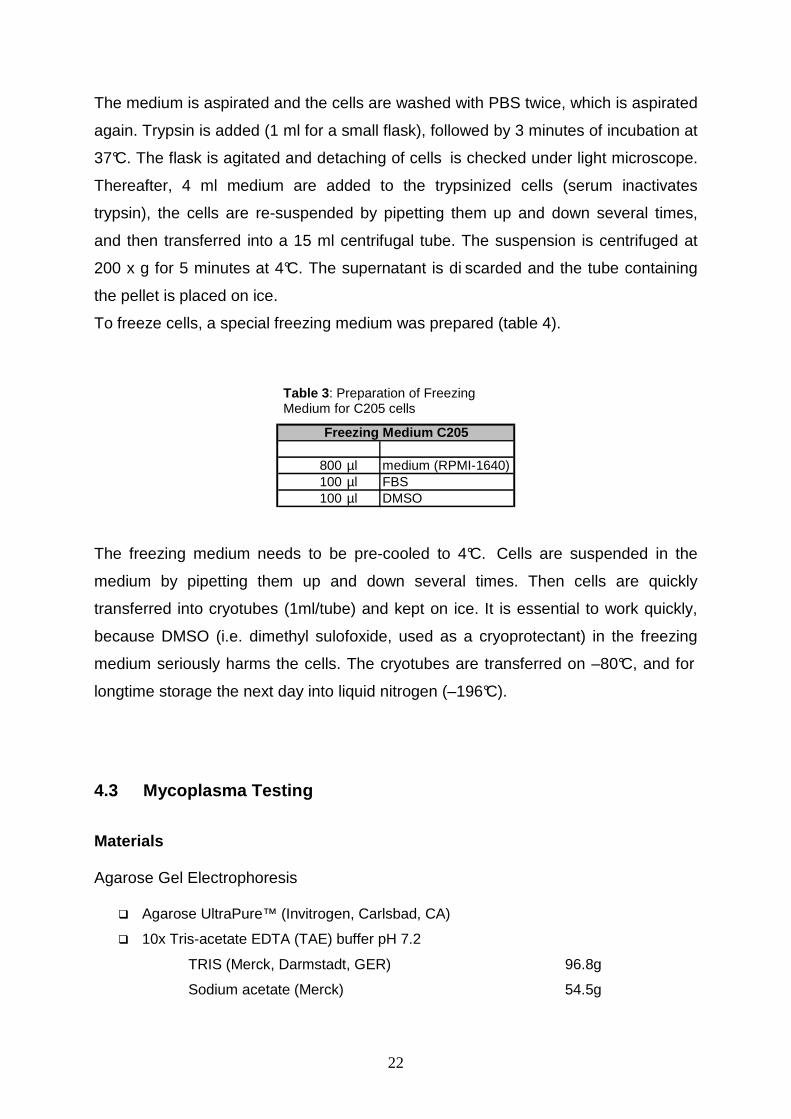
To freeze cells, a special freezing medium was prepared (table 4).
800 µl medium (RPMI-1640)100 µl FBS100 µl DMSO
Freezing Medium C205
The freezing medium needs to be pre-cooled to 4°C. Cells are suspended in the
medium by pipetting them up and down several times. Then cells are quickly
transferred into cryotubes (1ml/tube) and kept on ice. It is essential to work quickly,
because DMSO (i.e. dimethyl sulofoxide, used as a cryoprotectant) in the freezing
medium seriously harms the cells. The cryotubes are transferred on –80°C, and for
longtime storage the next day into liquid nitrogen (–196°C).
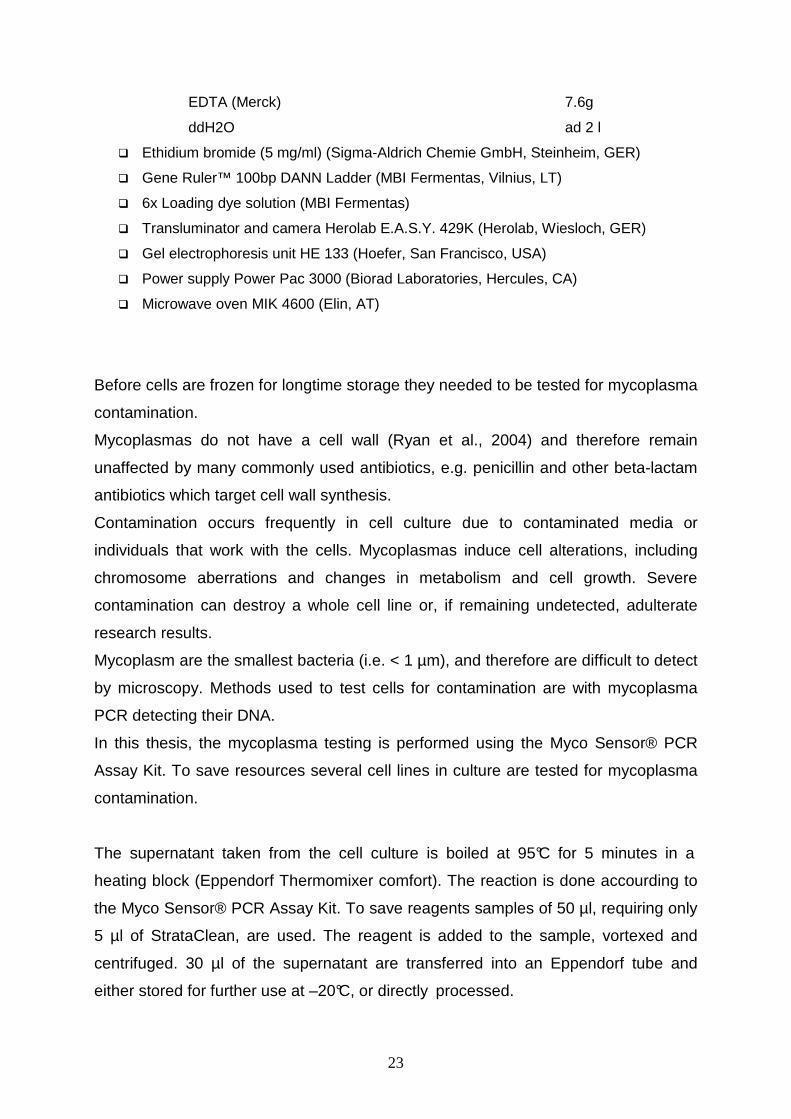
4.3 Mycoplasma Testing
Materials Agarose Gel Electrophoresis
� Agarose UltraPure™ (Invitrogen, Carlsbad, CA)
� 10x Tris-acetate EDTA (TAE) buffer pH 7.2
TRIS (Merck, Darmstadt, GER) 96.8g
Sodium acetate (Merck) 54.5g
Table 3 : Preparation of Freezing Medium for C205 cells
23
EDTA (Merck) 7.6g
ddH2O ad 2 l
� Ethidium bromide (5 mg/ml) (Sigma-Aldrich Chemie GmbH, Steinheim, GER)
� Gene Ruler™ 100bp DANN Ladder (MBI Fermentas, Vilnius, LT)
� 6x Loading dye solution (MBI Fermentas)
� Transluminator and camera Herolab E.A.S.Y. 429K (Herolab, Wiesloch, GER)
� Gel electrophoresis unit HE 133 (Hoefer, San Francisco, USA)
� Power supply Power Pac 3000 (Biorad Laboratories, Hercules, CA)
� Microwave oven MIK 4600 (Elin, AT)
Before cells are frozen for longtime storage they needed to be tested for mycoplasma
contamination.
Mycoplasmas do not have a cell wall (Ryan et al., 2004) and therefore remain
unaffected by many commonly used antibiotics, e.g. penicillin and other beta-lactam
antibiotics which target cell wall synthesis.
Contamination occurs frequently in cell culture due to contaminated media or
individuals that work with the cells. Mycoplasmas induce cell alterations, including
chromosome aberrations and changes in metabolism and cell growth. Severe
contamination can destroy a whole cell line or, if remaining undetected, adulterate
research results.
Mycoplasm are the smallest bacteria (i.e. < 1 µm), and therefore are difficult to detect
by microscopy. Methods used to test cells for contamination are with mycoplasma
PCR detecting their DNA.
In this thesis, the mycoplasma testing is performed using the Myco Sensor® PCR
Assay Kit. To save resources several cell lines in culture are tested for mycoplasma
contamination.
The supernatant taken from the cell culture is boiled at 95°C for 5 minutes in a
heating block (Eppendorf Thermomixer comfort). The reaction is done accourding to
the Myco Sensor® PCR Assay Kit. To save reagents samples of 50 µl, requiring only
5 µl of StrataClean, are used. The reagent is added to the sample, vortexed and
centrifuged. 30 µl of the supernatant are transferred into an Eppendorf tube and
either stored for further use at –20°C, or directly processed.
24
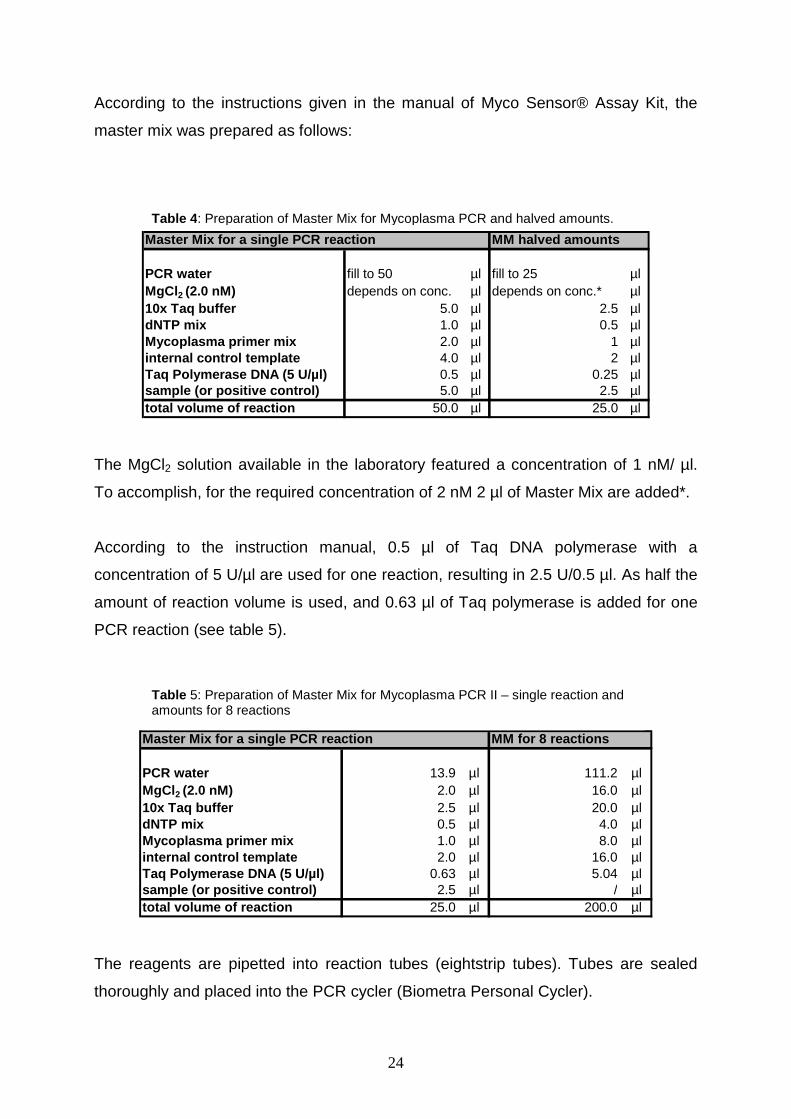
According to the instructions given in the manual of Myco Sensor® Assay Kit, the
master mix was prepared as follows:
PCR water fill to 50 µl fill to 25 µlMgCl2 (2.0 nM) depends on conc. µl depends on conc.* µl10x Taq buffer 5.0 µl 2.5 µldNTP mix 1.0 µl 0.5 µlMycoplasma primer mix 2.0 µl 1 µlinternal control template 4.0 µl 2 µlTaq Polymerase DNA (5 U/µl) 0.5 µl 0.25 µlsample (or positive control) 5.0 µl 2.5 µltotal volume of reaction 50.0 µl 25.0 µl
MM halved amountsMaster Mix for a single PCR reaction
The MgCl2 solution available in the laboratory featured a concentration of 1 nM/ µl.
To accomplish, for the required concentration of 2 nM 2 µl of Master Mix are added*.
According to the instruction manual, 0.5 µl of Taq DNA polymerase with a
concentration of 5 U/µl are used for one reaction, resulting in 2.5 U/0.5 µl. As half the
amount of reaction volume is used, and 0.63 µl of Taq polymerase is added for one
PCR reaction (see table 5).
PCR water 13.9 µl 111.2 µlMgCl 2 (2.0 nM) 2.0 µl 16.0 µl10x Taq buffer 2.5 µl 20.0 µldNTP mix 0.5 µl 4.0 µlMycoplasma primer mix 1.0 µl 8.0 µlinternal control template 2.0 µl 16.0 µlTaq Polymerase DNA (5 U/µl) 0.63 µl 5.04 µlsample (or positive control) 2.5 µl / µltotal volume of reaction 25.0 µl 200.0 µl
MM for 8 reactionsMaster Mix for a single PCR reaction
The reagents are pipetted into reaction tubes (eightstrip tubes). Tubes are sealed
thoroughly and placed into the PCR cycler (Biometra Personal Cycler).
Table 4: Preparation of Master Mix for Mycoplasma PCR and halved amounts.
Table 5: Preparation of Master Mix for Mycoplasma PCR II – single reaction and amounts for 8 reactions
25
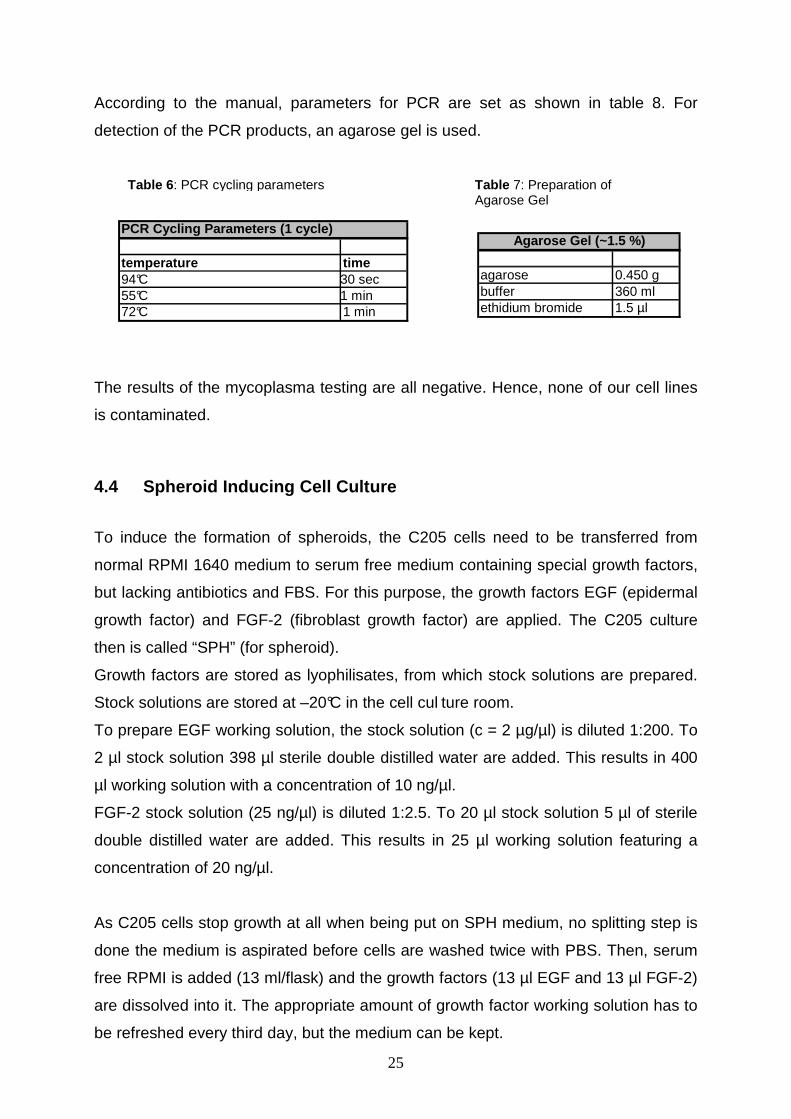
According to the manual, parameters for PCR are set as shown in table 8. For
detection of the PCR products, an agarose gel is used.
The results of the mycoplasma testing are all negative. Hence, none of our cell lines
is contaminated.
4.4 Spheroid Inducing Cell Culture
To induce the formation of spheroids, the C205 cells need to be transferred from
normal RPMI 1640 medium to serum free medium containing special growth factors,
but lacking antibiotics and FBS. For this purpose, the growth factors EGF (epidermal
growth factor) and FGF-2 (fibroblast growth factor) are applied. The C205 culture
then is called “SPH” (for spheroid).
Growth factors are stored as lyophilisates, from which stock solutions are prepared.
Stock solutions are stored at –20°C in the cell cul ture room.
To prepare EGF working solution, the stock solution (c = 2 µg/µl) is diluted 1:200. To
2 µl stock solution 398 µl sterile double distilled water are added. This results in 400
µl working solution with a concentration of 10 ng/µl.
FGF-2 stock solution (25 ng/µl) is diluted 1:2.5. To 20 µl stock solution 5 µl of sterile
double distilled water are added. This results in 25 µl working solution featuring a
concentration of 20 ng/µl.
As C205 cells stop growth at all when being put on SPH medium, no splitting step is
done the medium is aspirated before cells are washed twice with PBS. Then, serum
free RPMI is added (13 ml/flask) and the growth factors (13 µl EGF and 13 µl FGF-2)
are dissolved into it. The appropriate amount of growth factor working solution has to
be refreshed every third day, but the medium can be kept.
Table 6: PCR cycling parameters Table 7: Preparation of Agarose Gel
temperature time94°C 30 sec55°C 1 min72°C 1 min
PCR Cycling Parameters (1 cycle)
agarose 0.450 gbuffer 360 mlethidium bromide 1.5 µl
Agarose Gel (~1.5 %)
26
4.5 Protein Purification
Materials
� Protease inhibitor cocktail P8340 (Sigma, St. Louis, MO)
� PBS (Merck, Darmstadt, GER)
� 1.5 ml reaction tubes (Biozym Biotech Trading GmbH, Vienna, AT)
� Plastic vials Polyvials® (Zinsser Analytic GmbH, Frankfurt, GER)
� Eppendorf centrifuge 5415D (Eppendorf AG, Hamburg, GER)
� Lysis buffer (see below)
To measure the expression of CD133, cells are cultured on serum free medium
enriched with growth factors (EGF working solution, 10 ng/µl; FGF working solution,
20 ng/µl) on day 1 and 3. Two 75 cm² flasks are cultured.
Protein extraction is done on day 4 and 5. On day 4, total protein is extracted. On day
5, both, cytosolic and membrane protein is extracted.
All steps of protein purification are performed outside the cell culture room in the
laboratory, however, working on ice.
4.5.1 Protein Purification 1 – Total Protein
Cells are washed twice with 10 ml of pre-cooled PBS (4°C). It is important to aspirate
PBS quantitatively. For protein isolation, 1 ml of PBS is added and the cells are
detached from the flask using a cell scraper. Thereafter, the suspension is
transferred into a sterile 1.5 ml tube and centrifuged at 200 x g for 5 minutes at 4°C.
The supernatant is discarded, and the pellet is resolved in 500–600 µl of lysis buffer
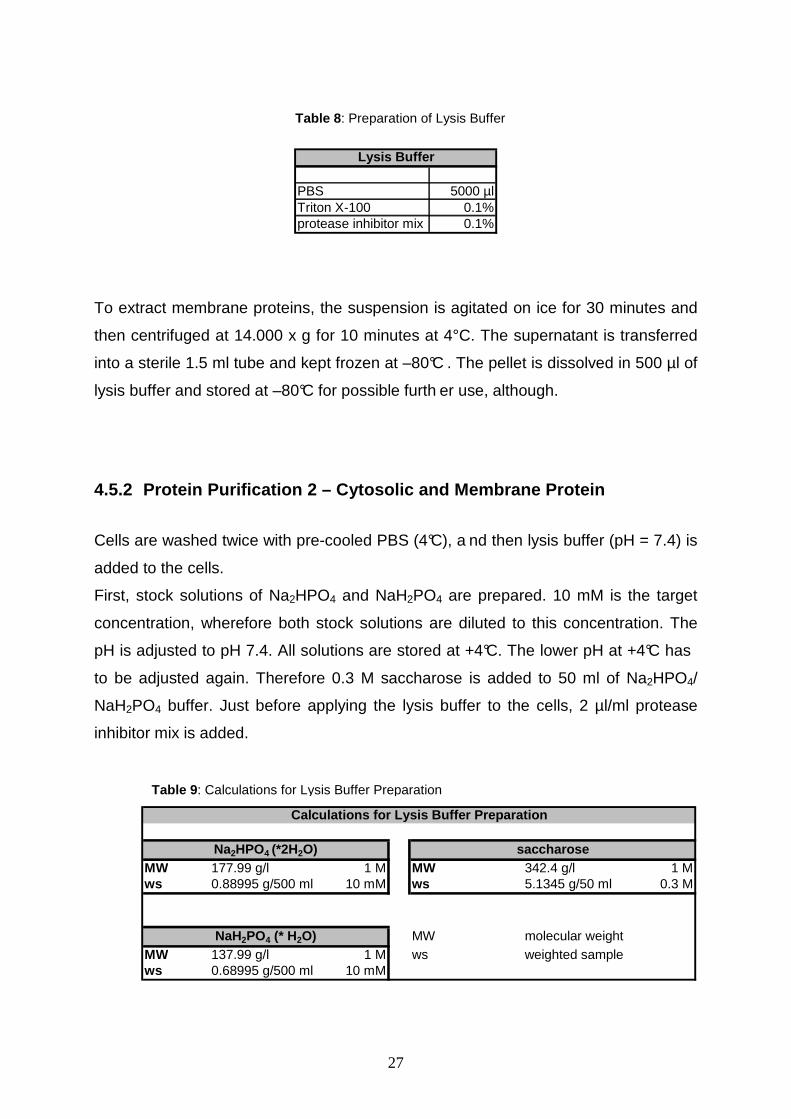
(table 10).
27
PBS 5000 µlTriton X-100 0.1%protease inhibitor mix 0.1%
Lysis Buffer
To extract membrane proteins, the suspension is agitated on ice for 30 minutes and
then centrifuged at 14.000 x g for 10 minutes at 4°C. The supernatant is transferred
into a sterile 1.5 ml tube and kept frozen at –80°C . The pellet is dissolved in 500 µl of
lysis buffer and stored at –80°C for possible furth er use, although.
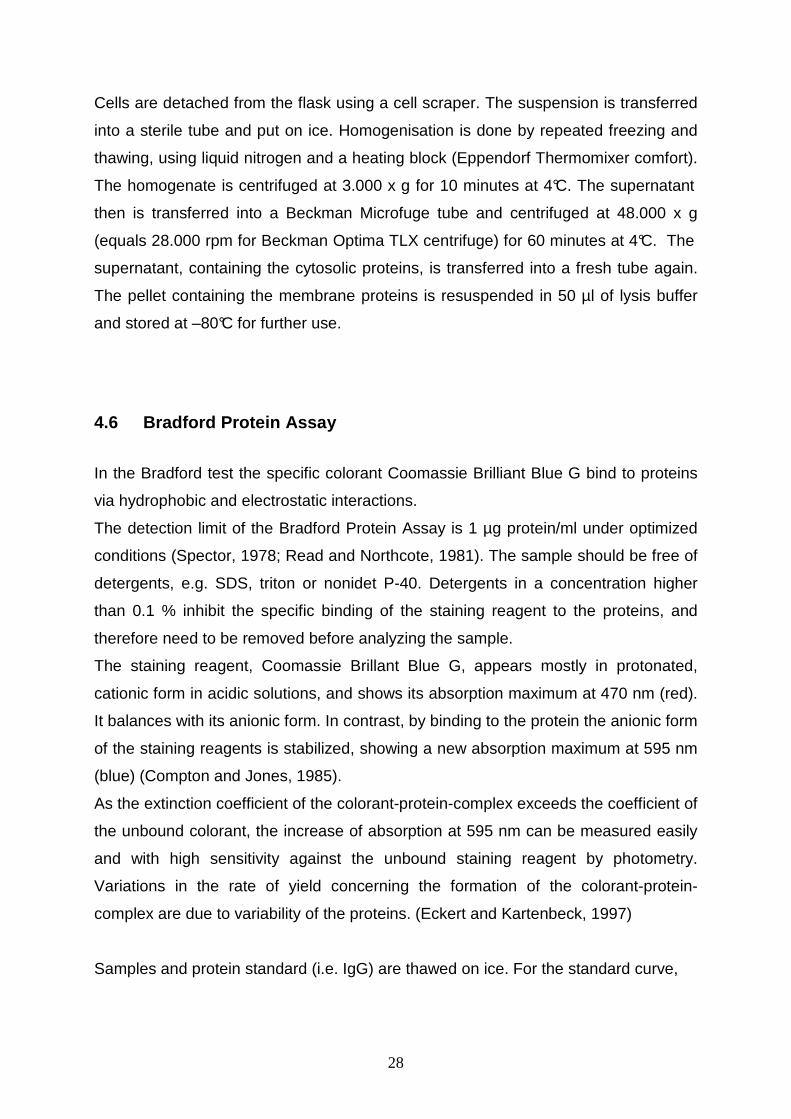
4.5.2 Protein Purification 2 – Cytosolic and Membra ne Protein
Cells are washed twice with pre-cooled PBS (4°C), a nd then lysis buffer (pH = 7.4) is
added to the cells.
First, stock solutions of Na2HPO4 and NaH2PO4 are prepared. 10 mM is the target
concentration, wherefore both stock solutions are diluted to this concentration. The
pH is adjusted to pH 7.4. All solutions are stored at +4°C. The lower pH at +4°C has
to be adjusted again. Therefore 0.3 M saccharose is added to 50 ml of Na2HPO4/
NaH2PO4 buffer. Just before applying the lysis buffer to the cells, 2 µl/ml protease
inhibitor mix is added.
MW 177.99 g/l 1 M MW 342.4 g/l 1 Mws 0.88995 g/500 ml 10 mM ws 5.1345 g/50 ml 0.3 M
MW molecular weightMW 137.99 g/l 1 M ws weighted samplews 0.68995 g/500 ml 10 mM
Na2HPO4 (*2H2O)
NaH2PO4 (* H2O)
Calculations for Lysis Buffer Preparation
saccharose
Table 8: Preparation of Lysis Buffer
Table 9: Calculations for Lysis Buffer Preparation
28
Cells are detached from the flask using a cell scraper. The suspension is transferred
into a sterile tube and put on ice. Homogenisation is done by repeated freezing and
thawing, using liquid nitrogen and a heating block (Eppendorf Thermomixer comfort).
The homogenate is centrifuged at 3.000 x g for 10 minutes at 4°C. The supernatant
then is transferred into a Beckman Microfuge tube and centrifuged at 48.000 x g
(equals 28.000 rpm for Beckman Optima TLX centrifuge) for 60 minutes at 4°C. The
supernatant, containing the cytosolic proteins, is transferred into a fresh tube again.
The pellet containing the membrane proteins is resuspended in 50 µl of lysis buffer
and stored at –80°C for further use.
4.6 Bradford Protein Assay
In the Bradford test the specific colorant Coomassie Brilliant Blue G bind to proteins
via hydrophobic and electrostatic interactions.
The detection limit of the Bradford Protein Assay is 1 µg protein/ml under optimized
conditions (Spector, 1978; Read and Northcote, 1981). The sample should be free of
detergents, e.g. SDS, triton or nonidet P-40. Detergents in a concentration higher
than 0.1 % inhibit the specific binding of the staining reagent to the proteins, and
therefore need to be removed before analyzing the sample.
The staining reagent, Coomassie Brillant Blue G, appears mostly in protonated,
cationic form in acidic solutions, and shows its absorption maximum at 470 nm (red).
It balances with its anionic form. In contrast, by binding to the protein the anionic form
of the staining reagents is stabilized, showing a new absorption maximum at 595 nm
(blue) (Compton and Jones, 1985).
As the extinction coefficient of the colorant-protein-complex exceeds the coefficient of
the unbound colorant, the increase of absorption at 595 nm can be measured easily
and with high sensitivity against the unbound staining reagent by photometry.
Variations in the rate of yield concerning the formation of the colorant-protein-
complex are due to variability of the proteins. (Eckert and Kartenbeck, 1997)
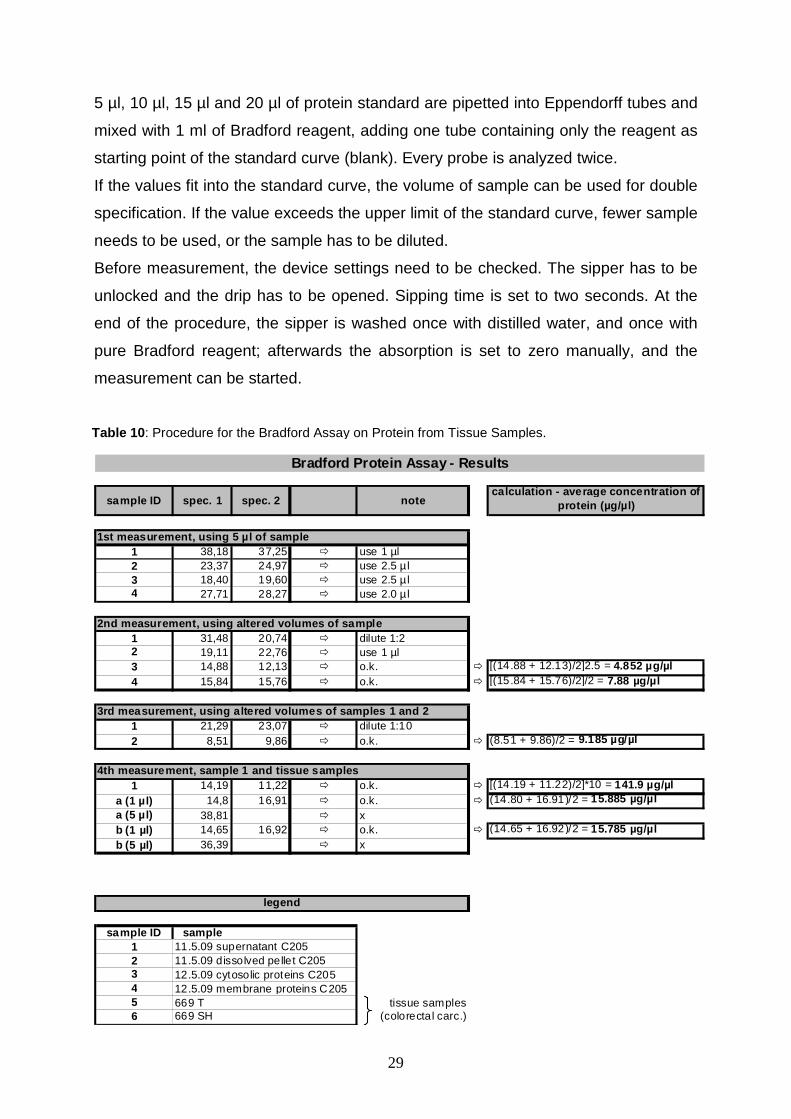
Samples and protein standard (i.e. IgG) are thawed on ice. For the standard curve,
29
5 µl, 10 µl, 15 µl and 20 µl of protein standard are pipetted into Eppendorff tubes and
mixed with 1 ml of Bradford reagent, adding one tube containing only the reagent as
starting point of the standard curve (blank). Every probe is analyzed twice.
If the values fit into the standard curve, the volume of sample can be used for double
specification. If the value exceeds the upper limit of the standard curve, fewer sample
needs to be used, or the sample has to be diluted.
Before measurement, the device settings need to be checked. The sipper has to be
unlocked and the drip has to be opened. Sipping time is set to two seconds. At the
end of the procedure, the sipper is washed once with distilled water, and once with
pure Bradford reagent; afterwards the absorption is set to zero manually, and the
measurement can be started.
Table 10 : Procedure for the Bradford Assay on Protein from Tissue Samples.
sample ID spec. 1 spec. 2 notecalculation - average concentration of
protein (µg/µl)
1 38,18 37,25 � use 1 µl2 23,37 24,97 � use 2.5 µ l3 18,40 19,60 � use 2.5 µ l4 27,71 28,27 � use 2.0 µ l
1 31,48 20,74 � dilute 1:22 19,11 22,76 � use 1 µl3 14,88 12,13 � o.k. � [(14.88 + 12.13)/2]2.5 = 4.852 µg/µl4 15,84 15,76 � o.k. � [(15.84 + 15.76)/2]/2 = 7.88 µg/µl
1 21,29 23,07 � dilute 1:102 8,51 9,86 � o.k. � (8.51 + 9.86)/2 = 9.185 µg/µl
1 14,19 11,22 � o.k. � [(14.19 + 11.22)/2]*10 = 141.9 µg/µla (1 µl) 14,8 16,91 � o.k. � (14.80 + 16.91)/2 = 15.885 µg/µla (5 µl) 38,81 � xb (1 µl) 14,65 16,92 � o.k. � (14.65 + 16.92)/2 = 15.785 µg/µlb (5 µl) 36,39 � x
sample ID sample1 11.5.09 supernatant C2052 11.5.09 dissolved pellet C2053 12.5.09 cytosolic proteins C2054 12.5.09 membrane proteins C2055 669 T tissue samples6 669 SH (colorectal carc.)
4th measurement, sample 1 and tissue samples
legend
Bradford Protein Assay - Results
1st measurement, using 5 µl of sample
2nd measurement, using altered volumes of sample
3rd measurement, using altered volumes of samples 1 and 2
30
Due to complications referring to the storage of IgG antibody, no Western Blot has
been performed. The results obtained by real time PCR will be confirmed by Western
Blot in further investigations. However, these are not part of this diploma thesis.
4.7 Polymerase chain reaction (PCR)
Materials
� RNase free water
� Sense and antisense primer, 100 pmol/µl (MWG Biotech, Ebersberg, GER)
� Taq Man gene expression assays (AB Applied Biosystems, Foster City, USA)
� TaqMan® gene expression master mix (Applied Biosystems)
� ABI PRISM™ optical 96-well plates and caps (Applied Biosystems)
� ABI PRISM™ 7700 sequence detector (Applied Biosystems)
� Safe seal tips (Biozym Biotech Trading GmbH, Vienna, AT)
� Sigma laboratory centrifuge 4K15C (Linder Labortechnik, Vienna, AT)
4.7.1 General Information
Polymerase chain reaction (PCR) was invented by Kary Mullis in 1983 (Bartlett and
Stirling, 2003), for which the Nobel Prize was awarded to Mullis. It is a technique
central to molecular biology research currently used in a variety of applications
ranging from cloning, gene expression analysis, genotyping, sequencing,
resequencing, and mutagenesis. In addition, it is applied in diagnostics for infectious
diseases and in forensic investigations.
The instrument to perform real-time PCR and all chemistries used are products of
Applied Biosystems Inc.
Real-time PCR (RT PCR) gives the researcher the ability to monitor the progress of
PCR as it occurs (i.e., in real time). Data is collected throughout the process,
revolutionizing the PCR-based quantitation of DNA and RNA. Real-time PCR
characterizes reactions by the point when amplification of a target is first detected
rather than the amount of target accumulation throughout the progress. Hence, the
higher the starting concentration of copy numbers of the cDNA, the sooner a
31
significant increase in fluorescence level can be observed. This is contrary to the so
called “endpoint assay” or “plate read assay”, where the amount of accumulated PCR
products at the end of all PCR cycles is measured. (Applied Biosystems Inc.)
An outstanding advantage of real-time PCR is its sensitiveness. Whereas agarose
gels’ resolution is rather poor, about 10 fold, real-time PCR can detect two-fold
changes.
Further advantages in comparison with traditional PCR technique are
� collection of data in the exponential amplification phase,
� direct proportionality of fluorescent signal to number of generated amplicons
(i.e. cDNA copies),
� cleaved probe providing a permanent record amplicication of an amplicon,
� increase dynamic range of detection, and
� no post-PCR processing necessary.
(Applied Biosystems Inc.)
4.7.2 Phases of PCR
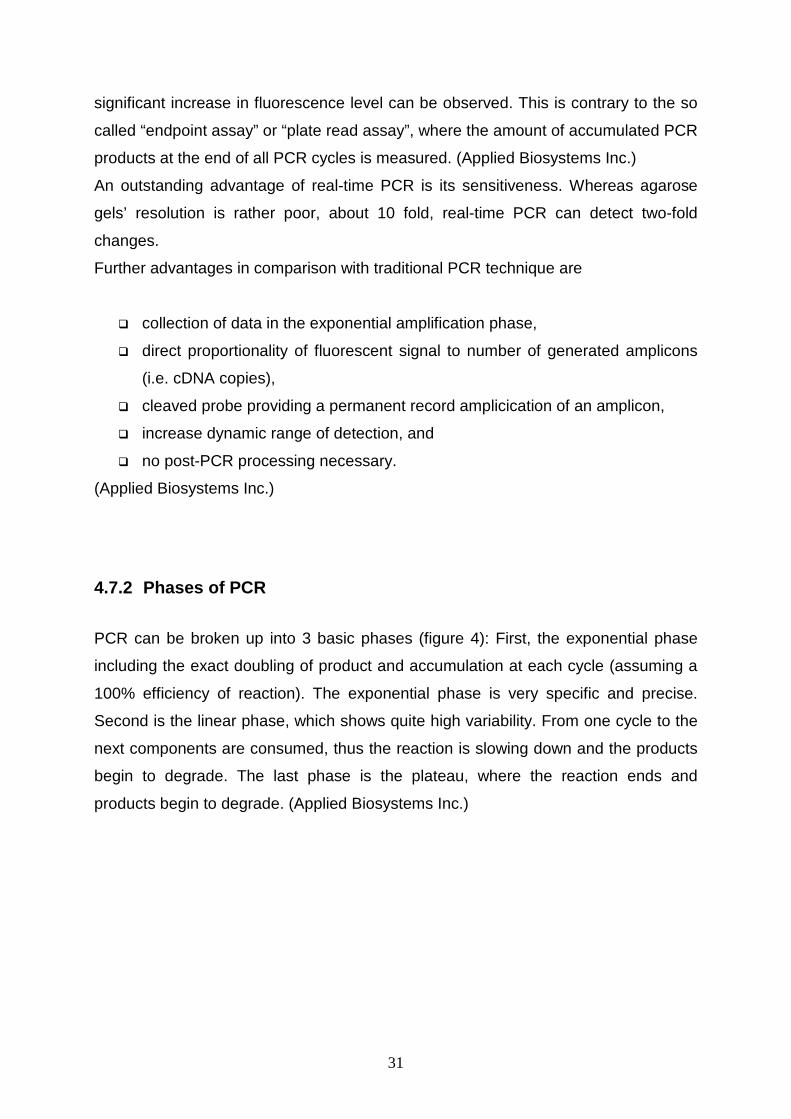
PCR can be broken up into 3 basic phases (figure 4): First, the exponential phase
including the exact doubling of product and accumulation at each cycle (assuming a
100% efficiency of reaction). The exponential phase is very specific and precise.
Second is the linear phase, which shows quite high variability. From one cycle to the
next components are consumed, thus the reaction is slowing down and the products
begin to degrade. The last phase is the plateau, where the reaction ends and
products begin to degrade. (Applied Biosystems Inc.)
32
During the exponential phase the product is doubled at every cycle. Throughout the
process, components are consumed, namely at different rates for each replicate. The
reaction slows down and the PCR product is no longer doubled at each cycle. This is
when linear phase starts. Here the samples begin to diverge into their quantities.
Each sample reaches the plateau at a different point due to different reaction
kinetics.
Whereas traditional PCR takes its measurements at the plateau phase, for real-time
PCR it is a lot more precise to measure during the exponential phase (Applied
Biosystems Inc.).
4.7.3 Data Analysis
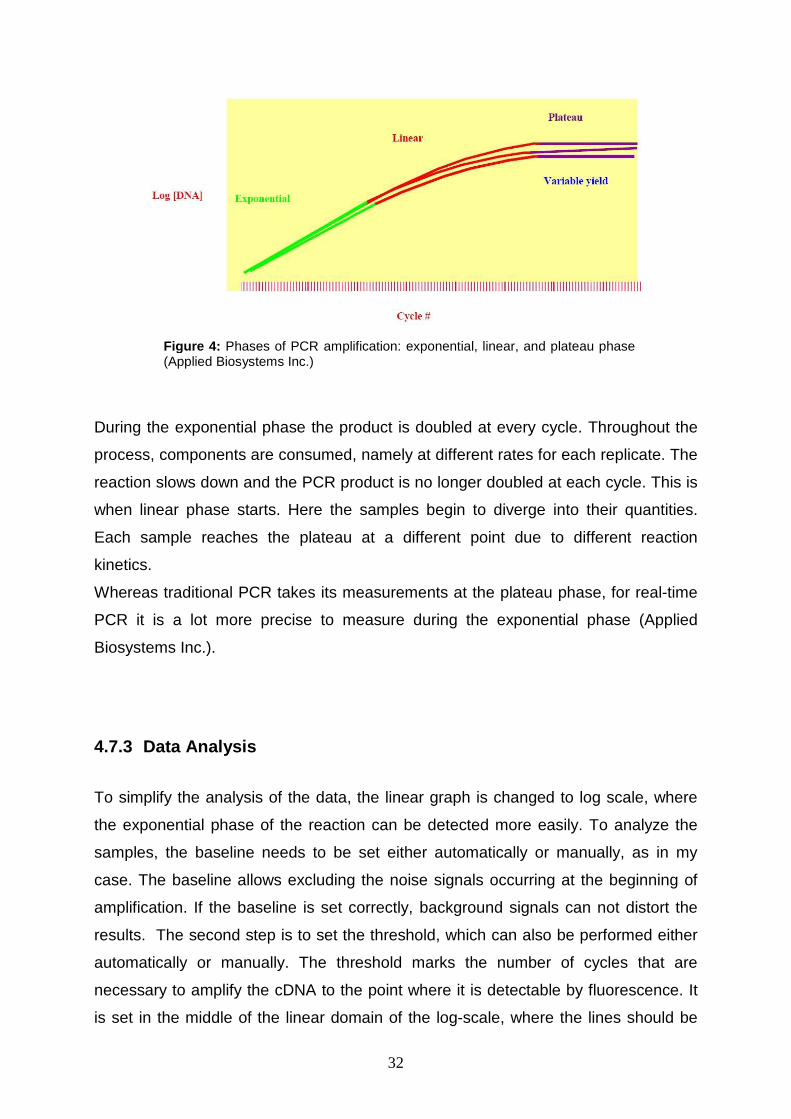
To simplify the analysis of the data, the linear graph is changed to log scale, where
the exponential phase of the reaction can be detected more easily. To analyze the
samples, the baseline needs to be set either automatically or manually, as in my
case. The baseline allows excluding the noise signals occurring at the beginning of
amplification. If the baseline is set correctly, background signals can not distort the
results. The second step is to set the threshold, which can also be performed either
automatically or manually. The threshold marks the number of cycles that are
necessary to amplify the cDNA to the point where it is detectable by fluorescence. It
is set in the middle of the linear domain of the log-scale, where the lines should be
Figure 4: Phases of PCR amplification: exponential, linear, and plateau phase (Applied Biosystems Inc.)
33
parallel and each pair of lines (every sample is double-determined) should swap
(Applied Biosystems Inc.).
4.7.4 Calculation
To calculate the results of the quantitation assays, either absolute or relative
quantitation can be used (Applied Biosystems User Bulletin #2: Relative Quantitation
of Gene Expression (PN 4303859)).
Absolute quantitation is used to quantitate unknown samples by using a standard
curve. In contrast, relative quantitation assays are used to analyze changes in gene
expression in a given sample relative to another reference sample. Calculation can
be performed by the standard curve method or by comparative CT method, which
has been chosen in this case. By applying the CT method the need for a standard
curve is eliminated. Hence, time and amount of work can be reduced.
The difference between the standard curve method and the comparative CT method
is the use of arithmetic formulas to achieve the results (Applied Biosystems Inc.).
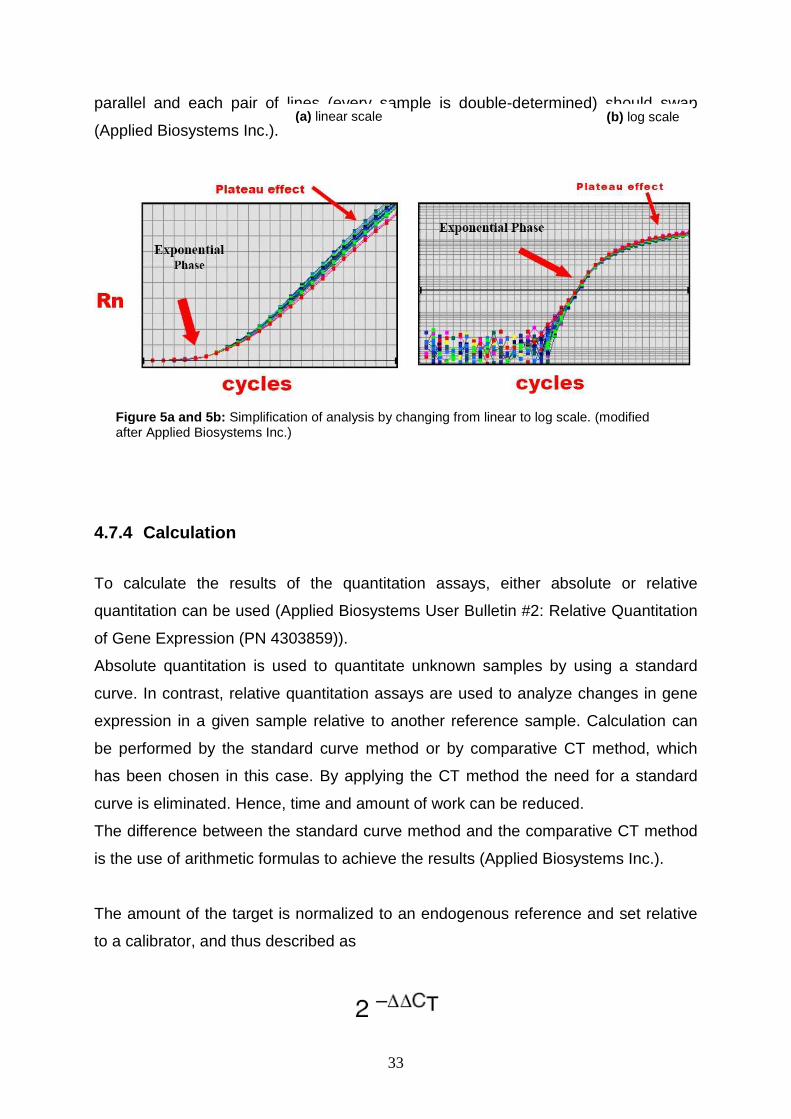
The amount of the target is normalized to an endogenous reference and set relative
to a calibrator, and thus described as
Figure 5a and 5b: Simplification of analysis by changing from linear to log scale. (modified after Applied Biosystems Inc.)
(a) linear scale (b) log scale
34
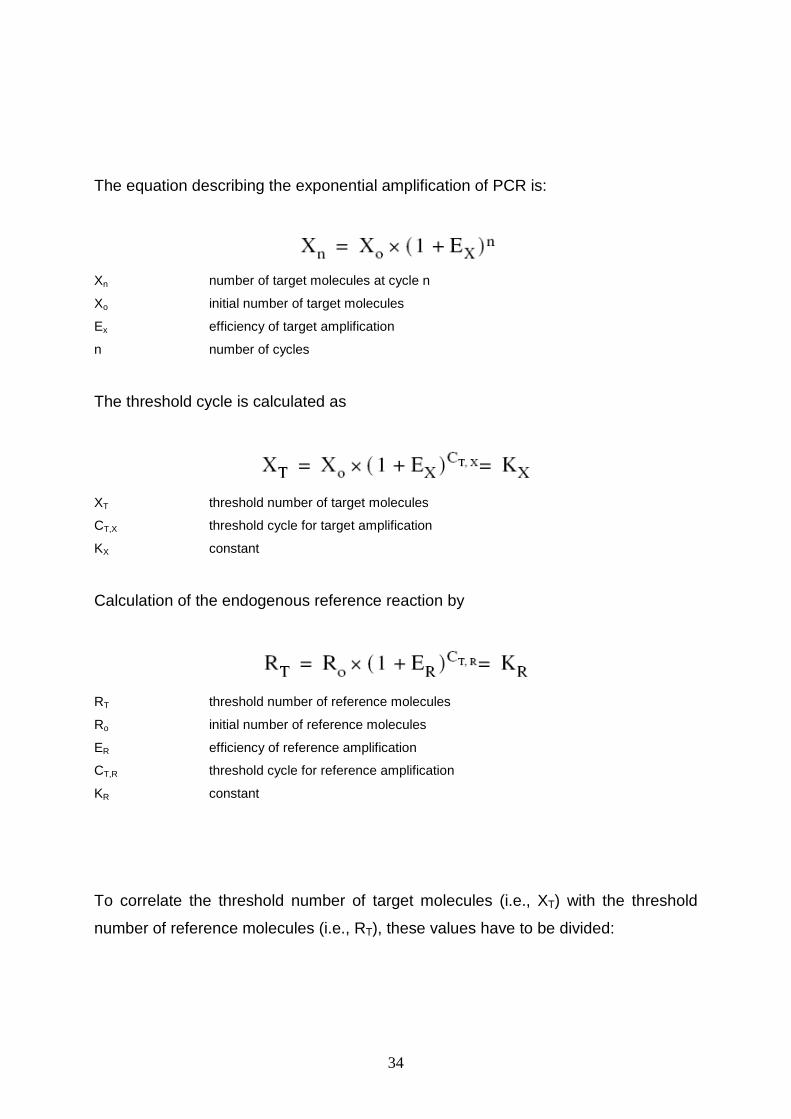
The equation describing the exponential amplification of PCR is:
Xn number of target molecules at cycle n
Xo initial number of target molecules
Ex efficiency of target amplification
n number of cycles
The threshold cycle is calculated as
XT threshold number of target molecules
CT,X threshold cycle for target amplification
KX constant
Calculation of the endogenous reference reaction by
RT threshold number of reference molecules
Ro initial number of reference molecules
ER efficiency of reference amplification
CT,R threshold cycle for reference amplification
KR constant
To correlate the threshold number of target molecules (i.e., XT) with the threshold
number of reference molecules (i.e., RT), these values have to be divided:
35
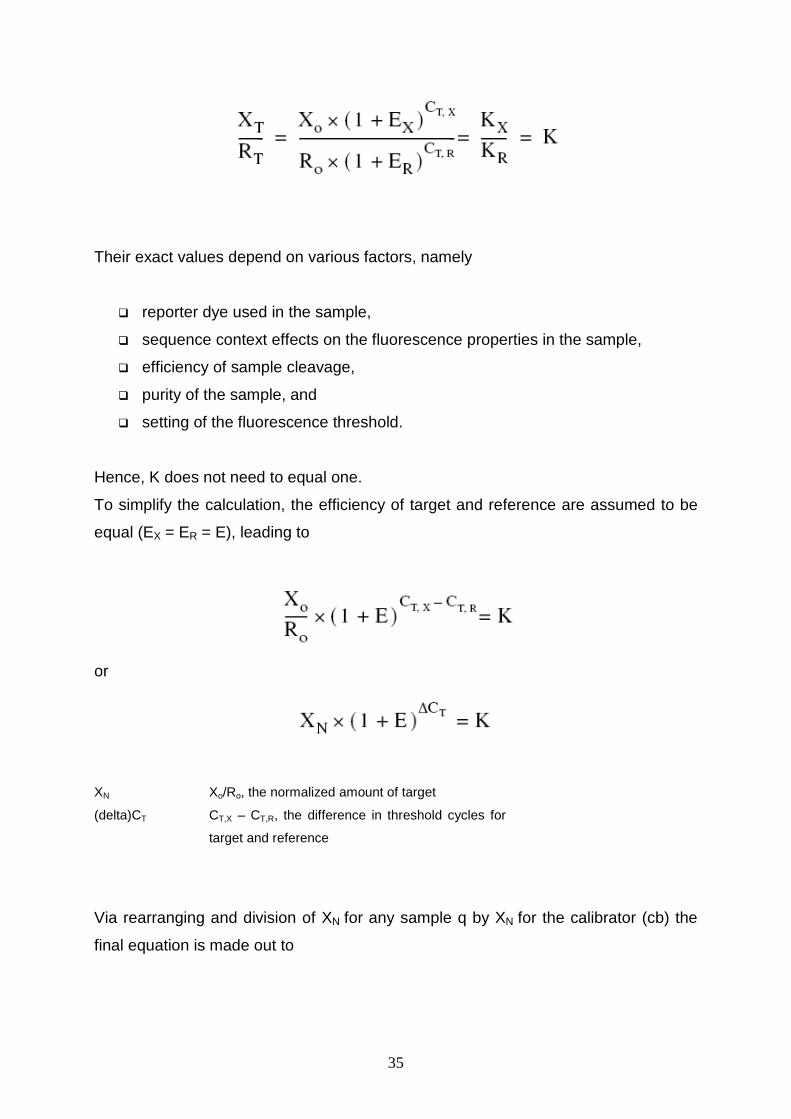
Their exact values depend on various factors, namely
� reporter dye used in the sample,
� sequence context effects on the fluorescence properties in the sample,
� efficiency of sample cleavage,
� purity of the sample, and
� setting of the fluorescence threshold.
Hence, K does not need to equal one.
To simplify the calculation, the efficiency of target and reference are assumed to be
equal (EX = ER = E), leading to
or
XN Xo/Ro, the normalized amount of target
(delta)CT CT,X – CT,R, the difference in threshold cycles for
target and reference
Via rearranging and division of XN for any sample q by XN for the calibrator (cb) the
final equation is made out to
36
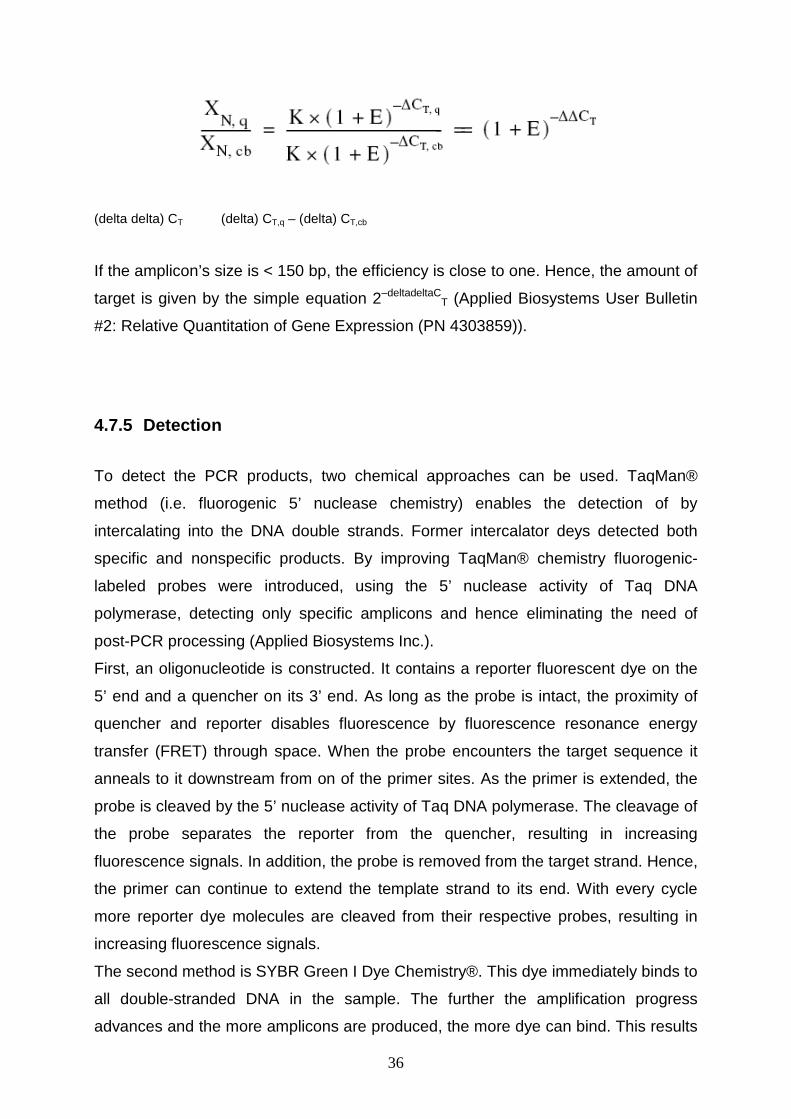
(delta delta) CT (delta) CT,q – (delta) CT,cb
If the amplicon’s size is < 150 bp, the efficiency is close to one. Hence, the amount of
target is given by the simple equation 2–deltadeltaCT (Applied Biosystems User Bulletin
#2: Relative Quantitation of Gene Expression (PN 4303859)).
4.7.5 Detection
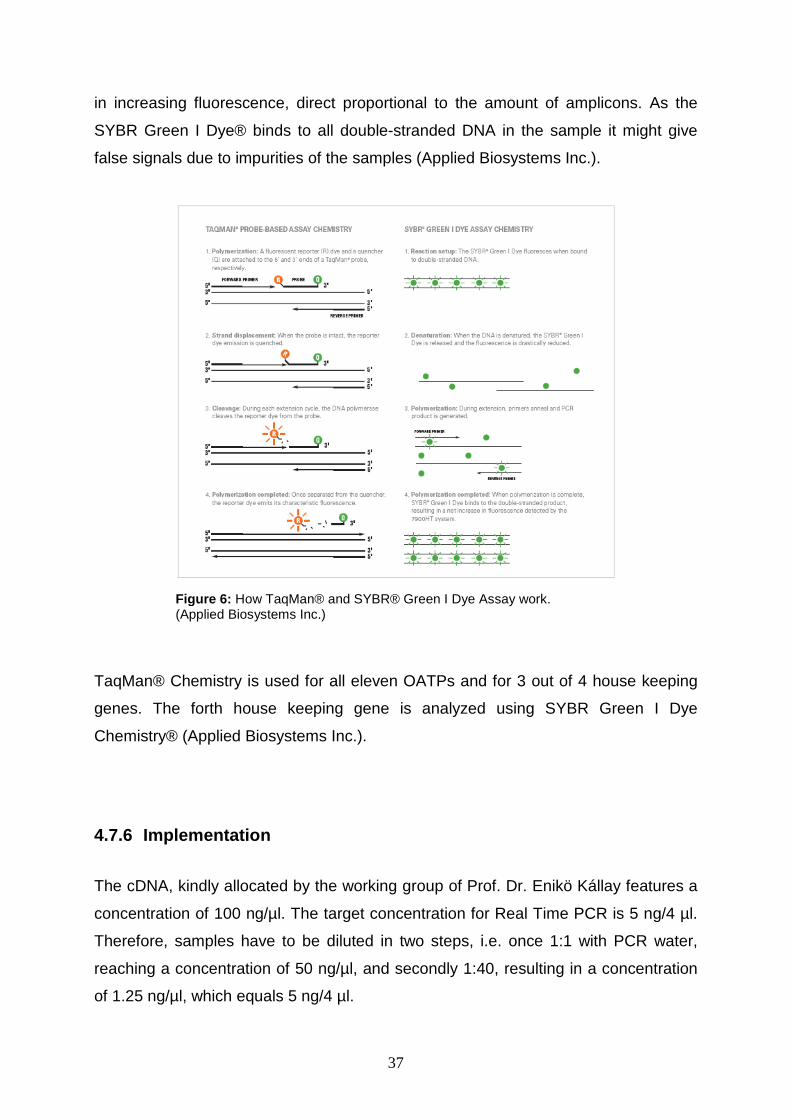
To detect the PCR products, two chemical approaches can be used. TaqMan®
method (i.e. fluorogenic 5’ nuclease chemistry) enables the detection of by
intercalating into the DNA double strands. Former intercalator deys detected both
specific and nonspecific products. By improving TaqMan® chemistry fluorogenic-
labeled probes were introduced, using the 5’ nuclease activity of Taq DNA
polymerase, detecting only specific amplicons and hence eliminating the need of
post-PCR processing (Applied Biosystems Inc.).
First, an oligonucleotide is constructed. It contains a reporter fluorescent dye on the
5’ end and a quencher on its 3’ end. As long as the probe is intact, the proximity of
quencher and reporter disables fluorescence by fluorescence resonance energy
transfer (FRET) through space. When the probe encounters the target sequence it
anneals to it downstream from on of the primer sites. As the primer is extended, the
probe is cleaved by the 5’ nuclease activity of Taq DNA polymerase. The cleavage of
the probe separates the reporter from the quencher, resulting in increasing
fluorescence signals. In addition, the probe is removed from the target strand. Hence,
the primer can continue to extend the template strand to its end. With every cycle
more reporter dye molecules are cleaved from their respective probes, resulting in
increasing fluorescence signals.
The second method is SYBR Green I Dye Chemistry®. This dye immediately binds to
all double-stranded DNA in the sample. The further the amplification progress
advances and the more amplicons are produced, the more dye can bind. This results
37
in increasing fluorescence, direct proportional to the amount of amplicons. As the
SYBR Green I Dye® binds to all double-stranded DNA in the sample it might give
false signals due to impurities of the samples (Applied Biosystems Inc.).
TaqMan® Chemistry is used for all eleven OATPs and for 3 out of 4 house keeping
genes. The forth house keeping gene is analyzed using SYBR Green I Dye
Chemistry® (Applied Biosystems Inc.).
4.7.6 Implementation
The cDNA, kindly allocated by the working group of Prof. Dr. Enikö Kállay features a
concentration of 100 ng/µl. The target concentration for Real Time PCR is 5 ng/4 µl.
Therefore, samples have to be diluted in two steps, i.e. once 1:1 with PCR water,
reaching a concentration of 50 ng/µl, and secondly 1:40, resulting in a concentration
of 1.25 ng/µl, which equals 5 ng/4 µl.
Figure 6: How TaqMan® and SYBR® Green I Dye Assay work. (Applied Biosystems Inc.)
38
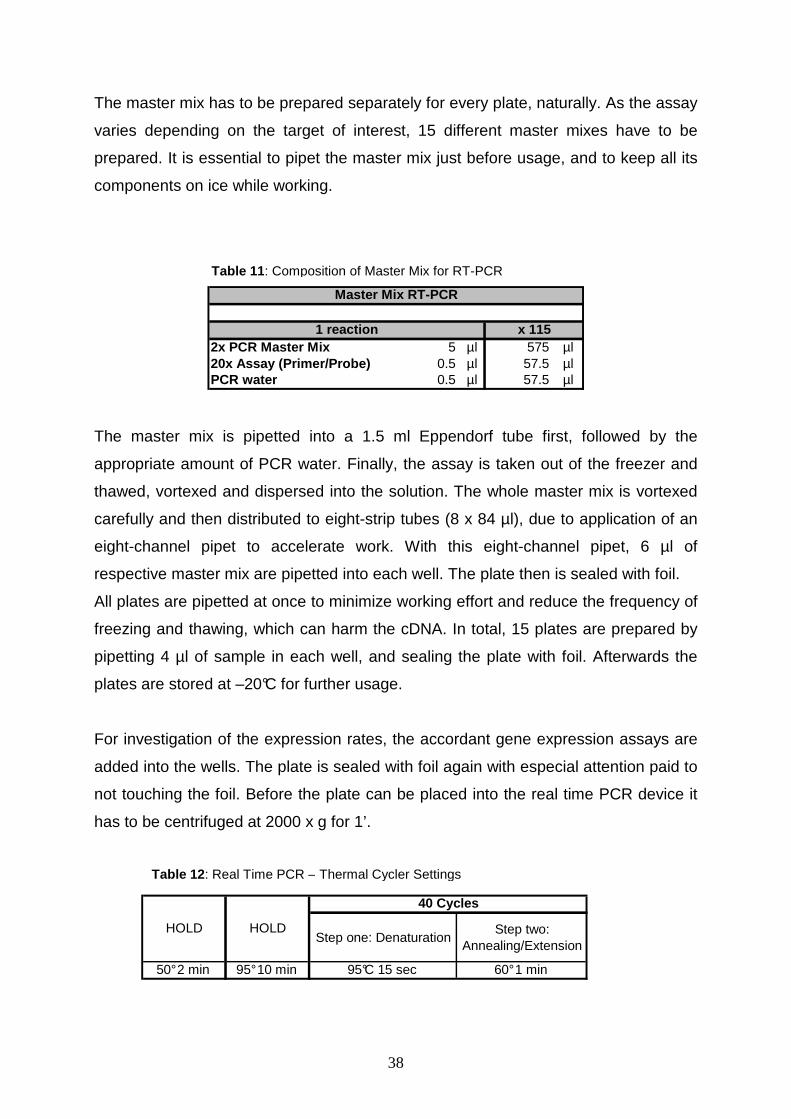
The master mix has to be prepared separately for every plate, naturally. As the assay
varies depending on the target of interest, 15 different master mixes have to be
prepared. It is essential to pipet the master mix just before usage, and to keep all its
components on ice while working.
2x PCR Master Mix 5 µl 575 µl20x Assay (Primer/Probe) 0.5 µl 57.5 µlPCR water 0.5 µl 57.5 µl
Master Mix RT-PCR
1 reaction x 115
The master mix is pipetted into a 1.5 ml Eppendorf tube first, followed by the
appropriate amount of PCR water. Finally, the assay is taken out of the freezer and
thawed, vortexed and dispersed into the solution. The whole master mix is vortexed
carefully and then distributed to eight-strip tubes (8 x 84 µl), due to application of an
eight-channel pipet to accelerate work. With this eight-channel pipet, 6 µl of
respective master mix are pipetted into each well. The plate then is sealed with foil.
All plates are pipetted at once to minimize working effort and reduce the frequency of
freezing and thawing, which can harm the cDNA. In total, 15 plates are prepared by
pipetting 4 µl of sample in each well, and sealing the plate with foil. Afterwards the
plates are stored at –20°C for further usage.
For investigation of the expression rates, the accordant gene expression assays are
added into the wells. The plate is sealed with foil again with especial attention paid to
not touching the foil. Before the plate can be placed into the real time PCR device it
has to be centrifuged at 2000 x g for 1’.
Step one: DenaturationStep two:
Annealing/Extension
50° 2 min 95° 10 min 95°C 15 sec 60° 1 min
HOLD HOLD
40 Cycles
Table 12 : Real Time PCR – Thermal Cycler Settings
Table 11: Composition of Master Mix for RT-PCR

39
The results are exported into a Microsoft Excel® data sheet and analyzed with the
kind help of Mag. Martin Svoboda. The relative quantities are expressed as MNE, i.e.
mean normalized expression values (Muller et al., 2002), and refer to the average
value of the calibrators.
40
5 RESULTS AND DISCUSSION
The main objective of the present thesis is to investigate the expression rates of the
eleven human SLCO genes on the mRNA level in samples from tumors and tumor
cell lines, including human colorectal cancer samples, derived from patients
hospitalized at the AKH Wien, human colon cell lines, human lung cell lines and
human ovary cell lines.
Extraction of RNA and preparation of cDNA is done by Mag. Martin Svoboda and
other colleagues of the Department of Pathophysiology on the AKH Wien. cDNA can
directly be used to perform real time PCR. The results obtained are analyzed using
Microsoft Excel®.
Some information about the cell lines I worked with are given in chapter 5.1 (see
table 13).
5.1 Cell Lines – A Short Characterization
Apart from the twenty patient colorectal cancer samples, five colon carcinoma cell
lines, eight lung carcinoma cell lines, and six ovarian carcinoma cell lines are used in
the present investigations. All of them are established cell lines for laboratory use.
Table 13 gives a brief overview of the cells’ most worth knowing details.
NCI-H69 Human small cell lung carcinoma, derived from a 55 years old Caucasian (CLS –
Cell Lines Service Inc.)
HBE Human bronchial epithelial cells (CLS)
DMS-114 Human small cell lung carcinoma (CLS)
DMS-456 Human small cell lung carcinoma (CLS)
Table 13 : Short Characterization of Carcinoma Cell Lines, used in the present investigations.
41
GLC-16 Human small cell lung cancer cell line (Berendsen et al., 1988)
HEY cell lines
Human ovarian carcinoma cell lines, derived from human ovarian cancer xenograph
(HX-62), with demonstrated different degrees of resistance against alkylating
chemotherapy agents (Cellutions Biosystems Inc.)
HEY Alimta Demonstrated resistance against pemetrexed
HEY Cis Demonstrated resistance against cisplatin
HEY Doce Demonstrated resistance against docetaxel
HEY Etop Demonstrated resistance against etoposide
HEY Pax Demonstrated resistance against paclitaxel
HEY WT Wild type
Caco 2/15 Human colorectal adenocarcinoma, isolated from a primary colonic tumor, derived
from a 72 years old male Caucasian (CLS)
Coga 1A Human colon carcinoma cell line, derived from a pT3 stage moderately differentiated
carcinoma (Brozek et al., 2008)
C205 Human colorectal adenocarcinoma (colon, metastatic), derived from a 70 years old
male caucasian (CLS)
HT 29 Human adenocarcinoma (colorectal), derived from a 44 years old Caucasian (CLS)
L174T Human adenocarcinoma (colon, colorectal), derived from a 58 years old female
Caucasian (CLS)
5.2 Expression of OATPs in Human Colon Carcinoma Ce ll Lines
The results obtained by real time PCR were analyzed using Microsoft Excel. As the
calibrator is arbitrarily set to the value of 1 the expression rates have to be
understood as relative multiples. The abbreviation “MNE” stands for “mean
normalized expression value”. The calibrator consists of a mixture of all 9 cell lines’
cDNAs to make the cells comparable among each other. MNE values are calculated
according to the expression of the respective gene in the calibrator.
Table 13 ctd. : Short Characterization of Carcinoma Cell Lines, used in the present investigations.
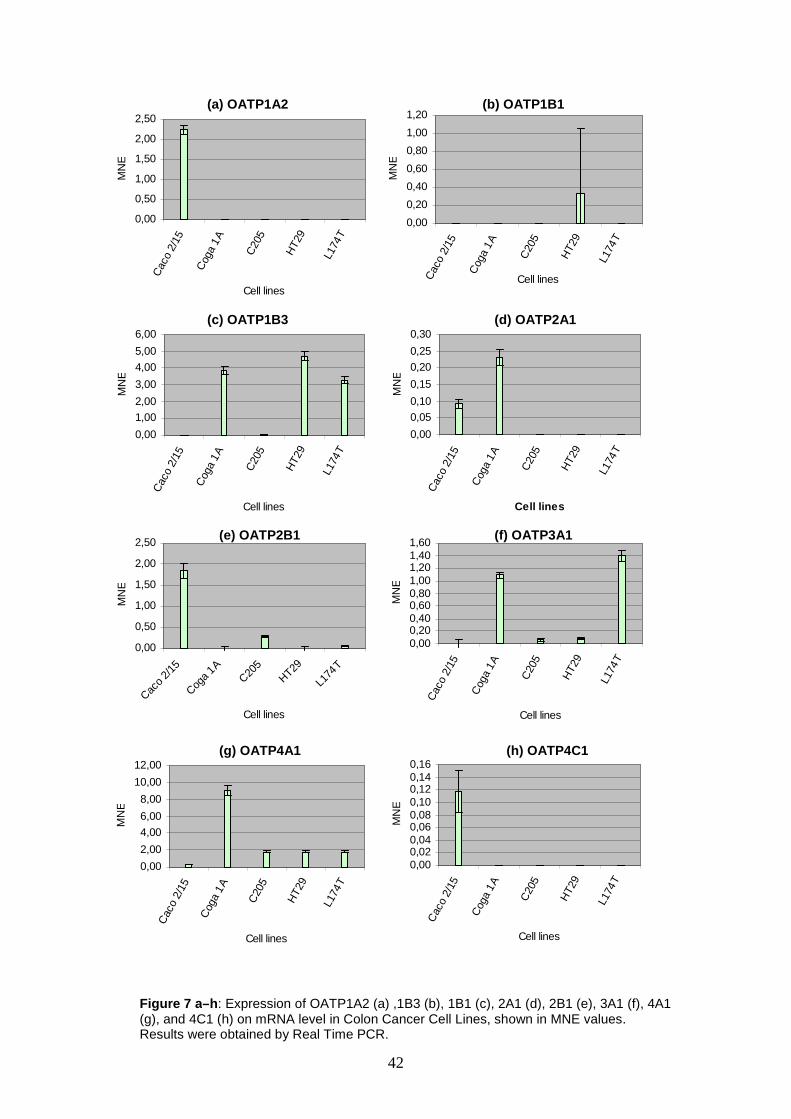
42
0,00
0,05
0,10
0,15
0,20
0,25
0,30
Cac
o 2/
15
Cog
a 1A
C20
5
HT2
9
L174
T
Cell lines
MN
E
0,00
0,50
1,00
1,50
2,00
2,50
Caco
2/15
Coga
1AC20
5HT29
L174
T
Cell lines
MN
E
0,000,200,400,600,801,001,201,401,60
Cac
o 2/
15
Cog
a 1A
C20
5
HT2
9
L174
T
Cell lines
MN
E
0,000,020,040,060,080,100,120,140,16
Cac
o 2/
15
Cog
a 1A
C20
5
HT2
9
L174
T
Cell lines
MN
E
0,00
2,00
4,00
6,00
8,00
10,00
12,00
Cac
o 2/
15
Cog
a 1A
C20
5
HT2
9
L174
T
Cell lines
MN
E
0,00
0,20
0,40
0,60
0,80
1,00
1,20
Cac
o 2/
15
Cog
a 1A
C20
5
HT2
9
L174
T
Cell lines
MN
E
0,00
0,50
1,00
1,50
2,00
2,50
Cac
o 2/
15
Cog
a 1A
C20
5
HT2
9
L174
T
Cell lines
MN
E
0,00
1,00
2,00
3,00
4,00
5,00
6,00
Cac
o 2/
15
Cog
a 1A
C20
5
HT2
9
L174
T
Cell lines
MN
E
(a) OATP1A2
(c) OATP1B3
(b) OATP1B1
(d) OATP2A1
(e) OATP2B1
(g) OATP4A1 (h) OATP4C1
(f) OATP3A1
Figure 7 a –h: Expression of OATP1A2 (a) ,1B3 (b), 1B1 (c), 2A1 (d), 2B1 (e), 3A1 (f), 4A1 (g), and 4C1 (h) on mRNA level in Colon Cancer Cell Lines, shown in MNE values. Results were obtained by Real Time PCR.
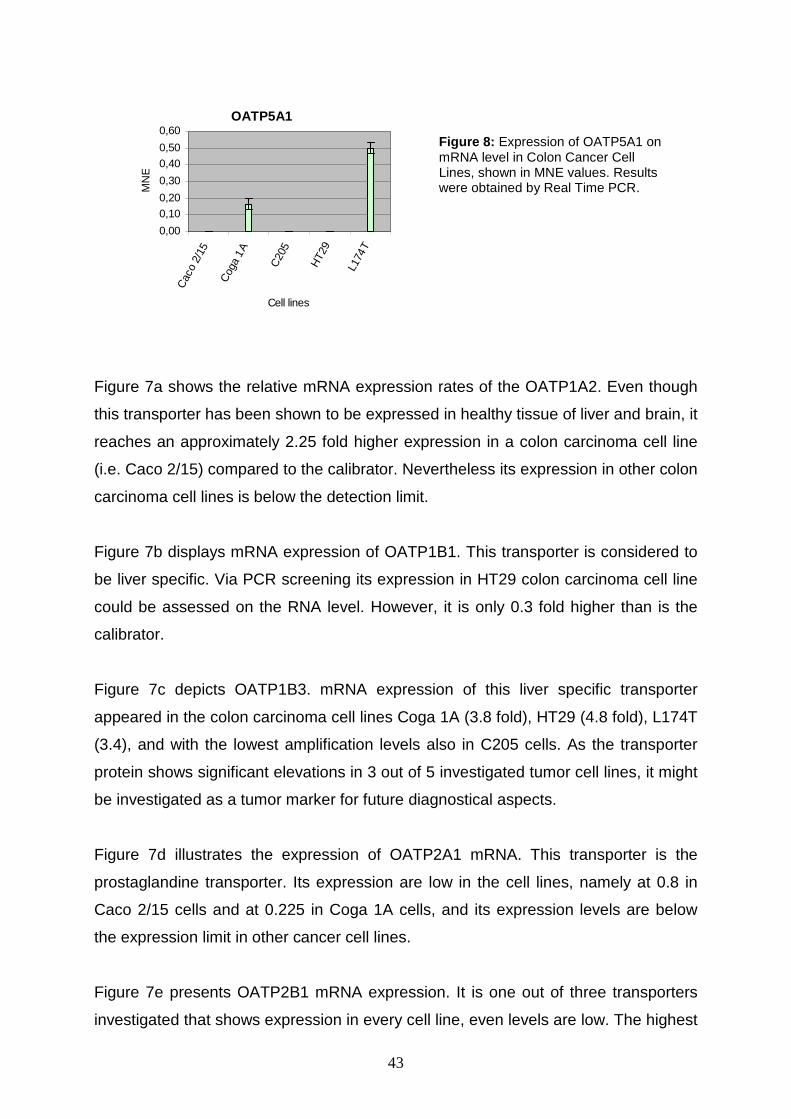
43
Figure 7a shows the relative mRNA expression rates of the OATP1A2. Even though
this transporter has been shown to be expressed in healthy tissue of liver and brain, it
reaches an approximately 2.25 fold higher expression in a colon carcinoma cell line
(i.e. Caco 2/15) compared to the calibrator. Nevertheless its expression in other colon
carcinoma cell lines is below the detection limit.
Figure 7b displays mRNA expression of OATP1B1. This transporter is considered to
be liver specific. Via PCR screening its expression in HT29 colon carcinoma cell line
could be assessed on the RNA level. However, it is only 0.3 fold higher than is the
calibrator.
Figure 7c depicts OATP1B3. mRNA expression of this liver specific transporter
appeared in the colon carcinoma cell lines Coga 1A (3.8 fold), HT29 (4.8 fold), L174T
(3.4), and with the lowest amplification levels also in C205 cells. As the transporter
protein shows significant elevations in 3 out of 5 investigated tumor cell lines, it might
be investigated as a tumor marker for future diagnostical aspects.
Figure 7d illustrates the expression of OATP2A1 mRNA. This transporter is the
prostaglandine transporter. Its expression are low in the cell lines, namely at 0.8 in
Caco 2/15 cells and at 0.225 in Coga 1A cells, and its expression levels are below
the expression limit in other cancer cell lines.
Figure 7e presents OATP2B1 mRNA expression. It is one out of three transporters
investigated that shows expression in every cell line, even levels are low. The highest
Figure 8: Expression of OATP5A1 on mRNA level in Colon Cancer Cell Lines, shown in MNE values. Results were obtained by Real Time PCR.
0,00
0,10
0,20
0,30
0,40
0,50
0,60
Cac
o 2/
15
Cog
a 1A
C20
5
HT2
9
L174
T
Cell lines
MN
E
OATP5A1
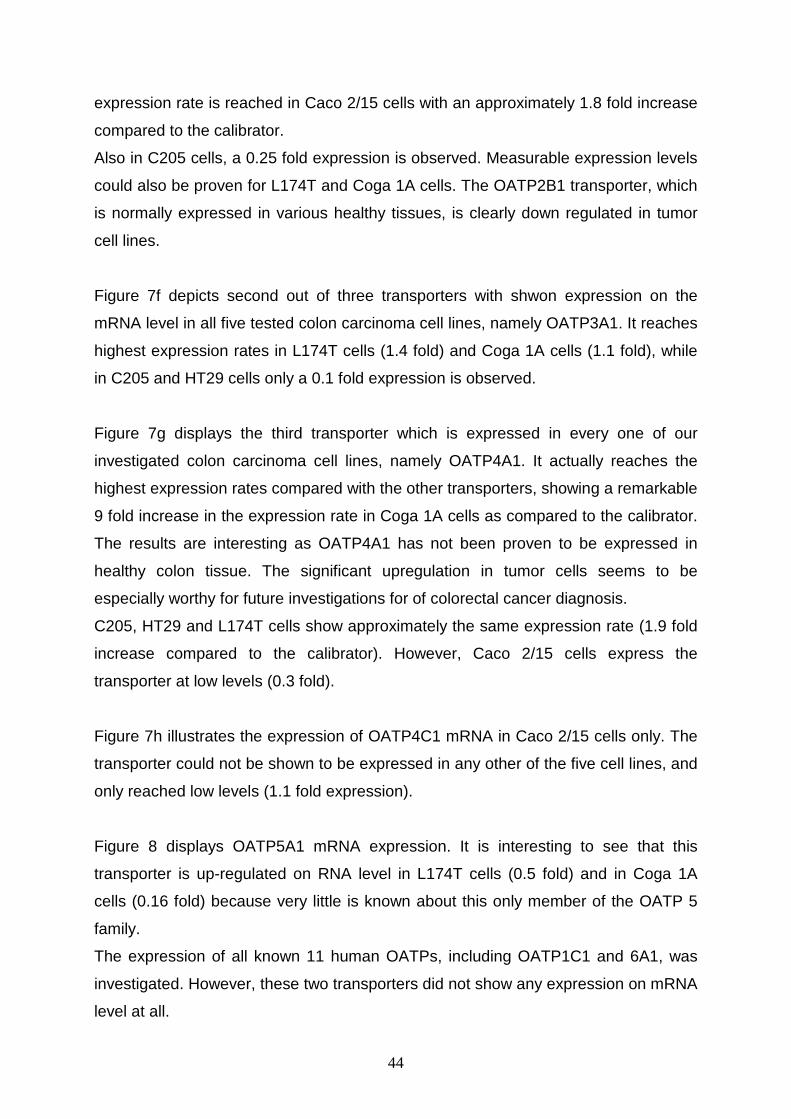
44
expression rate is reached in Caco 2/15 cells with an approximately 1.8 fold increase
compared to the calibrator.
Also in C205 cells, a 0.25 fold expression is observed. Measurable expression levels
could also be proven for L174T and Coga 1A cells. The OATP2B1 transporter, which
is normally expressed in various healthy tissues, is clearly down regulated in tumor
cell lines.
Figure 7f depicts second out of three transporters with shwon expression on the
mRNA level in all five tested colon carcinoma cell lines, namely OATP3A1. It reaches
highest expression rates in L174T cells (1.4 fold) and Coga 1A cells (1.1 fold), while
in C205 and HT29 cells only a 0.1 fold expression is observed.
Figure 7g displays the third transporter which is expressed in every one of our
investigated colon carcinoma cell lines, namely OATP4A1. It actually reaches the
highest expression rates compared with the other transporters, showing a remarkable
9 fold increase in the expression rate in Coga 1A cells as compared to the calibrator.
The results are interesting as OATP4A1 has not been proven to be expressed in
healthy colon tissue. The significant upregulation in tumor cells seems to be
especially worthy for future investigations for of colorectal cancer diagnosis.
C205, HT29 and L174T cells show approximately the same expression rate (1.9 fold
increase compared to the calibrator). However, Caco 2/15 cells express the
transporter at low levels (0.3 fold).
Figure 7h illustrates the expression of OATP4C1 mRNA in Caco 2/15 cells only. The
transporter could not be shown to be expressed in any other of the five cell lines, and
only reached low levels (1.1 fold expression).
Figure 8 displays OATP5A1 mRNA expression. It is interesting to see that this
transporter is up-regulated on RNA level in L174T cells (0.5 fold) and in Coga 1A
cells (0.16 fold) because very little is known about this only member of the OATP 5
family.
The expression of all known 11 human OATPs, including OATP1C1 and 6A1, was
investigated. However, these two transporters did not show any expression on mRNA
level at all.
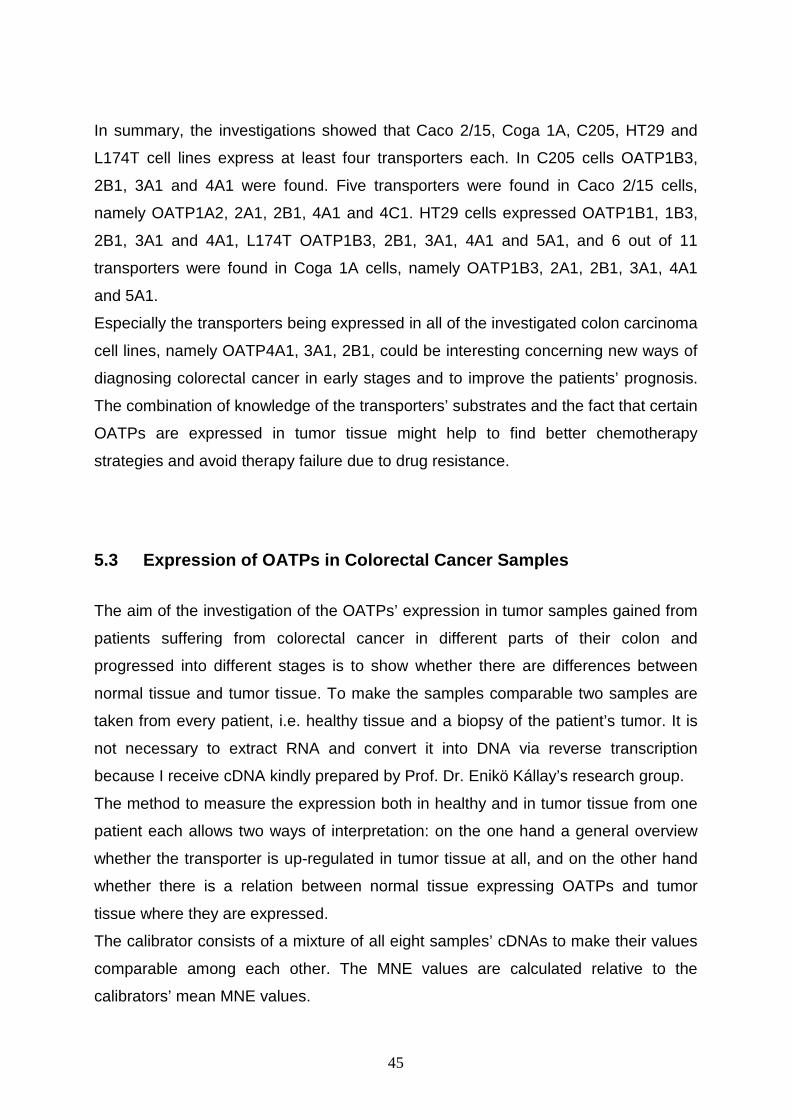
45
In summary, the investigations showed that Caco 2/15, Coga 1A, C205, HT29 and
L174T cell lines express at least four transporters each. In C205 cells OATP1B3,
2B1, 3A1 and 4A1 were found. Five transporters were found in Caco 2/15 cells,
namely OATP1A2, 2A1, 2B1, 4A1 and 4C1. HT29 cells expressed OATP1B1, 1B3,
2B1, 3A1 and 4A1, L174T OATP1B3, 2B1, 3A1, 4A1 and 5A1, and 6 out of 11
transporters were found in Coga 1A cells, namely OATP1B3, 2A1, 2B1, 3A1, 4A1
and 5A1.
Especially the transporters being expressed in all of the investigated colon carcinoma
cell lines, namely OATP4A1, 3A1, 2B1, could be interesting concerning new ways of
diagnosing colorectal cancer in early stages and to improve the patients’ prognosis.
The combination of knowledge of the transporters’ substrates and the fact that certain
OATPs are expressed in tumor tissue might help to find better chemotherapy
strategies and avoid therapy failure due to drug resistance.
5.3 Expression of OATPs in Colorectal Cancer Sample s
The aim of the investigation of the OATPs’ expression in tumor samples gained from
patients suffering from colorectal cancer in different parts of their colon and
progressed into different stages is to show whether there are differences between
normal tissue and tumor tissue. To make the samples comparable two samples are
taken from every patient, i.e. healthy tissue and a biopsy of the patient’s tumor. It is
not necessary to extract RNA and convert it into DNA via reverse transcription
because I receive cDNA kindly prepared by Prof. Dr. Enikö Kállay’s research group.
The method to measure the expression both in healthy and in tumor tissue from one
patient each allows two ways of interpretation: on the one hand a general overview
whether the transporter is up-regulated in tumor tissue at all, and on the other hand
whether there is a relation between normal tissue expressing OATPs and tumor
tissue where they are expressed.
The calibrator consists of a mixture of all eight samples’ cDNAs to make their values
comparable among each other. The MNE values are calculated relative to the
calibrators’ mean MNE values.
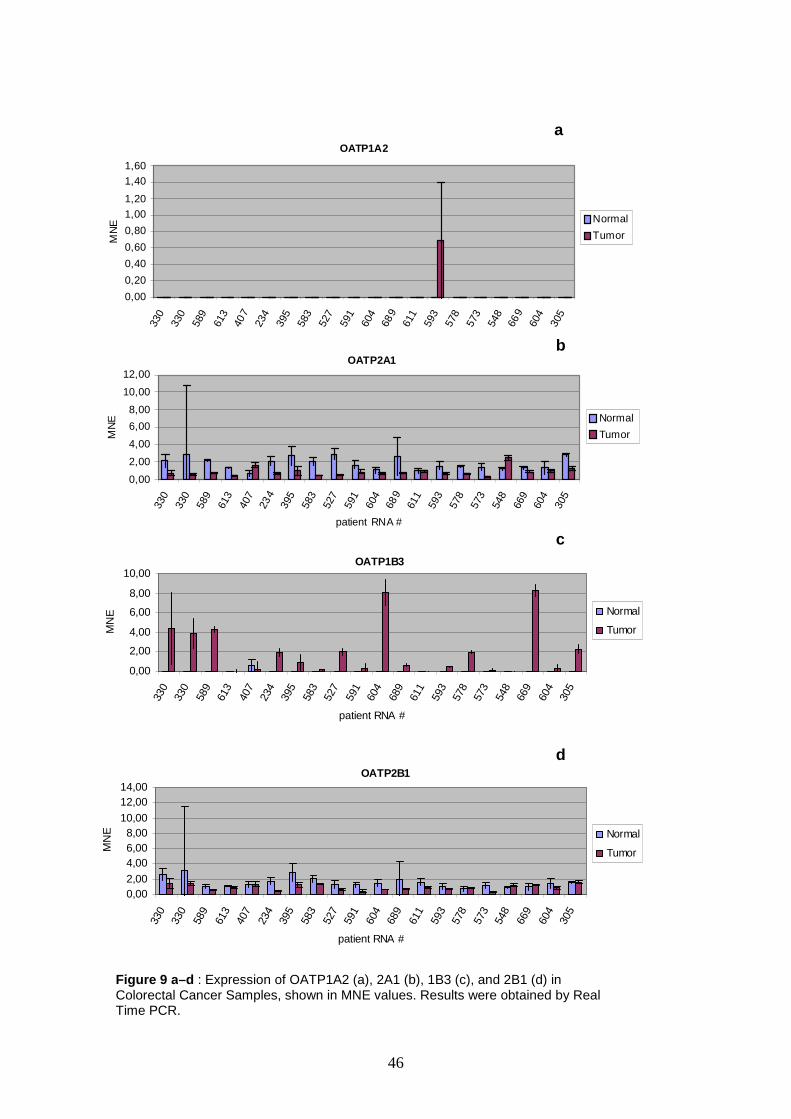
46
OATP1B3
0,00
2,00
4,00
6,00
8,00
10,00
330
330
589
613
407
234
395
583
527
591
604
689
611
593
578
573
548
669
604
305
patient RNA #
MN
E Normal
Tumor
OATP2B1
0,002,00
4,006,008,00
10,00
12,0014,00
330
330
589
613
407
234
395
583
527
591
604
689
611
593
578
573
548
669
604
305
patient RNA #
MN
E Normal
Tumor
Figure 9 a–d : Expression of OATP1A2 (a), 2A1 (b), 1B3 (c), and 2B1 (d) in Colorectal Cancer Samples, shown in MNE values. Results were obtained by Real Time PCR.
OATP1A2
0,00
0,20
0,40
0,60
0,80
1,001,20
1,401,60
330
330
589
613
407
234
395
583
527
591
604
689
611
593
578
573
548
669
604
305
patient RNA #
MN
E Normal
Tumor
OATP2A1
0,00
2,00
4,00
6,00
8,00
10,00
12,00
330
330
589
613
407
234
395
583
527
591
604
689
611
593
578
573
548
669
604
305
patient RNA #
MN
E Normal
Tumor
a
b
c
d
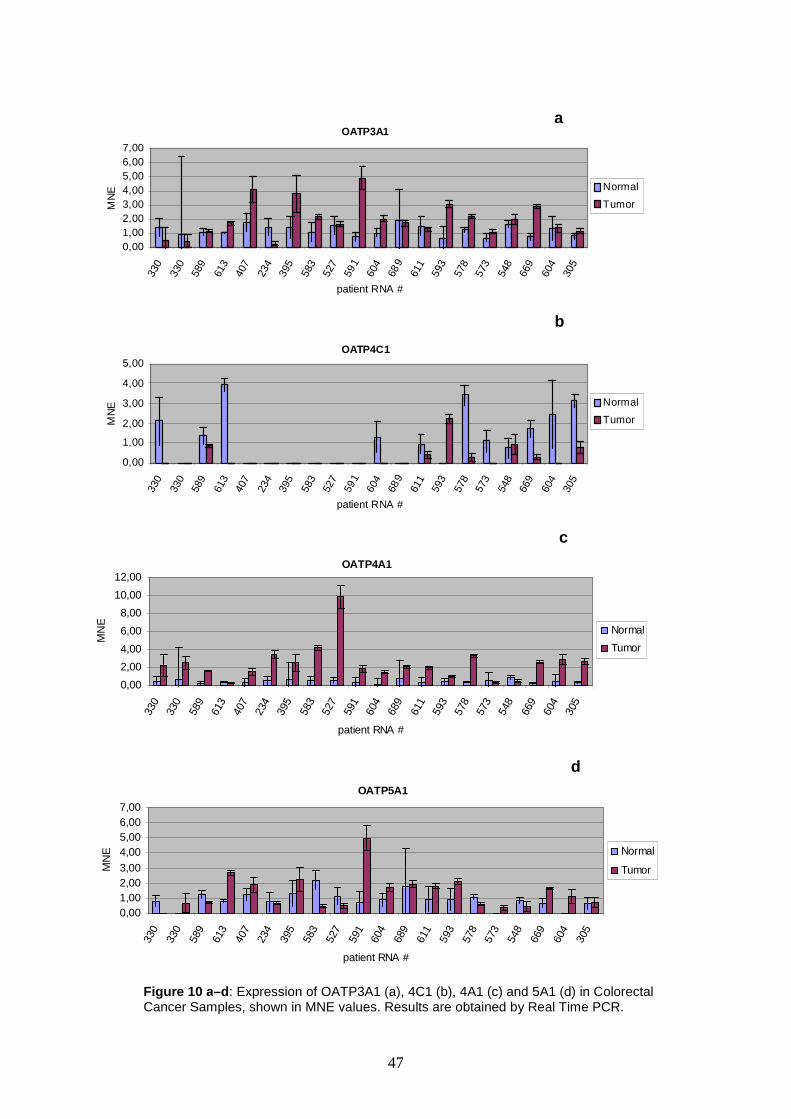
47
OATP5A1
0,001,002,003,004,005,006,007,00
330
330
589
613
407
234
395
583
527
591
604
689
611
593
578
573
548
669
604
305
patient RNA #
MN
E Normal
Tumor
OATP4A1
0,00
2,00
4,00
6,00
8,00
10,00
12,00
330
330
589
613
407
234
395
583
527
591
604
689
611
593
578
573
548
669
604
305
patient RNA #
MN
E
Normal
Tumor
OATP4C1
0,00
1,00
2,00
3,00
4,00
5,00
330
330
589
613
407
234
395
583
527
591
604
689
611
593
578
573
548
669
604
305
patient RNA #
MN
E Normal
Tumor
Figure 10 a –d: Expression of OATP3A1 (a), 4C1 (b), 4A1 (c) and 5A1 (d) in Colorectal Cancer Samples, shown in MNE values. Results are obtained by Real Time PCR.
OATP3A1
0,001,002,003,004,005,006,007,00
330
330
589
613
407
234
395
583
527
591
604
689
611
593
578
573
548
669
604
305
patient RNA #
MN
E Normal
Tumor
a
b
c
d
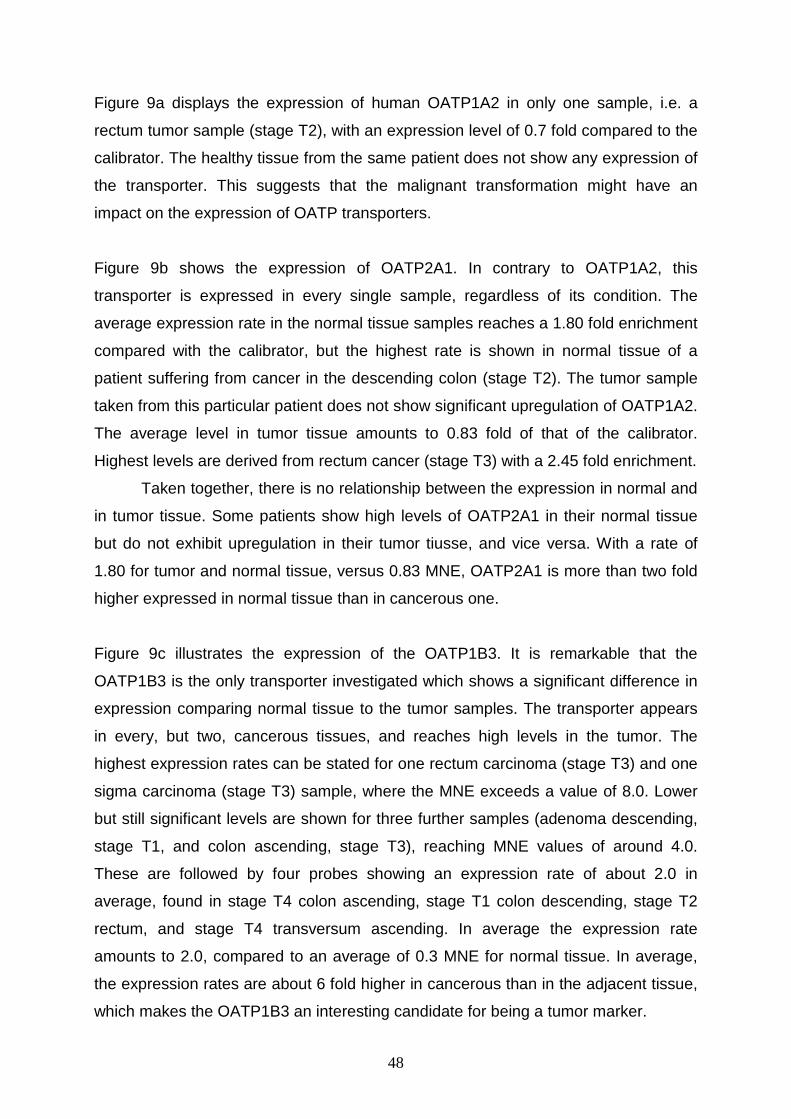
48
Figure 9a displays the expression of human OATP1A2 in only one sample, i.e. a
rectum tumor sample (stage T2), with an expression level of 0.7 fold compared to the
calibrator. The healthy tissue from the same patient does not show any expression of
the transporter. This suggests that the malignant transformation might have an
impact on the expression of OATP transporters.
Figure 9b shows the expression of OATP2A1. In contrary to OATP1A2, this
transporter is expressed in every single sample, regardless of its condition. The
average expression rate in the normal tissue samples reaches a 1.80 fold enrichment
compared with the calibrator, but the highest rate is shown in normal tissue of a
patient suffering from cancer in the descending colon (stage T2). The tumor sample
taken from this particular patient does not show significant upregulation of OATP1A2.
The average level in tumor tissue amounts to 0.83 fold of that of the calibrator.
Highest levels are derived from rectum cancer (stage T3) with a 2.45 fold enrichment.
Taken together, there is no relationship between the expression in normal and
in tumor tissue. Some patients show high levels of OATP2A1 in their normal tissue
but do not exhibit upregulation in their tumor tiusse, and vice versa. With a rate of
1.80 for tumor and normal tissue, versus 0.83 MNE, OATP2A1 is more than two fold
higher expressed in normal tissue than in cancerous one.
Figure 9c illustrates the expression of the OATP1B3. It is remarkable that the
OATP1B3 is the only transporter investigated which shows a significant difference in
expression comparing normal tissue to the tumor samples. The transporter appears
in every, but two, cancerous tissues, and reaches high levels in the tumor. The
highest expression rates can be stated for one rectum carcinoma (stage T3) and one
sigma carcinoma (stage T3) sample, where the MNE exceeds a value of 8.0. Lower
but still significant levels are shown for three further samples (adenoma descending,
stage T1, and colon ascending, stage T3), reaching MNE values of around 4.0.
These are followed by four probes showing an expression rate of about 2.0 in
average, found in stage T4 colon ascending, stage T1 colon descending, stage T2
rectum, and stage T4 transversum ascending. In average the expression rate
amounts to 2.0, compared to an average of 0.3 MNE for normal tissue. In average,
the expression rates are about 6 fold higher in cancerous than in the adjacent tissue,
which makes the OATP1B3 an interesting candidate for being a tumor marker.
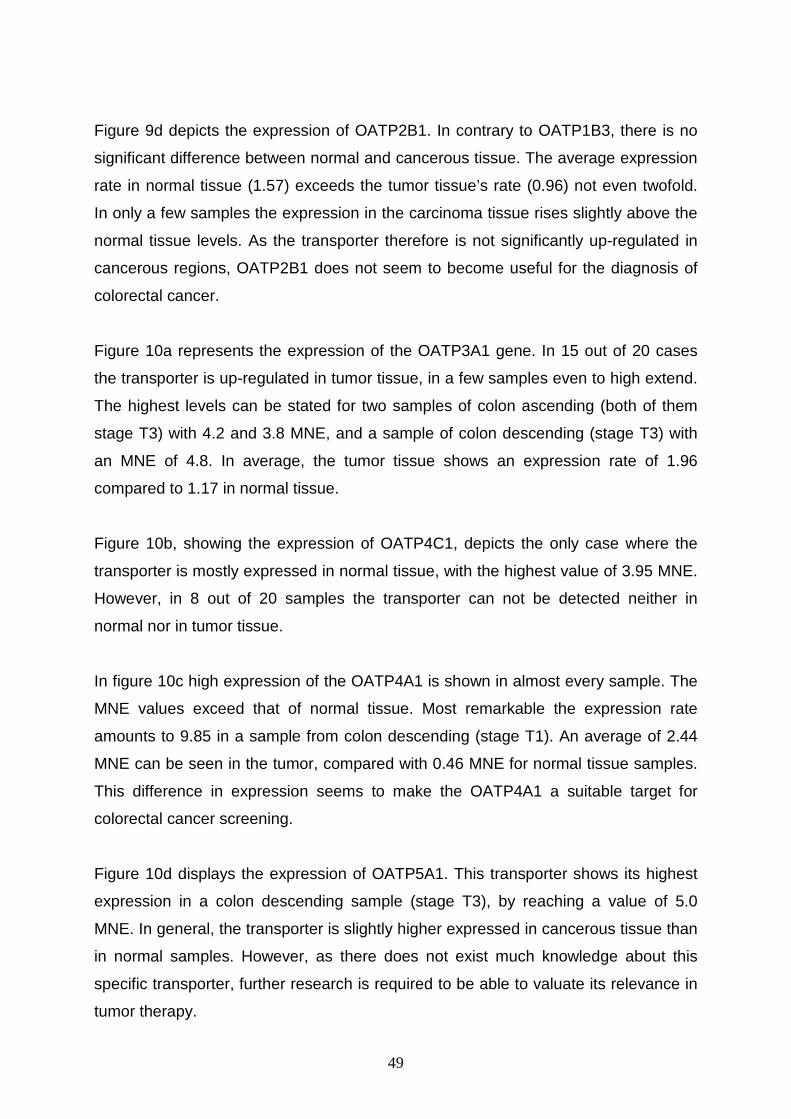
49
Figure 9d depicts the expression of OATP2B1. In contrary to OATP1B3, there is no
significant difference between normal and cancerous tissue. The average expression
rate in normal tissue (1.57) exceeds the tumor tissue’s rate (0.96) not even twofold.
In only a few samples the expression in the carcinoma tissue rises slightly above the
normal tissue levels. As the transporter therefore is not significantly up-regulated in
cancerous regions, OATP2B1 does not seem to become useful for the diagnosis of
colorectal cancer.
Figure 10a represents the expression of the OATP3A1 gene. In 15 out of 20 cases
the transporter is up-regulated in tumor tissue, in a few samples even to high extend.
The highest levels can be stated for two samples of colon ascending (both of them
stage T3) with 4.2 and 3.8 MNE, and a sample of colon descending (stage T3) with
an MNE of 4.8. In average, the tumor tissue shows an expression rate of 1.96
compared to 1.17 in normal tissue.
Figure 10b, showing the expression of OATP4C1, depicts the only case where the
transporter is mostly expressed in normal tissue, with the highest value of 3.95 MNE.
However, in 8 out of 20 samples the transporter can not be detected neither in
normal nor in tumor tissue.
In figure 10c high expression of the OATP4A1 is shown in almost every sample. The
MNE values exceed that of normal tissue. Most remarkable the expression rate
amounts to 9.85 in a sample from colon descending (stage T1). An average of 2.44
MNE can be seen in the tumor, compared with 0.46 MNE for normal tissue samples.
This difference in expression seems to make the OATP4A1 a suitable target for
colorectal cancer screening.
Figure 10d displays the expression of OATP5A1. This transporter shows its highest
expression in a colon descending sample (stage T3), by reaching a value of 5.0
MNE. In general, the transporter is slightly higher expressed in cancerous tissue than
in normal samples. However, as there does not exist much knowledge about this
specific transporter, further research is required to be able to valuate its relevance in
tumor therapy.
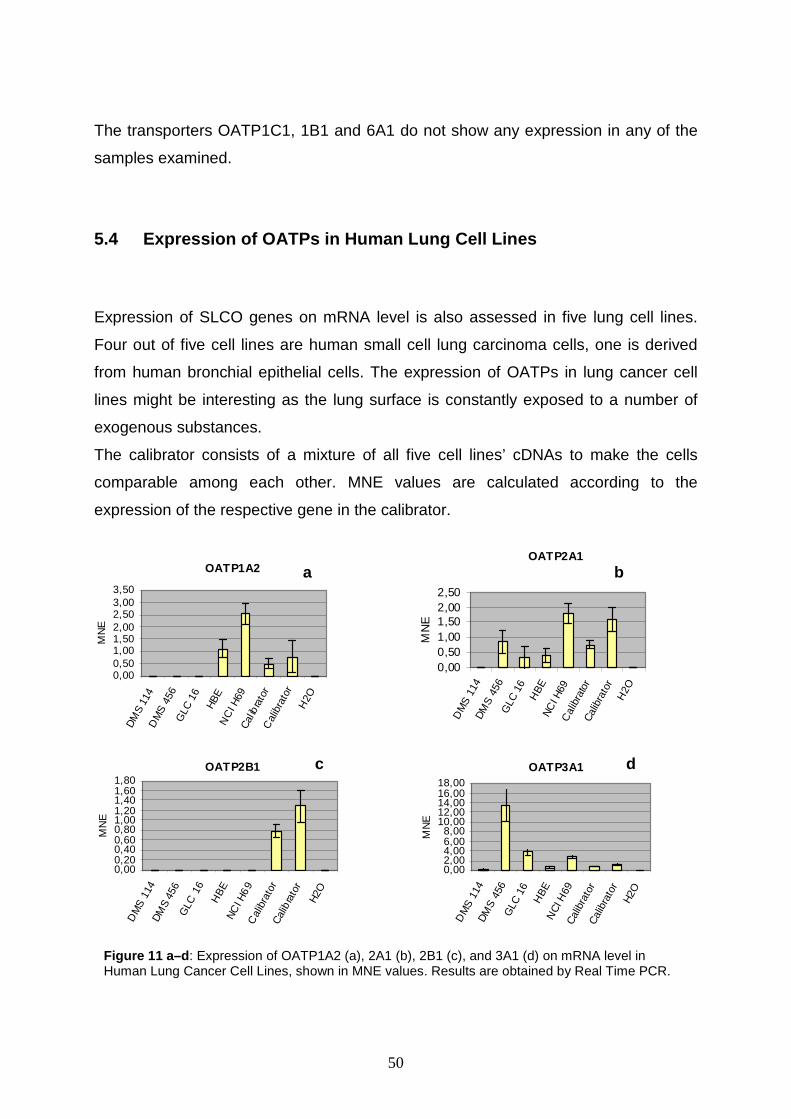
50
The transporters OATP1C1, 1B1 and 6A1 do not show any expression in any of the
samples examined.
5.4 Expression of OATPs in Human Lung Cell Lines
Expression of SLCO genes on mRNA level is also assessed in five lung cell lines.
Four out of five cell lines are human small cell lung carcinoma cells, one is derived
from human bronchial epithelial cells. The expression of OATPs in lung cancer cell
lines might be interesting as the lung surface is constantly exposed to a number of
exogenous substances.
The calibrator consists of a mixture of all five cell lines’ cDNAs to make the cells
comparable among each other. MNE values are calculated according to the
expression of the respective gene in the calibrator.
OATP1A2
0,000,501,001,502,002,503,003,50
DM
S 11
4D
MS
456
GLC
16
HBE
NC
I H69
Cal ib
rato
rC
alib
rato
rH
2O
MN
E
OATP2A1
0,000,501,001,502,002,50
DM
S 1
14DM
S 4
56G
LC 1
6H
BE
NCI H
69C
alib
rato
rCa
libra
tor
H2O
MN
E
OATP2B1
0,000,200,400,600,801,001,201,401,601,80
DM
S 1
14DM
S 4
56G
LC 1
6
HB
ENC
I H69
Cal
ibra
tor
Cal
ibra
tor
H2O
MN
E
OATP3A1
0,002,004,006,008,00
10,0012,0014,0016,0018,00
DM
S 1
14DM
S 4
56G
LC 1
6H
BE
NC
I H69
Cal
ibra
tor
Cal
ibra
tor
H2O
MN
E
Figure 11 a –d: Expression of OATP1A2 (a), 2A1 (b), 2B1 (c), and 3A1 (d) on mRNA level in Human Lung Cancer Cell Lines, shown in MNE values. Results are obtained by Real Time PCR.
a b
c d
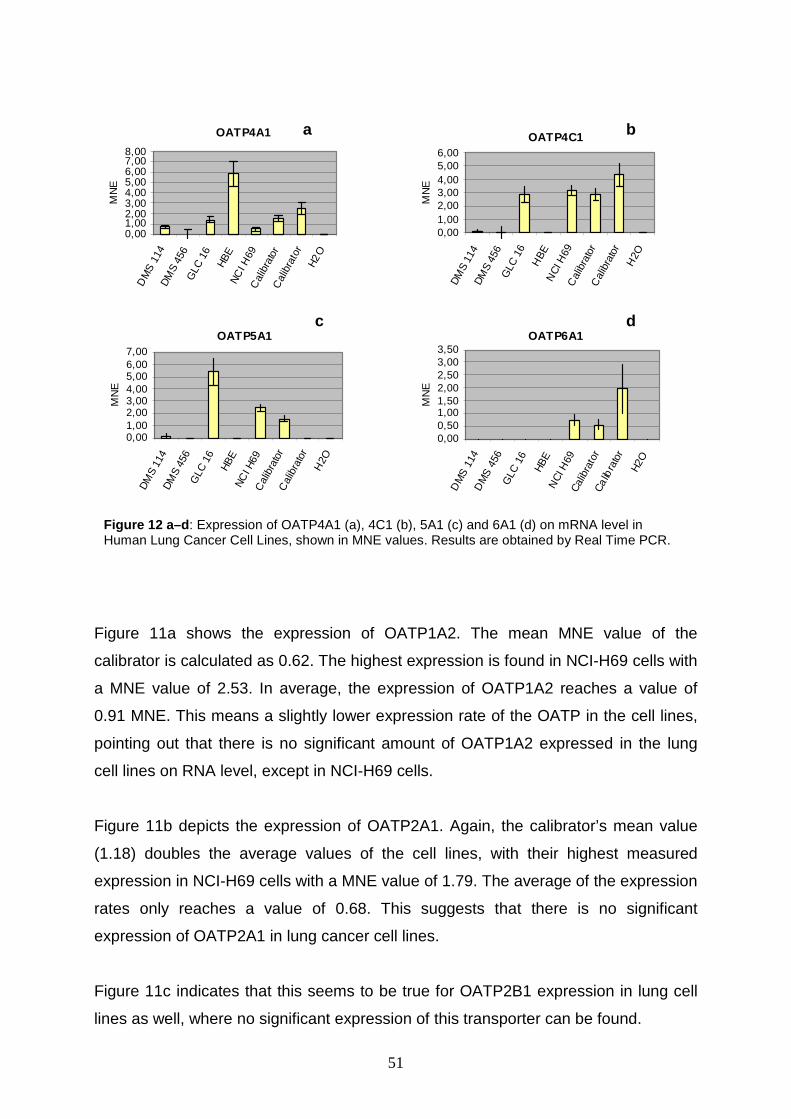
51
Figure 11a shows the expression of OATP1A2. The mean MNE value of the
calibrator is calculated as 0.62. The highest expression is found in NCI-H69 cells with
a MNE value of 2.53. In average, the expression of OATP1A2 reaches a value of
0.91 MNE. This means a slightly lower expression rate of the OATP in the cell lines,
pointing out that there is no significant amount of OATP1A2 expressed in the lung
cell lines on RNA level, except in NCI-H69 cells.
Figure 11b depicts the expression of OATP2A1. Again, the calibrator’s mean value
(1.18) doubles the average values of the cell lines, with their highest measured
expression in NCI-H69 cells with a MNE value of 1.79. The average of the expression
rates only reaches a value of 0.68. This suggests that there is no significant
expression of OATP2A1 in lung cancer cell lines.
Figure 11c indicates that this seems to be true for OATP2B1 expression in lung cell
lines as well, where no significant expression of this transporter can be found.
OATP4A1
0,001,002,003,004,005,006,007,008,00
DM
S 11
4D
MS
456
GLC
16
HBE
NCI H
69C
alib
rato
rC
alib
rato
rH2
O
MN
E
OATP4C1
0,001,002,003,004,005,006,00
DMS
114
DMS
456
GLC
16
HBE
NC
I H69
Cal
ibra
tor
Cal
ibra
tor
H2O
MN
E
OATP5A1
0,001,002,003,004,005,006,007,00
DM
S 11
4D
MS
456
GLC
16
HBE
NCI H
69C
alib
rato
rC
alib
rato
rH
2O
MN
E
OATP6A1
0,000,501,001,502,002,503,003,50
DM
S 1
14D
MS
456
GLC
16
HBE
NC
I H69
Calib
rato
rCa
libra
tor
H2O
MN
E
a b
d cc
Figure 12 a –d: Expression of OATP4A1 (a), 4C1 (b), 5A1 (c) and 6A1 (d) on mRNA level in Human Lung Cancer Cell Lines, shown in MNE values. Results are obtained by Real Time PCR.
52
Figure 11d, however, demonstrates high expression of OATP3A1, which reaches a
MNE value of 13.42 in DMS 456 cells. As the mean value of the calibrator equals
only 0.91 MNE the expression of the transporter shows a significant upregulation.
This is also reflected in the average value of the five cell lines (4.14), showing a 4.5
fold higher expression in the cell lines than in the calibrator. The GLC 16 cell line
(3.76) and the NCI H69 cell line (2.80) show the second highest expression rates.
Remarkably, the transporter is also expressed in healthy lung tissue.
Figure 12a shows the expression of OATP4A1. The calibrator, reaching a mean MNE
value of 1.98 is exceeded by the expression rate in HBE cells (5.80). The other cell
lines show expression as well; however, it is lower than the calibrator’s value and
therefore can not be counted as a significant expression on RNA level.
Figure 12b depicts the results from OATP4C1. It is remarkable that the calibrator
shows a very high MNE value of 3.60. Expression in the cell lines GLC 16 and NCI
H69 reaches values between 2.84 and 3.18.
Figure 12c shows that the highest expression rate of OATP5A1 is reached in GLC 16
cells (5.39). The further four cell lines show either no expression or low expression
levels of 0.05 MNE DMS 114 cells.
Verifying the obtained results, also by performing real time PCR on the basis of RNA
gained from patient samples, could help to better understand the function of
OATP5A1.
Figure 12d depicts the expression rates of OATP6A1. The average MNE value of the
calibrator (i.e. 1.26) exceeds that of NCI H69 cells (MNE 0.74). No expression can be
detected in the other four cell lines.
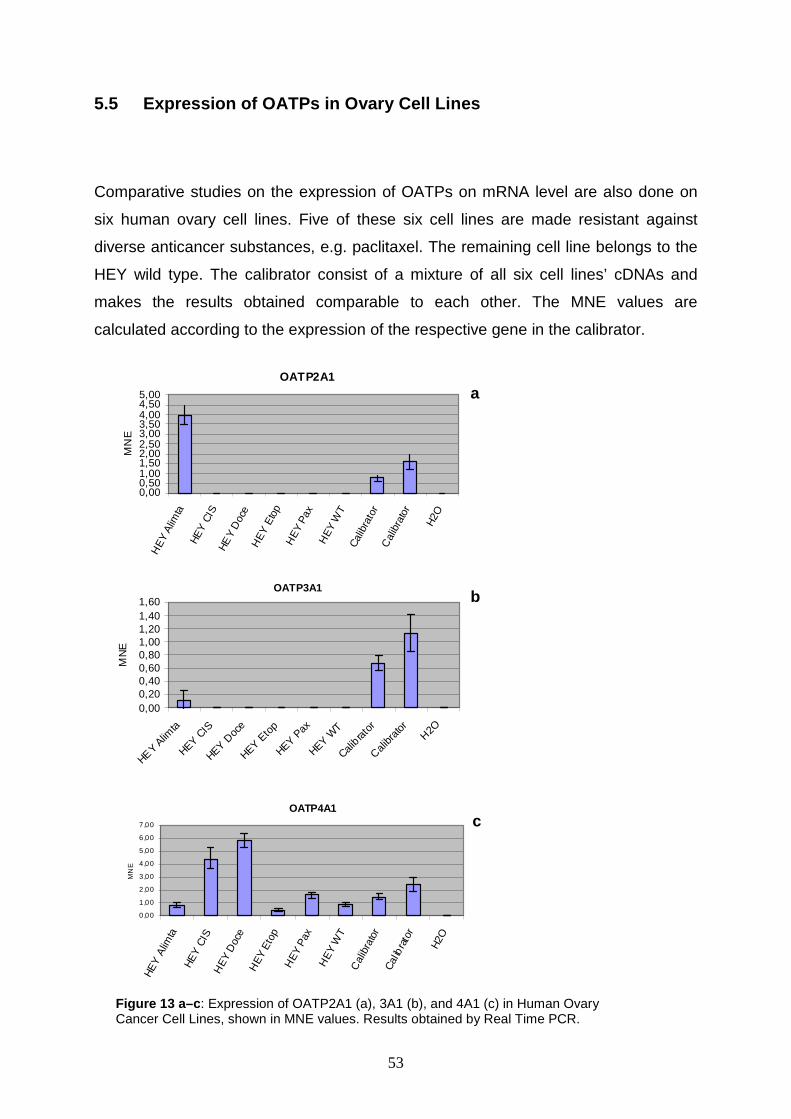
53
5.5 Expression of OATPs in Ovary Cell Lines
Comparative studies on the expression of OATPs on mRNA level are also done on
six human ovary cell lines. Five of these six cell lines are made resistant against
diverse anticancer substances, e.g. paclitaxel. The remaining cell line belongs to the
HEY wild type. The calibrator consist of a mixture of all six cell lines’ cDNAs and
makes the results obtained comparable to each other. The MNE values are
calculated according to the expression of the respective gene in the calibrator.
OATP4A1
0,00
1,00
2 ,00
3 ,00
4 ,00
5 ,00
6 ,00
7 ,00
HEY
Alim
ta
HEY
CIS
HEY
Doc
eH
EY E
top
HEY
Pax
HE
Y W
TC
alib
rato
rC
alib
rato
r
H2O
MN
E
OATP3A1
0,000,200,400,600,801,001,201,401,60
HEY Alim
ta
HEY CIS
HEY Doc
e
HEY Eto
p
HEY Pax
HEY WT
Calibrat
or
Calibr
ator
H2O
MN
E
Figure 13 a –c: Expression of OATP2A1 (a), 3A1 (b), and 4A1 (c) in Human Ovary Cancer Cell Lines, shown in MNE values. Results obtained by Real Time PCR.
OATP2A1
0,000,501,001,502,002,503,003,504,004,505,00
HE
Y Al
imta
HEY
CIS
HEY
Doc
eH
EY
Eto
pH
EY
Pax
HEY
WT
Calib
rato
rC
alib
rato
r
H2O
MN
E
a
b
c

54
Figure 13a, showing the expression of OATP2A1, points out an upregulation of the
transporter. The average MNE value of the calibrator of 1.18 is approximately twofold
higher than the expression in the HEY Alimta cell line (MNE 0.66). However, this cell
line is the only one to express this transporter, and a twofold upregulation does not
seem to be a significant marker for this cancerous tissue.
Figure 13b depicts the expression of OATP3A1. Given that the average MNE value
of the calibrator lies at 0.91, the MNE value of the SLCO gene 3A1 of 0.11 is about 8
times lower and can not be count as a significant expression at all. However, it is
remarkable that once again the HEY Alimta cell line is the only one to express the
gene, actually.
Figure 13c describes the expression of OATP4A1. As already stated when
investigating colon cancer cell lines, colorectal cancer patient samples, lung cancer
cell lines, this transporter is broadly expressed in every cell line being subject of the
analysis. The calibrator’s MNE value lies at 1.98, which is already exceeded almost
1.5 fold by the average MNE value of all ovary cell lines, that is to say 2.98. The
highest levels could be shown the HEY Doce cell line (5.84), closely followed by the
HEY Cis cell line (4.42). The other cell lines only show expression rates below the
value of 2.0. Hence, in these the transporter does not seem to be valuable for
diagnostic purpose.
Figure 14 : Expression of OATP 6A1 in Human Ovary Cancer Cell Lines, shown in MNE values. Results obtained by Real Time PCR.
OATP6A1
0,000,501,001,502,002,503,003,50
HEY
Alim
taH
EY C
ISH
EY D
oce
HEY
Eto
pH
EY P
axH
EY W
TC
alib
rato
rC
alib
rato
r
H2O
MN
E
55
The last figure, figure 14, depicts the expression of the OATP6A1. Contrarily to
OATP4A1, this transporter only showed expression in one single cell line, this is to
say HEY WT, with a MNE value of 1.24. As the calibrator’s value is 1.62, there is no
upregulation in the transporter’s expression rate.
The other transporters (OATP1A2, 1B1, 1B3, 1C1, 2B1, 4C1, and 5A1), do not show
any expression at the PCR conditions applied.
5.6 Discussion and Conclusion
The investigations on the expression of the SLCO genes superfamily included four
different sample types: human colorectal cancer samples derived from patients,
human colorectal cancer cell lines, human lung carcinoma cell lines, and human
ovary carcinoma cell lines.
In most of the samples, the expression rates, expressed in MNE (mean normalized
expression value), remain below the value of 2.0, which is set arbitrarily to divide the
expression rates in three groups and categorize the PCR results.
Group one, with MNE values ranging from 0.0 to 2.0 (first threshold), means no or
very low expression rates.
Group two, with MNE values from 2.0 to 4.0 (second threshold), indicates moderate
upregulation of the transporters’ expression rates. These MNE values are considered
to show a relevance of the transporter as tumor marker. Only a few samples, most of
them within the group of colorectal cancer patient samples, but non within the group
of normal tissue patient samples, exceed this second threshold.
Group three encompasses transporters with high MNE values (>4.0, third threshold),
and reflects significant upregulation of mRNA expression in a sample (see table14).
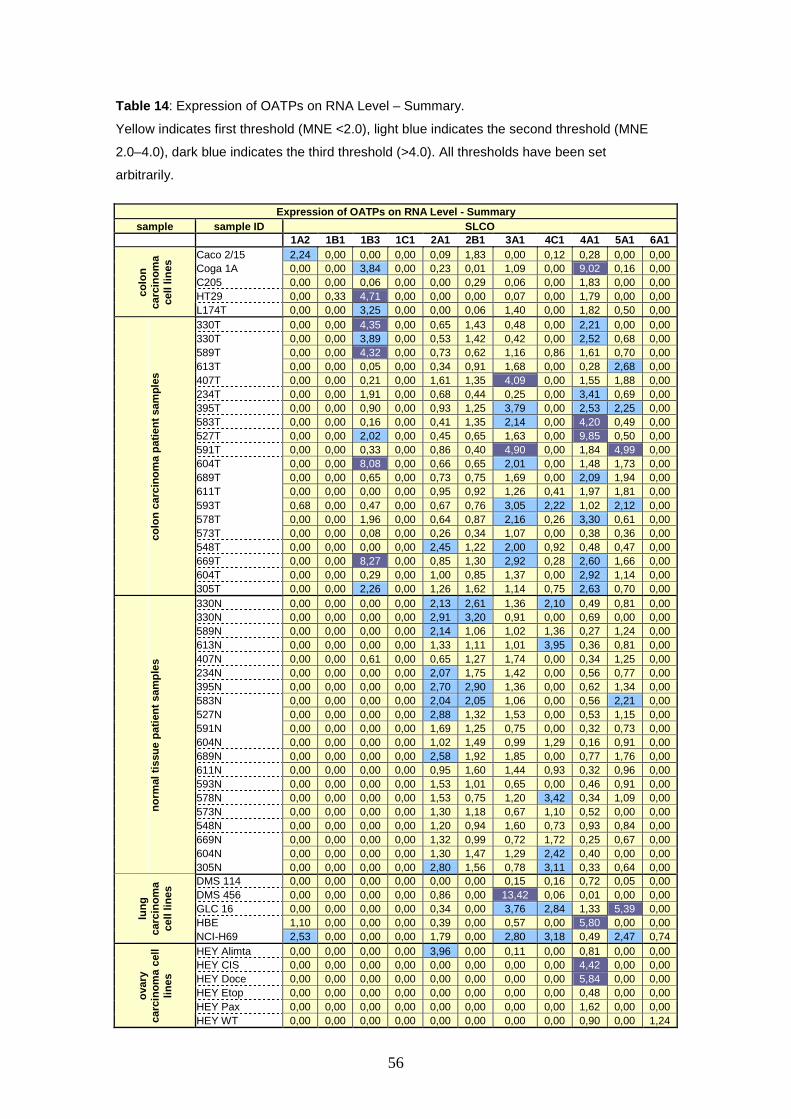
56
Expression of OATPs on RNA Level - Summary sample sample ID SLCO
1A2 1B1 1B3 1C1 2A1 2B1 3A1 4C1 4A1 5A1 6A1 Caco 2/15 2,24 0,00 0,00 0,00 0,09 1,83 0,00 0,12 0,28 0,00 0,00 Coga 1A 0,00 0,00 3,84 0,00 0,23 0,01 1,09 0,00 9,02 0,16 0,00 C205 0,00 0,00 0,06 0,00 0,00 0,29 0,06 0,00 1,83 0,00 0,00 HT29 0,00 0,33 4,71 0,00 0,00 0,00 0,07 0,00 1,79 0,00 0,00 co
lon
carc
inom
a ce
ll lin
es
L174T 0,00 0,00 3,25 0,00 0,00 0,06 1,40 0,00 1,82 0,50 0,00 330T 0,00 0,00 4,35 0,00 0,65 1,43 0,48 0,00 2,21 0,00 0,00 330T 0,00 0,00 3,89 0,00 0,53 1,42 0,42 0,00 2,52 0,68 0,00 589T 0,00 0,00 4,32 0,00 0,73 0,62 1,16 0,86 1,61 0,70 0,00 613T 0,00 0,00 0,05 0,00 0,34 0,91 1,68 0,00 0,28 2,68 0,00 407T 0,00 0,00 0,21 0,00 1,61 1,35 4,09 0,00 1,55 1,88 0,00 234T 0,00 0,00 1,91 0,00 0,68 0,44 0,25 0,00 3,41 0,69 0,00 395T 0,00 0,00 0,90 0,00 0,93 1,25 3,79 0,00 2,53 2,25 0,00 583T 0,00 0,00 0,16 0,00 0,41 1,35 2,14 0,00 4,20 0,49 0,00 527T 0,00 0,00 2,02 0,00 0,45 0,65 1,63 0,00 9,85 0,50 0,00 591T 0,00 0,00 0,33 0,00 0,86 0,40 4,90 0,00 1,84 4,99 0,00 604T 0,00 0,00 8,08 0,00 0,66 0,65 2,01 0,00 1,48 1,73 0,00 689T 0,00 0,00 0,65 0,00 0,73 0,75 1,69 0,00 2,09 1,94 0,00 611T 0,00 0,00 0,00 0,00 0,95 0,92 1,26 0,41 1,97 1,81 0,00 593T 0,68 0,00 0,47 0,00 0,67 0,76 3,05 2,22 1,02 2,12 0,00 578T 0,00 0,00 1,96 0,00 0,64 0,87 2,16 0,26 3,30 0,61 0,00 573T 0,00 0,00 0,08 0,00 0,26 0,34 1,07 0,00 0,38 0,36 0,00 548T 0,00 0,00 0,00 0,00 2,45 1,22 2,00 0,92 0,48 0,47 0,00 669T 0,00 0,00 8,27 0,00 0,85 1,30 2,92 0,28 2,60 1,66 0,00 604T 0,00 0,00 0,29 0,00 1,00 0,85 1,37 0,00 2,92 1,14 0,00
colo
n ca
rcin
oma
patie
nt s
ampl
es
305T 0,00 0,00 2,26 0,00 1,26 1,62 1,14 0,75 2,63 0,70 0,00 330N 0,00 0,00 0,00 0,00 2,13 2,61 1,36 2,10 0,49 0,81 0,00 330N 0,00 0,00 0,00 0,00 2,91 3,20 0,91 0,00 0,69 0,00 0,00 589N 0,00 0,00 0,00 0,00 2,14 1,06 1,02 1,36 0,27 1,24 0,00 613N 0,00 0,00 0,00 0,00 1,33 1,11 1,01 3,95 0,36 0,81 0,00 407N 0,00 0,00 0,61 0,00 0,65 1,27 1,74 0,00 0,34 1,25 0,00 234N 0,00 0,00 0,00 0,00 2,07 1,75 1,42 0,00 0,56 0,77 0,00 395N 0,00 0,00 0,00 0,00 2,70 2,90 1,36 0,00 0,62 1,34 0,00 583N 0,00 0,00 0,00 0,00 2,04 2,05 1,06 0,00 0,56 2,21 0,00 527N 0,00 0,00 0,00 0,00 2,88 1,32 1,53 0,00 0,53 1,15 0,00 591N 0,00 0,00 0,00 0,00 1,69 1,25 0,75 0,00 0,32 0,73 0,00 604N 0,00 0,00 0,00 0,00 1,02 1,49 0,99 1,29 0,16 0,91 0,00 689N 0,00 0,00 0,00 0,00 2,58 1,92 1,85 0,00 0,77 1,76 0,00 611N 0,00 0,00 0,00 0,00 0,95 1,60 1,44 0,93 0,32 0,96 0,00 593N 0,00 0,00 0,00 0,00 1,53 1,01 0,65 0,00 0,46 0,91 0,00 578N 0,00 0,00 0,00 0,00 1,53 0,75 1,20 3,42 0,34 1,09 0,00 573N 0,00 0,00 0,00 0,00 1,30 1,18 0,67 1,10 0,52 0,00 0,00 548N 0,00 0,00 0,00 0,00 1,20 0,94 1,60 0,73 0,93 0,84 0,00 669N 0,00 0,00 0,00 0,00 1,32 0,99 0,72 1,72 0,25 0,67 0,00 604N 0,00 0,00 0,00 0,00 1,30 1,47 1,29 2,42 0,40 0,00 0,00
norm
al ti
ssue
pat
ient
sam
ples
305N 0,00 0,00 0,00 0,00 2,80 1,56 0,78 3,11 0,33 0,64 0,00 DMS 114 0,00 0,00 0,00 0,00 0,00 0,00 0,15 0,16 0,72 0,05 0,00 DMS 456 0,00 0,00 0,00 0,00 0,86 0,00 13,42 0,06 0,01 0,00 0,00 GLC 16 0,00 0,00 0,00 0,00 0,34 0,00 3,76 2,84 1,33 5,39 0,00 HBE 1,10 0,00 0,00 0,00 0,39 0,00 0,57 0,00 5,80 0,00 0,00
lung
ca
rcin
oma
cell
lines
NCI-H69 2,53 0,00 0,00 0,00 1,79 0,00 2,80 3,18 0,49 2,47 0,74 HEY Alimta 0,00 0,00 0,00 0,00 3,96 0,00 0,11 0,00 0,81 0,00 0,00 HEY CIS 0,00 0,00 0,00 0,00 0,00 0,00 0,00 0,00 4,42 0,00 0,00 HEY Doce 0,00 0,00 0,00 0,00 0,00 0,00 0,00 0,00 5,84 0,00 0,00 HEY Etop 0,00 0,00 0,00 0,00 0,00 0,00 0,00 0,00 0,48 0,00 0,00 HEY Pax 0,00 0,00 0,00 0,00 0,00 0,00 0,00 0,00 1,62 0,00 0,00
ovar
y ca
rcin
oma
cell
lines
HEY WT 0,00 0,00 0,00 0,00 0,00 0,00 0,00 0,00 0,90 0,00 1,24
Table 14 : Expression of OATPs on RNA Level – Summary.
Yellow indicates first threshold (MNE <2.0), light blue indicates the second threshold (MNE
2.0–4.0), dark blue indicates the third threshold (>4.0). All thresholds have been set
arbitrarily.
57
In colorectal carcinoma cell lines, only three transporters show upregulation, i.e. 1A2
(Caco 2/15 cell line), 1B3 (Coga 1A, HT29 and L174T) and 4A1 (Coga 1A). The most
remarkable upregulation is demonstrated for the Coga 1A cell line, with an observed
MNE value of 9.02.
As the main aim of the present thesis is to investigate the expression of the OATP
superfamily in colorectal carcinoma samples, derived from patients suffering from
different stages of the carcinoma, the findings presented in this diploma thesis could
be of further value. The detection of significant upregulation could help to ameliorate
diagnosis in early stage and hence the patients’ prognosis. In case significant
upregulation of the transporter can be demonstrated, it might be used as a marker on
the one hand, and help to avoid drug-drug interactions, and drug resistance,
respectively.
In total six transporters are up-regulated in cancerous tissue, i.e. OATP1B3, 2A1,
3A1, 4C1, 4A1 and 5A1. Most remarkably, OATP1B3 has high expression rates in
four samples, with MNEs ranging from 4.32 up to 8.27.
The most conspicuous increase in the expression level can be demonstrated for
OATP4A1, reaching a MNE value of 9.85. In addition, this transporter shows
upregulation beyond the second threshold level of MNE 4.0 in thirteen out of twenty
samples. These results suggest that screening patients’ biopsy samples for
upregulation of the transporter could become important in the diagnosis of colorectal
carcinoma, particularly as upregulation is missing in the adjacent normal tissue.
Although the upregulation can be correlated neither with tumor stage, nor with the
tumor’s localisation within the colon, this could be due to the low number of samples.
For another transporter, namely OATP1B3 and OATP3A1, also no significant
expression on the mRNA level is seen in parts of the tissue.
In any case, the results from the screening in the limited number of samples need to
be verified by screening of a larger collection of samples. In addition, the
transporters’ expression will have to be demonstrated on protein level, too, to make
the results valid for raising future perspectives. Nevertheless these initial
investigations suggest that the OATP superfamily may be further examined as future
tumor markers.
58
In comparative studies, real time PCR analysis of OATPs is also done in lung and
ovary carcinoma cell lines. As these two types of cancer belong to the most frequent
causes of death worldwide, new screening methods and ways to diagnose the
malignancy in early stages will definitely help to ameliorate the patients’ prognosis,
which currently is quite poor in both cases.
Concerning lung carcinoma cell lines, OATP3A1 provided the most astonishing
result. It showed an expression rate of MNE 13.42 in DMS 456 cells, what denotes a
14.7 fold upregulation compared to the calibrator. Additionally, OATP4A1, 5A1, 4C1
and 1A2 showed higher expression rates. However, to verify these first findings a
screening of lung carcinoma samples Is needed in the future.
In comparison with the lung carcinoma cell lines, the results for OATP expression in
ovarian cancer cell lines appear moderate. Only two transporters are up-regulated,
namely OATP2A1 and 4A1. While the expression rate of OATP2A1 exceeded the
first threshold simply in the HEY Alimta cell line, OATP4A1 showed MNE values
beyond the second threshold (MNE 4.42 in HEY CIS, MNE 5.84 in HEY Doce).
Taken together, mRNA the expression rates for OATPs demonstrated by real time
PCR do not show broad upregulation of the transporters in cancerous tissue of the
colon. However, these results might build the basis of more selective diagnostic
methods. Concerning colorectal cancer therapy could be ameliorated by using the
OATP superfamily as a marker, helping to avoid surgical intervention due to late
diagnosis on the one hand, and enhancing the efficacy of chemotherapy by avoiding
inefficient drug application due to resistance on the other hand.
59
6 SUMMARY
Although colorectal cancer is one of the most frequent malign diseases worldwide,
with the highest incidence in civilized Western countries, the prognosis of advanced
metastazing colon cancer is still poor. After surgical resection of the cancerous
tissue, application of anticancer chemotherapy is hampered by the development of
drug resistance. Often drug resistance is due to the over or under expression of
membrane transport proteins for cytostatic agents in the tumor cells. It is well
established that over expression of ABC-efflux transporters causes drug resistance
by mediating the rapid efflux of drugs from the cells. However, very little is known
whether uptake transporters from the SLCO family might compensate increased
efflux by an efficient uptake. Therefore expression of SLCO transporters is
investigated in colon cancer cell lines and comparative studies are done in lung and
ovary carcinoma cell lines.
From the 11 known human SLCO (solute carrier organic anion transporter
family) genes only three transporters show upregulation in colorectal carcinoma cell
lines i.e. 1A2 in the Caco 2/15, 1B3 in the Coga 1A, HT29 and L174T and 4A1 in the
Coga 1A cell line. The most remarkable upregulation is demonstrated for the Coga
1A cell line, with an approximately 10-fold upregulation of OATP4A1. Remarkably,
this transporter shows upregulation in thirteen out of twenty samples derived from
human colon tumors, while its expression in the adjacent normal tissue is near the
detection limit. Although, due to the low number of samples (n = 20), upregulation in
colon tumors was not associated with tumor stage or localisation within the colon,
these findings warrant further studies on OATP4A1 expression in colon cancer.
OATP4A1 is also high in the ovarian carcinoma cell line HEY made resistant to
cisplatin and doxorubicin, respectively. This further suggests that this transporter
might be associated with resistance to anticancer drugs in solid tumors as well. Also
in the lung carcinoma cell line HBE OATP4A1 is increased, while three other lung
carcinoma cell lines over express OATP3A1 up to 14-fold (DMS456). Remarkably,
also the “kidney” specific” transporter OATP4C1 is over expressed in lung cancer cell
lines indicating the normal organ border of OATP expression is overcome during
tumorigenesis. Another transporter, namely OATP5A1, for which organ localization
and substrates are not established yet, is found to be over expressed in lung cancer
60
cell lines as well as in colon tumor specimens. On the other hand, OATP2A1, the
high affinity transporter for prostaglandins, is greatly down-regulated in normal colon
tissues as compared to colon tumors, but it is also upregulated in the HEY cell line
resistant to Alimta. These transporters regulate the levels of prostaglandins, like
PGE2, as inflammatory mediators in the interstitiel space. OATP2A1 down-regulation
could contribute to tissue inflammation driving tumor progression.
In addition to the main objective of the present thesis on the expression of OATP
transport proteins another task was to establish the spheroid model for drug
screening. Spheroids were grown from established tumor cell lines and CD133
(prominin) was used to screen for potential cancer stem cells in these cell cultures.
These speroid cultures resemble the physiological parameters better than tumor cells
grown in a monolayer culture, and they could provide a future model for studies on
tumor therapy.
In conclusion, the results of this thesis show the expression patterns of OATP
transporters in human colon tumors and tumor cell lines from solid tumors, and
provide the base for further functional studies on the role of OATPs in the therapy of
human cancers. They may be integrated in the efforts made to reduce drug-drug,
drug-food interactions and minimize drug side effects due to interactions with the
transporter family.
61
7 LIST OF TABLES
Table 1 Substrates of the OATP Superfamily ....................................................10
Table 2 Distribution of OATPs in Cancer Tissue and Cancer Cell Lines............15
Table 3 Preparation of Freezing Medium ..........................................................22
Table 4 Preparation of Master Mix for Mycoplasma PCR ..................................24
Table 5 Preparation of Master Mix for Mycoplasma PCR II ...............................24
Table 6 PCR cycling parameters.......................................................................25
Table 7 Preparation of Agarose Gel ..................................................................25
Table 8 Preparation of Lysis Buffer ...................................................................27
Table 9 Calculations for Lysis Buffer Preparation..............................................27
Table 10 Bradford Protein Assay – Results.........................................................29
Table 11 Composition of Master Mix for RT-PCR................................................38
Table 12 Real Time PCR – Thermal Cycler Settings...........................................38
Table 13 A Short Characterization of Carcinoma Cell Lines ................................40
Table 14 Expression of OATPs on RNA Level – Summary .................................56
62
8 LIST OF FIGURES
Figure 1 A three-dimensional model of hOAT1...................................................7
Figure 2 Phyllogenetic classification and new nomencalture of human and
rodent members of the OATP/SLCO superfamily .................................8
Figure 3 The effect of a functional change in transporting activity on
pharmacological and toxicological actions of drugs ..............................16
Figure 4 Phases of PCR amplification ................................................................32
Figure 5 a, b Simplification of analysis by changing from linear to log scale ..............33
Figure 6 How TaqMan® and SYBR® Green I Dye Assay work ..........................37
Figure 7 a–h Expression of OATP1A2 (a) ,1B3 (b), 1B1 (c), 2A1 (d),
2B1 (e), 3A1 (f) 4A1 (g), and 4C1 (h) on mRNA level
in Colon Cancer Cell Lines ...................................................................42
Figure 8 Expression of OATP5A1 (i) on mRNA level in Colon
Cancer Cell Lines .................................................................................43
Figure 9 a–d Expression of OATP1A2 (a), 2A1 (b), 1B3 (c), and 2B1 (d)
in Colorectal Cancer Samples ..............................................................46
Figure 10 a–d Expression of OATP3A1 (a), 4C1 (b), 4A1 (c), and 5A1 (d)
in Colorectal Cancer Samples ..............................................................47
Figure 11 a–d Expression of OATP1A2 (a), 2A1 (b), 2B1 (c), and 3A1 (d)
in Human Lung Cancer Cell Lines ........................................................50
Figure 12 a–d Expression of OATP4A1 (a), 4C1 (b), 5A1 (c) and 6A1 (d)
in Human Lung Cancer Cell Lines ........................................................51
Figure 13 a–c Expression of OATP2A1 (a), 3A1 (b), 4A1 (c)
in Human Ovary Cancer Cell Lines.......................................................53
Figure 14 Expression of OATP6A1 in Human Ovary Cancer Cell Lines ...............54
63
9 REFERENCES
Abe T, Kakyo M, Tokui T, Nakagomi R, Nishio T, Nakai D, Nomura H, Unno M,
Suzuki M, Naitoh T, Matsuno S, Yawo H (1999) Identification of a novel gene family
encoding human liver-specific organic anion transporter LST-1. J Biol Chem
274:17159-17163
Abe T, Unno M, Onogawa T, Tokui T, Kondo TN, Nakagomi R, Adachi H, Fujiwara K,
Okabe M, Suzuki T, Nunoki K, Sato E, Kakyo M, Nishio T, Sugita J, Asano N,
Tanemoto M, Seki Shimosegawa T, Iinuma, Nagura H, Ito S, Matsuno S (2001) LST-
2, a human liver-specific organic anion transporter, determines methotrexate
sensitivity in gastrointestinal cancers. Gastroenterology 120:1689-1699
Adachi H, Suzuki T, Abe M, Asano N, Mizutamari H, Tanemoto M, Nishio T,
Onogawa T, Toyohara T, Kasai S, Satoh F, Suzuki M, Tokui T, Unno M,
Shimosegawa T, Matsuno S, Ito S, Abe T (2003) Molecular characterization of
human and rat organic anion transporter OATP-D. Am J Physiol Renal Physiol. 2003;
285:F1188-97
Applied Biosystems Inc., www3.appliedbiosystems.com (2009) Foster City, CA,
USA. User Bulletin #2: Relative Quantitation of Gene Expression (PN 4303859)
Ballestero MR, Monte MJ, Briz O, Jiménez F, Gonzalez-San Martin F, Marin JJG
(2006) Expression of transporters potentially involved in the targeting of cytostatic
bile acid derivatives to colon cancer and polyps. Biochemical Pharmacology 72:729–
738
Bartlett JM, Stirling D (2003) A Short History of the Polymerase Chain Reaction.
Methods Mol Biol. 226:3-6
Berendsen HH, de Leij L, de Vries EG, Mesander G, Mulder NH, de Jong B, Buys
CH, Postmus PE, Poppema S, Sluiter HJ, et al. (1988) Characterization of three
64
small cell lung cancer cell lines established from one patient during longitudinal
follow-up. Cancer Res.; 48:6891-9
Brown KA, Bouchard N, Lussier JG, Sirois J (2007) Down-regulation of messenger
ribonucleic acid encoding an importer of sulfoconjugated steroids during human
chorionic gonadotropin-induced follicular luteinization in vivo. J Steroid Biochem Mol
Biol.; 103:10-9.
Brozek W, Bises G, Fabjani G, Cross HS, Peterlik M (2008) Clone-specific
expression, transcriptional regulation, and action of interleukin-6 in human colon
carcinoma cells. BMC Cancer.; 8:13
CELLutions Biosystems Inc., www.cellutionsbiosystems.com (2009), Cedarlane®
Laboratories Limited, Canada
CLS – Cell Lines Service, www.cell-lines-service.de (2009), Eppelheim, Germany
Compton SJ, Jones CG (1985) Mechanisms of dye response and interference in the
Bradford protein assay. Anal Biochem 151:369-374
Eckert WA, Kartenbeck J (1997). Proteine: Standardmethoden der Molekular- und
Zellbiologie: Präparation, Gelelektrophorese, Membrantransfer und Immundetektion,
1.10 Quantitative Bestimmung von Proteinen, Springer-Verlag GmBH, Berlin, pp. 62-
66
Fattinger K, Cattori V, Hagenbuch B, Meier PJ, Stieger B (2000) Rifamycin SV and
rifampicin exhibit differential inhibition of the hepatic rat organic anion transporting
polypeptides, Oatp1 and Oatp2. Hepatology 32:82-86
Fujiwara K, Adachi H, Nishio T, Unno M, Tokui T, Okabe M, Onogawa T, Suzuki T,
Asano N, Tanemoto M, Seki M, Shiiba K, Suzuki M, Kondo Y, Nunoki K,
Shimosegawa T, Iinuma K, Ito S, Matsuno S, Abe T. (2001) Identification of thyroid
hormone transporters in humans: different molecules are involved in a tissue-specific
manner. Endocrinology.; 142:2005-12
65
Gao B, Hagenbuch B, Kullak-Ublick GA, Benke D, Aguzzi A, Meier PJ (2000).
Organic anion-transporting polypeptides mediate transport of opioid peptides across
blood-brain barrier. J Pharmacol Exp Ther.; 294:73-9
Gao B, Huber RD, Wenzel A, Vavricka SR, Ismair MG, Remé C, Meier PJ (2005)
Localization of organic anion transporting polypeptides in the rat and human ciliary
body epithelium. Exp Eye Res.; 80:61-72
Geyer J, Döring B, Failing K, Petzinger E (2004). Molecular cloning and functional
characterization of the bovine (Bos Taurus) organic anion transporting polypeptide
Oatp1a2 (Slco1a2). Comp Biochem Physiol B Biochem Mol Biol.; 137:317-29.
Glaeser H, Bailey DG, Dresser GK, Gregor JC, Schwarz UI, McGrath JS, Jolicoeur
E, Lee W, Leake BF, Tirona RG, Kim RB (2007). Intestinal drug transporter
expression and the impact of grapefruit juice in humans. Clin Pharmacol Ther.;
81:362-70
Grube M, Köck K, Karner S, Reuther S, Ritter CA, Jedlitschky G, Kroemer HK
(2006). Modification of OATP2B1-mediated transport by steroid hormones. Mol
Pharmacol.; 70:1735-41.
Hagenbuch B, Meier PJ (2003) The superfamily of organic anion transporting
polypeptides. Biochem Biophys Acta 1609:1-18
Hagenbuch B, Meier PJ (2004) Organic anion transporting polypeptides of the
OATP/ SLC21 family: phylogenetic classification as OATP/ SLCO superfamily, new
nomenclature and molecular/functional properties. Pflugers Arch.; 447:653-65.
Hagenbuch B (2007). Cellular entry of thyroid hormones by organic anion
transporting polypeptides. Best Pract Res Clin Endocrinol Metab.; 21:209-21.
Review.
66
Hänggi E, Grundschober AF, Leuthold S, Meier PJ, St-Pierre MV (2006). Functional
analysis of the extracellular cysteine residues in the human organic anion
transporting polypeptide, OATP2B1. Molecular Pharmacology 70:806-817
Hsiang B, Zhu Y, Wang Z, Wu Y, Sasseville V, Yang W-P, Kirchgessner TG (1999).
A novel human hepatic organic anion transporting polypeptide (OATP2). J Biol Chem
274:37161-37168
Huber RD, Gao B, Sidler Pfändler MA, Zhang-Fu W, Leuthold S, Hagenbuch B,
Folkers G, Meier PJ, Stieger B. (2007) Characterization of two splice variants of
human organic anion transporting polypeptide 3A1 isolated from human brain. Am J
Physiol Cell Physiol.; 292:C795-806
Ismair MG, Stieger B, Cattori V, Hagenbuch B, Fried M, Meier PJ, Kullak-Ublick GA
(2001) Hepatic uptake of cholecystokinin octapeptide by organic anion-transporting
polypeptides OATP4 and OATP8 of tat and human liver. Gastroenterology 121:1185-
1190
Jacquemin E, Hagenbuch B, Stieger B, Wolkoff AW, Meier PJ (1994) Expression
cloning of a rat liver Na+-independent organic anion transporter. Proc natl Acad Sci
USA 91:133-137
Jung D, Hagenbuch B, Gresh L, Pontoglio M, Meier PJ, Kullak-Blick GA (2001)
Characterization of the human OATP-C (SLC21A6) gene promoter and regulatoin of
liver-specific OATP genes by hepatocyte nuclear factor 1 alpha. J Biol Chem
276:37206-37214
Jung D, Podvinec M, Meyer UA, Mangelsdorf DJ, Fried M, Meier PJ, Kullak-Ublick
GA (2002) Human organic anion transporting polypeptide OATP8 (SLC21A8)
promoter is transactivated by the farnesoid X receptor/bile acid receptor.
Gastroenterology 122:1954-1966
67
Kazuya M, Yuichi S (2008) Impact of Genetic Polymorphisms of Thransporters on
the Pharmacokinetic, Pharmacodynamic and Toxicological Properties of Anionic
Drugs. Dug Metab. Pharmacokinet. 23: 223-235
Kinzler KW, Vogelstein B (2003) Lessons from hereditary colorectal cancer. Cell
87:919
König J, Cui Y, Nies AT, Keppler D (2000a) Lovalization and genomic organization
of a new haptocellular organic anion transporting polypeptide. J Biol Chem
275:23161-23168
König J, Cui Y, Nies AT, Keppler D (2000b) A novel human organic anion
transporting polypeptide localized to the basolateral hepatocyte membrane. Am J
Physiol 278:G156-G164
Kullak-Ublick GA, Hagenbuch B, Stieger B, Schteingart CD, Hofmann AF, Wolkoff
AW, Meier PJ (1995) Molecular and functional characterization of an organic anion
transporting polypeptide cloned from human liver. Gastroenterology 109:1274-1282
Kullak-Ublick GA, Ismair MG, Stieger B, Landmann L, Huber R, Pizzagalli F,
Fattinger K, Meier PJ, Hagenbuch B (2001) Organic anion-transporting polypeptide B
(OATP-B) and ist functional comparison with three other OATPs from liver.
Gastroenterology 120:525-533
Lee W, Glaeser H, Smith LH, Roberts RL, Moeckel GW, Gervasini G, Leake BF, Kim
RB (2005). Polymorphisms in human organic anion-transporting polypeptide 1A2
(OATP1A2): implications for altered drug disposition and central nervous system drug
entry. J Biol Chem.; 280:9610-7.
Li L, Meier PJ, Ballatori N (2000) Oatp2 mediates bidirectional organic solute
transport: a role for intracellular glutathione. Mol Pharmacol 58:335-340
68
Li LQ, Lee TK, Meier PJ, Ballatori N (1998) Identification of glutathione as a driving
force and leukotriene C-4 as a substrate for oatp2, the hepatic sinusoidal organic
solute transporter. J Biol Chem 273:16184-16181
Meier PJ, Stieger B (2002) Bile salt transporters. Annu Rev Physiol 64:635-661
Mikkaichi T, Suzuki T, Tanemoto M, Ito S, Abe T (2004). The organic anion
transporter (OATP) family. Drug Metab Pharmacokinet.; 19:171-9. Review.
Muller PY, Janovjak H, Miserez AR, Dobbie Z (2002). Processing of gene expression
data generated by quantitative real-time RT-PCR. Biotechniques., 32:1372-4, 1376,
1378-9.
Nakao N, Takagi T, Iigo M, Tsukamoto T, Yasuo S, Masuda T, Yanagisawa T,
Ebihara S, Yoshimura T (2006). Possible involvement of organic anion transporting
polypeptide 1c1 in the photoperiodic response of gonads in birds. Endocrinology.;
147:1067-73.
Noé B, Hagenbuch B, Stieger B, Meier PJ (1997) Isolation of a multispecific organic
anion and cardiac glycoside transporter from rat brain. Proc Natl Acad Sci USA
94:10346-10350
Nozawa T, Nakajima M, Tamai I, Noda K, Nezu J, Sai Y, Tsuji A, Yokoi T (2002)
Genetic polymorphisms of human organic anion transporters OATP-C (SLC21A6)
and OATP-B (SLC21A9): allele frequencies in the Japanese population and
functional analysis. J Pharmacol Exp Ther 302:804-813
Oswald M, Kullak-Ublick GA, Paumgartner G, Beuers U (2001) Expression of
hepatic transporters OATP-C and MRP2 in primary sclerosing cholangitis. Liver
21:247-253
Pizzagalli F, Hagenbuch B, Stieger B, Klenk U, Folkers G, Meier PJ. (2002)
Identification of a novel human organic anion transporting polypeptide as a high
affinity thyroxine transporter .Mol Endocrinol.; 16:2283-96.
69
Read SM, Northcote DH (1981) Minimization of variation in the response of different
proteins to the Coomassie Blue G dye-binding assay for protein. Anal Biochem
116:53-64
Ryan KJ, Ray CG (editors) (2004). Sherris Medical Microbiology (4th edition).
McGraw Hill. pp. 409–12
Satlin LM, Amin V, Wolkoff AW (1997) Organic anion transporting polypeptide
mediates organic anion/HCO3- exchange. J Biol Chem 272:26340-26345
Schuster VL (2002) Prostaglandin Transport. Prostaglandins Other Lipid Mediat.
2002; 68-69:633-47
Shi XY, Bai S, Ford AC, Burk RD, Jacquemin E, Hagenbuch B, Meier PJ, Wolkoff
AW (1995) Stable inducible expression of a functional rat liver organic anion transport
protein in HeLa cells. J Biol Chem 270:25591-25595
Smith NF, Figg WD, Sparreboom A (2005) Role of the liver-specific transporters
OATP1B1 and OATP1B3 in governing drug elimination. Expert Opin Drug Metab
Toxicol.;1:429-45
Spector T (1978) Refinement of the Coomassie blue method of protein quantitation.
A simple and linear spectrophotometric assay for less than or equal to 0.5 to 50
microgram of protein. Anal Biochem 86:142-146
St-Pierre MV, Hagenbuch B, Ugele B, Meier PJ, Stallmach T (2002) Characterization
of an organic anion-transporting polypeptide (OATP-B) in human placenta. J Clin
Endocrinol Metab.; 87:1856-63
Tamai I, Nezu J, Uchino H, Sai Y, Oku A, Shimane M, Tsuji A (2000) Molecular
identification and characterization of novel members of the human organic anion
transporter (OATP) family. Biochem Biophys Res Commun 273:251-260
70
Tirona RG, Leake BF, Merino G, Kim RB (2001) Polymorphisms in OATP-C:
identification of multiple allelic variants associated with altered transport activity
among European- and African-Americans. J Biol Chem 276:35669-35675
Vavricka SR, van Montfoort J, Ha HR, Meier PJ, Fattinger K (2002) Interactions of
rifamycin SV and rifampicin with organic anion uptake systems of human liver.
Hepatology 36:164-172
Walters HC, Craddock AL, Fusegawa H, Willingham MC, Dawson PA (2000)
Expression, transport properties, and chromosomal location of organic anion
transporter subtype 3. Am J Physiol 297:G1188-G1200

71
CURRICULUM VITAE
PERSONAL DETAILS
Name, Surname Angela Johanna Schöffmann
Date of Birth January 3rd, 1985
Place of Birth Klagenfurt
Nationality Austria
FORMATION
1991 – 1995 Primary School, St. Andrä/Villach
1995 – 2000 Bundesgymnasium/Bundesrealgymnasium
BG/BRG St. Martin, Villach
2000 – 2001 Tourismusschule Bad Hofgastein, Bad
Hofgastein
2001 – 2004 Bundesgymnasium/Bundesrealgymnasium
BG/BRG St. Martin, Villach
June 24th, 2004 Graduation with honors
Oct. 2004 – Sept. 2009 Studies of Pharmacy, University of Vienna
PROFESSIONAL EXPERIENCES
February 2005 Pharmacy “Mag. pharm. Beate Koder GmbH”,
Klagenfurt
July – August 2006 Dispensary LKH Villach
July – August 2007 Pfizer Corp. Austria, Marketing, Human
Resources
Sept. 2008 – Feb. 2009 Pfizer Corp. Austria, Finance Department
March – July 2009 Diploma Thesis, Department of Clinical
Pharmacy and Diagnostics, University of
Vienna, in cooperation with the Institute of
Pathophysiology, Medical University of Vienna,
AKH Wien