Embed Size (px)
Citation preview
June 1, 2002Copenhagen, Denmark
In Conjunction withEuropean Conference on Computer Vision (ECCV’02)
In Cooperation withIEEE Computer Society and IEEE PAMI-TC
Proceedings
Third IEEE International Workshop onPerformance Evaluation ofTracking and Surveillance (PETS’2002)

PETS’2002
Supported by
PETS’2002 is supported by the IEEE Computer Society, the European Union underFGNet (Face and Gesture Recognition Working Group) IST-2000-26434,
British Machine Vision Association, BlueArc, Intel and The University of Reading, UK.
BMVA
Proceedings
Third IEEE International Workshop onPerformance Evaluation ofTracking and Surveillance
(PETS’2002)
June 1, 2002Copenhagen, Denmark
In conjunction withEuropean Conference on Computer Vision (ECCV’02)
In cooperation with IEEE Computer Society and IEEE PAMI-TC

Edited by
James M. FerrymanComputational Vision GroupDepartment of Computer ScienceThe University of ReadingWhiteknightsReading RG6 6AYUK
Apart from any fair dealing for the purposes of research or private study, or criticism or review,as permitted under the Copyright, Designs and Patents Act 1988, this publication may only bereproduced, stored or transmitted, in any form or by any means, with the prior permission inwriting of the publishers, or in the case of reprographic reproduction in accordance with theterms of licenses issued by the Copyright Licensing Agency. Enquiries concerning reproductionoutside those terms should be sent to the authors of the papers.
© James M. Ferryman and IEEE. All Rights Reserved.
The use of registered names, trademarks, etc. in this publication does not imply, even in theabsence of a specific statement, that such names are exempt from the relevant laws andregulations and therefore free for general use.
The publisher makes no representation, express or implied, with regard to accuracy of theinformation in these proceedings and cannot accept any legal responsibility for any error oromissions that may be made.
PETS’2002Proceedings of the Third IEEE International Workshop on Performance Evaluation of Trackingand SurveillanceJune 1, 2002Copenhagen, Denmark
First Edition
ISBN 0-7695-1698-X
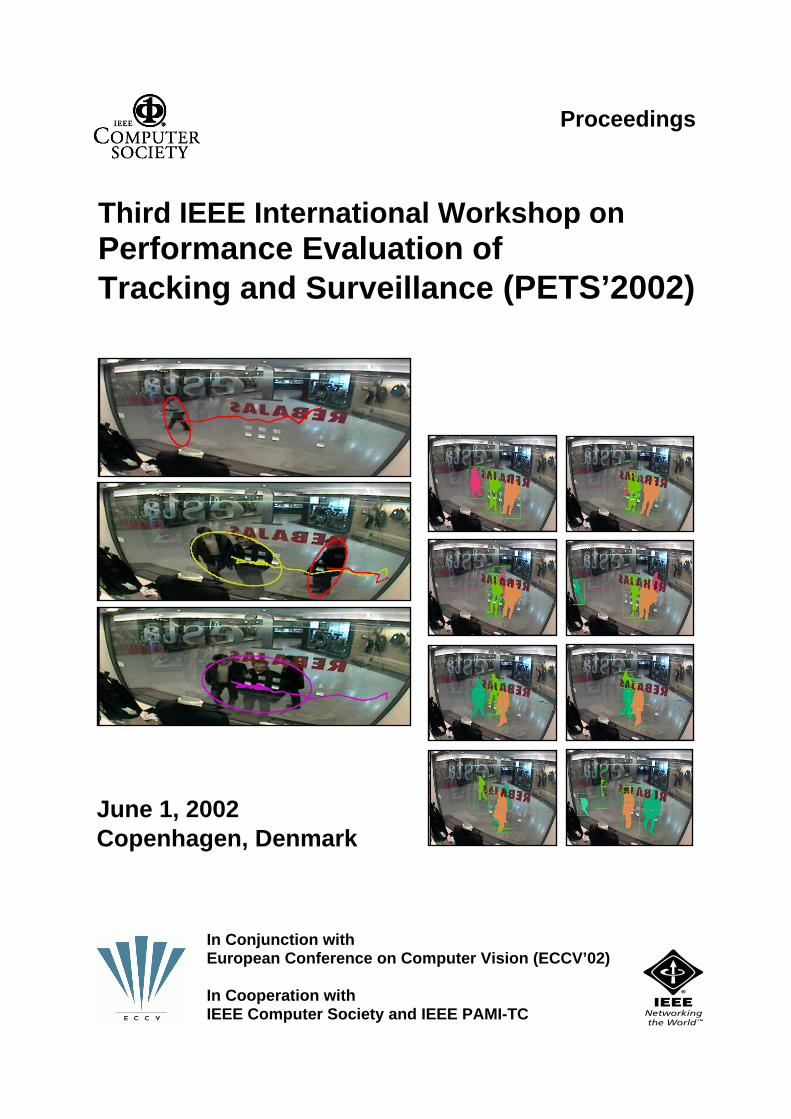
Cover design depicts images taken from contributions within the proceedings.
Compiled in England at The University of Reading, UK.Printed and bound at INRIA Rhône-Alpes, Grenoble, France.

Table of ContentsThird IEEE International Workshop on PETS
Foreword _________________________________________________________ v
Workshop Organisers _____________________________________________ vi
Programme Committee ____________________________________________ vi
Event-based Activity Analysis in Live Video using a Generic Object Tracker ____ 1J. H. Piater, S. Richetto and J. L. Crowley,
Laboratoire GAVIR-IMAG, INRIA Rhône-Alpes, France
From Cluster Tracking to People Counting _______________________________ 9A. E. C. Pece,
Institute of Computer Science, The University of Copenhagen, Denmark
Detecting Moving Objects and their Shadows:An Evaluation with the PETS2002 Dataset ______________________________ 18
R. Cucchiara, C. Grana and A. Prati,Department of Information Engineering,University of Modena and Reggio Emilia, Italy
Performance Metrics and Methods for Tracking in Surveillance ______________ 26T. Ellis,
Information Engineering Centre, School of Engineering,City University, London, UK
An Open Development Environment for Evaluation ofVideo Surveillance Systems_________ _________________________________ 32
C. Jaynes, S. Webb, R. M. Steele and Q. Xiong,Metaverse Laboratory, Department of Computer, University of Kentucky, USA
Auto Calibration in Multiple-Camera Surveillance Environment _____________ 40G. A. Jones, J. Renno and P. Remagnino,
Digital Imaging Research Centre, Kingston University, London, UK
Tracking People with Probabilistic Appearance Models ____________________ 48A. Senior,
IBM T.J. Watson Research Center, NY, USA
Tracking and Counting Multiple Interacting People in Indoor Scenes__________ 56L. Marcenaro, L. Marchesotti and C. S. Regazzoni,
DIBE, University of Genoa, Italy
iv

Foreword
Welcome to the proceedings of the Third IEEE International Workshop on PerformanceEvaluation of Tracking and Surveillance (PETS’2002), held on June 1, 2002 in Copenhagen,Denmark. This workshop is being held in conjunction with the European Conference onComputer Vision (ECCV’02).
The workshop continues the theme of the highly successful PETS’2000 and PETS’2001workshops held in Grenoble, France (FG’2000), and Kauai, Hawaii (CVPR’01) respectively.The principal motivation for this workshop is that recent advances in visual tracking/surveillance research have not been met with complementary systematic performanceevaluation. It is especially difficult to draw comparisons between algorithms if they have beentested on different datasets under widely varying conditions. In PETS, all participants areapplying their algorithms to the same datasets. For this workshop, the datasets include an indoorenvironment with people moving in front of a shop window, and static hand postures.
PETS this year is more industrially motivated both by the datasets and the speakers. The peopletracking datasets were collected by the Consortium of Project IST VISOR BASE (IST-1999-10808). The Jochen Triesch hand posture dataset was provided by Sebastian Marcel, IDIAP,Switzerland.
We would like to thank all of those who have contributed papers to the workshop. Each paperwas reviewed by at least two reviewers with a third reviewer in many cases. The finalprogramme consists of 11 contributed presentations including four invited speakers, and adiscussion session. The final paper decisions were based on technical content and applicationto, and evaluation of results based on, the PETS’2002 datasets.
We would also like to thank the members of the programme committee and additional reviewersfor their prompt and detailed reviewing of the papers. Finally, thanks to the ECCV organisersand Conference Secretariat for coordination and help with the organisation of the workshop.
We hope that you enjoy the proceedings and look forward to your active participation.
PETS’2002 Steering CommitteeJune 2002
v

Workshop Organisers
Programme Chair
James Ferryman
Department of Computer ScienceThe University of Reading
WhiteknightsReading RG6 6AY UK
Steering Committee
James L. Crowley, I.N.P. Grenoble, FranceJames Ferryman, The University of Reading, UK
Programme Committee
Terrance Boult, Lehigh University, USAAndrew Bulpitt, The University of Leeds, UK
Tim Cootes, The University of Manchester, UKPatrick Courtney, Perkin Elmer Life Science, Cambridge, UK
James L. Crowley, I.N.P. Grenoble, FranceLarry Davis, The University of Maryland, USA
Shaogang Gong, Queen Mary, University of London, UKErik Granum, Aalborg University, Denmark
Eric Grimson, MIT AI Lab, USAYuri Ivanov, MIT Media Lab, USA
Graeme Jones, Kingston University, UKAndreas Lanitis, Cyrus College, Nicosia, CyprusSebastian Marcel, IDIAP, Martigny, SwitzerlandSteve Maybank, The University of Reading, UK
Arthur Pece, The University of Copenhagen, DenmarkJustus Piater, I.N.P. Grenoble, France
Gerhard Rigoll, Gerhard-Mercator-University, Duisburg, GermanySimon Rowe, Canon Research Centre Europe, UK
Stan Sclaroff, Boston University, USAAndrew Senior, IBM T.J. Watson Research Centre, USA
Tieniu Tan, Institute of Automation, Beijing, ChinaRamesh Visvanathan, Siemens Corporate Research, USA
vi
Event-based Activity Analysis in Live Video using a Generic Object Tracker
Justus H. Piater, Stephane Richetto, and James L. Crowley
Projet PRIMA, Laboratoire GAVIR-IMAGINRIA Rhone-Alpes
655 avenue de l’Europe, Montbonnot38334 Saint Ismier cedex, France
Abstract
In earlier work we introduced a generic, modular trackerarchitecture that combines the advantages of several sim-ple and rapidly performing tracking algorithms. The adap-tive choice of critical system parameters such as process-ing regions and resolution results in robustness to varyingframe rates and computational constraints. In this paper,we describe the embedding of our tracker into a distributedinfrastructure for visual surveillance applications via anevent-based mechanism. The tracker generates application-independent events on the basis of generic incidents andtarget interactions detected in the video stream. Theseevents can then be received and interpreted by application-specific clients. We report experimental results on the shop-window datasets of PETS 2002.
1. IntroductionA central aim of most video surveillance applications is theautomatic detection of particular incidents of interest. In se-curity applications, for instance, such incidents may includethe appearance of an intruder, the recognition of a particularface, or a piece of unattended luggage. Other applicationsseek to gather statistics of specific aspects of human activ-ity. In this paper we describe the application of our generic,video-rate tracking system [8] to a such an application. Theaim is to collect data about commercially relevant humanbehavior in relation to a shop window.
We employ our multi-purpose, modular object trackerthat is currently being developed as part of a project aimedat creating an infrastructure for distributed video surveil-lance applications. Most of the relevant technical detailsabout our tracker have already been described at last year’sPETS workshop [8]. In this paper, we summarize the keyaspects of the underlying multi-purpose tracking system,and then describe the embedding of our system into the dis-tributed environment through an interface of light-weight
This work has been sponsored by Project IST-1999-10808 VISOR BASE.
data structures, and how these can be used by specific appli-cations. We report experimental results on the shop-windowdata of this year’s PETS workshop.
Two key characteristics of our system are its generalityand its speed. Since we aim to address a very wide variety oftracking applications [9], we avoid the use of task-specificknowledge and models to the largest possible extent. Suchknowledge can substantially bolster performance on spe-cific applications, but it is costly to implement and oftenalso computationally expensive [10, 6, 2, 4, 14]. Instead, weexplore the performance achievable within the self-imposedlimitations of a very general and efficient system.
A key to achieving robustness in general scenarios lies inrapid processing at or close to video frame rates. Therefore,we employ simple algorithms that perform very rapid tar-get detection. Several different such algorithms can be usedwithout loss of processing speed if more than one CPU isavailable. This modular architecture permits the selectionof complementary algorithms to balance their respective ad-vantages and drawbacks, though only one is used for thepurpose of this paper.
The system attempts to track each moving (or temporar-ily stationary) object as an individual target. Targets thatcome very close to each other are merged. If a target sep-arates into spatially distinct objects, it is split into two tar-gets. In this way, interacting objects can be tracked [10, 7].As a result, the system is robust to certain scene and sys-tem parameters such as the number and proximity of mov-ing objects and the video processing frame rates. All de-tection algorithms are based on adaptively parameterizedregions of interest (ROIs). Therefore, the overall compu-tational demands depend more on the number of simulta-neously tracked targets than on the size of the processedframes. This is a great advantage over frame-based meth-ods when only a minor fraction of the image is coveredby target ROIs. Almost all current work on object track-ing focuses on such “sparse” scenarios, since any trackingtask becomes considerably more difficult if the majority ofa frame is occupied by moving targets.
Proceedings 3rd IEEE Int. Workshop on PETS, Copenhagen, June 1 2002
1
Shop−Window
People Counter
events
results
other algorithms...
Video Source
Background−DifferenceTracker
Estimator
Recursive Supervisor
Detection Modules Integration and AnalysisInput Video
video frames
from local or
remote source
CORBA Bus
events interactionuserG
ener
icA
pp
licat
ion
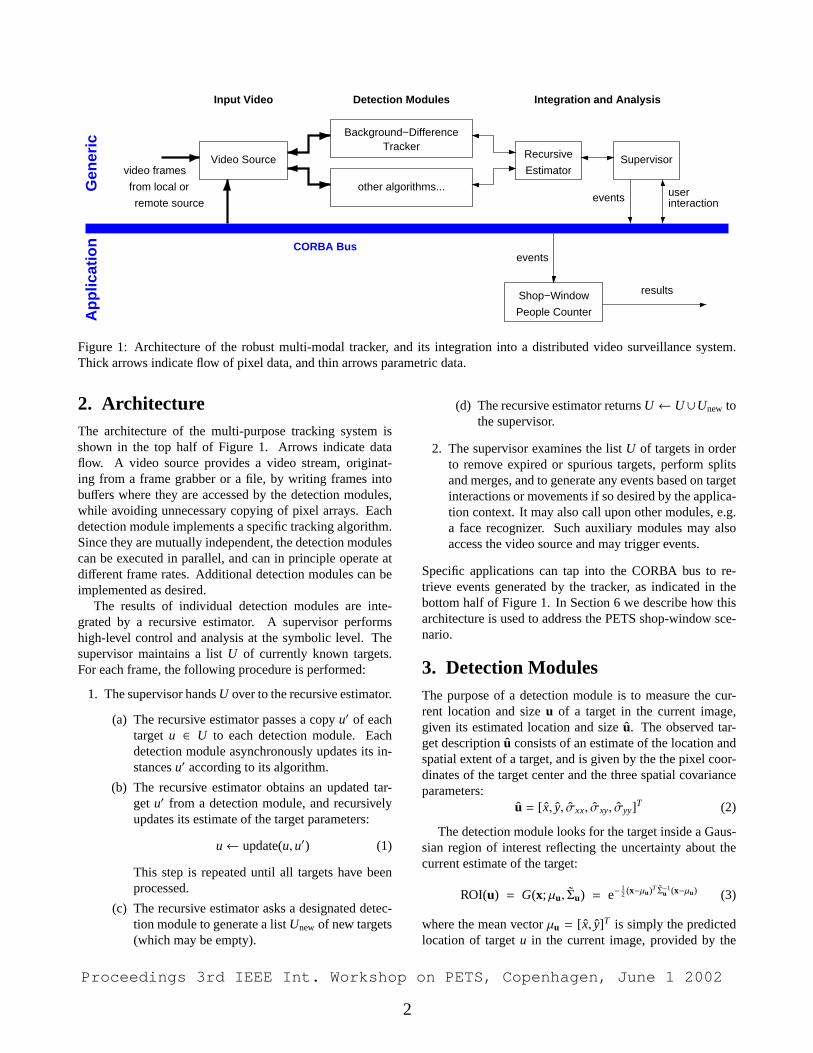
Figure 1: Architecture of the robust multi-modal tracker, and its integration into a distributed video surveillance system.Thick arrows indicate flow of pixel data, and thin arrows parametric data.
2. ArchitectureThe architecture of the multi-purpose tracking system isshown in the top half of Figure 1. Arrows indicate dataflow. A video source provides a video stream, originat-ing from a frame grabber or a file, by writing frames intobuffers where they are accessed by the detection modules,while avoiding unnecessary copying of pixel arrays. Eachdetection module implements a specific tracking algorithm.Since they are mutually independent, the detection modulescan be executed in parallel, and can in principle operate atdifferent frame rates. Additional detection modules can beimplemented as desired.
The results of individual detection modules are inte-grated by a recursive estimator. A supervisor performshigh-level control and analysis at the symbolic level. Thesupervisor maintains a listU of currently known targets.For each frame, the following procedure is performed:
1. The supervisor handsU over to the recursive estimator.
(a) The recursive estimator passes a copyu′ of eachtargetu ∈ U to each detection module. Eachdetection module asynchronously updates its in-stancesu′ according to its algorithm.
(b) The recursive estimator obtains an updated tar-get u′ from a detection module, and recursivelyupdates its estimate of the target parameters:
u← update(u,u′) (1)
This step is repeated until all targets have beenprocessed.
(c) The recursive estimator asks a designated detec-tion module to generate a listUnew of new targets(which may be empty).
(d) The recursive estimator returnsU ← U∪Unew tothe supervisor.
2. The supervisor examines the listU of targets in orderto remove expired or spurious targets, perform splitsand merges, and to generate any events based on targetinteractions or movements if so desired by the applica-tion context. It may also call upon other modules, e.g.a face recognizer. Such auxiliary modules may alsoaccess the video source and may trigger events.
Specific applications can tap into the CORBA bus to re-trieve events generated by the tracker, as indicated in thebottom half of Figure 1. In Section 6 we describe how thisarchitecture is used to address the PETS shop-window sce-nario.
3. Detection ModulesThe purpose of a detection module is to measure the cur-rent location and sizeu of a target in the current image,given its estimated location and sizeu. The observed tar-get descriptionu consists of an estimate of the location andspatial extent of a target, and is given by the the pixel coor-dinates of the target center and the three spatial covarianceparameters:
u = [ x, y, σxx, σxy, σyy]T (2)
The detection module looks for the target inside a Gaus-sian region of interest reflecting the uncertainty about thecurrent estimate of the target:
ROI(u) = G(x; µu, Σu) = e−12 (x−µu)T Σ−1
u (x−µu) (3)
where the mean vectorµu = [ x, y]T is simply the predictedlocation of targetu in the current image, provided by the
Proceedings 3rd IEEE Int. Workshop on PETS, Copenhagen, June 1 2002
2
recursive estimator. The spatial covarianceΣu reflects thesize of the target, as well as the uncertainty about the currenttarget location and size:
Σ =
[σxx σxy
σxy σyy
]+ ∆t
[qxx + qσxx 0
0 qyy + qσyy
](4)
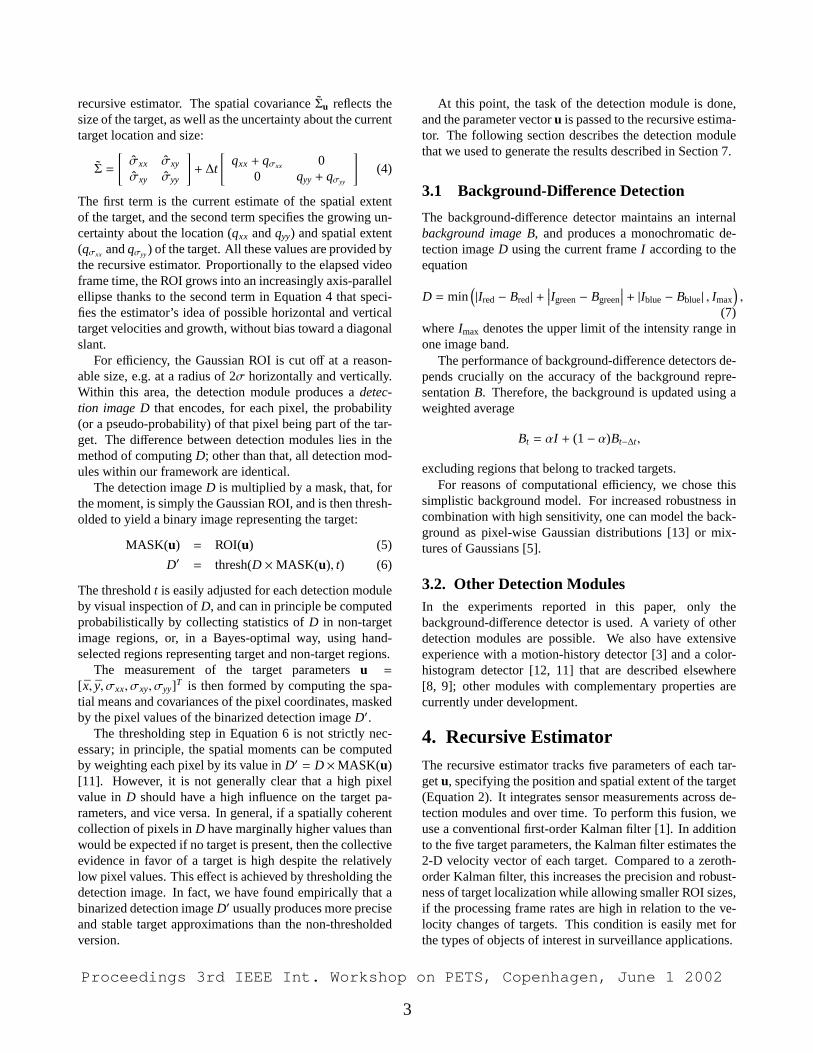
The first term is the current estimate of the spatial extentof the target, and the second term specifies the growing un-certainty about the location (qxx andqyy) and spatial extent(qσxx andqσyy) of the target. All these values are provided bythe recursive estimator. Proportionally to the elapsed videoframe time, the ROI grows into an increasingly axis-parallelellipse thanks to the second term in Equation 4 that speci-fies the estimator’s idea of possible horizontal and verticaltarget velocities and growth, without bias toward a diagonalslant.
For efficiency, the Gaussian ROI is cut off at a reason-able size, e.g. at a radius of 2σ horizontally and vertically.Within this area, the detection module produces adetec-tion image Dthat encodes, for each pixel, the probability(or a pseudo-probability) of that pixel being part of the tar-get. The difference between detection modules lies in themethod of computingD; other than that, all detection mod-ules within our framework are identical.
The detection imageD is multiplied by a mask, that, forthe moment, is simply the Gaussian ROI, and is then thresh-olded to yield a binary image representing the target:
MASK(u) = ROI(u) (5)
D′ = thresh(D ×MASK(u), t) (6)
The thresholdt is easily adjusted for each detection moduleby visual inspection ofD, and can in principle be computedprobabilistically by collecting statistics ofD in non-targetimage regions, or, in a Bayes-optimal way, using hand-selected regions representing target and non-target regions.
The measurement of the target parametersu =
[ x, y, σxx, σxy, σyy]T is then formed by computing the spa-tial means and covariances of the pixel coordinates, maskedby the pixel values of the binarized detection imageD′.
The thresholding step in Equation 6 is not strictly nec-essary; in principle, the spatial moments can be computedby weighting each pixel by its value inD′ = D×MASK(u)[11]. However, it is not generally clear that a high pixelvalue in D should have a high influence on the target pa-rameters, and vice versa. In general, if a spatially coherentcollection of pixels inD have marginally higher values thanwould be expected if no target is present, then the collectiveevidence in favor of a target is high despite the relativelylow pixel values. This effect is achieved by thresholding thedetection image. In fact, we have found empirically that abinarized detection imageD′ usually produces more preciseand stable target approximations than the non-thresholdedversion.
At this point, the task of the detection module is done,and the parameter vectoru is passed to the recursive estima-tor. The following section describes the detection modulethat we used to generate the results described in Section 7.
3.1 Background-Difference Detection
The background-difference detector maintains an internalbackground image B, and produces a monochromatic de-tection imageD using the current frameI according to theequation
D = min(|Ired− Bred| +
∣∣∣Igreen− Bgreen
∣∣∣ + |Iblue− Bblue| , Imax
),
(7)whereImax denotes the upper limit of the intensity range inone image band.
The performance of background-difference detectors de-pends crucially on the accuracy of the background repre-sentationB. Therefore, the background is updated using aweighted average
Bt = αI + (1− α)Bt−∆t,
excluding regions that belong to tracked targets.For reasons of computational efficiency, we chose this
simplistic background model. For increased robustness incombination with high sensitivity, one can model the back-ground as pixel-wise Gaussian distributions [13] or mix-tures of Gaussians [5].
3.2. Other Detection ModulesIn the experiments reported in this paper, only thebackground-difference detector is used. A variety of otherdetection modules are possible. We also have extensiveexperience with a motion-history detector [3] and a color-histogram detector [12, 11] that are described elsewhere[8, 9]; other modules with complementary properties arecurrently under development.
4. Recursive EstimatorThe recursive estimator tracks five parameters of each tar-getu, specifying the position and spatial extent of the target(Equation 2). It integrates sensor measurements across de-tection modules and over time. To perform this fusion, weuse a conventional first-order Kalman filter [1]. In additionto the five target parameters, the Kalman filter estimates the2-D velocity vector of each target. Compared to a zeroth-order Kalman filter, this increases the precision and robust-ness of target localization while allowing smaller ROI sizes,if the processing frame rates are high in relation to the ve-locity changes of targets. This condition is easily met forthe types of objects of interest in surveillance applications.
Proceedings 3rd IEEE Int. Workshop on PETS, Copenhagen, June 1 2002
3

The Kalman filter must be parameterized according tothe accuracy of the measurements ofu by each detectionmodule, and to the expected velocity changes of movingobjects. This can be done by careful calibration using mea-sured data, or simply by rough estimation as the perfor-mance is quite robust to imprecise parameterization. Theparametersq that occur in Equation 4 with various sub-scripts are precisely those coefficients specifying the ex-pected velocity changes of moving objects.
5. SupervisorThe supervisor maintains the list of currently known targets,and performs the following principal functions:
• Activation of detection modules for tracking of exist-ing and detection of new targets in each frame,
• Maintenance of the target list by adding newly detectedtargets, deleting lost or exited targets, and performingtarget splits and merges,
• Launching of events based on the above, as well as onother target characteristics,
• User interaction,• Dynamic re-parameterization of the tracking system
to maintain desired performance characteristics over arange of conditions (currently under investigation).
5.1. Target List MaintenanceEach target has an associatedconfidence factor. If a target issuccessfully tracked by one or more detection modules, theconfidence factor is incremented (up to a limit). Otherwise,the confidence factor is decremented. In this case, the targetis considered temporarily out of sight. Note that this target’sROI size grows automatically in accordance with the grow-ing uncertainty of the Kalman estimate of the target locationand size (Eqn. 3). Targets with zero confidence are elimi-nated. If, however, an undetected target is located inside adesignatedexit region, the target is considered to have leftthe scene. Accordingly, its confidence is immediately set tozero, causing it to disappear.
Targets are merged if they draw so close to one anotherthat they can no longer be reliably kept separate at the para-metric level. A target is split if it separates into clearly dis-tinct subregions at the pixel level. The details of this proce-dure and examples have been given elsewhere [8].
One or more designated detection modules look for newtargets in specialtrigger regions. This is useful if it isknown by the application context that new targets only ap-pear in certain regions, because it is much more efficientthan processing the entire image, and also increases robust-ness to noise. On the other hand, it is perfectly permis-sible to define a trigger region that covers the entire image.The detection procedure is generally exactly the same as the
tracking algorithms described above, except that no MASKis applied. Instead, pixels marked as occupied by a knowntarget are ignored.
Additionally, dynamic trigger regions may be attached totarget ROIs, covering a certain region around the peripheryof a target. This permits the detection of minuscule sub-targets that split off existing targets. Dynamic trigger re-gions are not used in the experiments reported in this paper.
5.2. Event GenerationAn ultimate purpose of most tracking systems is the ex-traction of symbolic descriptions of scene activity. In ourarchitecture, this task is divided into two parts: Firstly,application-independent events are generated by the super-visor. A local module dispatches these events to any regis-tered local or remote clients. Secondly, the clients analyzethese events to extract information relevant to the applica-tion. Each event consists of a light-weight data structurethat contains the identifier and parameters of the affectedtarget(s), as well as further information such as frame num-bers and time stamps. The following events are currentlydefined in our system:
NewTarget A new target was detected in a static triggerregion.
ConfirmTarget A recently detected target (cf.NewTar-get) has passed a given confidence threshold for thefirst time. This event is useful because the Kalman-filtered parametric approximation of target parametersrequires some number of frames to converge, and alsobecauseNewTarget events are sometimes signalled forspurious targets that disappear soon after.
MoveTarget A target has moved. Since this event is usu-ally launched for almost all targets at almost everyframe, incurring a high communication overhead, thesystem can be configured to trigger this type of eventat most once in everyn frames for each target. For thispaper, however, we always usedn = 1.
SplitTarget A target was split into two new targets asbriefly described above.
SplitOffTarget A new target was detected in a dynamictrigger region as described above. This new target isconsidered to have been split off the existing target thatowns that trigger region.
MergeTargets Two targets were merged into a new target.
ExitTarget A target disappeared inside an exit region.
LostTarget A target’s confidence value dropped to zero,not inside of any exit region.
Proceedings 3rd IEEE Int. Workshop on PETS, Copenhagen, June 1 2002
4
DeleteTarget A target was deleted by an external event.Currently, this can be a user who deletes a target byvirtue of a mouse click.
ObservRegion A target entered into or passed out of adesignatedobservation region.
Observation regions constitute a versatile concept for gath-ering statistics about target numbers and spatial behaviors.Our system allows any number of observation regions tobe defined, and allows any kind of spatial relation betweenthem, including containment and partial overlaps.
5.3. User InteractionSince our system is part of a distributed infrastructure, itis designed to be fully remotely interoperable and config-urable. For this purpose, the supervisor polls for incominginteraction requests after processing each frame. Any com-mands contained in these requests are dispatched to the cor-responding modules within the architecture, and feedback isreturned via the same communication channel. Moreover, aremote user can request the transmission of live video, andsome event types can carry image data such as face snap-shots or entire frames as an extended payload.
6. The Shop-Window ScenarioThe goal in the PETS Show-Window scenario is to gatherthe following information at each frame:
cur in the number of people currently in front of the shopwindow,
cumul in the cumulative number of individuals havingpassed by the shop window,
cur st the number of people currently stopping and look-ing into the shop window, and
cumul st the cumulative number of individuals havinglooked into the shop window.
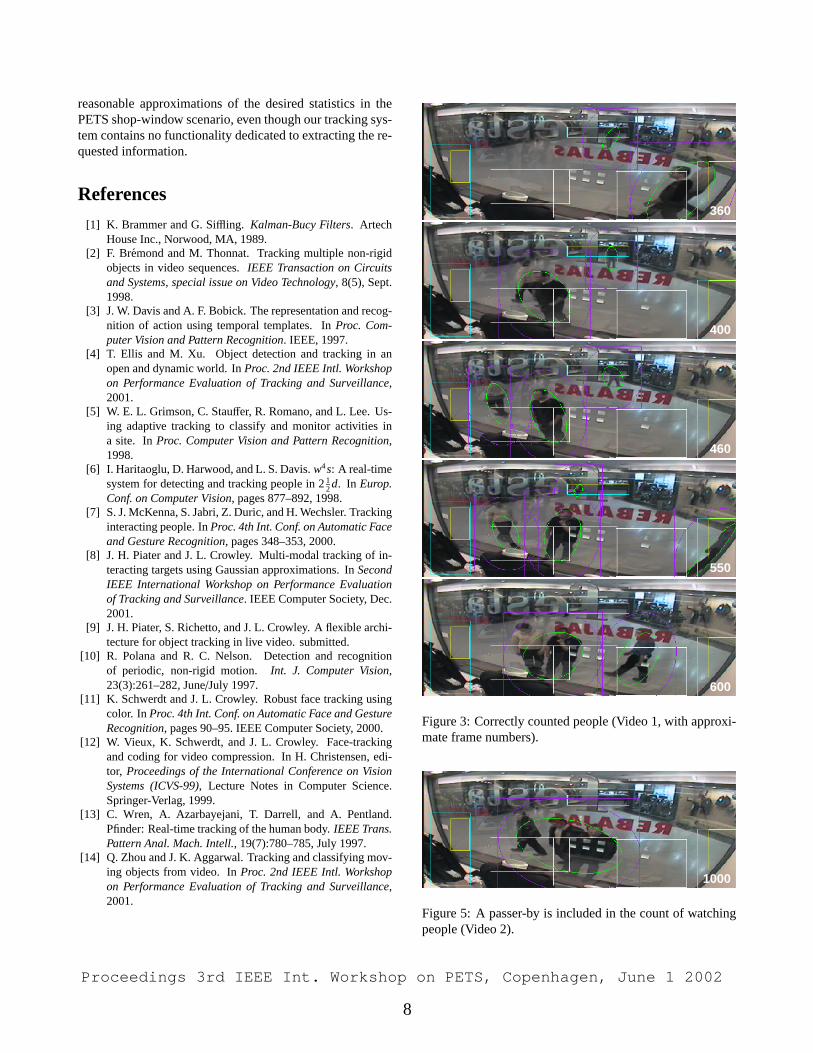
This task is difficult to solve for our system because, beinglargely model-free, it is not equipped to retrieve any of thisinformation directly. Based on the events described pre-viously, we can nevertheless obtain reasonable approxima-tions to all of these. Figure 3 shows our setup with threecorresponding entry and exit regions, and one large obser-vation region – consisting of three pieces for experimentalreasons – along the width of the window. In seeking to ob-tain the desired statistics, our system faces three principal,interrelated difficulties:
First, since our system has no model of a person, it can-not determine how many individuals are represented by agiven target. We address this by estimating, for each tar-get, the number of people based on the width of the target,along with simple correction mechanisms to ensure consis-tency across splits and merges.
The second difficulty is that our system cannot identifyindividuals. We therefore have no direct way to match iden-tities of individuals over time, which is required to obtainaccurate values for the cumulative statistics. To address this,our shop-window client keeps its own list oftreated targets.A given target becomes interesting to the client, and is saidto have been treated, once it enters the observation regionfor the first time. Moreover, the targets created by splitsand merges have been treated (by definition) if at least oneof the parents has been treated. Using this list, we remem-ber, for each target, whether it has passed by or stopped infront of the window, helping us to accurately estimate thecumulative statistics.
The third difficulty lies in the fact that, lacking a modelof a person, we cannot determine the direction of gaze of aperson. We therefore make the strong simplifying assump-tion that all people represented by a stationary target insidethe observation region are looking into the shop window,and no person represented by a moving target inside the ob-servation region or by any target outside of it is looking intothe shop window.
An interesting way to address the first and third diffi-culties would be to use our color histogram detection mod-ule [9] to detect potential face regions inside the targets.It could also be used to try to discriminate people on thebasis of the color distributions of their garments, address-ing the second difficulty. However, pilot experiments soonindicated that the rather degenerate color information con-tained in the benchmark sequences is insufficient for thesepurposes. In particular, the apparent color of human skin isvery close to the majority of the background.
The key idea then is to keep track of the following pa-rameters for each treated target, across merges and splits:
tt np the estimated number of people represented by thetarget,
tt in whether the target is currently inside the observationregion,
tt stc whether the target is currently stationary,tt stp whether the target has previously been stationary in-
side the observation region.
Given this information, it is straightforward to determinethe two non-cumulative statisticscur in andcur st. In thefollowing, we describe how the client exploits events in or-der to maintain the above four parameters for the treatedtargets, and to update the two cumulative statisticscumul inandcumul st:
MoveTarget To updatett stc and tt stp: A target is con-sidered stationary if ˙x <
√σxx/second. This criterion
was chosen empirically.
ObservRegion The target’s parametertt in is updated ac-cordingly.
Proceedings 3rd IEEE Int. Workshop on PETS, Copenhagen, June 1 2002
5
SplitTarget Both children inherit thett stc and tt stp pa-rameters from the parent, and theirtt in parameters aredetermined according to their positions. The valuestt np of the children are determined by splitting theparent’s value according to the ratio of the widths ˆσxx
of the children, while making sure that each child con-tains at least one person. If the parent hadtt np = 1,and the parent was inside the observation region (andstationary), then the population estimate is correctedby incrementingcumul in (andcumul st).
MergeTargets The child’stt np number is the sum of theparents’ values, andtt stc andtt stp are determined bythe boolean disjunctions of the corresponding valuesof the parents. If the child is inside the observation re-gion, then the people represented by those parent(s), ifany, that were outside the observation region are addedto the cumulative count by incrementingcumul in bythe corresponding value(s), if any, oftt np. A cor-responding update is performed forcumul st. Thechild’s value oftt in is determined according to its po-sition relative to the observation region.
ObservRegion If an entering target has not yet beentreated, it is added to the list of treated targets, settingtt in to true. Its value oftt np is estimated based on itswidth as described above, andcumul in is incrementedby tt np. If the entering target has already been treated,all that happens is that itstt in parameter is set totrue.If the event signals an exiting target, itstt in parameteris set tofalse.
7. ExperimentsWe tested our system on the three PETS shop-window testsequences in the original MPEG-1 format. The backgroundmodel of the background-difference tracker was initializedat start-up using an image of the empty scene. We used thesame parameters for all three videos.
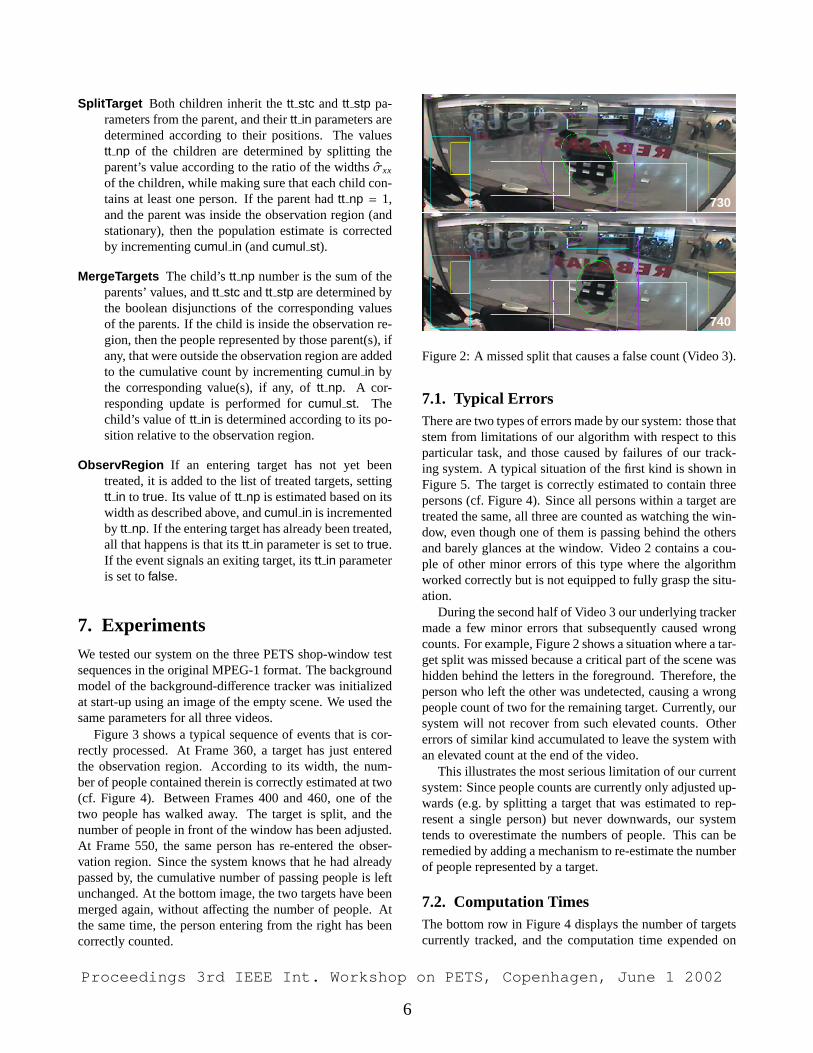
Figure 3 shows a typical sequence of events that is cor-rectly processed. At Frame 360, a target has just enteredthe observation region. According to its width, the num-ber of people contained therein is correctly estimated at two(cf. Figure 4). Between Frames 400 and 460, one of thetwo people has walked away. The target is split, and thenumber of people in front of the window has been adjusted.At Frame 550, the same person has re-entered the obser-vation region. Since the system knows that he had alreadypassed by, the cumulative number of passing people is leftunchanged. At the bottom image, the two targets have beenmerged again, without affecting the number of people. Atthe same time, the person entering from the right has beencorrectly counted.
730
740
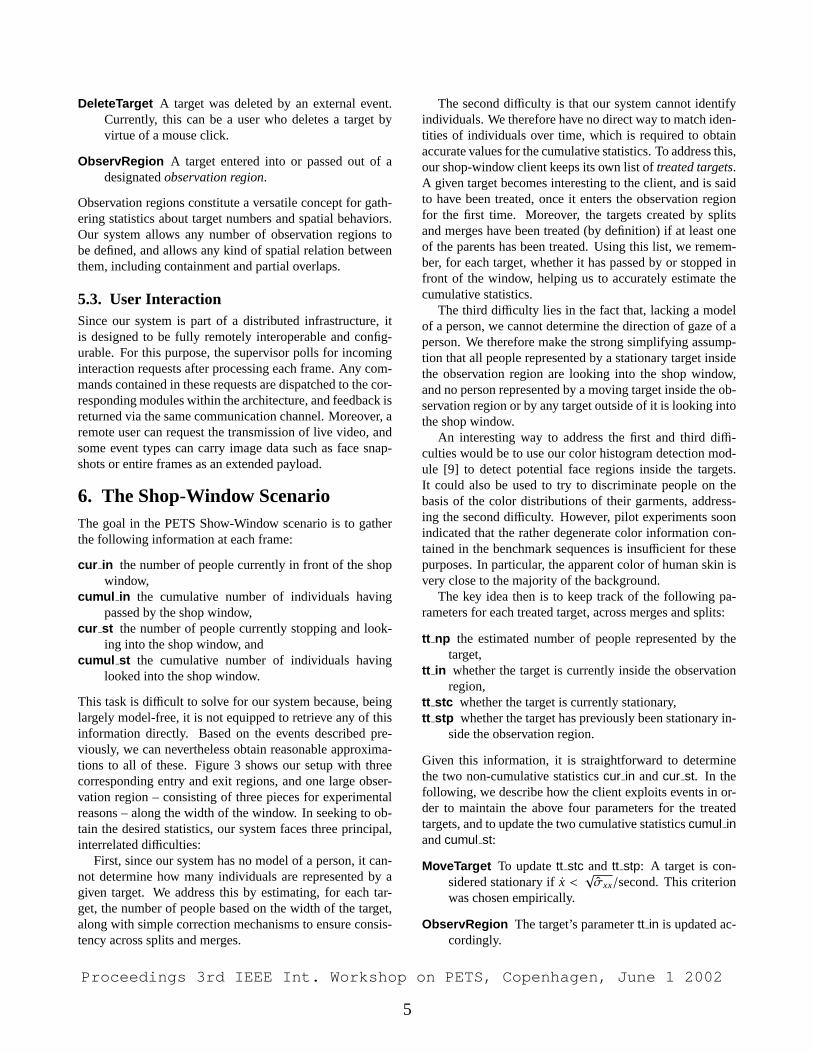
Figure 2: A missed split that causes a false count (Video 3).
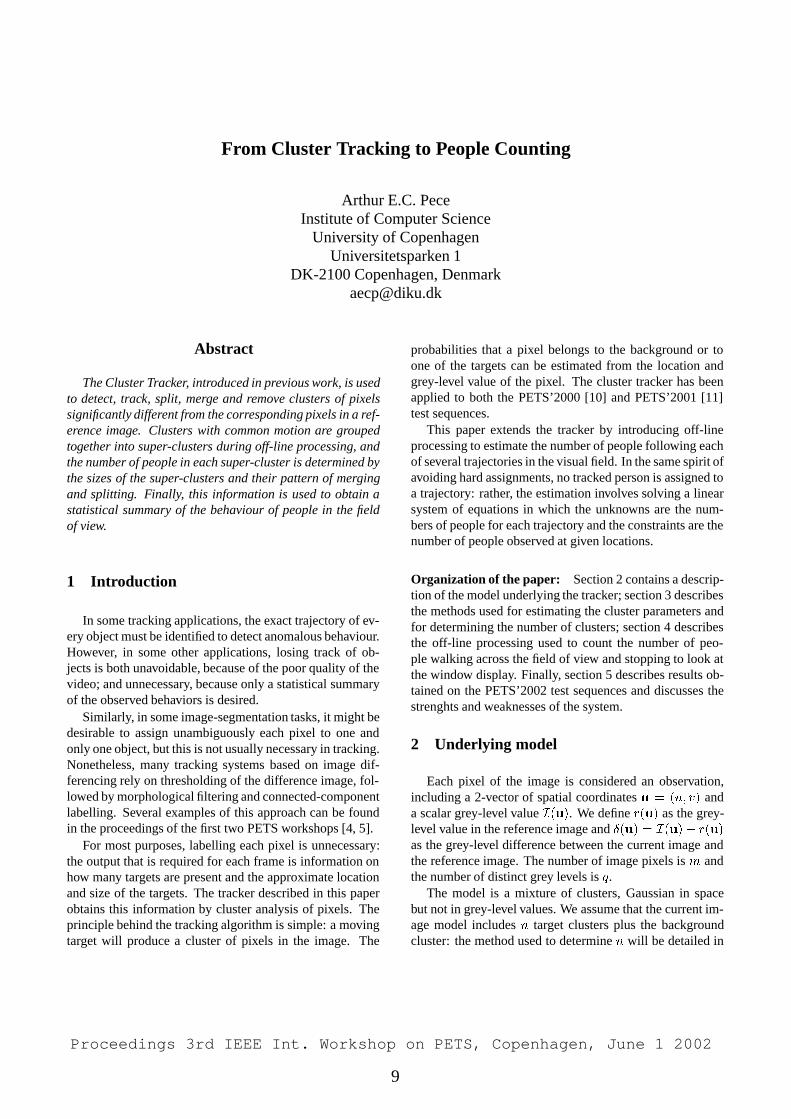
7.1. Typical ErrorsThere are two types of errors made by our system: those thatstem from limitations of our algorithm with respect to thisparticular task, and those caused by failures of our track-ing system. A typical situation of the first kind is shown inFigure 5. The target is correctly estimated to contain threepersons (cf. Figure 4). Since all persons within a target aretreated the same, all three are counted as watching the win-dow, even though one of them is passing behind the othersand barely glances at the window. Video 2 contains a cou-ple of other minor errors of this type where the algorithmworked correctly but is not equipped to fully grasp the situ-ation.
During the second half of Video 3 our underlying trackermade a few minor errors that subsequently caused wrongcounts. For example, Figure 2 shows a situation where a tar-get split was missed because a critical part of the scene washidden behind the letters in the foreground. Therefore, theperson who left the other was undetected, causing a wrongpeople count of two for the remaining target. Currently, oursystem will not recover from such elevated counts. Othererrors of similar kind accumulated to leave the system withan elevated count at the end of the video.
This illustrates the most serious limitation of our currentsystem: Since people counts are currently only adjusted up-wards (e.g. by splitting a target that was estimated to rep-resent a single person) but never downwards, our systemtends to overestimate the numbers of people. This can beremedied by adding a mechanism to re-estimate the numberof people represented by a target.
7.2. Computation TimesThe bottom row in Figure 4 displays the number of targetscurrently tracked, and the computation time expended on
Proceedings 3rd IEEE Int. Workshop on PETS, Copenhagen, June 1 2002
6
0 100 200 300 400 500 6000
1
2
3
4
5
6
7
8
Frame number
Cou
nt
Video 1
# people passing# people stopping
0 500 1000 15000
1
2
3
4
5
6
7
8
Frame number
Cou
nt
Video 2
# people passing# people stopping
0 200 400 600 800 1000 12000
1
2
3
4
5
6
7
8
Frame number
Cou
nt
Video 3
# people passing# people stopping
0 100 200 300 400 500 6000
1
2
3
4
5
6
7
8
Frame number
Cou
nt
Video 1
cumulative # passingcumulative # stopped
0 500 1000 15000
1
2
3
4
5
6
7
8
Frame number
Cou
nt
Video 2
cumulative # passingcumulative # stopped
0 200 400 600 800 1000 12000
1
2
3
4
5
6
7
8
Frame number
Cou
nt
Video 3
cumulative # passingcumulative # stopped
0 100 200 300 400 500 6000
1
2
3
4
5
6
7
8Video 1
Frame number
Cou
nt
# targets
0 100 200 300 400 500 6000
0.01
0.02
0.03
0.04
0.05
0.06
seco
nds
per
fram
e
computation time
0 500 1000 15000
1
2
3
4
5
6
7
8Video 2
Frame number
Cou
nt
# targets
0 500 1000 15000
0.01
0.02
0.03
0.04
0.05
0.06
seco
nds
per
fram
ecomputation time
0 200 400 600 800 1000 12000
1
2
3
4
5
6
7
8Video 3
Frame number
Cou
nt
# targets
0 200 400 600 800 1000 12000
0.01
0.02
0.03
0.04
0.05
0.06
seco
nds
per
fram
e
computation time
Figure 4: Quantitative Results.
each frame using a 1 GHz Pentium III running Linux. Thistime does not include the decoding of the MPEG videoor any graphic display. They were measured by countingCPU clock cycles, and are therefore overestimates becauseof other processes running on the machine. Our algorithmwas set to operate only on every other row and column ofpixels, which corresponds to subsampling each image by alinear factor of two.
The regular spikes are caused by the adaptive back-ground algorithm that was set to update the backgroundmodel every 25 frames. This is the only image-wide opera-tion in our algorithm. Other than that, the computation timeis roughly proportional to the number of targets currentlytracked. With the exception of two consecutive frames in
Video 2 and eleven frames in Video 3, all computation eas-ily fit into a single frame time of 0.04 seconds. In all of theexceptional frames, four or five targets were tracked simul-taneously. For up to two targets, our system would attainframe-rate performance on a machine of half that clock fre-quency.
8. ConclusionsBuilding on our general, live-video object tracker intro-duced at last year’s PETS workshop [8], we described its in-tegration into a distributed infrastructure using event-basedcommunication. Generic, application-independent eventscan be exploited to extract application-specific information.We described how this methodology permits us to obtain
Proceedings 3rd IEEE Int. Workshop on PETS, Copenhagen, June 1 2002
7
reasonable approximations of the desired statistics in thePETS shop-window scenario, even though our tracking sys-tem contains no functionality dedicated to extracting the re-quested information.
References
[1] K. Brammer and G. Siffling. Kalman-Bucy Filters. ArtechHouse Inc., Norwood, MA, 1989.
[2] F. Bremond and M. Thonnat. Tracking multiple non-rigidobjects in video sequences.IEEE Transaction on Circuitsand Systems, special issue on Video Technology, 8(5), Sept.1998.
[3] J. W. Davis and A. F. Bobick. The representation and recog-nition of action using temporal templates. InProc. Com-puter Vision and Pattern Recognition. IEEE, 1997.
[4] T. Ellis and M. Xu. Object detection and tracking in anopen and dynamic world. InProc. 2nd IEEE Intl. Workshopon Performance Evaluation of Tracking and Surveillance,2001.
[5] W. E. L. Grimson, C. Stauffer, R. Romano, and L. Lee. Us-ing adaptive tracking to classify and monitor activities ina site. InProc. Computer Vision and Pattern Recognition,1998.
[6] I. Haritaoglu, D. Harwood, and L. S. Davis.w4s: A real-timesystem for detecting and tracking people in 21
2d. In Europ.Conf. on Computer Vision, pages 877–892, 1998.
[7] S. J. McKenna, S. Jabri, Z. Duric, and H. Wechsler. Trackinginteracting people. InProc. 4th Int. Conf. on Automatic Faceand Gesture Recognition, pages 348–353, 2000.
[8] J. H. Piater and J. L. Crowley. Multi-modal tracking of in-teracting targets using Gaussian approximations. InSecondIEEE International Workshop on Performance Evaluationof Tracking and Surveillance. IEEE Computer Society, Dec.2001.
[9] J. H. Piater, S. Richetto, and J. L. Crowley. A flexible archi-tecture for object tracking in live video. submitted.
[10] R. Polana and R. C. Nelson. Detection and recognitionof periodic, non-rigid motion. Int. J. Computer Vision,23(3):261–282, June/July 1997.
[11] K. Schwerdt and J. L. Crowley. Robust face tracking usingcolor. InProc. 4th Int. Conf. on Automatic Face and GestureRecognition, pages 90–95. IEEE Computer Society, 2000.
[12] W. Vieux, K. Schwerdt, and J. L. Crowley. Face-trackingand coding for video compression. In H. Christensen, edi-tor, Proceedings of the International Conference on VisionSystems (ICVS-99), Lecture Notes in Computer Science.Springer-Verlag, 1999.
[13] C. Wren, A. Azarbayejani, T. Darrell, and A. Pentland.Pfinder: Real-time tracking of the human body.IEEE Trans.Pattern Anal. Mach. Intell., 19(7):780–785, July 1997.
[14] Q. Zhou and J. K. Aggarwal. Tracking and classifying mov-ing objects from video. InProc. 2nd IEEE Intl. Workshopon Performance Evaluation of Tracking and Surveillance,2001.
360
400
460
550
600
Figure 3: Correctly counted people (Video 1, with approxi-mate frame numbers).
1000
Figure 5: A passer-by is included in the count of watchingpeople (Video 2).
Proceedings 3rd IEEE Int. Workshop on PETS, Copenhagen, June 1 2002
8
From Cluster Tracking to People Counting
Arthur E.C. PeceInstitute of Computer Science
University of CopenhagenUniversitetsparken 1
DK-2100 Copenhagen, [email protected]
Abstract
The Cluster Tracker, introduced in previous work, is usedto detect, track, split, merge and remove clusters of pixelssignificantly different from the corresponding pixels in a ref-erence image. Clusters with common motion are groupedtogether into super-clusters during off-line processing, andthe number of people in each super-cluster is determined bythe sizes of the super-clusters and their pattern of mergingand splitting. Finally, this information is used to obtain astatistical summary of the behaviour of people in the fieldof view.
1 Introduction
In some tracking applications, the exact trajectory of ev-ery object must be identified to detect anomalous behaviour.However, in some other applications, losing track of ob-jects is both unavoidable, because of the poor quality of thevideo; and unnecessary, because only a statistical summaryof the observed behaviors is desired.
Similarly, in some image-segmentation tasks, it might bedesirable to assign unambiguously each pixel to one andonly one object, but this is not usually necessary in tracking.Nonetheless, many tracking systems based on image dif-ferencing rely on thresholding of the difference image, fol-lowed by morphological filtering and connected-componentlabelling. Several examples of this approach can be foundin the proceedings of the first two PETS workshops [4, 5].
For most purposes, labelling each pixel is unnecessary:the output that is required for each frame is information onhow many targets are present and the approximate locationand size of the targets. The tracker described in this paperobtains this information by cluster analysis of pixels. Theprinciple behind the tracking algorithm is simple: a movingtarget will produce a cluster of pixels in the image. The
probabilities that a pixel belongs to the background or toone of the targets can be estimated from the location andgrey-level value of the pixel. The cluster tracker has beenapplied to both the PETS’2000 [10] and PETS’2001 [11]test sequences.
This paper extends the tracker by introducing off-lineprocessing to estimate the number of people following eachof several trajectories in the visual field. In the same spirit ofavoiding hard assignments, no tracked person is assigned toa trajectory: rather, the estimation involves solving a linearsystem of equations in which the unknowns are the num-bers of people for each trajectory and the constraints are thenumber of people observed at given locations.
Organization of the paper: Section 2 contains a descrip-tion of the model underlying the tracker; section 3 describesthe methods used for estimating the cluster parameters andfor determining the number of clusters; section 4 describesthe off-line processing used to count the number of peo-ple walking across the field of view and stopping to look atthe window display. Finally, section 5 describes results ob-tained on the PETS’2002 test sequences and discusses thestrenghts and weaknesses of the system.
2 Underlying model
Each pixel of the image is considered an observation,including a 2-vector of spatial coordinates u = (u; v) anda scalar grey-level value I(u). We define r(u) as the grey-level value in the reference image and Æ(u) = I(u)� r(u)
as the grey-level difference between the current image andthe reference image. The number of image pixels is m andthe number of distinct grey levels is q.
The model is a mixture of clusters, Gaussian in spacebut not in grey-level values. We assume that the current im-age model includes n target clusters plus the backgroundcluster: the method used to determine n will be detailed in
Proceedings 3rd IEEE Int. Workshop on PETS, Copenhagen, June 1 2002
9
subsection 3.2. The cluster parameters have a subscript in-dicating the index of the cluster: the background cluster hasindex 0 and the target clusters have indexes j > 0. The setof parameters for cluster j is indicated by �j ; these param-eters will be defined in the following. The fraction of pixelsgenerated from cluster j is wj (one of the cluster parame-ters).
Throughout this paper, we use probabilities, instead ofprobability densities, because the images are discretisedboth in space and in grey-level values.
The probability fj(u) that cluster j generated the pixelat image location u is assumed to be a separable functionof the image coordinates and the grey-level value (or grey-level difference) observed at that location:
fj(u) = gj(u j�j) � hj [I(u) j�j ] (1)
The reasons for separability will be apparent when the ex-pressions for g and h are made explicit.
Correlations between neighbouring pixels are neglectedbecause they are assumed to arise from the clusters them-selves, i.e. grey-level values are conditionally independent,given the number of clusters and the cluster parameters.
2.1 Background cluster
By treating the background as a cluster, it becomes un-necessary to threshold grey-level differences. The proba-bilistic model for the background is, of course, differentfrom the model for the target clusters.
Dependence on image coordinates: Given that the back-ground is present (even if occluded) at every location in theimage, the probability f0(u) depends on u only through thegrey level I(u). In other words, g0(u j�0) is uniform overthe image:
g0(u j�0) = 1=m (2)
Dependence on grey-level values: The probabilityh0[I(u)j�0] that the background cluster generates a pixelwith grey-level value I(u) is approximated as an exponen-tial function of the absolute value of the grey-level differ-ence Æ(u):
h0[I(u) j�0] =1
2�0exp
��
����Æ(u)�0
����� (3)
where �0 is the mean (absolute value) grey-level differencefor the pixels in the background cluster.
A homogeneous Laplacian background model has an im-portant advantages over Gaussian-mixture models, as usedin some other trackers (see e.g. [12]): a single �0 parameterfor the entire image can be estimated from a single frame by
spatial averaging; if several different Gaussian-mixture pa-rameters are required for each pixel, then these parameterscan only be estimated from relatively long image sequences.
2.2 Target clusters
Dependence on image coordinates: We assume that theprobability is a Gaussian function of the distance of thepixel from the centroid of the cluster:
gj(u j�j) =1
2�pj�j j
exp
��1
2�u
Tj ��
�1j ��uj
�(4)
where �uj = u� cj is the vector distance of pixel u fromthe centroid cj of cluster j; �j is the covariance matrix ofcluster j; and j�j j is the determinant of �j .
Clusters generated from visual targets of interest are usu-ally not Gaussian, but better approximated as top-hat distri-butions of the form
g�
j (u j�j) =
( �4�pj�j j
��1
if �uTj ��
�1j ��uj < 4
0 otherwise(5)
The reason why Eq. 5 is not useful for parameter esti-mation is that it gives zero weight to pixels belonging to thetarget, but lying outside the estimated radius of the distribu-tion: such pixels arise both because of errors in parameterestimates before convergence, and because of the irregularshapes of the targets. However, the top-hat ellipsoid is use-ful for testing whether a cluster should be split into two (seesubsection 3.2).
Dependence on grey-level values: If a moving objectis well isolated from other moving objects, it can be effi-ciently tracked by making the simplifying assumption thathj [I(u) j�j ] is a uniform density:
hj [I(u) j�j ] = 1=q (j > 0) (6)
This assumption makes it impossible to preserve the identi-ties of two clusters when they reach a significant overlap onthe image plane. The problem can be partially overcome bylearning the grey-level distribution of each individual clus-ter [11], similarly to the mean-shift tracker [1]. However,this extension of the tracker relies on objects having sig-nificantly different grey-level distributions, which is not thecase in the PETS’2002 image sequences. Therefore, Eq. 6was used for the experiments described in this paper.
2.3 Summary of cluster parameters
The following table lists the basic cluster parameters:other parameters are derived from these, e.g. the densityin section 3.3.
Proceedings 3rd IEEE Int. Workshop on PETS, Copenhagen, June 1 2002
10
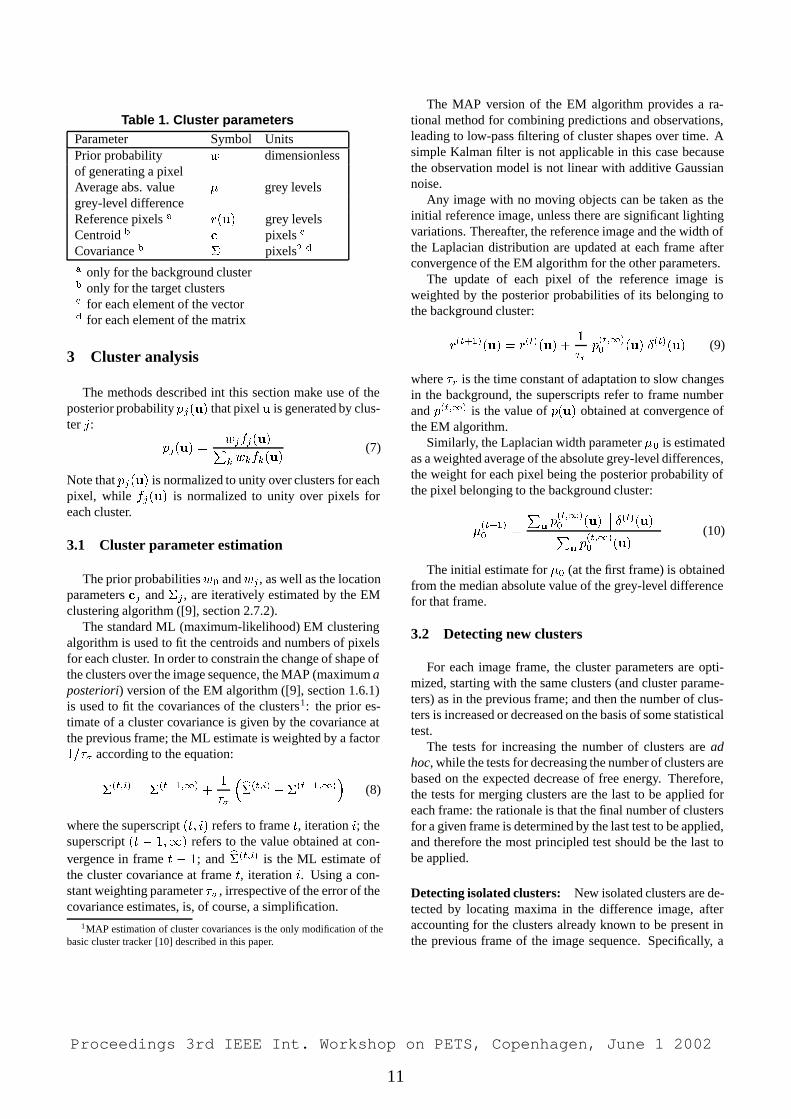
Table 1. Cluster parametersParameter Symbol UnitsPrior probability w dimensionlessof generating a pixelAverage abs. value � grey levelsgrey-level differenceReference pixels a
r(u) grey levelsCentroid b
c pixels c
Covariance b� pixels2 d
a only for the background clusterb only for the target clustersc for each element of the vectord for each element of the matrix
3 Cluster analysis
The methods described int this section make use of theposterior probability pj(u) that pixelu is generated by clus-ter j:
pj(u) =wjfj(u)Pk wkfk(u)
(7)
Note that pj(u) is normalized to unity over clusters for eachpixel, while fj(u) is normalized to unity over pixels foreach cluster.
3.1 Cluster parameter estimation
The prior probabilitiesw0 and wj , as well as the locationparameters cj and �j , are iteratively estimated by the EMclustering algorithm ([9], section 2.7.2).
The standard ML (maximum-likelihood) EM clusteringalgorithm is used to fit the centroids and numbers of pixelsfor each cluster. In order to constrain the change of shape ofthe clusters over the image sequence, the MAP (maximum aposteriori) version of the EM algorithm ([9], section 1.6.1)is used to fit the covariances of the clusters1: the prior es-timate of a cluster covariance is given by the covariance atthe previous frame; the ML estimate is weighted by a factor1=�� according to the equation:
�(t;i)
= �(t�1;1)
+1
��
�b�(t;i) ��(t�1;1)
�(8)
where the superscript (t; i) refers to frame t, iteration i; thesuperscript (t � 1;1) refers to the value obtained at con-vergence in frame t � 1; and b�(t;i) is the ML estimate ofthe cluster covariance at frame t, iteration i. Using a con-stant weighting parameter �� , irrespective of the error of thecovariance estimates, is, of course, a simplification.
1MAP estimation of cluster covariances is the only modification of thebasic cluster tracker [10] described in this paper.
The MAP version of the EM algorithm provides a ra-tional method for combining predictions and observations,leading to low-pass filtering of cluster shapes over time. Asimple Kalman filter is not applicable in this case becausethe observation model is not linear with additive Gaussiannoise.
Any image with no moving objects can be taken as theinitial reference image, unless there are significant lightingvariations. Thereafter, the reference image and the width ofthe Laplacian distribution are updated at each frame afterconvergence of the EM algorithm for the other parameters.
The update of each pixel of the reference image isweighted by the posterior probabilities of its belonging tothe background cluster:
r(t+1)
(u) = r(t)(u) +
1
�rp(t;1)0 (u) Æ
(t)(u) (9)
where �r is the time constant of adaptation to slow changesin the background, the superscripts refer to frame numberand p
(t;1) is the value of p(u) obtained at convergence ofthe EM algorithm.
Similarly, the Laplacian width parameter �0 is estimatedas a weighted average of the absolute grey-level differences,the weight for each pixel being the posterior probability ofthe pixel belonging to the background cluster:
�(t+1)0 =
Pup(t;1)0 (u)
�� Æ(t)(u) ��Pup(t;1)0 (u)
(10)
The initial estimate for �0 (at the first frame) is obtainedfrom the median absolute value of the grey-level differencefor that frame.
3.2 Detecting new clusters
For each image frame, the cluster parameters are opti-mized, starting with the same clusters (and cluster parame-ters) as in the previous frame; and then the number of clus-ters is increased or decreased on the basis of some statisticaltest.
The tests for increasing the number of clusters are adhoc, while the tests for decreasing the number of clusters arebased on the expected decrease of free energy. Therefore,the tests for merging clusters are the last to be applied foreach frame: the rationale is that the final number of clustersfor a given frame is determined by the last test to be applied,and therefore the most principled test should be the last tobe applied.
Detecting isolated clusters: New isolated clusters are de-tected by locating maxima in the difference image, afteraccounting for the clusters already known to be present inthe previous frame of the image sequence. Specifically, a
Proceedings 3rd IEEE Int. Workshop on PETS, Copenhagen, June 1 2002
11
”weighted” image difference is computed, in which eachgrey-level difference is weighted by the probability of itsbelonging to the background cluster:
Æ0(u) = Æ(u) p(t;0)0 (u) (11)
where p(t;0)0 (u) is the estimate of p0(u) obtained with the
cluster parameters carried over from the previous frame.The weighting is necessary to avoid generating a new clus-ter where there is already a cluster present.
The weighted image difference is smoothed and down-sampled by a factor of L to obtain the coarse-grained differ-ence image Æ0(u). Local maxima of Æ0(u) are assumed toarise from new targets if the corresponding value of Æ 0(u)is greater than a threshold:
Æ0(u) > �0
�1 + log
q
2�0
�(12)
Given that �0 is estimated from the image, the thresholdis not a free parameter of the tracker.
The apparently arbitrary Eq. 12 is actually derived fromthe criterion for elimination of clusters (see below) and theprinciple that no cluster should be generated if it is almostcertain to be merged with the background. The derivation isgiven in [10].
Splitting clusters: As pointed out above, the expecteddensity for a target is well approximated by an ellipsoidaltop-hat distribution (Eq. 5), using the same centroid andcovariance as estimated with the Gaussian model. To testwhether the observed density is significantly different fromthis expectation, the ellipsoid is divided into 9 sections or-thogonally to its main axis and the squared deviation of theobserved density from the expected density is computed foreach section, and normalized by the expected density to ob-tain a �2 measure:
(observed -expected)2
expected(13)
If the largest negative deviation from the expected densityis below a threshold ��, the cluster is split at the location ofthe bin with this largest negative deviation.
In counting the numbers of pixels within each section,the pixels are weighted by the probabilities of their origi-nating from the cluster under consideration.
3.3 Merging and eliminating clusters
It has been shown [10] that the expected decrease of log-likelihood, when all pixels originating from cluster j are as-signed to cluster k (while keeping the parameters of cluster
k unchanged), is equal to
M(j; k) =
Xu
pj(u) logwjfj(u)
wkfk(u)(14)
This expected change of negative log-likelihood will be de-fined as the cost of merging cluster j into cluster k. Themerging cost is similar, but not identical, to the Kullback-Leibler divergence [2] between the clusters.
Each target cluster is tested for merging as follows:
1. The costs of merging the cluster under considerationinto any other cluster, including the background clus-ter, are evaluated.
2. The cluster is merged into the other cluster with lowestmerging cost, if this lowest cost is below a threshold�M .
Cost of eliminating clusters: In the case of merging atarget cluster into the background cluster, the parameters ofthe background cluster can be assumed to be unaffected bythe merging, because the background contains many morepixels than any other cluster. Under this approximation, themerging cost for a target cluster j into the background clus-ter is given by:
M(j; 0) = mwj
�log
%j
w0
+�j
�0+ log
2�0
q� 1
�(15)
where%j
def=
mwj
2�pj�j j
(16)
is the estimated density (within the Gaussian ellipsoid ofcluster j) of pixels originating from cluster j. The deriva-tion of Eq. 15 is given in [10]; here we provide some insightinto the equation. First, the merging cost is linear in theprior probability wj , so that a cluster generating few pixelsis more likely to be merged into the background. Second,consider the first two additive terms on the right-hand sideof Eq. 15:
� the term log(%j=w0) penalizes the elimination of clus-ters with high densities;
� the term �j=�0 penalises the elimination of a clusterhaving average (absolute-value) grey-level differencewhich is relatively large, compared to the same param-eter of the background cluster.
These terms are intuitively sensible and could be used inseparate tests for merging: Eq. 14 provides a framework forcombining these terms into a single test.
The last two additive terms on the right-hand side of Eq.15 do not depend on the parameters of the target clusterbeing tested.
Proceedings 3rd IEEE Int. Workshop on PETS, Copenhagen, June 1 2002
12
Cost of merging target clusters: Now consider the costof merging two target clusters j and l into a final clusterk. Good estimates of the parameters of cluster k can beobtained before merging, as shown in [10]. Given theseparameters, the merging cost for cluster j is equal to
M(j; k) = mwj
�log
%j
%k+
1
2D
2k(cj) +
1
2tr(�j�
�1k )� 1
�(17)
where
D2k(cj) = (cj � ck)
T � ��1k � (cj � ck) (18)
is the squared Mahalanobis distance [8] between the cen-troids of the clusters, and tr(�j�
�1k ) is the trace of the
matrix product �j��1k . The total cost of merging the two
clusters j and l is, of course, M(j; k) +M(l; k).As in the case of merging into the background, a clus-
ter including few pixels is more likely to be merged intoanother target cluster, due to the multiplicative term w j onthe right-hand side. Note also that the first three additiveterms on the right-hand side of Eq. 17 are three differentmeasures of the overlap between clusters [10]: these termspenalize merging clusters which have small overlap.
Cluster identities: When a target cluster is split into two,the larger of the new clusters is assigned the identity of theparent cluster.
When two target clusters are merged, the new cluster isassigned the identity of the larger of the two merged clus-ters, unless the smaller cluster is the parent of the largercluster, in which case the identity of the smaller cluster isassigned to the new cluster.
3.4 Algorithmic sequence for a single frame
For an image sequence, the tracker is initialized with asingle cluster (the background) and then the following se-quence is applied to each frame:
1. Detection of new isolated clusters;
2. Optimisation of cluster parameters by the EM algo-rithm;
3. Testing of all clusters for splitting;
4. If any cluster has been split: repeated optimization ofcluster parameters;
5. Testing of all clusters for merging and elimination; ifany clusters are merged, the parameters of the newclusters can be efficiently approximated by sums or av-erages of the parameters of the merged clusters: thereis no need for a further application of the EM algo-rithm.
6. Updating of the reference image and of the Laplacianwidth parameter.
It is important to note that no explicit assignment of cor-respondences is required for tracking: the final estimates ofcluster centroids at a given frame in an image sequence aresimply taken as the initial estimates for the next frame, andthen the EM method is applied.
3.5 Parameters of the tracker
The image sequences were downsampled 2� 2 times inspace and 5 times in time (i.e. the algorithm operated on 5frames/second). For the detection of new clusters, the lin-ear size of the cells, within which the grey-level differenceswere averaged, was L = 4 pixels of the downsampled im-age.
Monitoring the decrease of log-likelihood is computa-tionally expensive; therefore, the convergence criterion forthe EM algorithm is based on the displacement of clustercentroids from one EM iteration to the next: the criterionis that the maximum (over clusters) centroid displacementis less than �c = 0:5 pixels. Convergence usually requiresless than 10 iterations.
The parameters of the tracker are listed in Table 2.
Table 2. Parameters of the cluster trackerParameter Introduced in Value
time-sampling period this section 5 framesspace-sampling period this section 2� 2 pixelsa
L section 3.2 4 pixelsb
�� section 3.1 4 frames�r section 3.1 40 frames�c this section 0.5 pixelsb
�� section 3.2 6.8 pixelsb
�M section 3.2 10 pixelsb
a of the raw imageb of the downsampled image
The units for the above parameters are inferred from thecorresponding equations.
The parameters are the same as used for the PETS’2000test sequence [10], except for the spatial downsampling (de-creased from 3 � 3 to 2 � 2) and �M (decreased from 45to 10 pixels: this decrease is made possible by the off-linemerging of clusters, see below).
4 Off-line processing
During tracking, the ID numbers, centers and covari-ances of all target clusters are stored for each frame. Theseparameters can be processed very efficiently off-line to (1)
Proceedings 3rd IEEE Int. Workshop on PETS, Copenhagen, June 1 2002
13
identify super-clusters, i.e. groups of clusters moving to-gether; (2) estimate the number of people in each super-cluster; (3) estimate the number of people following pre-defined trajectories in the field of view; (4) estimate thenumber of people looking at the shop window at each frame.These processing stages are detailed below.
4.1 Detecting super-clusters
A super-cluster is defined as a group of clusters that arealways close together, in the frames in which they are visi-ble. Detection is carried out in two steps:
1. Eliminate all clusters persisting for less than �1 frames.
2. Merge into one super-cluster all clusters which appeartogether in at least one frame and whose maximum(over all frames) distance is less than a threshold �2;the distance is measured as
D2ij =
�D�2i (cj) +D
�2j (ci)
��1
(19)
4.2 Counting people in super-clusters
This task is also carried out in two steps:
1. Identify all super-clusters which contain at least oneperson, as the super-clusters which reach an area of atleast �3 (squared) pixels in at least one frame.
2. Estimate the number of people in each super-cluster byalternating between forward and backward iterationsthrough the tracking data:
� in each forward pass, increment the numberof people in a super-cluster every time anothersuper-cluster merges into it, and decrement thenumber of people every time another super-cluster splits from it;
� in each backward pass, decrement the number ofpeople in a super-cluster before another super-cluster merges into it, and increment it before an-other super-cluster splits from it.
The increments and decrements, in both forward andbackward passes, are equal to the number of people inthe super-cluster that is merged into, or split from, thesuper-cluster under consideration.
The iteration in step 2 needed to be repeated only 2 timesfor both sequence 1 and sequence 2. However, the methodis not guaranteed to converge: a better algorithm is beingdeveloped.
4.3 Obtaining the desired statistical information
Number of people looking at shop window: This num-ber is estimated, for each frame, as the sum of the numberof people in all super-clusters with centers less than V0 pix-els from the bottom of the image, and moving by less than�4 pixels from the previous frame. Thereafter, this estimateis smoothed by median filtering with a time window of Tframes.
umber of people exposed to the window display: Thisis estimated as the number of people who pass in front ofthe window. The algorithm starts by counting the numbersof people who
� are present in the first frame;
� come into view from the left, right, or top of the image;
� exit from view at the left, right, or top of the image;
� are present in the last frame.
These counts give a vector N of 8 integer numbers thatcan be inserted into a system of linear equations
N = A �M (20)
to obtain estimatesM for the numbers of people who followeach of a number of trajectories. We assume that peopledo not enter and exit from the same entry point, and thatpeople do not stay within the field of view for the entireduration of the image sequence. Under these assumptions,there are 12 possible trajectories: 6 trajectories between the3 entry points (left, right, top), 3 trajectories beginning atthe first frame and ending at one of the entry points, and 3trajectories beginning at an entry point and ending in the lastframe. Since the linear system is under-constrained, there isno unique solution. The minimum-norm solution could bechosen, but there is no guarantee that all numbers of peoplewill be non-negative.
For this reason, the solution of the linear system is ob-tained by the coefficient-update rule for least-squares non-negative matrix factorization (NMF, see Eq. 4 in [7]): thecoefficients, i.e. the number of people for each trajectory,are initialized as half the sum of the number of people atthe two ends of the trajectory; thereafter, at each iteration,the coefficients are updated according to the multiplicativeupdate rule:
M(i+1)
k =M(i)
k
ATk �N
ATk �A �M(i)
(21)
where the superscripts refer to iteration numbers. This algo-rithm is guaranteed to converge to a local minimum of thesquared prediction error kN�A �Mk2. The multiplicative
Proceedings 3rd IEEE Int. Workshop on PETS, Copenhagen, June 1 2002
14
form of the update guarantees that the signs of the elementsofM do not change.
Of course, direct counts of the number of people follow-ing each trajectory could be obtained if the tracking systemwere robust and reliable. However, when the number of bro-ken tracks is non-negligible, counting only the people thathave been tracked all the way between pairs of entry pointsleads to under-estimates.
4.4 Parameter settings for off-line processing
The parameters defined in this section were set to thefollowing values:
Table 3. Parameters for off-line processing
Parameter Introduced in Valuesubsection
�1 4.1 5 frames�2 4.1 10 a
�3 4.2 100 pixels2
�4 4.3 10 pixelsT 4.3 5 framesV0 4.3 H/2 b
a dimensionlessb H is the height of the image in pixels
In addition, it is necessary to specify how to determinewhen a cluster appears or disappears at each of the 3 entrypoints. A cluster is deemed to enter from an entry point if itis generated from the background (i.e. not by splitting an-other target cluster), and its initial centroid is located withina box bounded by the image coordinates L (left), R (right),T (top), B (bottom). The coordinates for the 3 entry pointsare given in table 4, with the convention that the bottomleft pixel of the image has coordinates (0; 0), and definingH and W as the height and width of the image in pixels,respectively:
Table 4. Bounds for entry pointsEntry point L R T B
Left 0 W/5 2H/3 0Right 4W/5 W 2H/3 0Top W/4 3W/4 H 5H/7
A cluster is deemed to exit to an entry point if it ismerged into the background cluster and its final centroidis within the bounding box defined by table 4.
5 Results and Discussion
The algorithm was tested on the first two PETS’2002people-counting test sequences. Some frames, showing the
a
b
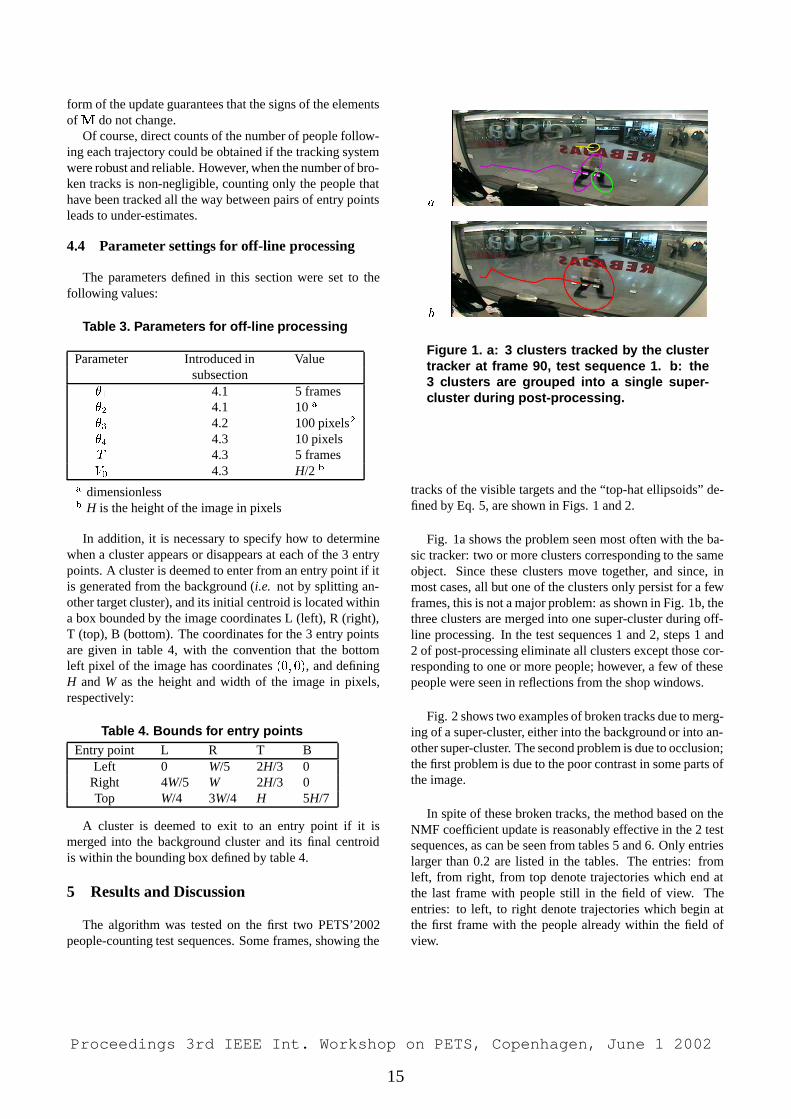
Figure 1. a: 3 clusters tracked by the clustertracker at frame 90, test sequence 1. b: the3 clusters are grouped into a single super-cluster during post-processing.
tracks of the visible targets and the “top-hat ellipsoids” de-fined by Eq. 5, are shown in Figs. 1 and 2.
Fig. 1a shows the problem seen most often with the ba-sic tracker: two or more clusters corresponding to the sameobject. Since these clusters move together, and since, inmost cases, all but one of the clusters only persist for a fewframes, this is not a major problem: as shown in Fig. 1b, thethree clusters are merged into one super-cluster during off-line processing. In the test sequences 1 and 2, steps 1 and2 of post-processing eliminate all clusters except those cor-responding to one or more people; however, a few of thesepeople were seen in reflections from the shop windows.
Fig. 2 shows two examples of broken tracks due to merg-ing of a super-cluster, either into the background or into an-other super-cluster. The second problem is due to occlusion;the first problem is due to the poor contrast in some parts ofthe image.
In spite of these broken tracks, the method based on theNMF coefficient update is reasonably effective in the 2 testsequences, as can be seen from tables 5 and 6. Only entrieslarger than 0.2 are listed in the tables. The entries: fromleft, from right, from top denote trajectories which end atthe last frame with people still in the field of view. Theentries: to left, to right denote trajectories which begin atthe first frame with the people already within the field ofview.
Proceedings 3rd IEEE Int. Workshop on PETS, Copenhagen, June 1 2002
15
a
b
c
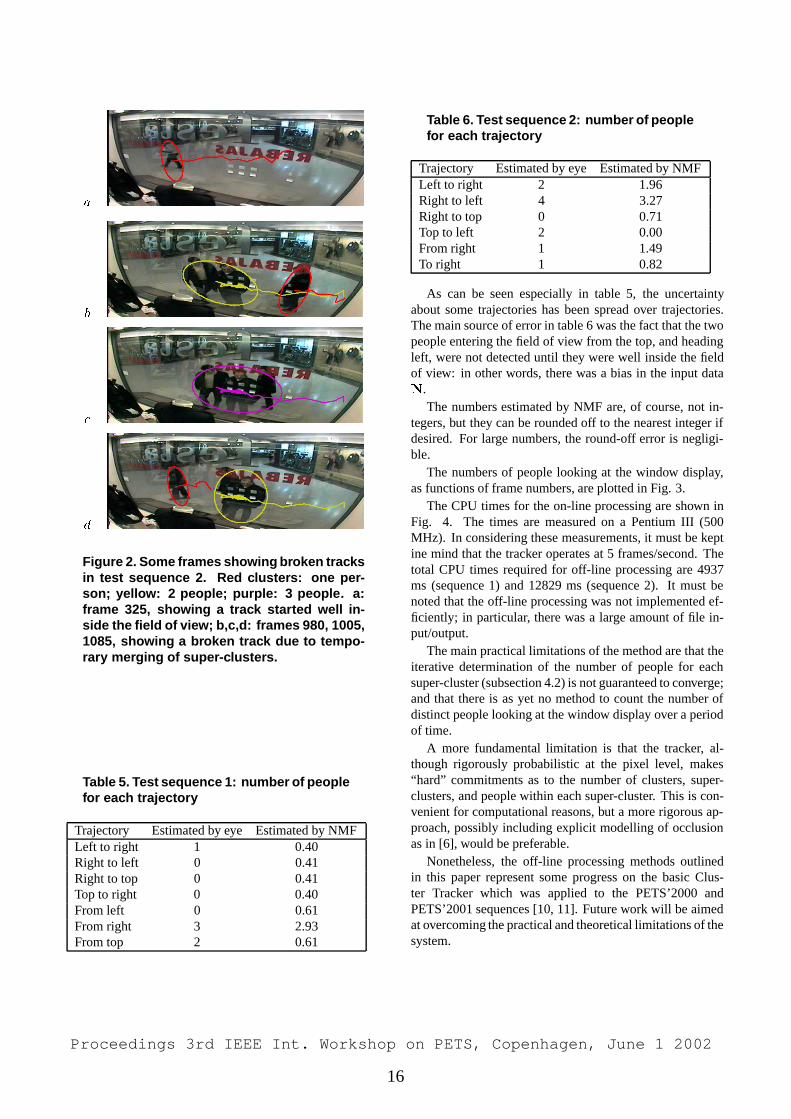
d
Figure 2. Some frames showing broken tracksin test sequence 2. Red clusters: one per-son; yellow: 2 people; purple: 3 people. a:frame 325, showing a track started well in-side the field of view; b,c,d: frames 980, 1005,1085, showing a broken track due to tempo-rary merging of super-clusters.
Table 5. Test sequence 1: number of peoplefor each trajectory
Trajectory Estimated by eye Estimated by NMFLeft to right 1 0.40Right to left 0 0.41Right to top 0 0.41Top to right 0 0.40From left 0 0.61From right 3 2.93From top 2 0.61
Table 6. Test sequence 2: number of peoplefor each trajectory
Trajectory Estimated by eye Estimated by NMFLeft to right 2 1.96Right to left 4 3.27Right to top 0 0.71Top to left 2 0.00From right 1 1.49To right 1 0.82
As can be seen especially in table 5, the uncertaintyabout some trajectories has been spread over trajectories.The main source of error in table 6 was the fact that the twopeople entering the field of view from the top, and headingleft, were not detected until they were well inside the fieldof view: in other words, there was a bias in the input dataN.
The numbers estimated by NMF are, of course, not in-tegers, but they can be rounded off to the nearest integer ifdesired. For large numbers, the round-off error is negligi-ble.
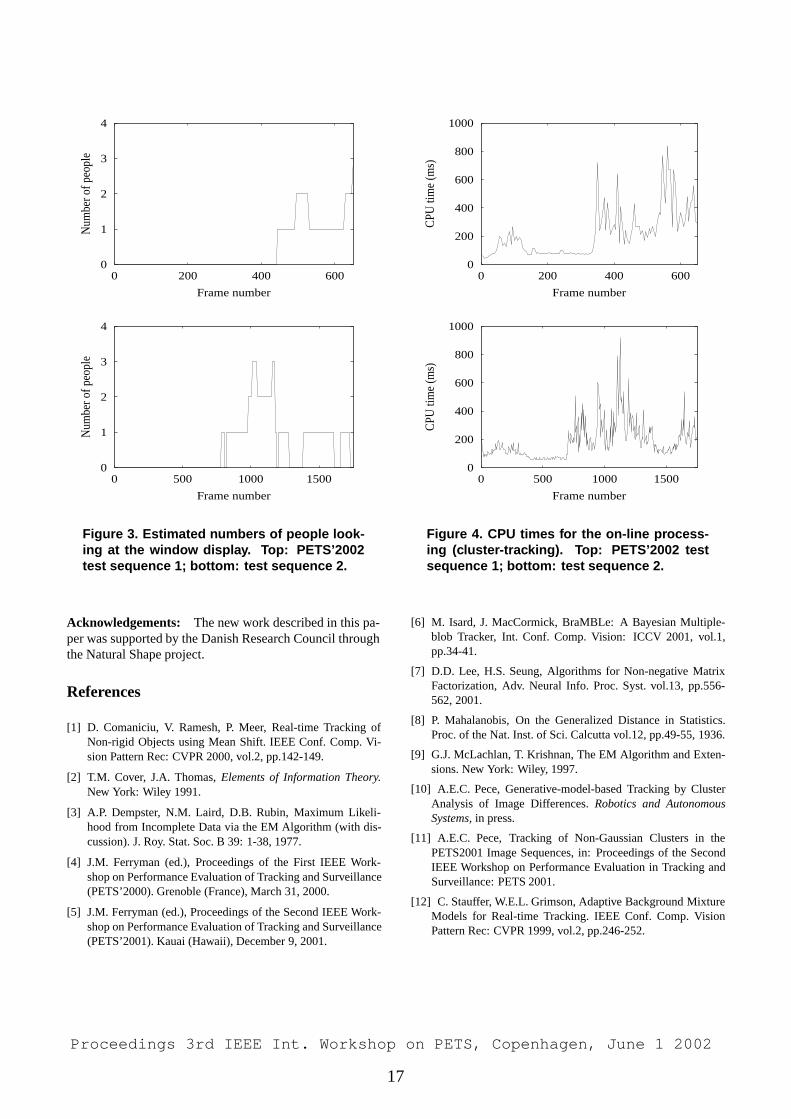
The numbers of people looking at the window display,as functions of frame numbers, are plotted in Fig. 3.
The CPU times for the on-line processing are shown inFig. 4. The times are measured on a Pentium III (500MHz). In considering these measurements, it must be keptine mind that the tracker operates at 5 frames/second. Thetotal CPU times required for off-line processing are 4937ms (sequence 1) and 12829 ms (sequence 2). It must benoted that the off-line processing was not implemented ef-ficiently; in particular, there was a large amount of file in-put/output.
The main practical limitations of the method are that theiterative determination of the number of people for eachsuper-cluster (subsection 4.2) is not guaranteed to converge;and that there is as yet no method to count the number ofdistinct people looking at the window display over a periodof time.
A more fundamental limitation is that the tracker, al-though rigorously probabilistic at the pixel level, makes“hard” commitments as to the number of clusters, super-clusters, and people within each super-cluster. This is con-venient for computational reasons, but a more rigorous ap-proach, possibly including explicit modelling of occlusionas in [6], would be preferable.
Nonetheless, the off-line processing methods outlinedin this paper represent some progress on the basic Clus-ter Tracker which was applied to the PETS’2000 andPETS’2001 sequences [10, 11]. Future work will be aimedat overcoming the practical and theoretical limitations of thesystem.
Proceedings 3rd IEEE Int. Workshop on PETS, Copenhagen, June 1 2002
16
0
1
2
3
4
0 200 400 600
Num
ber o
f peo
ple
Frame number
0
1
2
3
4
0 500 1000 1500
Num
ber o
f peo
ple
Frame number
Figure 3. Estimated numbers of people look-ing at the window display. Top: PETS’2002test sequence 1; bottom: test sequence 2.
Acknowledgements: The new work described in this pa-per was supported by the Danish Research Council throughthe Natural Shape project.
References
[1] D. Comaniciu, V. Ramesh, P. Meer, Real-time Tracking ofNon-rigid Objects using Mean Shift. IEEE Conf. Comp. Vi-sion Pattern Rec: CVPR 2000, vol.2, pp.142-149.
[2] T.M. Cover, J.A. Thomas, Elements of Information Theory.New York: Wiley 1991.
[3] A.P. Dempster, N.M. Laird, D.B. Rubin, Maximum Likeli-hood from Incomplete Data via the EM Algorithm (with dis-cussion). J. Roy. Stat. Soc. B 39: 1-38, 1977.
[4] J.M. Ferryman (ed.), Proceedings of the First IEEE Work-shop on Performance Evaluation of Tracking and Surveillance(PETS’2000). Grenoble (France), March 31, 2000.
[5] J.M. Ferryman (ed.), Proceedings of the Second IEEE Work-shop on Performance Evaluation of Tracking and Surveillance(PETS’2001). Kauai (Hawaii), December 9, 2001.
0
200
400
600
800
1000
0 200 400 600
CPU
tim
e (m
s)
Frame number
0
200
400
600
800
1000
0 500 1000 1500
CPU
tim
e (m
s)
Frame number
Figure 4. CPU times for the on-line process-ing (cluster-tracking). Top: PETS’2002 testsequence 1; bottom: test sequence 2.
[6] M. Isard, J. MacCormick, BraMBLe: A Bayesian Multiple-blob Tracker, Int. Conf. Comp. Vision: ICCV 2001, vol.1,pp.34-41.
[7] D.D. Lee, H.S. Seung, Algorithms for Non-negative MatrixFactorization, Adv. Neural Info. Proc. Syst. vol.13, pp.556-562, 2001.
[8] P. Mahalanobis, On the Generalized Distance in Statistics.Proc. of the Nat. Inst. of Sci. Calcutta vol.12, pp.49-55, 1936.
[9] G.J. McLachlan, T. Krishnan, The EM Algorithm and Exten-sions. New York: Wiley, 1997.
[10] A.E.C. Pece, Generative-model-based Tracking by ClusterAnalysis of Image Differences. Robotics and AutonomousSystems, in press.
[11] A.E.C. Pece, Tracking of Non-Gaussian Clusters in thePETS2001 Image Sequences, in: Proceedings of the SecondIEEE Workshop on Performance Evaluation in Tracking andSurveillance: PETS 2001.
[12] C. Stauffer, W.E.L. Grimson, Adaptive Background MixtureModels for Real-time Tracking. IEEE Conf. Comp. VisionPattern Rec: CVPR 1999, vol.2, pp.246-252.
Proceedings 3rd IEEE Int. Workshop on PETS, Copenhagen, June 1 2002
17
Detecting Moving Objects and their Shadows -An Evaluation with the PETS2002 Dataset
Rita Cucchiara, Costantino Grana, Andrea PratiDipartimento di Ingegneria dell’Informazione
Universita di Modena e Reggio EmiliaModena, Italy, 41100
Abstract
This work presents a general-purpose method for movingvisual object segmentation in videos and discusses resultsattained on sequences of PETS2002 datasets. The proposedapproach, called Sakbot, exploits color and motion infor-mation to detect objects, shadows and ghosts, i.e. fore-ground objects with apparent motion. The method is basedon background suppression in the color space. The main pe-culiarity of the approach is the exploitation of motion andshadow information to selectively update the background,improving the statistical background model with the knowl-edge of detected objects. The approach is able to detectMoving Visual Objects (MVOs), and stopped objects too,since the motion status is maintained at the level of trackingmodule. HSV color space is exploited for shadow detectionin order to enhance both segmentation and background up-date. Time measures and precision performance analysis intracking and counting people is provided for surveillanceand monitoring purposes.
1. Introduction
A robust tracking of objects in video streams requires amoving object detection that should be characterized bysome important features: high precision, with the twomeanings of accuracy in shape detection and reactivity tochanges in time; flexibility to different scenarios (indoor,outdoor) or to different light conditions; and efficiency, inorder to have an high frame rate. In particular, a precisemoving object detection makes tracking more reliable (thesame object can be identified more reliably from frame toframe if its shape and position are accurately detected) andfaster (multiple hypotheses on the object’s identity duringtime can be more rapidly pruned). In addition, if objectclassification is required by the application, precise detec-tion substantially supports correct classification.
Therefore, this work addresses the problem of an ac-curate moving visual object detection for people tracking,dealing with some very general scenarios as:
• Unknown objectswhose speed and trajectory is a prioriunknown;
• Unknown backgroundpossibly changing due to twofactors: a) light condition variations; b) objects thatmodify their status from stopped to moving or viceversa. If the background model is neither accurate norreactive, background suppression could cause the de-tection of false objects, here referred to as “ghost” ob-jects.
• Unknown illuminationcausing shadows whose direc-tion, shape and strength are unknown.
In the absence of any a priori knowledge about target andenvironment, the most widely adopted approach for mov-ing object detection is based onbackground suppression[1, 2, 3, 4, 5, 6, 7, 8, 9, 10, 11, 12]. Approaches based onframe difference only [13, 14] should calibrate difference independence on object speed and are not suitable when themodel of object’s motion is unknown.
The object segmentation by background suppressionwith unknown illumination is affected by the problem ofshadows [15, 16, 17] since objects and cast shadows sharethe most important feature (i.e. motion) and are often spa-tially connected. Often the points in motion of both ob-jects and their shadows are merged together and the appear-ance and geometrical properties of the object are distorted.Moreover the probability of object’s under-segmentation(where more objects are detected as a single one) increasesdue to connectivity via shadows between different objects.In [15] we proposed an approach using color appearance todetect shadows and compared it with other methods.
In this paper, we report results of PETS2002 tests us-ing our approach called Sakbot (Statistical And Knowledge-Based Object deTector). The main feature of the approach isthe integration of the knowledge of detected and classifiedobjects, shadows and ghosts in the segmentation process,both to enhance segmentation and to improve future detec-tion and background update. The approach we propose fullyexploits both motion and color information to detect and
Proceedings 3rd IEEE Int. Workshop on PETS, Copenhagen, June 1 2002
18
classify foreground objects. In [18, 19] we described theapproach and some performance measures.
Sakbot describes detected moving objects by means offeatures such as geometrical measures (area, perimeter, ...)texture (the colors and the gray-level pattern), the spatial po-sition (centroid and extent) and the motion status (moving,still, stopped). These features could be further exploited ina more or less sophisticated tracking module. In [14] wehave proposed a tracking module managing visual data ata symbolic level. It is a production rule system with for-ward chaining, formalizing the environment knowledge andthe relationships between the extracted objects. Workingat a symbolic level allows the system with flexible objecttracking over a variety of applications by simply devisingadequate rule sets. When the application is simpler andthe environment is constrained enough, the tracking modulecould be substituted by a simpler process which only keepsthe history of detected objects, their position and area. Inthis work we do not present a high-performance trackingmodule: therefore, although we provide complete results oftracking over the PETS2002 sequence, we aim at focusingon the accuracy of the low-level only. Main features are: i)the reactivity of background that in the sequence is usefulto eliminate reflection of people on the shop window, ii) theimprovements due to the use of color and shadow detectionand iii) the good time performance. Since the processingtime is not so high (and could also be improved by optimiz-ing the code), there is a large space for adding a trackingsystem with improved performance, if it is required by theapplication.
2. Related work
Most of the proposals adopt background suppression andupdate by usingstatistical functions on a sequence of themost recent sampled frames. A very simple but very ef-fective statistic is that proposed in [1]: as a backgroundmodel, the minimum and maximum values and the me-dian of inter-frame differences of the pixels’ intensities areused. In [2], themodeis used, under the hypothesis thatbackground values should be the most frequent over time.Pfinder [3] exploits the assumption that the distribution ofbackground values is Guassian and therefore each pixel ismodeled with a Guassian. Since the distribution is actu-ally not unimodal in many real situations, models based ona mixture of Gaussians have been proposed [4, 5]. How-ever, the use of multiple functions may affect video-rate per-formance, since the computational load increases with thenumber of combined functions. If a single function is used,instead, the background can be straightforwardly updatedby linearly combining the current image and the previousbackground [3, 6]; it is often referred to as adaptive back-ground update. Other proposals make use of more com-
plex models, exploiting multi-variated Gaussians with PCA[7] or maximum likelihood estimator [8]. In our work, weuse a median function in place of the mode, the Gaussian,or some higher-order statistics. Although the median fil-ter might be less sensitive in detecting low contrast objectsthan other more complex statistics such those proposed in[4, 5], it is much less computationally expensive thus eas-ing real-time execution. Moreover, with respect to othermethods that use the median operator [9, 10, 11, 12], ourmethod exploits adaptivity, since the median also considersthe previous background with an adequate weight.
Since moving objects are not part of the background,their inclusion in the background update function leadsto errors. Thus some methods propose aselectiveback-ground update to exclude those pixels detected as movingpoints. However, the use of selectivity can carry furtherproblems, when objects originally motionless in the back-ground scene, start their motion. When an object startsmoving, an apparent object called ghost (some times called“negative” as in [10]) appears in the position where the ob-ject was located, due to the difference between the currentimage and the old background value. If the ghost’s area isexcluded from the background update, the background willnever be correctly estimated causing deadlock [4]. In Sak-bot, we propose to perform this verification on the wholeobject containing the pixel, since the information on thewhole object is supposed to be more reliable. Thus weimprove the statistical background model by exploiting theknowledge of previously segmented objects.
Another major aspect of a background suppression ap-proach is how to actually remove the background from thecurrent image. The simplest approach is to threshold thedifference between the current image and the backgroundmodel with a fixed threshold. In multiple valued back-ground approaches, the most probable background is sub-tracted from the image [5] and the difference is thresholded.In [4] probability is used over N Gaussian distributions.In [6], this difference is computed separately for the threecolor components. Similarly to [6] and [12], here the differ-ence is computed separately for the three color components,and the maximum difference retained; however, two thresh-olds (low and high) are used, and thresholding is performedwith hysteresis; this approach provides good detection re-sults as will be shown in the following.
Lastly, a peculiar aspect of many proposals is the cop-ing with the shadow problem. See [15] for a comparisonof some methods. In [16], the authors propose to computethe ratio of the luminance between the current frame andthe previous frame; a point is marked as shadow if the lo-cal variance (in a neighborhood of the point) of this ratiois small (this criterion is then followed by further valida-tion). In [4], too, the ratio of the luminance of the currentframe and the background model is used. An improvement
Proceedings 3rd IEEE Int. Workshop on PETS, Copenhagen, June 1 2002
19
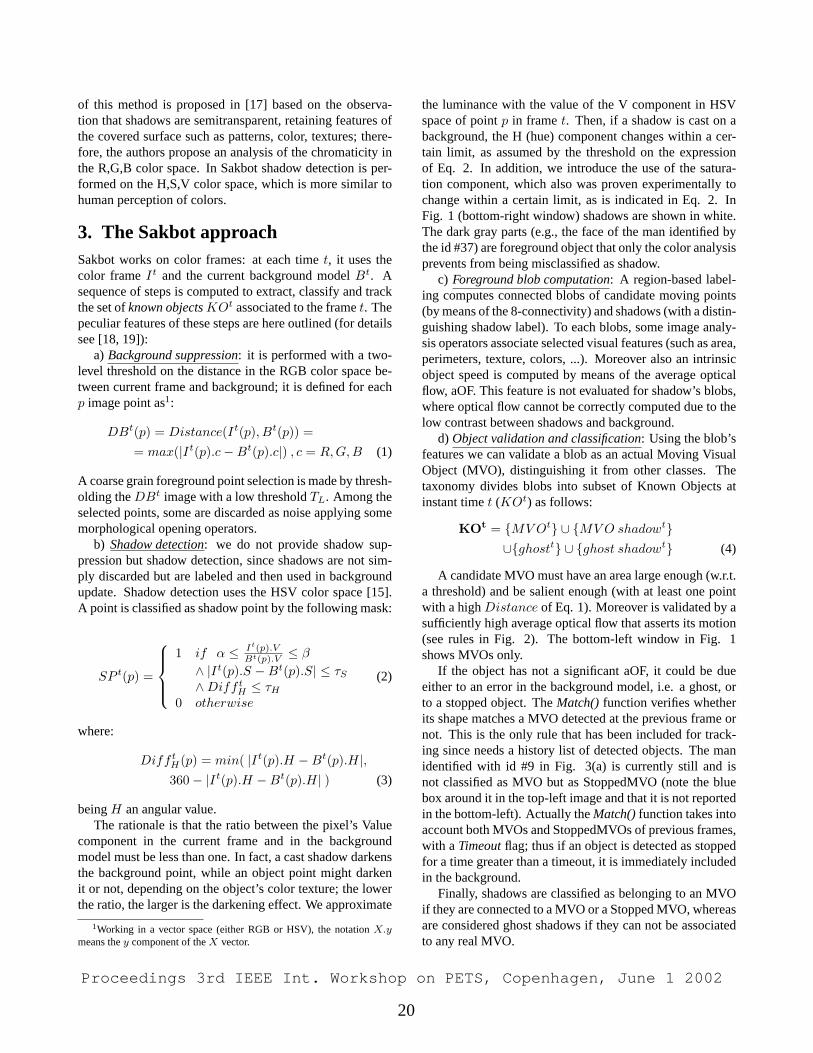
of this method is proposed in [17] based on the observa-tion that shadows are semitransparent, retaining features ofthe covered surface such as patterns, color, textures; there-fore, the authors propose an analysis of the chromaticity inthe R,G,B color space. In Sakbot shadow detection is per-formed on the H,S,V color space, which is more similar tohuman perception of colors.
3. The Sakbot approachSakbot works on color frames: at each timet, it uses thecolor frameIt and the current background modelBt. Asequence of steps is computed to extract, classify and trackthe set ofknown objectsKOt associated to the framet. Thepeculiar features of these steps are here outlined (for detailssee [18, 19]):
a) Background suppression: it is performed with a two-level threshold on the distance in the RGB color space be-tween current frame and background; it is defined for eachp image point as1:
DBt(p) = Distance(It(p), Bt(p)) == max(|It(p).c−Bt(p).c|) , c = R,G,B (1)
A coarse grain foreground point selection is made by thresh-olding theDBt image with a low thresholdTL. Among theselected points, some are discarded as noise applying somemorphological opening operators.
b) Shadow detection: we do not provide shadow sup-pression but shadow detection, since shadows are not sim-ply discarded but are labeled and then used in backgroundupdate. Shadow detection uses the HSV color space [15].A point is classified as shadow point by the following mask:
SP t(p) =
1 if α ≤ It(p).V
Bt(p).V ≤ β
∧ |It(p).S −Bt(p).S| ≤ τS
∧Diff tH ≤ τH
0 otherwise
(2)
where:
Diff tH(p) = min( |It(p).H −Bt(p).H|,360− |It(p).H −Bt(p).H| ) (3)
beingH an angular value.The rationale is that the ratio between the pixel’s Value
component in the current frame and in the backgroundmodel must be less than one. In fact, a cast shadow darkensthe background point, while an object point might darkenit or not, depending on the object’s color texture; the lowerthe ratio, the larger is the darkening effect. We approximate
1Working in a vector space (either RGB or HSV), the notationX.ymeans they component of theX vector.
the luminance with the value of the V component in HSVspace of pointp in framet. Then, if a shadow is cast on abackground, the H (hue) component changes within a cer-tain limit, as assumed by the threshold on the expressionof Eq. 2. In addition, we introduce the use of the satura-tion component, which also was proven experimentally tochange within a certain limit, as is indicated in Eq. 2. InFig. 1 (bottom-right window) shadows are shown in white.The dark gray parts (e.g., the face of the man identified bythe id #37) are foreground object that only the color analysisprevents from being misclassified as shadow.
c) Foreground blob computation: A region-based label-ing computes connected blobs of candidate moving points(by means of the 8-connectivity) and shadows (with a distin-guishing shadow label). To each blobs, some image analy-sis operators associate selected visual features (such as area,perimeters, texture, colors, ...). Moreover also an intrinsicobject speed is computed by means of the average opticalflow, aOF. This feature is not evaluated for shadow’s blobs,where optical flow cannot be correctly computed due to thelow contrast between shadows and background.
d) Object validation and classification: Using the blob’sfeatures we can validate a blob as an actual Moving VisualObject (MVO), distinguishing it from other classes. Thetaxonomy divides blobs into subset of Known Objects atinstant timet (KOt) as follows:
KOt = {MV Ot} ∪ {MV O shadowt}∪{ghostt} ∪ {ghost shadowt} (4)
A candidate MVO must have an area large enough (w.r.t.a threshold) and be salient enough (with at least one pointwith a highDistance of Eq. 1). Moreover is validated by asufficiently high average optical flow that asserts its motion(see rules in Fig. 2). The bottom-left window in Fig. 1shows MVOs only.
If the object has not a significant aOF, it could be dueeither to an error in the background model, i.e. a ghost, orto a stopped object. TheMatch() function verifies whetherits shape matches a MVO detected at the previous frame ornot. This is the only rule that has been included for track-ing since needs a history list of detected objects. The manidentified with id #9 in Fig. 3(a) is currently still and isnot classified as MVO but as StoppedMVO (note the bluebox around it in the top-left image and that it is not reportedin the bottom-left). Actually theMatch()function takes intoaccount both MVOs and StoppedMVOs of previous frames,with a Timeoutflag; thus if an object is detected as stoppedfor a time greater than a timeout, it is immediately includedin the background.
Finally, shadows are classified as belonging to an MVOif they are connected to a MVO or a Stopped MVO, whereasare considered ghost shadows if they can not be associatedto any real MVO.
Proceedings 3rd IEEE Int. Workshop on PETS, Copenhagen, June 1 2002
20
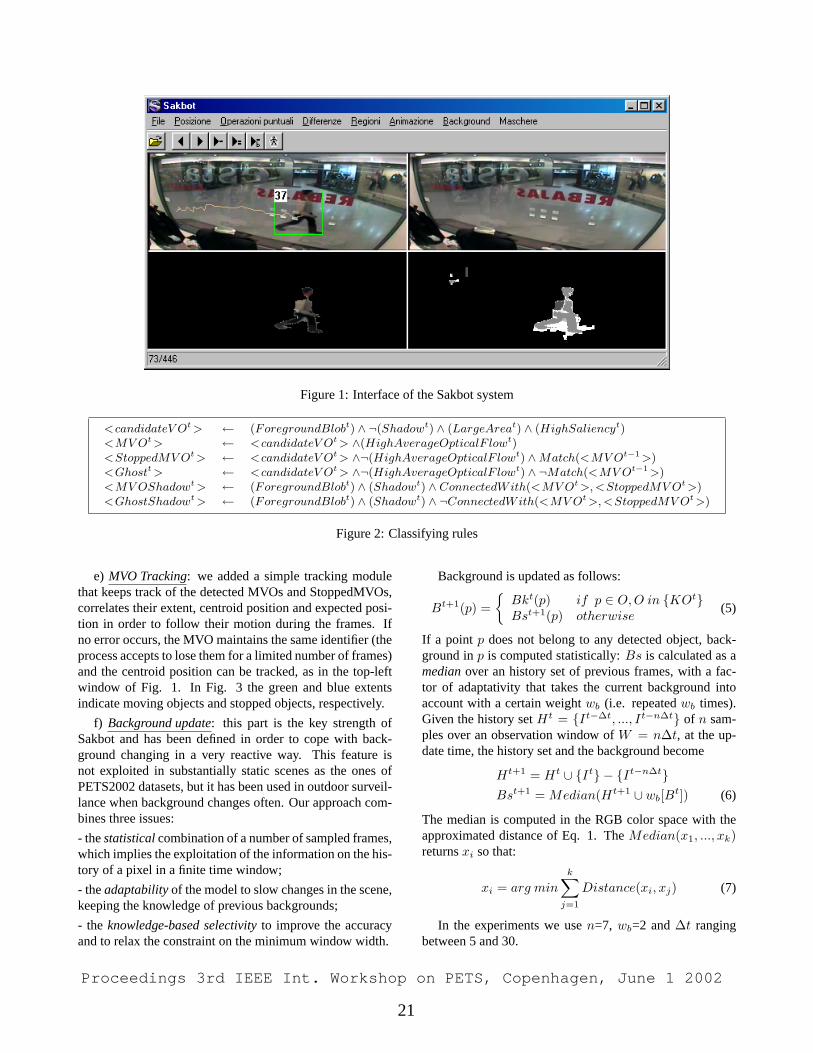
Figure 1: Interface of the Sakbot system
<candidateV Ot > ← (ForegroundBlobt) ∧ ¬(Shadowt) ∧ (LargeAreat) ∧ (HighSaliencyt)<MV Ot > ← <candidateV Ot > ∧(HighAverageOpticalF lowt)<StoppedMV Ot > ← <candidateV Ot > ∧¬(HighAverageOpticalF lowt) ∧Match(<MV Ot−1 >)<Ghostt > ← <candidateV Ot > ∧¬(HighAverageOpticalF lowt) ∧ ¬Match(<MV Ot−1 >)<MV OShadowt > ← (ForegroundBlobt) ∧ (Shadowt) ∧ ConnectedWith(<MV Ot >, <StoppedMV Ot >)<GhostShadowt > ← (ForegroundBlobt) ∧ (Shadowt) ∧ ¬ConnectedWith(<MV Ot >, <StoppedMV Ot >)
Figure 2: Classifying rules
e) MVO Tracking: we added a simple tracking modulethat keeps track of the detected MVOs and StoppedMVOs,correlates their extent, centroid position and expected posi-tion in order to follow their motion during the frames. Ifno error occurs, the MVO maintains the same identifier (theprocess accepts to lose them for a limited number of frames)and the centroid position can be tracked, as in the top-leftwindow of Fig. 1. In Fig. 3 the green and blue extentsindicate moving objects and stopped objects, respectively.
f) Background update: this part is the key strength ofSakbot and has been defined in order to cope with back-ground changing in a very reactive way. This feature isnot exploited in substantially static scenes as the ones ofPETS2002 datasets, but it has been used in outdoor surveil-lance when background changes often. Our approach com-bines three issues:
- thestatisticalcombination of a number of sampled frames,which implies the exploitation of the information on the his-tory of a pixel in a finite time window;
- theadaptabilityof the model to slow changes in the scene,keeping the knowledge of previous backgrounds;
- the knowledge-based selectivityto improve the accuracyand to relax the constraint on the minimum window width.
Background is updated as follows:
Bt+1(p) ={
Bkt(p) if p ∈ O,O in {KOt}Bst+1(p) otherwise
(5)
If a point p does not belong to any detected object, back-ground inp is computed statistically:Bs is calculated as amedianover an history set of previous frames, with a fac-tor of adaptativity that takes the current background intoaccount with a certain weightwb (i.e. repeatedwb times).Given the history setHt = {It−∆t, ..., It−n∆t} of n sam-ples over an observation window ofW = n∆t, at the up-date time, the history set and the background become
Ht+1 = Ht ∪ {It} − {It−n∆t}Bst+1 = Median(Ht+1 ∪ wb[Bt]) (6)
The median is computed in the RGB color space with theapproximated distance of Eq. 1. TheMedian(x1, ..., xk)returnsxi so that:
xi = arg min
k∑j=1
Distance(xi, xj) (7)
In the experiments we usen=7, wb=2 and∆t rangingbetween 5 and 30.
Proceedings 3rd IEEE Int. Workshop on PETS, Copenhagen, June 1 2002
21
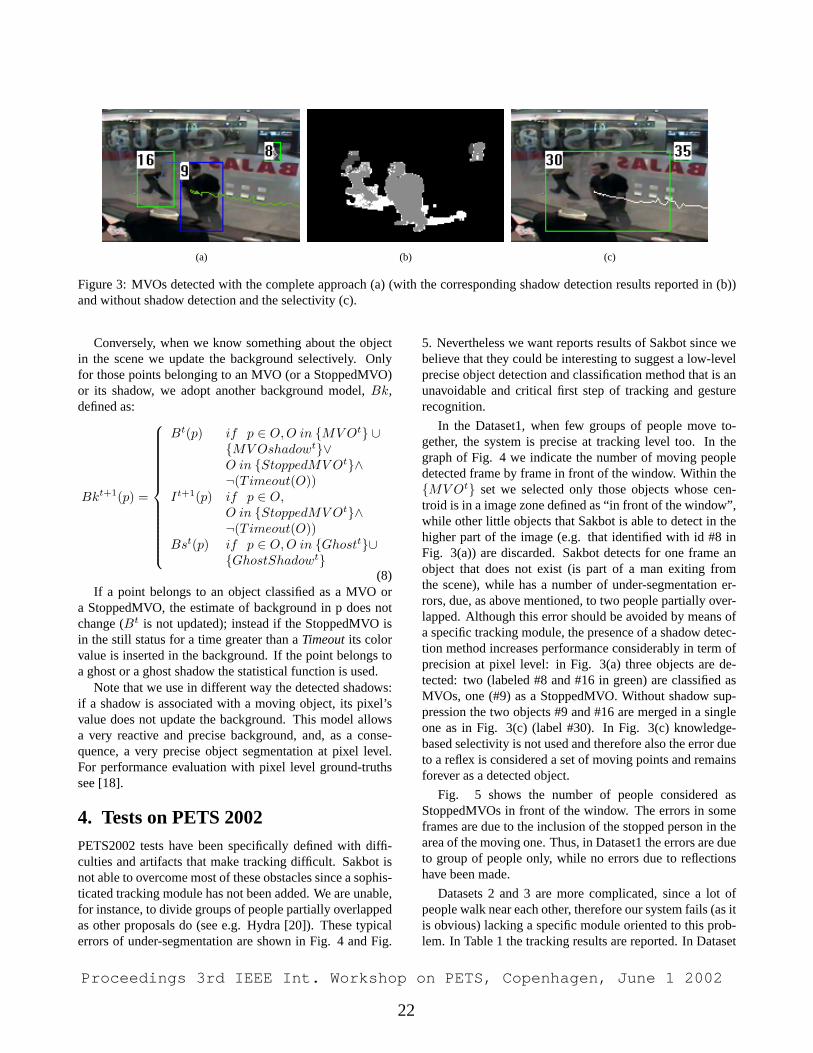
(a) (b) (c)
Figure 3: MVOs detected with the complete approach (a) (with the corresponding shadow detection results reported in (b))and without shadow detection and the selectivity (c).
Conversely, when we know something about the objectin the scene we update the background selectively. Onlyfor those points belonging to an MVO (or a StoppedMVO)or its shadow, we adopt another background model,Bk,defined as:
Bkt+1(p) =
Bt(p) if p ∈ O,O in {MV Ot} ∪{MV Oshadowt}∨O in {StoppedMV Ot}∧¬(Timeout(O))
It+1(p) if p ∈ O,O in {StoppedMV Ot}∧¬(Timeout(O))
Bst(p) if p ∈ O,O in {Ghostt}∪{GhostShadowt}
(8)If a point belongs to an object classified as a MVO or
a StoppedMVO, the estimate of background in p does notchange (Bt is not updated); instead if the StoppedMVO isin the still status for a time greater than aTimeoutits colorvalue is inserted in the background. If the point belongs toa ghost or a ghost shadow the statistical function is used.
Note that we use in different way the detected shadows:if a shadow is associated with a moving object, its pixel’svalue does not update the background. This model allowsa very reactive and precise background, and, as a conse-quence, a very precise object segmentation at pixel level.For performance evaluation with pixel level ground-truthssee [18].
4. Tests on PETS 2002PETS2002 tests have been specifically defined with diffi-culties and artifacts that make tracking difficult. Sakbot isnot able to overcome most of these obstacles since a sophis-ticated tracking module has not been added. We are unable,for instance, to divide groups of people partially overlappedas other proposals do (see e.g. Hydra [20]). These typicalerrors of under-segmentation are shown in Fig. 4 and Fig.
5. Nevertheless we want reports results of Sakbot since webelieve that they could be interesting to suggest a low-levelprecise object detection and classification method that is anunavoidable and critical first step of tracking and gesturerecognition.
In the Dataset1, when few groups of people move to-gether, the system is precise at tracking level too. In thegraph of Fig. 4 we indicate the number of moving peopledetected frame by frame in front of the window. Within the{MV Ot} set we selected only those objects whose cen-troid is in a image zone defined as “in front of the window”,while other little objects that Sakbot is able to detect in thehigher part of the image (e.g. that identified with id #8 inFig. 3(a)) are discarded. Sakbot detects for one frame anobject that does not exist (is part of a man exiting fromthe scene), while has a number of under-segmentation er-rors, due, as above mentioned, to two people partially over-lapped. Although this error should be avoided by means ofa specific tracking module, the presence of a shadow detec-tion method increases performance considerably in term ofprecision at pixel level: in Fig. 3(a) three objects are de-tected: two (labeled #8 and #16 in green) are classified asMVOs, one (#9) as a StoppedMVO. Without shadow sup-pression the two objects #9 and #16 are merged in a singleone as in Fig. 3(c) (label #30). In Fig. 3(c) knowledge-based selectivity is not used and therefore also the error dueto a reflex is considered a set of moving points and remainsforever as a detected object.
Fig. 5 shows the number of people considered asStoppedMVOs in front of the window. The errors in someframes are due to the inclusion of the stopped person in thearea of the moving one. Thus, in Dataset1 the errors are dueto group of people only, while no errors due to reflectionshave been made.
Datasets 2 and 3 are more complicated, since a lot ofpeople walk near each other, therefore our system fails (as itis obvious) lacking a specific module oriented to this prob-lem. In Table 1 the tracking results are reported. In Dataset
Proceedings 3rd IEEE Int. Workshop on PETS, Copenhagen, June 1 2002
22
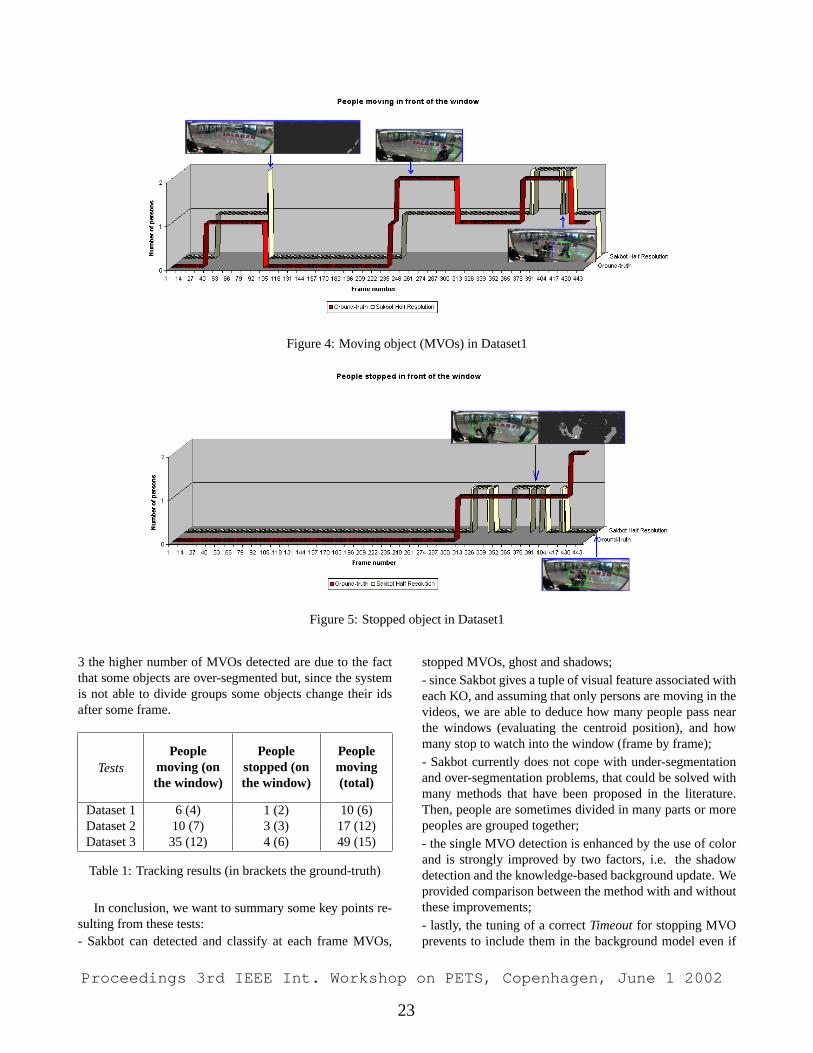
Figure 4: Moving object (MVOs) in Dataset1
Figure 5: Stopped object in Dataset1
3 the higher number of MVOs detected are due to the factthat some objects are over-segmented but, since the systemis not able to divide groups some objects change their idsafter some frame.
TestsPeople
moving (onthe window)
Peoplestopped (onthe window)
Peoplemoving(total)
Dataset 1 6 (4) 1 (2) 10 (6)Dataset 2 10 (7) 3 (3) 17 (12)Dataset 3 35 (12) 4 (6) 49 (15)
Table 1: Tracking results (in brackets the ground-truth)
In conclusion, we want to summary some key points re-sulting from these tests:- Sakbot can detected and classify at each frame MVOs,
stopped MVOs, ghost and shadows;- since Sakbot gives a tuple of visual feature associated witheach KO, and assuming that only persons are moving in thevideos, we are able to deduce how many people pass nearthe windows (evaluating the centroid position), and howmany stop to watch into the window (frame by frame);- Sakbot currently does not cope with under-segmentationand over-segmentation problems, that could be solved withmany methods that have been proposed in the literature.Then, people are sometimes divided in many parts or morepeoples are grouped together;- the single MVO detection is enhanced by the use of colorand is strongly improved by two factors, i.e. the shadowdetection and the knowledge-based background update. Weprovided comparison between the method with and withoutthese improvements;- lastly, the tuning of a correctTimeoutfor stopping MVOprevents to include them in the background model even if
Proceedings 3rd IEEE Int. Workshop on PETS, Copenhagen, June 1 2002
23
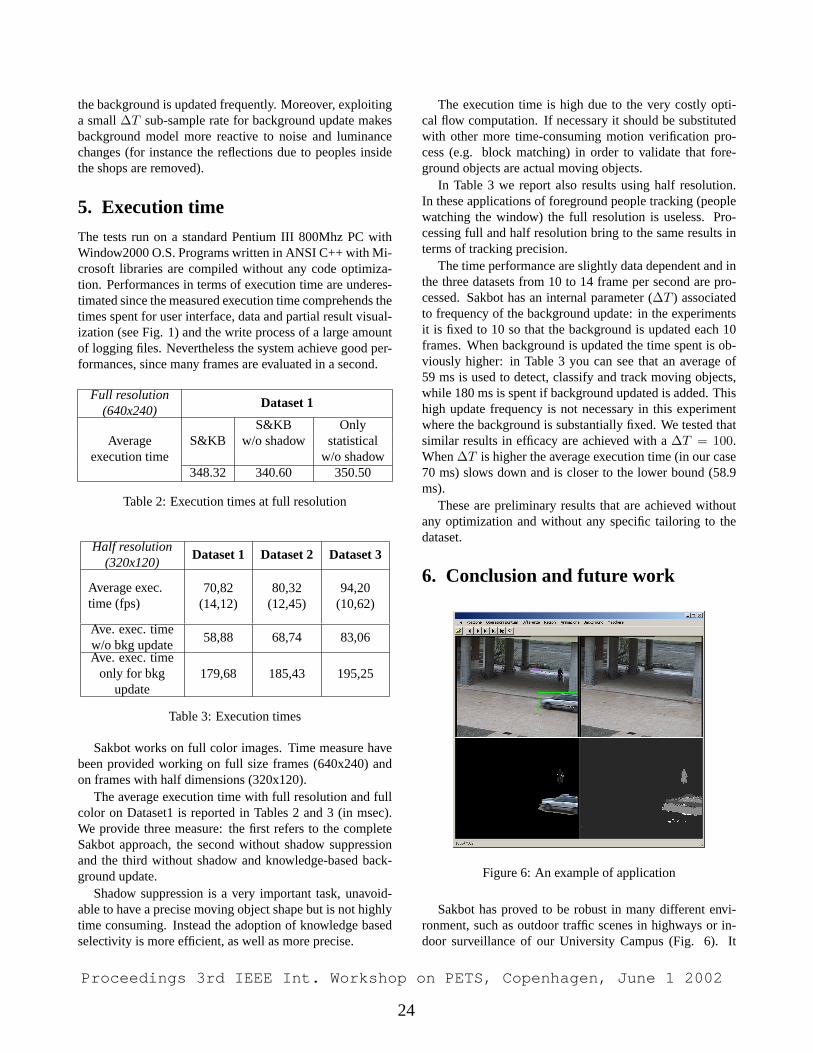
the background is updated frequently. Moreover, exploitinga small∆T sub-sample rate for background update makesbackground model more reactive to noise and luminancechanges (for instance the reflections due to peoples insidethe shops are removed).
5. Execution time
The tests run on a standard Pentium III 800Mhz PC withWindow2000 O.S. Programs written in ANSI C++ with Mi-crosoft libraries are compiled without any code optimiza-tion. Performances in terms of execution time are underes-timated since the measured execution time comprehends thetimes spent for user interface, data and partial result visual-ization (see Fig. 1) and the write process of a large amountof logging files. Nevertheless the system achieve good per-formances, since many frames are evaluated in a second.
Full resolution(640x240)
Dataset 1
S&KB OnlyAverage S&KB w/o shadow statistical
execution time w/o shadow348.32 340.60 350.50
Table 2: Execution times at full resolution
Half resolution(320x120)
Dataset 1 Dataset 2 Dataset 3
Average exec.time (fps)
70,82(14,12)
80,32(12,45)
94,20(10,62)
Ave. exec. timew/o bkg update
58,88 68,74 83,06
Ave. exec. timeonly for bkg
update179,68 185,43 195,25
Table 3: Execution times
Sakbot works on full color images. Time measure havebeen provided working on full size frames (640x240) andon frames with half dimensions (320x120).
The average execution time with full resolution and fullcolor on Dataset1 is reported in Tables 2 and 3 (in msec).We provide three measure: the first refers to the completeSakbot approach, the second without shadow suppressionand the third without shadow and knowledge-based back-ground update.
Shadow suppression is a very important task, unavoid-able to have a precise moving object shape but is not highlytime consuming. Instead the adoption of knowledge basedselectivity is more efficient, as well as more precise.
The execution time is high due to the very costly opti-cal flow computation. If necessary it should be substitutedwith other more time-consuming motion verification pro-cess (e.g. block matching) in order to validate that fore-ground objects are actual moving objects.
In Table 3 we report also results using half resolution.In these applications of foreground people tracking (peoplewatching the window) the full resolution is useless. Pro-cessing full and half resolution bring to the same results interms of tracking precision.
The time performance are slightly data dependent and inthe three datasets from 10 to 14 frame per second are pro-cessed. Sakbot has an internal parameter (∆T ) associatedto frequency of the background update: in the experimentsit is fixed to 10 so that the background is updated each 10frames. When background is updated the time spent is ob-viously higher: in Table 3 you can see that an average of59 ms is used to detect, classify and track moving objects,while 180 ms is spent if background updated is added. Thishigh update frequency is not necessary in this experimentwhere the background is substantially fixed. We tested thatsimilar results in efficacy are achieved with a∆T = 100.When∆T is higher the average execution time (in our case70 ms) slows down and is closer to the lower bound (58.9ms).
These are preliminary results that are achieved withoutany optimization and without any specific tailoring to thedataset.
6. Conclusion and future work
Figure 6: An example of application
Sakbot has proved to be robust in many different envi-ronment, such as outdoor traffic scenes in highways or in-door surveillance of our University Campus (Fig. 6). It
Proceedings 3rd IEEE Int. Workshop on PETS, Copenhagen, June 1 2002
24
can be used as a general-purpose approach for object detec-tion in conjunction with many different higher level track-ing system that can be tuned to the application.
Future works include its extension to videos taken frommoving cameras. It will be used with some suitable mod-ification to surveillance application based on moving PTZcameras with a defined path. Surveillance via Web isnow available in an experimental setup at our Lab . Seehttp:\\guilderstern.ing.unimo.it .
Eventually, we intend to use Sakbot also for a generalpurpose operator for a semantic transcoding of videos bothfrom live cameras or video-on-demand applications, in or-der to give the user only the information required, tailoredwith the user’ needs or bandwidth requirements.
Acknowledgments
We would like to thanks Prof. Trivedi (UCSD-USA) andProf. Piccardi (Sidney University of Technology, Australia)for their valuable help in many phases of this work.
References[1] I. Haritaoglu, D. Harwood, and L.S. Davis, “W4: real-time
surveillance of people and their activities,”IEEE Transac-tions on Pattern Analysis and Machine Intelligence, vol. 22,no. 8, pp. 809–830, Aug. 2000.
[2] A. Shio and J. Sklansky, “Segmentation of people in mo-tion,” in Proceedings of IEEE Workshop on Visual Motion,1991, pp. 325–332.
[3] C. Wren, A. Azarbayejani, T. Darrell, and A.P. Pentland,“Pfinder: real-time tracking of the human body,”IEEETransactions on Pattern Analysis and Machine Intelligence,vol. 19, no. 7, pp. 780–785, July 1997.
[4] A. Elgammal, D. Harwood, and L.S. Davis, “Non-parametricmodel for background subtraction,” inProceedings of IEEEICCV’99 FRAME-RATE Workshop, 1999.
[5] C. Stauffer and W.E.L. Grimson, “Learning patterns of activ-ity using real-time tracking,”IEEE Transactions on PatternAnalysis and Machine Intelligence, vol. 22, no. 8, pp. 747–757, Aug. 2000.
[6] S.J. McKenna, S. Jabri, Z. Duric, A. Rosenfeld, andH. Wechsler, “Tracking groups of people,”Computer Vi-sion and Image Understanding, vol. 80, no. 1, pp. 42–56,Oct. 2000.
[7] N.M. Oliver, B. Rosario, and A.P. Pentland, “A bayesiancomputer vision system for modeling human interactions,”IEEE Transactions on Pattern Analysis and Machine Intelli-gence, vol. 22, no. 8, pp. 831–843, Aug. 2000.
[8] N. Ohta, “A statistical approach to background suppressionfor surveillance systems,” inProceedings of IEEE Int’l Con-ference on Computer Vision, 2001, pp. 481–486.
[9] B.P.L. Lo and S.A. Velastin, “Automatic congestion detec-tion system for underground platforms,” inProceedings ofthe Int’l Symposium on Intelligent Multimedia, Video andSpeech Processing, 2000, pp. 158–161.
[10] N.T. Siebel and S.J. Maybank, “Real-time tracking of pedes-trians and vehicles,” inProceedings of IEEE Workshop onPerformance Evaluation of Tracking and Surveillance, 2001.
[11] B. Gloyer, H.K. Aghajan, K.Y. Siu, and T. Kailath, “Video-based freeway monitoring system using recursive vehicletracking,” inProceedings of SPIE Symposium on ElectronicImaging: Image and Video Processing, 1995.
[12] Q. Zhou and J.K. Aggarwal, “Tracking and classifying mov-ing objects from videos,” inProceedings of IEEE Workshopon Performance Evaluation of Tracking and Surveillance,2001.
[13] Y. Kameda and M. Minoh, “A human motion estimationmethod using 3-successive video frames,” inProceedings ofInternational Conference on Virtual Systems and Multime-dia, 1996, pp. 135–140.
[14] R. Cucchiara, M. Piccardi, and P. Mello, “Image analysis andrule-based reasoning for a traffic monitoring system,”IEEETransactions on Intelligent Transportation Systems, vol. 1,no. 2, pp. 119–130, June 2000.
[15] A. Prati, R. Cucchiara, I. Mikic, and M.M. Trivedi, “Analy-sis and detection of shadows in video streams: A compara-tive evaluation,” inProceedings of IEEE Int’l Conference onComputer Vision and Pattern Recognition, 2001, vol. 2, pp.571–576.
[16] J. Stauder, R. Mech, and J. Ostermann, “Detection of movingcast shadows for object segmentation,”IEEE Transactionson Multimedia, vol. 1, no. 1, pp. 65–76, Mar. 1999.
[17] T. Horprasert, D. Harwood, and L.S. Davis, “A statisti-cal approach for real-time robust background subtractionand shadow detection,” inProceedings of IEEE ICCV’99FRAME-RATE Workshop, 1999.
[18] R. Cucchiara, C. Grana, G. Neri, M. Piccardi, and A. Prati,The Sakbot system for moving object detection and tracking,chapter 12, pp. 145–158, in ’Video-based Surveillance Sys-tems: Computer Vision and Distributed Processing’. KluwerAcademic Publishers, Boston, Massachusetts, USA, Nov.2001.
[19] R. Cucchiara, C. Grana, M. Piccardi, and A. Prati, “Detect-ing objects, sahdows and ghosts in video streams by exploit-ing color and motion information,” inProceedings of IEEEInt’l Conference on Image Analysis and Processing, 2001,pp. 360–365.
[20] I. Haritaoglu, D. Harwood, and L.S. Davis, “Hydra: multi-ple people detection and tracking using silhouettes,” inPro-ceedings of IEEE Int’l Conference on Image Analysis andProcessing, 1999, pp. 280–285.
Proceedings 3rd IEEE Int. Workshop on PETS, Copenhagen, June 1 2002
25
Performance Metrics and Methods for Tracking in Surveillance
Tim Ellis Information Engineering Centre
School of Engineering City University, London
Abstract Performance evaluation has become an increasingly important feature of video surveillance systems, as researchers attempt to assess the reliability and robustness of their operation. Although many algorithms and systems have been developed to address the problem of detecting and tracking moving objects in the image, few systems have been tested in anything other than fairly ideal conditions. In order to satisfy the requirements of a real video surveillance task, the algorithms will need to be assessed over a wide range of conditions. The aim of this paper is to examine some of the main requirements for effective performance analysis and to examine methods for characterising video datasets.
1. Introduction Performance evaluation has become an increasingly important feature of video surveillance systems, as researchers attempt to assess the reliability and robustness of their operation. Although many algorithms and systems have been developed to address the problem of detecting and tracking moving objects in the image, few systems have been tested in anything than other than fairly ideal conditions [1,24,6]. A widely used characteristic of performance is processing time. The current availability of high-performance, low-cost PC’s is an enabling technology for real-time surveillance systems, and an increasing number of papers in the area reflect this by demonstrating on-line operation of their algorithms. However, in this paper we will focus on the issues of evaluating the quality of the algorithms to detect, locate and follow a target (generally either a pedestrian or a vehicle) as it moves through the environment. The emphasis will be on outdoor environments, where the video analysis must cope with a wide range of
disturbing conditions. Issues involve quality of segmentation, static and dynamic occlusion, effects of natural and artificial illumination (e.g. shadows) and variations of illumination intensity, spurious motions (e.g. vegetation) and a plethora of weather-related problems. The need for performance analysis falls into three principal requirements:
i) to demonstrate the robustness and correctness of the algorithm, ii) to allow comparison between alternative algorithms, iii) to assess the improvements in performance resulting from incremental algorithm development.
In order to satisfy the requirements of a real video surveillance task, the algorithms will need to be quantitatively assessed over a wide range of conditions. In the first part of this paper we identify the principal sources of disturbing influences, which can be considered as a form of noise or error. In the second part we attempt to categorise metrics that have been used to characterise the performance of both detection and tracking algorithms. A characteristic of surveillance systems is that they may impose quite different requirements on the image analysis algorithms according to the task they are trying to solve. Whilst one system may require highly reliable tracking of a target over potentially long time periods, e.g. a surveillance logging system, with other tasks the aim might be to identify specific events occurring in the image data (e.g. a crime taking place). In some situations, frame-to-frame correspondence is crucial, whilst in other cases the need is not so critical. In the next section we consider the need for comprehensive datasets to satisfy the requirement of evaluation on a sufficiently representative set of sequences, encompassing the variability of conditions and scenarios in which the surveillance system must operate. Section 3 considers the pre-cursor to performance assessment, namely the
Proceedings 3rd IEEE Int. Workshop on PETS, Copenhagen, June 1 2002
26
generation of ground truth, and the characterisation of the video datasets. Section 4 develops a taxonomy of errors that can be used to characterise each stage of a typical tracking system. Section 5 catalogues a number of commonly used metrics for tracking assessment. Section 6 briefly presents results for video dataset characterisation. Section 7 provides discussion on some of the issues raised in the paper, and makes some recommendations.
2. Video Datasets Whilst inevitably, researchers tend to assess the performance of their algorithms on locally-generated datasets, the advantage of testing on widely available and appropriate video sequences provide an important opportunity for benchmarking. Of course this pre-supposes that the goals of each task are broadly similar. This is of course the raison d’etre of the PETS workshops, and several different data sets are now available as a result. In this section we consider the need for testing our algorithms on a diverse range of video datasets, covering a range of realistic conditions. We can first consider the variety of natural conditions that will impact on the robustness and reliability of the detection and tracking algorithms. 1. weather conditions – wind, rain and snow can all have a dramatic effect on the appearance of the scene under observation, as indicated below. 2. illumination variations occur due to solar rotation; direct sunlight vs. overcast conditions; night-time and artificial lighting (e.g. street lighting, car headlights). 3. irrelevant motion can be generated from a wide variety of different sources: wind-related (e.g. vegetation, flags), shadows (e.g. people, clouds), reflections (e.g. puddles on road, windows) and transparent surfaces (windows). Many of these conditions will impact in several different ways – for instance, falling snow may be detected by the motion detection algorithm; the average scene brightness levels will rise significantly because snow has a very high coefficient of reflectance; motion of targets through the snow may leave visible tracks and the resulting thaw will generate highly reflective puddles on the ground. We can easily identify the ‘ideal’ imaging conditions for detection and tracking, as it is frequently adopted by many researchers to demonstrate the performance of their
algorithms – a calm, dry, well-lit but overcast day - which avoids many of the issues associated with the conditions described above. The standard method of coping with some (though not all) of these conditions is to use a detection algorithm that adapts to both the short-term and long-term illumination conditions. The approach of Grimson [3] has been widely adopted, based on estimating several possible backgrounds using a mixture of gaussian distributions estimated at each pixel over time. Although Grimson reports success with the method running continuously over a long time period (in excess of 16 months [5]) and hence a wide range of weather and illumination conditions, he provides no critical evaluation of the method. In addition, the imaging geometry uses cameras mounted on high vantage points, observing areas in the scene from considerable distance, and certainly some of the deleterious effects of the weather would be masked. A further property of the datasets lies with the complexity and variability of the perceptual challenges present in the sequence. Dataset complexity can be characterised by many types of mechanism: the level of target interactions, the frequency and complexity of dynamic occlusions, the duration of targets behind static occlusions and the distinctiveness of the targets (e.g. if they are all different colours) to name but a few. Only by ensuring that the datasets contain a sufficiently rich and diverse range of perceptual challenges can the tracking algorithm be adequately tested. For example, a video sequence acquired under ideal imaging conditions containing only one highly distinctive target object at any particular time is unlikely to provide any convincing results as demonstration of a real surveillance system. Whilst such a dataset may be appropriate for calibration and training of the system, its use for performance assessment is limited, to say the least! An element missing from the assessment process is a measure(s) to characterise the complexity/difficulty of the video dataset. From the elements discussed to date, we investigate two types of measure, the first characterising the pixel-based image variations, and the second capturing the complexity of the perceptual task. For the frame-by-frame pixel variations there are several ways to quantify the pixel intensities. A standard measure of image
Proceedings 3rd IEEE Int. Workshop on PETS, Copenhagen, June 1 2002
27
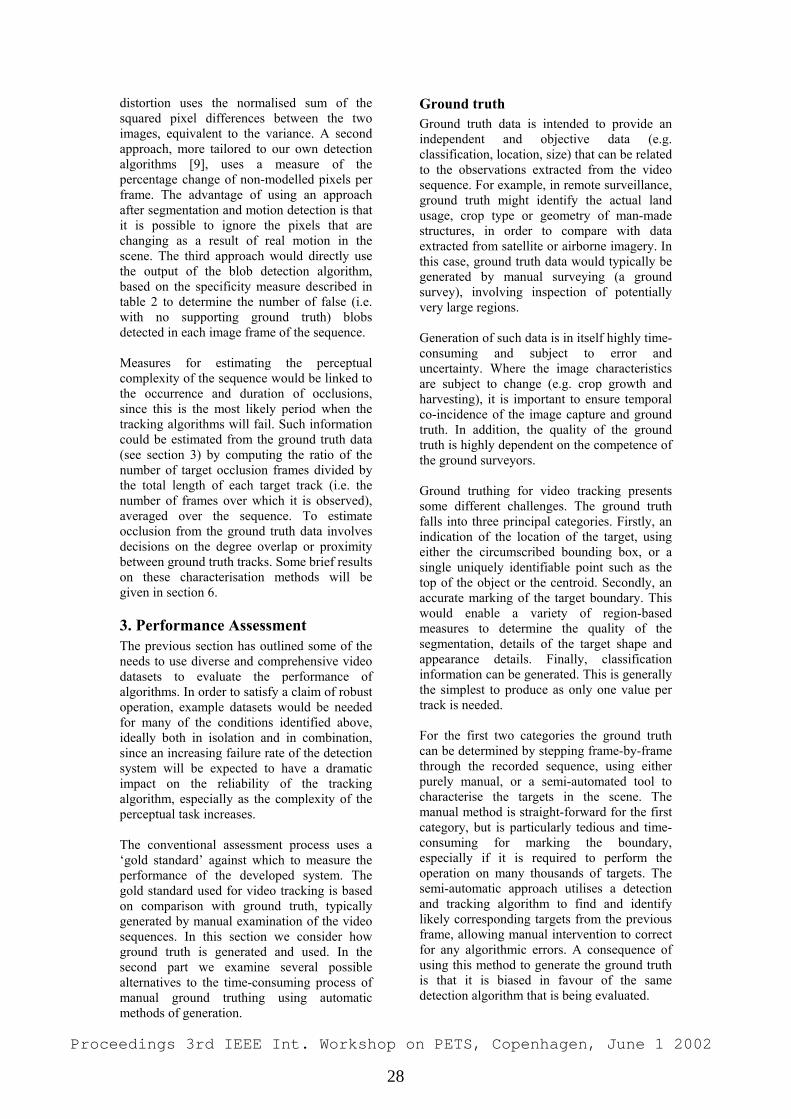
distortion uses the normalised sum of the squared pixel differences between the two images, equivalent to the variance. A second approach, more tailored to our own detection algorithms [9], uses a measure of the percentage change of non-modelled pixels per frame. The advantage of using an approach after segmentation and motion detection is that it is possible to ignore the pixels that are changing as a result of real motion in the scene. The third approach would directly use the output of the blob detection algorithm, based on the specificity measure described in table 2 to determine the number of false (i.e. with no supporting ground truth) blobs detected in each image frame of the sequence. Measures for estimating the perceptual complexity of the sequence would be linked to the occurrence and duration of occlusions, since this is the most likely period when the tracking algorithms will fail. Such information could be estimated from the ground truth data (see section 3) by computing the ratio of the number of target occlusion frames divided by the total length of each target track (i.e. the number of frames over which it is observed), averaged over the sequence. To estimate occlusion from the ground truth data involves decisions on the degree overlap or proximity between ground truth tracks. Some brief results on these characterisation methods will be given in section 6.
3. Performance Assessment The previous section has outlined some of the needs to use diverse and comprehensive video datasets to evaluate the performance of algorithms. In order to satisfy a claim of robust operation, example datasets would be needed for many of the conditions identified above, ideally both in isolation and in combination, since an increasing failure rate of the detection system will be expected to have a dramatic impact on the reliability of the tracking algorithm, especially as the complexity of the perceptual task increases. The conventional assessment process uses a ‘gold standard’ against which to measure the performance of the developed system. The gold standard used for video tracking is based on comparison with ground truth, typically generated by manual examination of the video sequences. In this section we consider how ground truth is generated and used. In the second part we examine several possible alternatives to the time-consuming process of manual ground truthing using automatic methods of generation.
Ground truth Ground truth data is intended to provide an independent and objective data (e.g. classification, location, size) that can be related to the observations extracted from the video sequence. For example, in remote surveillance, ground truth might identify the actual land usage, crop type or geometry of man-made structures, in order to compare with data extracted from satellite or airborne imagery. In this case, ground truth data would typically be generated by manual surveying (a ground survey), involving inspection of potentially very large regions. Generation of such data is in itself highly time-consuming and subject to error and uncertainty. Where the image characteristics are subject to change (e.g. crop growth and harvesting), it is important to ensure temporal co-incidence of the image capture and ground truth. In addition, the quality of the ground truth is highly dependent on the competence of the ground surveyors. Ground truthing for video tracking presents some different challenges. The ground truth falls into three principal categories. Firstly, an indication of the location of the target, using either the circumscribed bounding box, or a single uniquely identifiable point such as the top of the object or the centroid. Secondly, an accurate marking of the target boundary. This would enable a variety of region-based measures to determine the quality of the segmentation, details of the target shape and appearance details. Finally, classification information can be generated. This is generally the simplest to produce as only one value per track is needed. For the first two categories the ground truth can be determined by stepping frame-by-frame through the recorded sequence, using either purely manual, or a semi-automated tool to characterise the targets in the scene. The manual method is straight-forward for the first category, but is particularly tedious and time-consuming for marking the boundary, especially if it is required to perform the operation on many thousands of targets. The semi-automatic approach utilises a detection and tracking algorithm to find and identify likely corresponding targets from the previous frame, allowing manual intervention to correct for any algorithmic errors. A consequence of using this method to generate the ground truth is that it is biased in favour of the same detection algorithm that is being evaluated.
Proceedings 3rd IEEE Int. Workshop on PETS, Copenhagen, June 1 2002
28
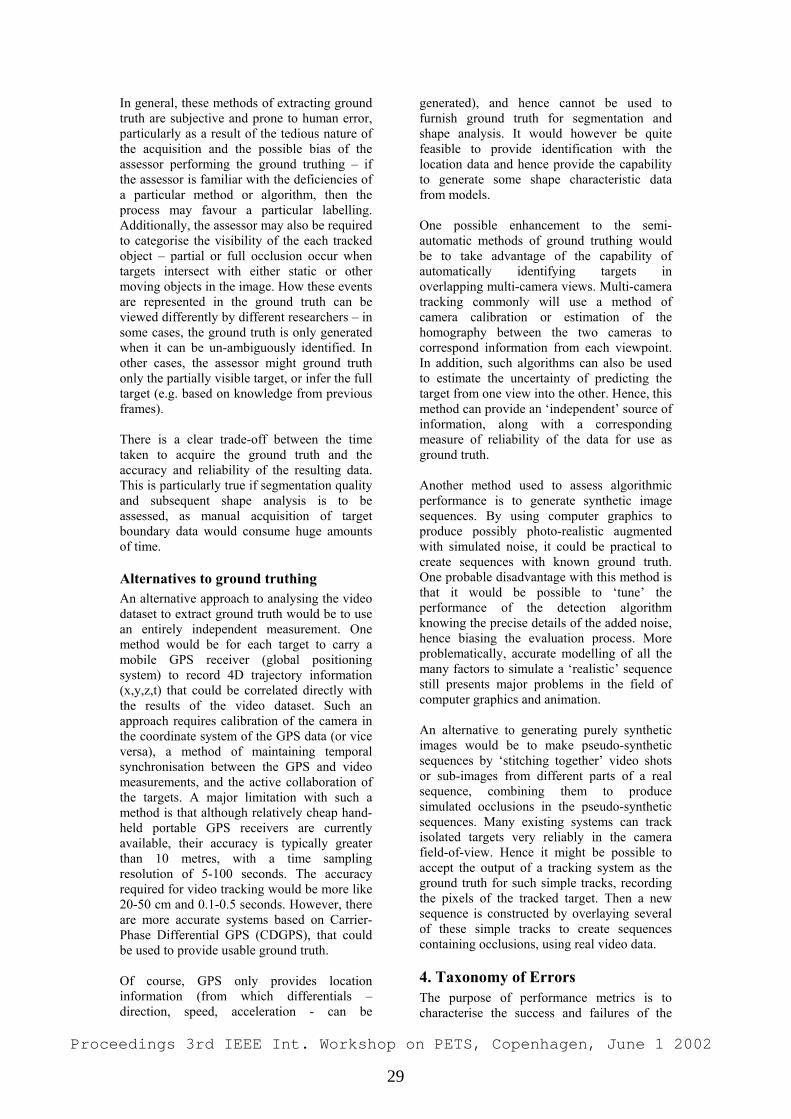
In general, these methods of extracting ground truth are subjective and prone to human error, particularly as a result of the tedious nature of the acquisition and the possible bias of the assessor performing the ground truthing – if the assessor is familiar with the deficiencies of a particular method or algorithm, then the process may favour a particular labelling. Additionally, the assessor may also be required to categorise the visibility of the each tracked object – partial or full occlusion occur when targets intersect with either static or other moving objects in the image. How these events are represented in the ground truth can be viewed differently by different researchers – in some cases, the ground truth is only generated when it can be un-ambiguously identified. In other cases, the assessor might ground truth only the partially visible target, or infer the full target (e.g. based on knowledge from previous frames). There is a clear trade-off between the time taken to acquire the ground truth and the accuracy and reliability of the resulting data. This is particularly true if segmentation quality and subsequent shape analysis is to be assessed, as manual acquisition of target boundary data would consume huge amounts of time.
Alternatives to ground truthing An alternative approach to analysing the video dataset to extract ground truth would be to use an entirely independent measurement. One method would be for each target to carry a mobile GPS receiver (global positioning system) to record 4D trajectory information (x,y,z,t) that could be correlated directly with the results of the video dataset. Such an approach requires calibration of the camera in the coordinate system of the GPS data (or vice versa), a method of maintaining temporal synchronisation between the GPS and video measurements, and the active collaboration of the targets. A major limitation with such a method is that although relatively cheap hand-held portable GPS receivers are currently available, their accuracy is typically greater than 10 metres, with a time sampling resolution of 5-100 seconds. The accuracy required for video tracking would be more like 20-50 cm and 0.1-0.5 seconds. However, there are more accurate systems based on Carrier-Phase Differential GPS (CDGPS), that could be used to provide usable ground truth. Of course, GPS only provides location information (from which differentials – direction, speed, acceleration - can be
generated), and hence cannot be used to furnish ground truth for segmentation and shape analysis. It would however be quite feasible to provide identification with the location data and hence provide the capability to generate some shape characteristic data from models. One possible enhancement to the semi-automatic methods of ground truthing would be to take advantage of the capability of automatically identifying targets in overlapping multi-camera views. Multi-camera tracking commonly will use a method of camera calibration or estimation of the homography between the two cameras to correspond information from each viewpoint. In addition, such algorithms can also be used to estimate the uncertainty of predicting the target from one view into the other. Hence, this method can provide an ‘independent’ source of information, along with a corresponding measure of reliability of the data for use as ground truth. Another method used to assess algorithmic performance is to generate synthetic image sequences. By using computer graphics to produce possibly photo-realistic augmented with simulated noise, it could be practical to create sequences with known ground truth. One probable disadvantage with this method is that it would be possible to ‘tune’ the performance of the detection algorithm knowing the precise details of the added noise, hence biasing the evaluation process. More problematically, accurate modelling of all the many factors to simulate a ‘realistic’ sequence still presents major problems in the field of computer graphics and animation. An alternative to generating purely synthetic images would be to make pseudo-synthetic sequences by ‘stitching together’ video shots or sub-images from different parts of a real sequence, combining them to produce simulated occlusions in the pseudo-synthetic sequences. Many existing systems can track isolated targets very reliably in the camera field-of-view. Hence it might be possible to accept the output of a tracking system as the ground truth for such simple tracks, recording the pixels of the tracked target. Then a new sequence is constructed by overlaying several of these simple tracks to create sequences containing occlusions, using real video data.
4. Taxonomy of Errors The purpose of performance metrics is to characterise the success and failures of the
Proceedings 3rd IEEE Int. Workshop on PETS, Copenhagen, June 1 2002
29
algorithms measured against the ‘true’ values as described by the ground truth. We can categorise the errors into one of the following types: Type 1: segmentation - determine the quality of the final shape representation of the detected target. Type 2: detection performance - provides a yes/no decision of the presence of the target in the image. Type 3: track completeness – identifies the number and quality of the fit over the complete track. Type 4: target classification – determines the identity of the target. Type 5 – event / activity / behaviour classification – represents a high-level interpretation of what is happening in the scene. In the next section we consider some of the most widely used performance metrics. The metrics can be applied separately to quantify each of the error types described above, or cumulatively over the entire dataset. An important function of the performance assessment is the ability to provide a comparison between different algorithms, on different datasets and to monitor incremental improvements in algorithm development. Although highly desirable for such comparison purposes, it seems unlikely that a single (one-fits-all) measure of detection and tracking performance would be able to capture that range of errors that can corrupt the observations extracted from the image. Hence part of the challenge of performance assessment is to determine how the metrics can be compared.
5. Tracking Metrics Error metrics fall into two broad categories: the first are based on standard statistical methods of comparing two populations of values which are derived from observations against their true or expected values. In this case, the ground truth is used as the true values to be compared against the measurement data from the image analysis. Secondly, numeric scores are used computed to quantify the accuracy of the detection or tracking algorithm: average positional and velocity errors; average number of observations before tracking is initiated; average number of frames before tracking is terminated etc. Such measures may be computed directly from the algorithm (e.g. from the covariances associated with a Kalman tracker) or from the final observations of each target. The measures may
be computed for pixel data, or for 3D or 2d ground-plane data derived from a camera calibration process. In this case, it will be necessary to convert the ground truth values (generally acquired in pixel coordinates) into 2 or 3D scene coordinates. The comparison of observed and true values generates a 2x2 contingency table that expresses the correct and false matches between the two populations based on: i) true positives – the number of observations confirmed by the ground truth ii) false positives – the number of observations not matched in the ground truth iii) true negatives – the number of observations rejected as belonging to the ground truth iv) false negatives – the number of observations erroneously accepted as belonging to the ground truth Ground truth Observations positive negative positive Ntp Nfp negative Nfn Ntn Table 1. 2x2 contingency table. The following values or indexes are derived from the comparisons between true and observed:
Name Index detection rate (sensitivity) Ntp/(Ntp+Nfn) specificity Ntn/(Ntn+Nfp) accuracy (Ntn+Ntp)/N positive predictive value Ntp/(Ntp+Nfp) false negative rate Nfn/(Ntp+Nfn) false positive rate Nfp/(Nfp+Ntn) negative predictive value Ntn/(Ntn+Nfn) This scoring process can be applied at different stages to the performance analysis of the video data: to the results of the segmentation process, on a frame-by-frame basis, on a per track basis, collectively over all the tracks in the data sequence(s) and to the classification decision for each track.
6. Results The following demonstrates one of the methods for estimating the image variation due to illumination changes. Figures 1 and 2 show the variation of the standard deviation estimated from the frame-by-frame differences of the PETS2001 dataset 1 and 3 sequences (camera 1). The sequences are both sub-sampled to 1 frame-per-second. As can be
Proceedings 3rd IEEE Int. Workshop on PETS, Copenhagen, June 1 2002
30
seen, the increased variation of the illumination is clearly visible in dataset 3.
0 500 1000 1500 2000 2500
5
10
15
20
25
30
35
Frame Number
Sta
ndar
d D
evia
tion
Figure 1. Intensity variation for PETS2001 dataset 1 (camera 1).
0 500 1000 1500 2000 2500 3000 3500 4000 4500 50000
5
10
15
20
25
30
35
Frame Number
Sta
ndar
d D
evia
tion
Figure 2. Intensity variation for PETS2001 dataset 3 (camera 1).
7. Discussion and Conclusions The video surveillance research community would benefit from adopting standards for format of ground truth data structure, and also generation of tracking output (e.g. similar to the PETS XML format). It may be more efficient for individual groups to produce ground-truthed datasets that start to fill the void, covering a wider range of environmental conditions and different levels of perceptual task complexity. Where datasets are ground-truthed using automatic or semi-automatic methods, it must be recognised that the ground truth data will favourably biased towards the algorithm used, and hence subsequent performance evaluation may be compromised if applied to the same algorithm. We can pose a number of questions for addressing the performance evaluation task: How do we ground truth reliably and consistently? How do we characterise the degree of difficulty of the video datasets – both the image data and the perceptual complexity?
Perhaps these questions can be addressed with the use (and availability) of common ground-truthing standards and accepted and commonly-used assessment criteria.
Acknowledgements
This work was undertaken with support from the Engineering and Physical Science Research Council (EPSRC) under grant number GR/M58030. Thanks to Ming Xu and Dimitrios Makris.
References 1. A. Senior, A. Hampapur, Y-L Tian, L. Brown,
S. Pankanti and R. Bolle. Appearance Models for occlusion handling. In Proc. IEEE Workshop on Performance Evaluation for Tracking and Surveillance, 2001.
2. A. Theil, R.A.W. Kemp, K. Romeo, L.J.H.M. Kester, E. Bosse. Classification of moving objects in surveillance algorithms. In Proc. IEEE Workshop on Performance Evaluation for Tracking and Surveillance, pp. 80-84, 2000.
3. W. Grimson, C. Stauffer, R. Romano and L. Lee. Using adaptive tracking to classify and monitor activites in a site. In Conference on Computer Vision and Pattern Recognition, pp. 22-29, 1998.
4. G. Pingali and J. Segen. Performance evaluation of people tracking systems. In Proc. IEEE Workshop on Applications of Computer Vision, pp. 33-38, 1996.
5. C. Stauffer, W.E.L. Grimson. Learning patterns of activity using real-time tracking. IEEE Transactions on Pattern Analysis and Machine Intelligence, 22, no 8, pp. 747-757, August 2000.
6. J. Orwell, P. Remagnino, G. Jones. From connected components to object sequences. In Proc. IEEE Workshop on Performance Evaluation for Tracking and Surveillance, pp. 72-79, 2000.
7. B. E. Fridling, and O. E. Drummond, Performance Evaluation For Multiple Target Tracking Algorithms, Signal and Data Processing of Small Targets 1991, Proc. SPIE, Vol. 1481, pp. 371-383, April 1991.
8. R. L. Rothrock and O. E. Drummond, Performance Metrics for Multiple-Sensor, Multiple-Target Tracking, Signal and Data Processing of Small Targets 2000, Proceedings SPIE, Vol. 4048, pp. 521-531, 2000.
9. Xu M, Ellis T, “Illumination-invariant motion detection using colour mixture models”, in Proc. BMVC2001, Manchester, Sept. 2001.
Proceedings 3rd IEEE Int. Workshop on PETS, Copenhagen, June 1 2002
31
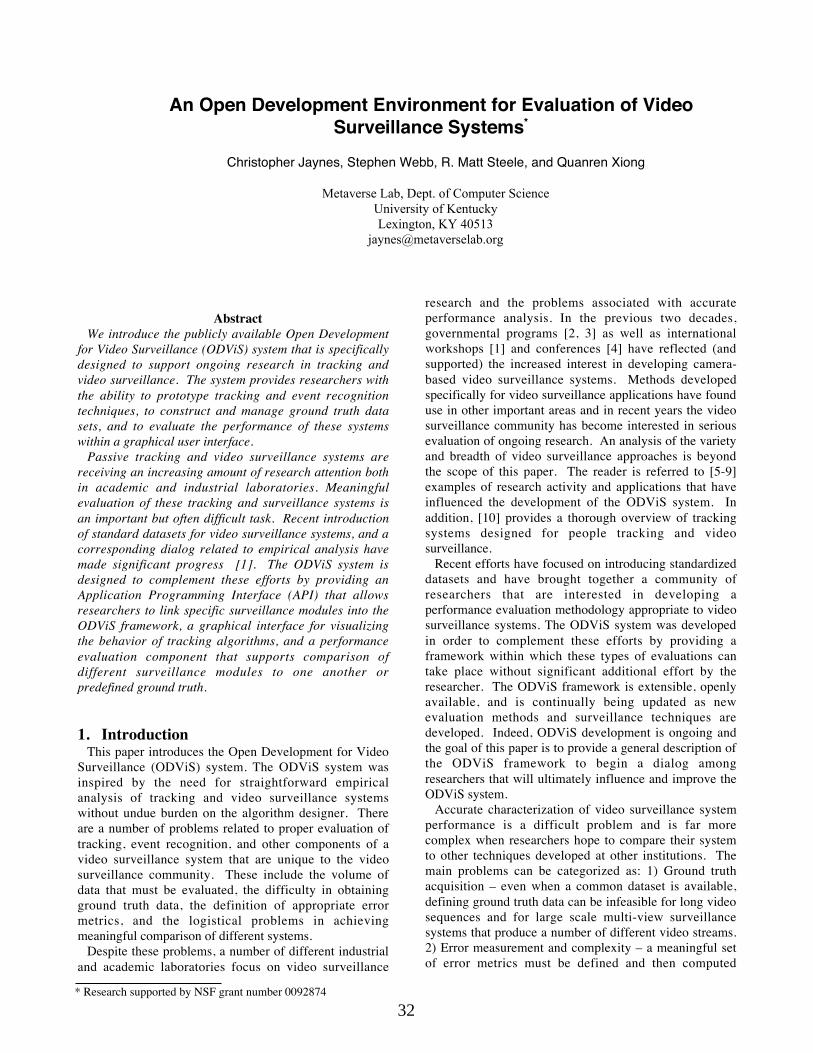
An Open Development Environment for Evaluation of VideoSurveillance Systems*
Christopher Jaynes, Stephen Webb, R. Matt Steele, and Quanren Xiong
Metaverse Lab, Dept. of Computer ScienceUniversity of KentuckyLexington, KY 40513
AbstractWe introduce the publicly available Open Development
for Video Surveillance (ODViS) system that is specificallydesigned to support ongoing research in tracking andvideo surveillance. The system provides researchers withthe ability to prototype tracking and event recognitiontechniques, to construct and manage ground truth datasets, and to evaluate the performance of these systemswithin a graphical user interface.
Passive tracking and video surveillance systems arereceiving an increasing amount of research attention bothin academic and industrial laboratories. Meaningfulevaluation of these tracking and surveillance systems isan important but often difficult task. Recent introductionof standard datasets for video surveillance systems, and acorresponding dialog related to empirical analysis havemade significant progress [1]. The ODViS system isdesigned to complement these efforts by providing anApplication Programming Interface (API) that allowsresearchers to link specific surveillance modules into theODViS framework, a graphical interface for visualizingthe behavior of tracking algorithms, and a performanceevaluation component that supports comparison ofdifferent surveillance modules to one another orpredefined ground truth.
1. IntroductionThis paper introduces the Open Development for Video
Surveillance (ODViS) system. The ODViS system wasinspired by the need for straightforward empiricalanalysis of tracking and video surveillance systemswithout undue burden on the algorithm designer. Thereare a number of problems related to proper evaluation oftracking, event recognition, and other components of avideo surveillance system that are unique to the videosurveillance community. These include the volume ofdata that must be evaluated, the difficulty in obtainingground truth data, the definition of appropriate errormetrics, and the logistical problems in achievingmeaningful comparison of different systems.
Despite these problems, a number of different industrialand academic laboratories focus on video surveillance
research and the problems associated with accurateperformance analysis. In the previous two decades,governmental programs [2, 3] as well as internationalworkshops [1] and conferences [4] have reflected (andsupported) the increased interest in developing camera-based video surveillance systems. Methods developedspecifically for video surveillance applications have founduse in other important areas and in recent years the videosurveillance community has become interested in seriousevaluation of ongoing research. An analysis of the varietyand breadth of video surveillance approaches is beyondthe scope of this paper. The reader is referred to [5-9]examples of research activity and applications that haveinfluenced the development of the ODViS system. Inaddition, [10] provides a thorough overview of trackingsystems designed for people tracking and videosurveillance.
Recent efforts have focused on introducing standardizeddatasets and have brought together a community ofresearchers that are interested in developing aperformance evaluation methodology appropriate to videosurveillance systems. The ODViS system was developedin order to complement these efforts by providing aframework within which these types of evaluations cantake place without significant additional effort by theresearcher. The ODViS framework is extensible, openlyavailable, and is continually being updated as newevaluation methods and surveillance techniques aredeveloped. Indeed, ODViS development is ongoing andthe goal of this paper is to provide a general description ofthe ODViS framework to begin a dialog amongresearchers that will ultimately influence and improve theODViS system.
Accurate characterization of video surveillance systemperformance is a difficult problem and is far morecomplex when researchers hope to compare their systemto other techniques developed at other institutions. Themain problems can be categorized as: 1) Ground truthacquisition – even when a common dataset is available,defining ground truth data can be infeasible for long videosequences and for large scale multi-view surveillancesystems that produce a number of different video streams.2) Error measurement and complexity – a meaningful setof error metrics must be defined and then computed
* Research supported by NSF grant number 0092874
32
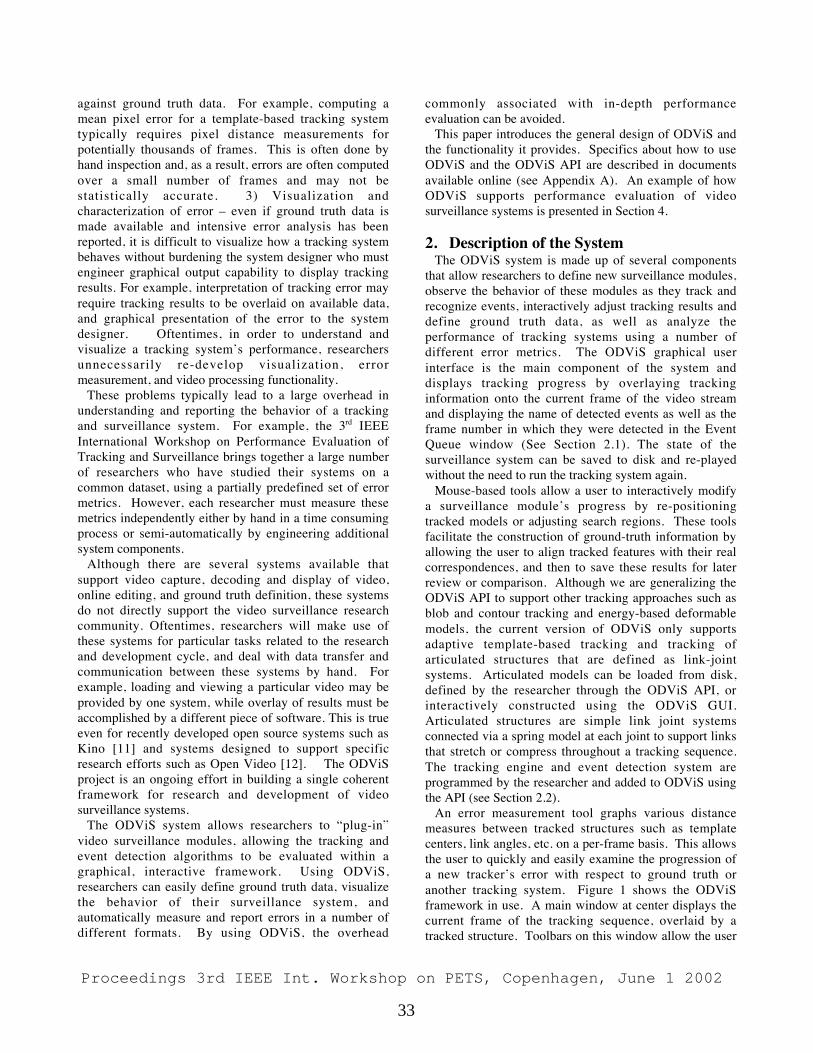
against ground truth data. For example, computing amean pixel error for a template-based tracking systemtypically requires pixel distance measurements forpotentially thousands of frames. This is often done byhand inspection and, as a result, errors are often computedover a small number of frames and may not bestatistically accurate. 3) Visualization andcharacterization of error – even if ground truth data ismade available and intensive error analysis has beenreported, it is difficult to visualize how a tracking systembehaves without burdening the system designer who mustengineer graphical output capability to display trackingresults. For example, interpretation of tracking error mayrequire tracking results to be overlaid on available data,and graphical presentation of the error to the systemdesigner. Oftentimes, in order to understand andvisualize a tracking system’s performance, researchersunnecessarily re-develop visualization, errormeasurement, and video processing functionality.
These problems typically lead to a large overhead inunderstanding and reporting the behavior of a trackingand surveillance system. For example, the 3rd IEEEInternational Workshop on Performance Evaluation ofTracking and Surveillance brings together a large numberof researchers who have studied their systems on acommon dataset, using a partially predefined set of errormetrics. However, each researcher must measure thesemetrics independently either by hand in a time consumingprocess or semi-automatically by engineering additionalsystem components.
Although there are several systems available thatsupport video capture, decoding and display of video,online editing, and ground truth definition, these systemsdo not directly support the video surveillance researchcommunity. Oftentimes, researchers will make use ofthese systems for particular tasks related to the researchand development cycle, and deal with data transfer andcommunication between these systems by hand. Forexample, loading and viewing a particular video may beprovided by one system, while overlay of results must beaccomplished by a different piece of software. This is trueeven for recently developed open source systems such asKino [11] and systems designed to support specificresearch efforts such as Open Video [12]. The ODViSproject is an ongoing effort in building a single coherentframework for research and development of videosurveillance systems.
The ODViS system allows researchers to “plug-in”video surveillance modules, allowing the tracking andevent detection algorithms to be evaluated within agraphical, interactive framework. Using ODViS,researchers can easily define ground truth data, visualizethe behavior of their surveillance system, andautomatically measure and report errors in a number ofdifferent formats. By using ODViS, the overhead
commonly associated with in-depth performanceevaluation can be avoided.
This paper introduces the general design of ODViS andthe functionality it provides. Specifics about how to useODViS and the ODViS API are described in documentsavailable online (see Appendix A). An example of howODViS supports performance evaluation of videosurveillance systems is presented in Section 4.
2. Description of the SystemThe ODViS system is made up of several components
that allow researchers to define new surveillance modules,observe the behavior of these modules as they track andrecognize events, interactively adjust tracking results anddefine ground truth data, as well as analyze theperformance of tracking systems using a number ofdifferent error metrics. The ODViS graphical userinterface is the main component of the system anddisplays tracking progress by overlaying trackinginformation onto the current frame of the video streamand displaying the name of detected events as well as theframe number in which they were detected in the EventQueue window (See Section 2.1). The state of thesurveillance system can be saved to disk and re-playedwithout the need to run the tracking system again.
Mouse-based tools allow a user to interactively modifya surveillance module’s progress by re-positioningtracked models or adjusting search regions. These toolsfacilitate the construction of ground-truth information byallowing the user to align tracked features with their realcorrespondences, and then to save these results for laterreview or comparison. Although we are generalizing theODViS API to support other tracking approaches such asblob and contour tracking and energy-based deformablemodels, the current version of ODViS only supportsadaptive template-based tracking and tracking ofarticulated structures that are defined as link-jointsystems. Articulated models can be loaded from disk,defined by the researcher through the ODViS API, orinteractively constructed using the ODViS GUI.Articulated structures are simple link joint systemsconnected via a spring model at each joint to support linksthat stretch or compress throughout a tracking sequence.The tracking engine and event detection system areprogrammed by the researcher and added to ODViS usingthe API (see Section 2.2).
An error measurement tool graphs various distancemeasures between tracked structures such as templatecenters, link angles, etc. on a per-frame basis. This allowsthe user to quickly and easily examine the progression ofa new tracker’s error with respect to ground truth oranother tracking system. Figure 1 shows the ODViSframework in use. A main window at center displays thecurrent frame of the tracking sequence, overlaid by atracked structure. Toolbars on this window allow the user
Proceedings 3rd IEEE Int. Workshop on PETS, Copenhagen, June 1 2002
33
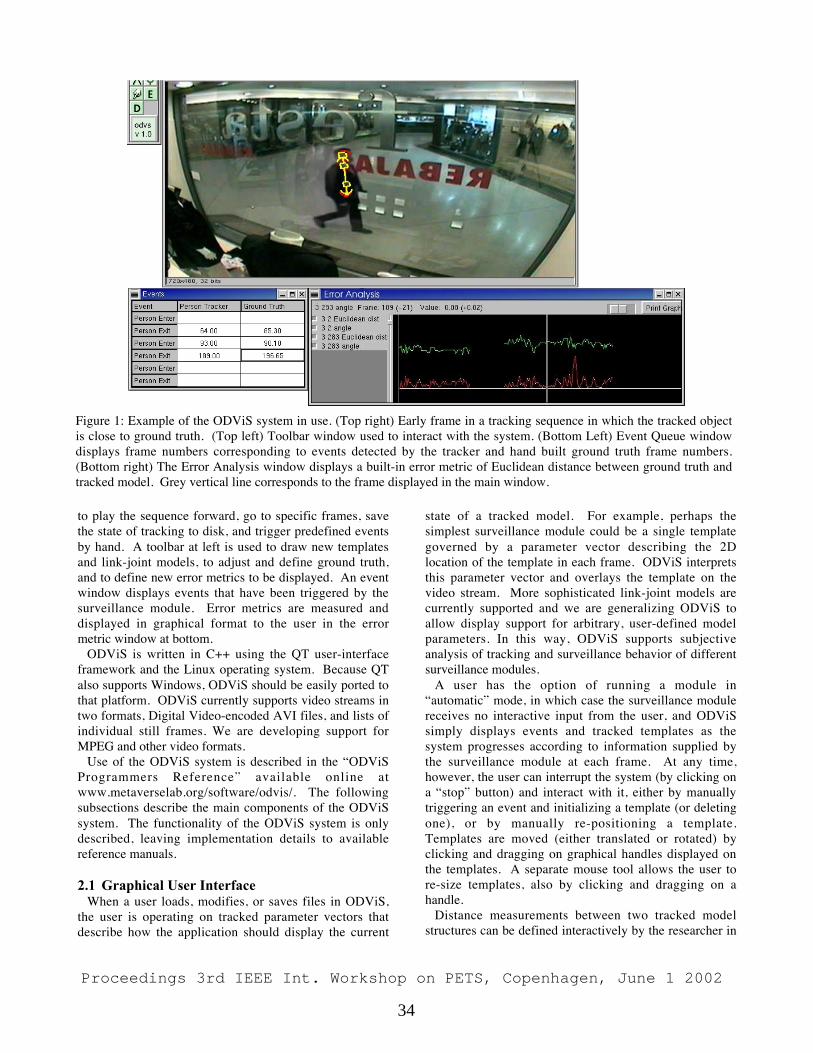
to play the sequence forward, go to specific frames, savethe state of tracking to disk, and trigger predefined eventsby hand. A toolbar at left is used to draw new templatesand link-joint models, to adjust and define ground truth,and to define new error metrics to be displayed. An eventwindow displays events that have been triggered by thesurveillance module. Error metrics are measured anddisplayed in graphical format to the user in the errormetric window at bottom.
ODViS is written in C++ using the QT user-interfaceframework and the Linux operating system. Because QTalso supports Windows, ODViS should be easily ported tothat platform. ODViS currently supports video streams intwo formats, Digital Video-encoded AVI files, and lists ofindividual still frames. We are developing support forMPEG and other video formats.
Use of the ODViS system is described in the “ODViSProgrammers Reference” available online atwww.metaverselab.org/software/odvis/. The followingsubsections describe the main components of the ODViSsystem. The functionality of the ODViS system is onlydescribed, leaving implementation details to availablereference manuals.
2.1 Graphical User InterfaceWhen a user loads, modifies, or saves files in ODViS,
the user is operating on tracked parameter vectors thatdescribe how the application should display the current
state of a tracked model. For example, perhaps thesimplest surveillance module could be a single templategoverned by a parameter vector describing the 2Dlocation of the template in each frame. ODViS interpretsthis parameter vector and overlays the template on thevideo stream. More sophisticated link-joint models arecurrently supported and we are generalizing ODViS toallow display support for arbitrary, user-defined modelparameters. In this way, ODViS supports subjectiveanalysis of tracking and surveillance behavior of differentsurveillance modules.
A user has the option of running a module in“automatic” mode, in which case the surveillance modulereceives no interactive input from the user, and ODViSsimply displays events and tracked templates as thesystem progresses according to information supplied bythe surveillance module at each frame. At any time,however, the user can interrupt the system (by clicking ona “stop” button) and interact with it, either by manuallytriggering an event and initializing a template (or deletingone), or by manually re-positioning a template.Templates are moved (either translated or rotated) byclicking and dragging on graphical handles displayed onthe templates. A separate mouse tool allows the user tore-size templates, also by clicking and dragging on ahandle.
Distance measurements between two tracked modelstructures can be defined interactively by the researcher in
Figure 1: Example of the ODViS system in use. (Top right) Early frame in a tracking sequence in which the tracked objectis close to ground truth. (Top left) Toolbar window used to interact with the system. (Bottom Left) Event Queue windowdisplays frame numbers corresponding to events detected by the tracker and hand built ground truth frame numbers.(Bottom right) The Error Analysis window displays a built-in error metric of Euclidean distance between ground truth andtracked model. Grey vertical line corresponds to the frame displayed in the main window.
Proceedings 3rd IEEE Int. Workshop on PETS, Copenhagen, June 1 2002
34
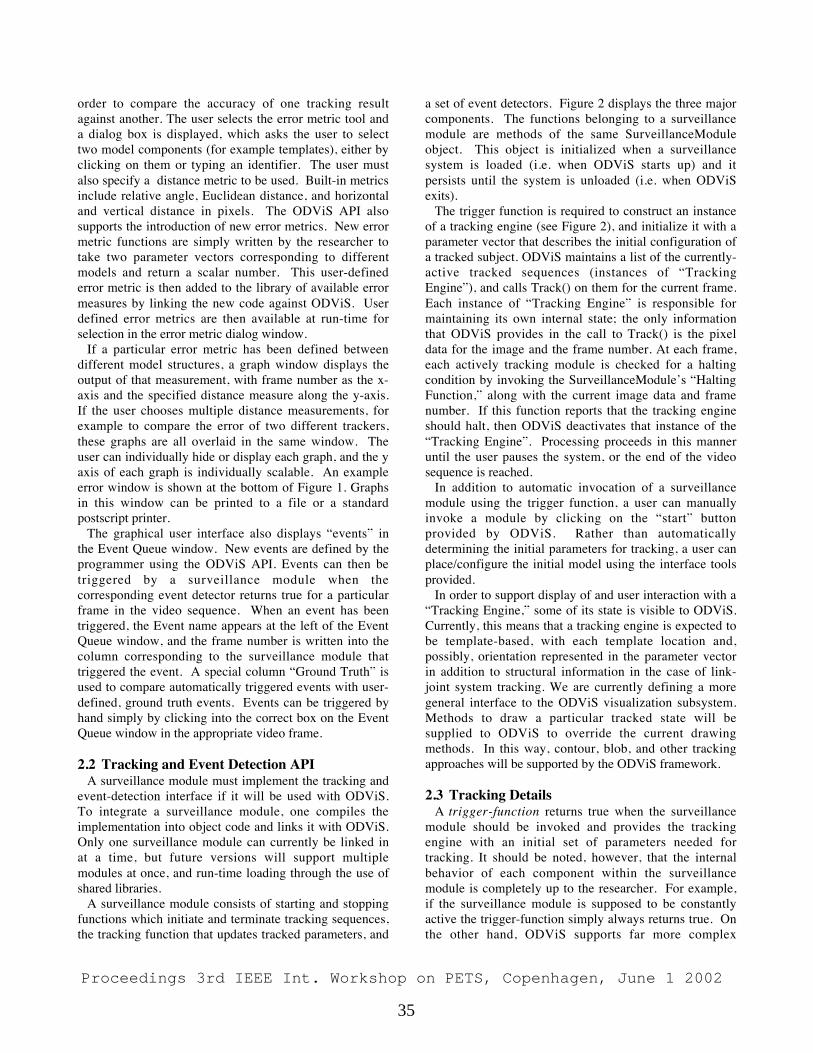
order to compare the accuracy of one tracking resultagainst another. The user selects the error metric tool anda dialog box is displayed, which asks the user to selecttwo model components (for example templates), either byclicking on them or typing an identifier. The user mustalso specify a distance metric to be used. Built-in metricsinclude relative angle, Euclidean distance, and horizontaland vertical distance in pixels. The ODViS API alsosupports the introduction of new error metrics. New errormetric functions are simply written by the researcher totake two parameter vectors corresponding to differentmodels and return a scalar number. This user-definederror metric is then added to the library of available errormeasures by linking the new code against ODViS. Userdefined error metrics are then available at run-time forselection in the error metric dialog window.
If a particular error metric has been defined betweendifferent model structures, a graph window displays theoutput of that measurement, with frame number as the x-axis and the specified distance measure along the y-axis.If the user chooses multiple distance measurements, forexample to compare the error of two different trackers,these graphs are all overlaid in the same window. Theuser can individually hide or display each graph, and the yaxis of each graph is individually scalable. An exampleerror window is shown at the bottom of Figure 1. Graphsin this window can be printed to a file or a standardpostscript printer.
The graphical user interface also displays “events” inthe Event Queue window. New events are defined by theprogrammer using the ODViS API. Events can then betriggered by a surveillance module when thecorresponding event detector returns true for a particularframe in the video sequence. When an event has beentriggered, the Event name appears at the left of the EventQueue window, and the frame number is written into thecolumn corresponding to the surveillance module thattriggered the event. A special column “Ground Truth” isused to compare automatically triggered events with user-defined, ground truth events. Events can be triggered byhand simply by clicking into the correct box on the EventQueue window in the appropriate video frame.
2.2 Tracking and Event Detection APIA surveillance module must implement the tracking and
event-detection interface if it will be used with ODViS.To integrate a surveillance module, one compiles theimplementation into object code and links it with ODViS.Only one surveillance module can currently be linked inat a time, but future versions will support multiplemodules at once, and run-time loading through the use ofshared libraries.
A surveillance module consists of starting and stoppingfunctions which initiate and terminate tracking sequences,the tracking function that updates tracked parameters, and
a set of event detectors. Figure 2 displays the three majorcomponents. The functions belonging to a surveillancemodule are methods of the same SurveillanceModuleobject. This object is initialized when a surveillancesystem is loaded (i.e. when ODViS starts up) and itpersists until the system is unloaded (i.e. when ODViSexits).
The trigger function is required to construct an instanceof a tracking engine (see Figure 2), and initialize it with aparameter vector that describes the initial configuration ofa tracked subject. ODViS maintains a list of the currently-active tracked sequences (instances of “TrackingEngine”), and calls Track() on them for the current frame.Each instance of “Tracking Engine” is responsible formaintaining its own internal state; the only informationthat ODViS provides in the call to Track() is the pixeldata for the image and the frame number. At each frame,each actively tracking module is checked for a haltingcondition by invoking the SurveillanceModule’s “HaltingFunction,” along with the current image data and framenumber. If this function reports that the tracking engineshould halt, then ODViS deactivates that instance of the“Tracking Engine”. Processing proceeds in this manneruntil the user pauses the system, or the end of the videosequence is reached.
In addition to automatic invocation of a surveillancemodule using the trigger function, a user can manuallyinvoke a module by clicking on the “start” buttonprovided by ODViS. Rather than automaticallydetermining the initial parameters for tracking, a user canplace/configure the initial model using the interface toolsprovided.
In order to support display of and user interaction with a“Tracking Engine,” some of its state is visible to ODViS.Currently, this means that a tracking engine is expected tobe template-based, with each template location and,possibly, orientation represented in the parameter vectorin addition to structural information in the case of link-joint system tracking. We are currently defining a moregeneral interface to the ODViS visualization subsystem.Methods to draw a particular tracked state will besupplied to ODViS to override the current drawingmethods. In this way, contour, blob, and other trackingapproaches will be supported by the ODViS framework.
2.3 Tracking DetailsA trigger-function returns true when the surveillance
module should be invoked and provides the trackingengine with an initial set of parameters needed fortracking. It should be noted, however, that the internalbehavior of each component within the surveillancemodule is completely up to the researcher. For example,if the surveillance module is supposed to be constantlyactive the trigger-function simply always returns true. Onthe other hand, ODViS supports far more complex
Proceedings 3rd IEEE Int. Workshop on PETS, Copenhagen, June 1 2002
35
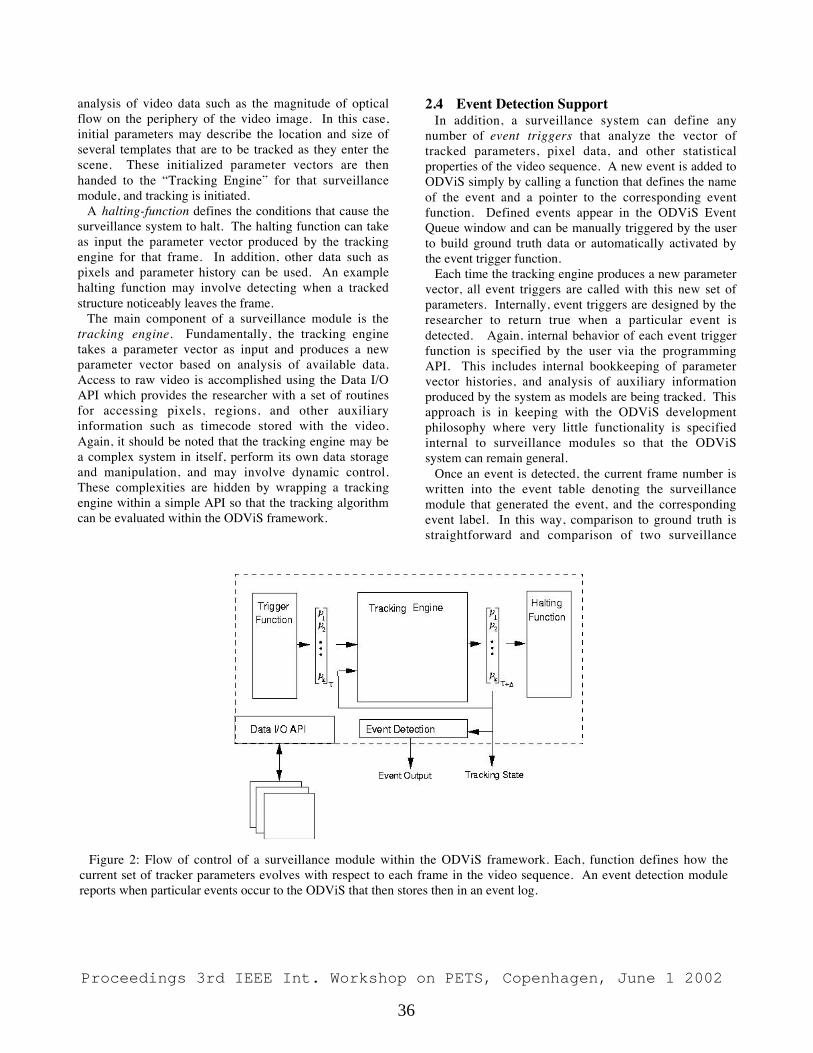
analysis of video data such as the magnitude of opticalflow on the periphery of the video image. In this case,initial parameters may describe the location and size ofseveral templates that are to be tracked as they enter thescene. These initialized parameter vectors are thenhanded to the “Tracking Engine” for that surveillancemodule, and tracking is initiated.
A halting-function defines the conditions that cause thesurveillance system to halt. The halting function can takeas input the parameter vector produced by the trackingengine for that frame. In addition, other data such aspixels and parameter history can be used. An examplehalting function may involve detecting when a trackedstructure noticeably leaves the frame.
The main component of a surveillance module is thetracking engine. Fundamentally, the tracking enginetakes a parameter vector as input and produces a newparameter vector based on analysis of available data.Access to raw video is accomplished using the Data I/OAPI which provides the researcher with a set of routinesfor accessing pixels, regions, and other auxiliaryinformation such as timecode stored with the video.Again, it should be noted that the tracking engine may bea complex system in itself, perform its own data storageand manipulation, and may involve dynamic control.These complexities are hidden by wrapping a trackingengine within a simple API so that the tracking algorithmcan be evaluated within the ODViS framework.
2.4 Event Detection SupportIn addition, a surveillance system can define any
number of event triggers that analyze the vector oftracked parameters, pixel data, and other statisticalproperties of the video sequence. A new event is added toODViS simply by calling a function that defines the nameof the event and a pointer to the corresponding eventfunction. Defined events appear in the ODViS EventQueue window and can be manually triggered by the userto build ground truth data or automatically activated bythe event trigger function.
Each time the tracking engine produces a new parametervector, all event triggers are called with this new set ofparameters. Internally, event triggers are designed by theresearcher to return true when a particular event isdetected. Again, internal behavior of each event triggerfunction is specified by the user via the programmingAPI. This includes internal bookkeeping of parametervector histories, and analysis of auxiliary informationproduced by the system as models are being tracked. Thisapproach is in keeping with the ODViS developmentphilosophy where very little functionality is specifiedinternal to surveillance modules so that the ODViSsystem can remain general.
Once an event is detected, the current frame number iswritten into the event table denoting the surveillancemodule that generated the event, and the correspondingevent label. In this way, comparison to ground truth isstraightforward and comparison of two surveillance
Figure 2: Flow of control of a surveillance module within the ODViS framework. Each, function defines how thecurrent set of tracker parameters evolves with respect to each frame in the video sequence. An event detection modulereports when particular events occur to the ODViS that then stores then in an event log.
Proceedings 3rd IEEE Int. Workshop on PETS, Copenhagen, June 1 2002
36
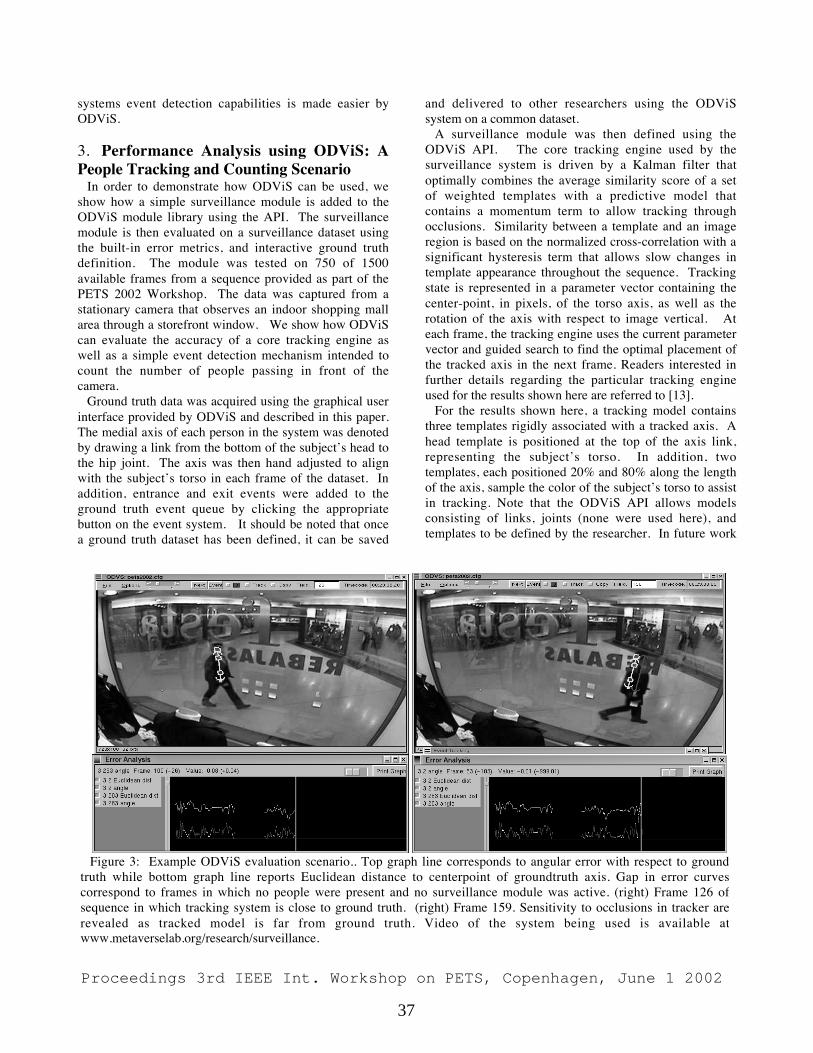
systems event detection capabilities is made easier byODViS.
3. Performance Analysis using ODViS: APeople Tracking and Counting Scenario
In order to demonstrate how ODViS can be used, weshow how a simple surveillance module is added to theODViS module library using the API. The surveillancemodule is then evaluated on a surveillance dataset usingthe built-in error metrics, and interactive ground truthdefinition. The module was tested on 750 of 1500available frames from a sequence provided as part of thePETS 2002 Workshop. The data was captured from astationary camera that observes an indoor shopping mallarea through a storefront window. We show how ODViScan evaluate the accuracy of a core tracking engine aswell as a simple event detection mechanism intended tocount the number of people passing in front of thecamera.
Ground truth data was acquired using the graphical userinterface provided by ODViS and described in this paper.The medial axis of each person in the system was denotedby drawing a link from the bottom of the subject’s head tothe hip joint. The axis was then hand adjusted to alignwith the subject’s torso in each frame of the dataset. Inaddition, entrance and exit events were added to theground truth event queue by clicking the appropriatebutton on the event system. It should be noted that oncea ground truth dataset has been defined, it can be saved
and delivered to other researchers using the ODViSsystem on a common dataset.
A surveillance module was then defined using theODViS API. The core tracking engine used by thesurveillance system is driven by a Kalman filter thatoptimally combines the average similarity score of a setof weighted templates with a predictive model thatcontains a momentum term to allow tracking throughocclusions. Similarity between a template and an imageregion is based on the normalized cross-correlation with asignificant hysteresis term that allows slow changes intemplate appearance throughout the sequence. Trackingstate is represented in a parameter vector containing thecenter-point, in pixels, of the torso axis, as well as therotation of the axis with respect to image vertical. Ateach frame, the tracking engine uses the current parametervector and guided search to find the optimal placement ofthe tracked axis in the next frame. Readers interested infurther details regarding the particular tracking engineused for the results shown here are referred to [13].
For the results shown here, a tracking model containsthree templates rigidly associated with a tracked axis. Ahead template is positioned at the top of the axis link,representing the subject’s torso. In addition, twotemplates, each positioned 20% and 80% along the lengthof the axis, sample the color of the subject’s torso to assistin tracking. Note that the ODViS API allows modelsconsisting of links, joints (none were used here), andtemplates to be defined by the researcher. In future work
Figure 3: Example ODViS evaluation scenario.. Top graph line corresponds to angular error with respect to ground
truth while bottom graph line reports Euclidean distance to centerpoint of groundtruth axis. Gap in error curvescorrespond to frames in which no people were present and no surveillance module was active. (right) Frame 126 ofsequence in which tracking system is close to ground truth. (right) Frame 159. Sensitivity to occlusions in tracker arerevealed as tracked model is far from ground truth. Video of the system being used is available atwww.metaverselab.org/research/surveillance.
Proceedings 3rd IEEE Int. Workshop on PETS, Copenhagen, June 1 2002
37
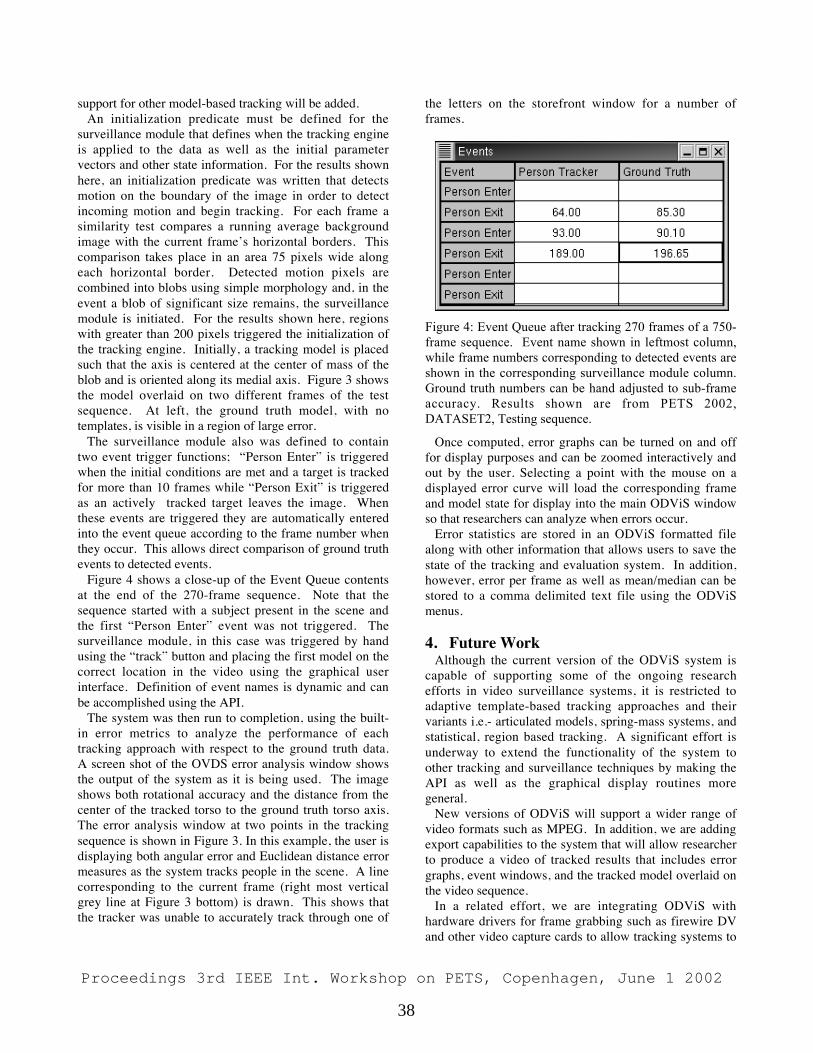
support for other model-based tracking will be added.An initialization predicate must be defined for the
surveillance module that defines when the tracking engineis applied to the data as well as the initial parametervectors and other state information. For the results shownhere, an initialization predicate was written that detectsmotion on the boundary of the image in order to detectincoming motion and begin tracking. For each frame asimilarity test compares a running average backgroundimage with the current frame’s horizontal borders. Thiscomparison takes place in an area 75 pixels wide alongeach horizontal border. Detected motion pixels arecombined into blobs using simple morphology and, in theevent a blob of significant size remains, the surveillancemodule is initiated. For the results shown here, regionswith greater than 200 pixels triggered the initialization ofthe tracking engine. Initially, a tracking model is placedsuch that the axis is centered at the center of mass of theblob and is oriented along its medial axis. Figure 3 showsthe model overlaid on two different frames of the testsequence. At left, the ground truth model, with notemplates, is visible in a region of large error.
The surveillance module also was defined to containtwo event trigger functions; “Person Enter” is triggeredwhen the initial conditions are met and a target is trackedfor more than 10 frames while “Person Exit” is triggeredas an actively tracked target leaves the image. Whenthese events are triggered they are automatically enteredinto the event queue according to the frame number whenthey occur. This allows direct comparison of ground truthevents to detected events.
Figure 4 shows a close-up of the Event Queue contentsat the end of the 270-frame sequence. Note that thesequence started with a subject present in the scene andthe first “Person Enter” event was not triggered. Thesurveillance module, in this case was triggered by handusing the “track” button and placing the first model on thecorrect location in the video using the graphical userinterface. Definition of event names is dynamic and canbe accomplished using the API.
The system was then run to completion, using the built-in error metrics to analyze the performance of eachtracking approach with respect to the ground truth data.A screen shot of the OVDS error analysis window showsthe output of the system as it is being used. The imageshows both rotational accuracy and the distance from thecenter of the tracked torso to the ground truth torso axis.The error analysis window at two points in the trackingsequence is shown in Figure 3. In this example, the user isdisplaying both angular error and Euclidean distance errormeasures as the system tracks people in the scene. A linecorresponding to the current frame (right most verticalgrey line at Figure 3 bottom) is drawn. This shows thatthe tracker was unable to accurately track through one of
the letters on the storefront window for a number offrames.
Figure 4: Event Queue after tracking 270 frames of a 750-frame sequence. Event name shown in leftmost column,while frame numbers corresponding to detected events areshown in the corresponding surveillance module column.Ground truth numbers can be hand adjusted to sub-frameaccuracy. Results shown are from PETS 2002,DATASET2, Testing sequence.
Once computed, error graphs can be turned on and offfor display purposes and can be zoomed interactively andout by the user. Selecting a point with the mouse on adisplayed error curve will load the corresponding frameand model state for display into the main ODViS windowso that researchers can analyze when errors occur.
Error statistics are stored in an ODViS formatted filealong with other information that allows users to save thestate of the tracking and evaluation system. In addition,however, error per frame as well as mean/median can bestored to a comma delimited text file using the ODViSmenus.
4. Future WorkAlthough the current version of the ODViS system is
capable of supporting some of the ongoing researchefforts in video surveillance systems, it is restricted toadaptive template-based tracking approaches and theirvariants i.e.- articulated models, spring-mass systems, andstatistical, region based tracking. A significant effort isunderway to extend the functionality of the system toother tracking and surveillance techniques by making theAPI as well as the graphical display routines moregeneral.
New versions of ODViS will support a wider range ofvideo formats such as MPEG. In addition, we are addingexport capabilities to the system that will allow researcherto produce a video of tracked results that includes errorgraphs, event windows, and the tracked model overlaid onthe video sequence.
In a related effort, we are integrating ODViS withhardware drivers for frame grabbing such as firewire DVand other video capture cards to allow tracking systems to
Proceedings 3rd IEEE Int. Workshop on PETS, Copenhagen, June 1 2002
38
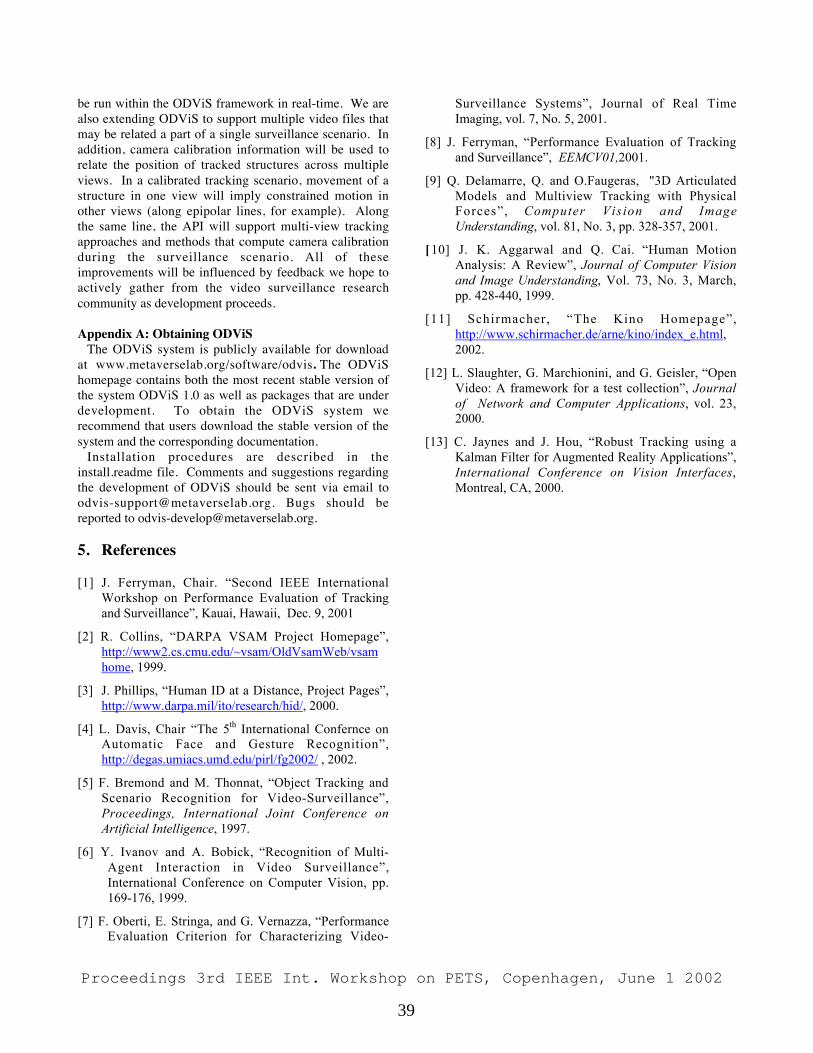
be run within the ODViS framework in real-time. We arealso extending ODViS to support multiple video files thatmay be related a part of a single surveillance scenario. Inaddition, camera calibration information will be used torelate the position of tracked structures across multipleviews. In a calibrated tracking scenario, movement of astructure in one view will imply constrained motion inother views (along epipolar lines, for example). Alongthe same line, the API will support multi-view trackingapproaches and methods that compute camera calibrationduring the surveillance scenario. All of theseimprovements will be influenced by feedback we hope toactively gather from the video surveillance researchcommunity as development proceeds.
Appendix A: Obtaining ODViSThe ODViS system is publicly available for download
at www.metaverselab.org/software/odvis. The ODViShomepage contains both the most recent stable version ofthe system ODViS 1.0 as well as packages that are underdevelopment. To obtain the ODViS system werecommend that users download the stable version of thesystem and the corresponding documentation.
Installation procedures are described in theinstall.readme file. Comments and suggestions regardingthe development of ODViS should be sent via email [email protected]. Bugs should bereported to [email protected].
5. References
[1] J. Ferryman, Chair. “Second IEEE InternationalWorkshop on Performance Evaluation of Trackingand Surveillance”, Kauai, Hawaii, Dec. 9, 2001
[2] R. Collins, “DARPA VSAM Project Homepage”,http://www2.cs.cmu.edu/~vsam/OldVsamWeb/vsamhome, 1999.
[3] J. Phillips, “Human ID at a Distance, Project Pages”,http://www.darpa.mil/ito/research/hid/, 2000.
[4] L. Davis, Chair “The 5th International Confernce onAutomatic Face and Gesture Recognition”,http://degas.umiacs.umd.edu/pirl/fg2002/ , 2002.
[5] F. Bremond and M. Thonnat, “Object Tracking andScenario Recognition for Video-Surveillance”,Proceedings, International Joint Conference onArtificial Intelligence, 1997.
[6] Y. Ivanov and A. Bobick, “Recognition of Multi-Agent Interaction in Video Surveillance”,International Conference on Computer Vision, pp.169-176, 1999.
[7] F. Oberti, E. Stringa, and G. Vernazza, “PerformanceEvaluation Criterion for Characterizing Video-
Surveillance Systems”, Journal of Real TimeImaging, vol. 7, No. 5, 2001.
[8] J. Ferryman, “Performance Evaluation of Trackingand Surveillance”, EEMCV01,2001.
[9] Q. Delamarre, Q. and O.Faugeras, "3D ArticulatedModels and Multiview Tracking with PhysicalForces”, Computer Vision and ImageUnderstanding, vol. 81, No. 3, pp. 328-357, 2001.
[ 10] J. K. Aggarwal and Q. Cai. “Human MotionAnalysis: A Review”, Journal of Computer Visionand Image Understanding, Vol. 73, No. 3, March,pp. 428-440, 1999.
[11] Schirmacher, “The Kino Homepage”,http://www.schirmacher.de/arne/kino/index_e.html,2002.
[12] L. Slaughter, G. Marchionini, and G. Geisler, “OpenVideo: A framework for a test collection”, Journalof Network and Computer Applications, vol. 23,2000.
[13] C. Jaynes and J. Hou, “Robust Tracking using aKalman Filter for Augmented Reality Applications”,International Conference on Vision Interfaces,Montreal, CA, 2000.
Proceedings 3rd IEEE Int. Workshop on PETS, Copenhagen, June 1 2002
39
Auto-Calibration in Multiple-Camera Surveillance Environments
G.A. Jones, J. Renno and P. Remagnino
Digital Imaging Research CentreSchool of Computing and Information Systems,
Kingston University,Kingston upon Thames, Surrey, KT1 2EE , UKfg.jones,j.renno,[email protected]
Abstract
The fusion of tracking and classification informationin multi-camera surveillance environments will result ingreater robustness, accuracy and temporal extent of inter-pretation of activity within the monitored scene. Crucial tosuch fusion is the recovery of the camera calibration whichallows such information to be expressed in a common coor-dinate system. Rather than relying on the traditional time-consuming, labour-intensive and expert-dependent calibra-tion procedures to recover the camera calibration, extensi-ble plug-and play surveillance components should employsimple learning calibration procedures by merely watchingobjects entering, passing through and leaving the monitoredscene. In this work we present such a two stage calibra-tion procedure. In the first stage, a linear model of the pro-jected height of objects in the scene is used in conjunctionwith world knowledge about the average person height torecover the image-plane to local-ground-plane transforma-tion of each camera. In the second stage, a Hough trans-form technique is used to recover the transformations be-tween these local ground planes.
1 Introduction
Accurately detecting and tracking moving objects withinmonitored scenes is crucial to a range of high-level be-havioural vision tasks[5, 7, 9, 14]. Tracking accuracy canbe greater enhanced by combining information from sev-eral cameras with overlapping views. Not only will thisprovide more observations but will ensure the object re-mains tracked for longer intervals and provide some pro-tection from occlusion. However to successfuly fuse thesemultiple sources of information, it is necessary to projectthese observations into the same coordinate system. Mostdata fusion methods depend on a relatively complex cal-ibration process based on variants of the Tsai calibrationtechnique[13]. Real world positions of highly visible point
events are recorded and manually matched to the equivalentimage events in each camera. The method has the advan-tage of being accurate (where a sufficient number of welldispersed correspondences have been manually established)as well as enabling data from the different camera sourcesto be expressed within the same coordinate system.
Auto-calibration techniques seek to establish thecamera-plane to ground-plane or image-plane to image-plane transformations without the need for these manualtime-consuming, labour-intensive and skill-dependent cali-bration procedures. Ideally, the system should learn the cal-ibration by watching the events unfold within the monitoredscene and, where appropriate, combine learnt knowledgewith any available world knowledge. In previous work,Black and Ellis[2] and Stein[12] use sets of moving objectobservations from two views. Since the correspondencesbetween views is unknown, both employ a Least Medianof Squares technique to recover the correct image-plane toimage-plane homography from a large candidate popula-tion of all possible correspondence pairings. In Stein[12],the resultant initial transformation is refined using an imagegreylevel alignment technique. Where more than two cam-eras are involved no single world coordinate system is avail-able. Both this work and that proposed in this paper relieson the recovery of the correspondence between point ob-servations. Point features offer little discriminatory powerto prune the large number of false correspondences. Thework of Jaynes[6] attempts to match the trajectories them-selves. During an initial manual stage, the relative orien-tation of the ground plane to the image plane is computedby enabling an operator to recover the vanishing points oforthogonal bundles of parallel 3D line structures on theground plane. Trajectories positions are reprojected ontoan arbitrary plane parallel to the ground plane. Trajectoriesof a minimum length are then matched using a non-linearleast squares technique to recover the rotation, translationand scale transformation between the projection planes ofany pair of cameras. Based on the assumption that 3D mo-
Proceedings 3rd IEEE Int. Workshop on PETS, Copenhagen, June 1 2002
40
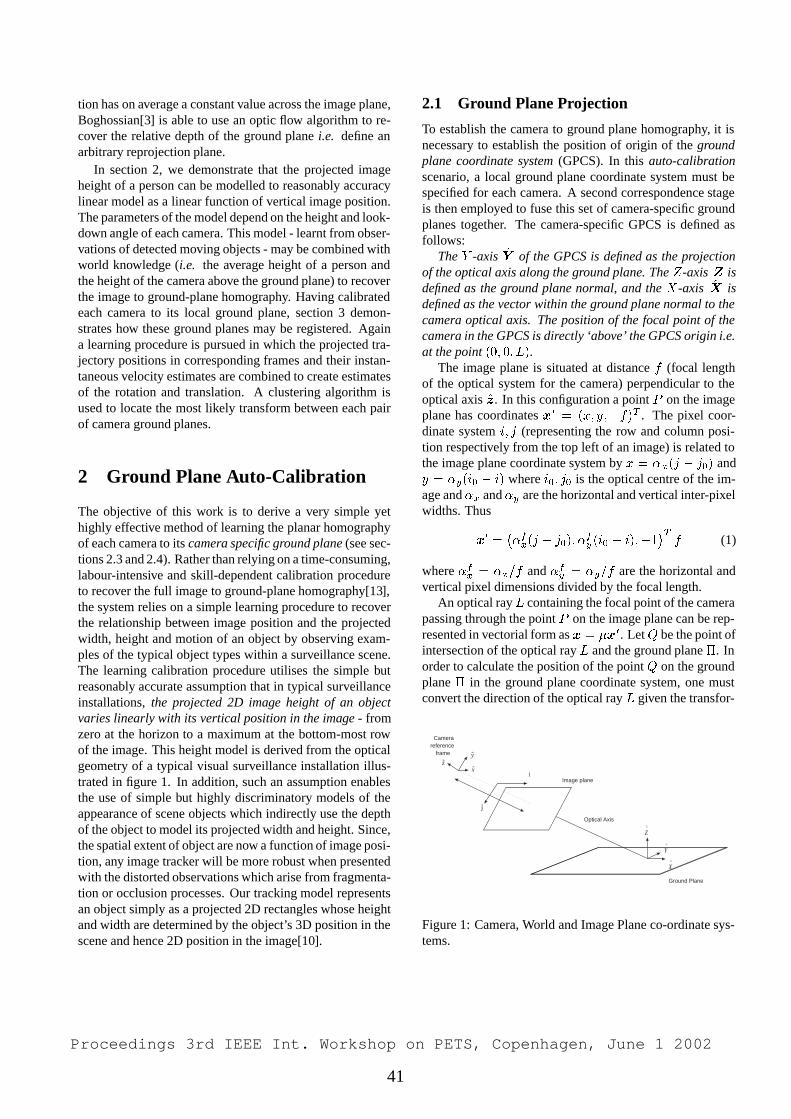
tion has on average a constant value across the image plane,Boghossian[3] is able to use an optic flow algorithm to re-cover the relative depth of the ground plane i.e. define anarbitrary reprojection plane.
In section 2, we demonstrate that the projected imageheight of a person can be modelled to reasonably accuracylinear model as a linear function of vertical image position.The parameters of the model depend on the height and look-down angle of each camera. This model - learnt from obser-vations of detected moving objects - may be combined withworld knowledge (i.e. the average height of a person andthe height of the camera above the ground plane) to recoverthe image to ground-plane homography. Having calibratedeach camera to its local ground plane, section 3 demon-strates how these ground planes may be registered. Againa learning procedure is pursued in which the projected tra-jectory positions in corresponding frames and their instan-taneous velocity estimates are combined to create estimatesof the rotation and translation. A clustering algorithm isused to locate the most likely transform between each pairof camera ground planes.
2 Ground Plane Auto-Calibration
The objective of this work is to derive a very simple yethighly effective method of learning the planar homographyof each camera to its camera specific ground plane (see sec-tions 2.3 and 2.4). Rather than relying on a time-consuming,labour-intensive and skill-dependent calibration procedureto recover the full image to ground-plane homography[13],the system relies on a simple learning procedure to recoverthe relationship between image position and the projectedwidth, height and motion of an object by observing exam-ples of the typical object types within a surveillance scene.The learning calibration procedure utilises the simple butreasonably accurate assumption that in typical surveillanceinstallations, the projected 2D image height of an objectvaries linearly with its vertical position in the image - fromzero at the horizon to a maximum at the bottom-most rowof the image. This height model is derived from the opticalgeometry of a typical visual surveillance installation illus-trated in figure 1. In addition, such an assumption enablesthe use of simple but highly discriminatory models of theappearance of scene objects which indirectly use the depthof the object to model its projected width and height. Since,the spatial extent of object are now a function of image posi-tion, any image tracker will be more robust when presentedwith the distorted observations which arise from fragmenta-tion or occlusion processes. Our tracking model representsan object simply as a projected 2D rectangles whose heightand width are determined by the object’s 3D position in thescene and hence 2D position in the image[10].
2.1 Ground Plane Projection
To establish the camera to ground plane homography, it isnecessary to establish the position of origin of the groundplane coordinate system (GPCS). In this auto-calibrationscenario, a local ground plane coordinate system must bespecified for each camera. A second correspondence stageis then employed to fuse this set of camera-specific groundplanes together. The camera-specific GPCS is defined asfollows:
The Y -axis Y of the GPCS is defined as the projectionof the optical axis along the ground plane. The Z-axis Z isdefined as the ground plane normal, and the X-axis X isdefined as the vector within the ground plane normal to thecamera optical axis. The position of the focal point of thecamera in the GPCS is directly ‘above’ the GPCS origin i.e.at the point (0; 0; L).
The image plane is situated at distance f (focal lengthof the optical system for the camera) perpendicular to theoptical axis z. In this configuration a point P on the imageplane has coordinates x0 = (x; y;�f)T . The pixel coor-dinate system i; j (representing the row and column posi-tion respectively from the top left of an image) is related tothe image plane coordinate system by x = �x(j � j0) andy = �y(i0 � i) where i0; j0 is the optical centre of the im-age and �x and �y are the horizontal and vertical inter-pixelwidths. Thus
x0 =��fx(j � j0); �
fy (i0 � i);�1
�Tf (1)
where �fx = �x=f and �fy = �y=f are the horizontal andvertical pixel dimensions divided by the focal length.
An optical rayL containing the focal point of the camerapassing through the point P on the image plane can be rep-resented in vectorial form as x = �x0. LetQ be the point ofintersection of the optical ray L and the ground plane �. Inorder to calculate the position of the point Q on the groundplane � in the ground plane coordinate system, one mustconvert the direction of the optical ray L given the transfor-
H
x
yz
Camerareference
frame
Image plane
Ground Plane
i
j
^X
^Y
^Z
Optical Axis
Figure 1: Camera, World and Image Plane co-ordinate sys-tems.
Proceedings 3rd IEEE Int. Workshop on PETS, Copenhagen, June 1 2002
41
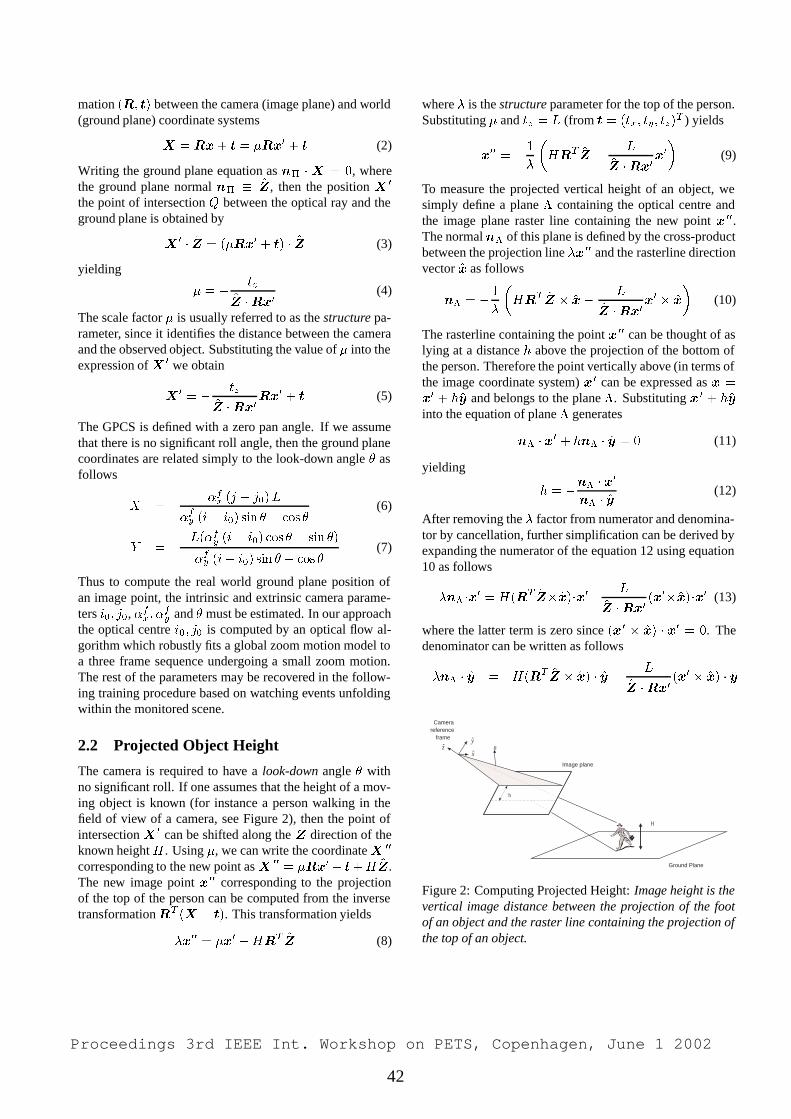
mation (R; t) between the camera (image plane) and world(ground plane) coordinate systems
X = Rx+ t = �Rx0 + t (2)
Writing the ground plane equation as n� �X = 0, wherethe ground plane normal n� � Z, then the position X 0
the point of intersection Q between the optical ray and theground plane is obtained by
X 0� Z = (�Rx0 + t) � Z (3)
yielding
� = �
tz
Z �Rx0
(4)
The scale factor � is usually referred to as the structure pa-rameter, since it identifies the distance between the cameraand the observed object. Substituting the value of � into theexpression of X 0 we obtain
X 0 = �
tz
Z �Rx0
Rx0 + t (5)
The GPCS is defined with a zero pan angle. If we assumethat there is no significant roll angle, then the ground planecoordinates are related simply to the look-down angle � asfollows
X =�fx (j � j0)L
�fy (i� i0) sin � � cos �
(6)
Y =�L(�fy (i� i0) cos � � sin �)
�fy (i� i0) sin � � cos �
(7)
Thus to compute the real world ground plane position ofan image point, the intrinsic and extrinsic camera parame-ters i0; j0, �fx; �
fy and � must be estimated. In our approach
the optical centre i0; j0 is computed by an optical flow al-gorithm which robustly fits a global zoom motion model toa three frame sequence undergoing a small zoom motion.The rest of the parameters may be recovered in the follow-ing training procedure based on watching events unfoldingwithin the monitored scene.
2.2 Projected Object Height
The camera is required to have a look-down angle � withno significant roll. If one assumes that the height of a mov-ing object is known (for instance a person walking in thefield of view of a camera, see Figure 2), then the point ofintersection X 0 can be shifted along the Z direction of theknown height H . Using �, we can write the coordinateX 00
corresponding to the new point as X 00 = �Rx0 + t+H ^Z.The new image point x00 corresponding to the projectionof the top of the person can be computed from the inversetransformationRT (X � t). This transformation yields
�x00 = �x0 +HRT Z (8)
where � is the structure parameter for the top of the person.Substituting � and tz = L (from t = (tx; ty; tz)
T ) yields
x00 = �
1
�
�HRT Z �
L
Z �Rx0
x0
�(9)
To measure the projected vertical height of an object, wesimply define a plane � containing the optical centre andthe image plane raster line containing the new point x 00.The normaln� of this plane is defined by the cross-productbetween the projection line �x00 and the rasterline directionvector x as follows
n� = �
1
�
�HRT Z � x�
L
Z �Rx0
x0� x
�(10)
The rasterline containing the point x 00 can be thought of aslying at a distance h above the projection of the bottom ofthe person. Therefore the point vertically above (in terms ofthe image coordinate system) x0 can be expressed as x =
x0 + hy and belongs to the plane �. Substituting x 0 + hy
into the equation of plane � generates
n� � x0 + hn� � y = 0 (11)
yielding
h = �
n� � x0
n� � y(12)
After removing the � factor from numerator and denomina-tor by cancellation, further simplification can be derived byexpanding the numerator of the equation 12 using equation10 as follows
��n� �x0 = H(RT Z�x)�x0
�
L
Z �Rx0
(x0�x)�x0 (13)
where the latter term is zero since (x0� x) � x0 = 0. The
denominator can be written as follows
��n� � y = H(RT Z � x) � y �L
Z �Rx0
(x0� x) � y
H
x
yz
Camerareference
frame
Image plane
Ground Plane
H
h
n
Figure 2: Computing Projected Height: Image height is thevertical image distance between the projection of the footof an object and the raster line containing the projection ofthe top of an object.
Proceedings 3rd IEEE Int. Workshop on PETS, Copenhagen, June 1 2002
42
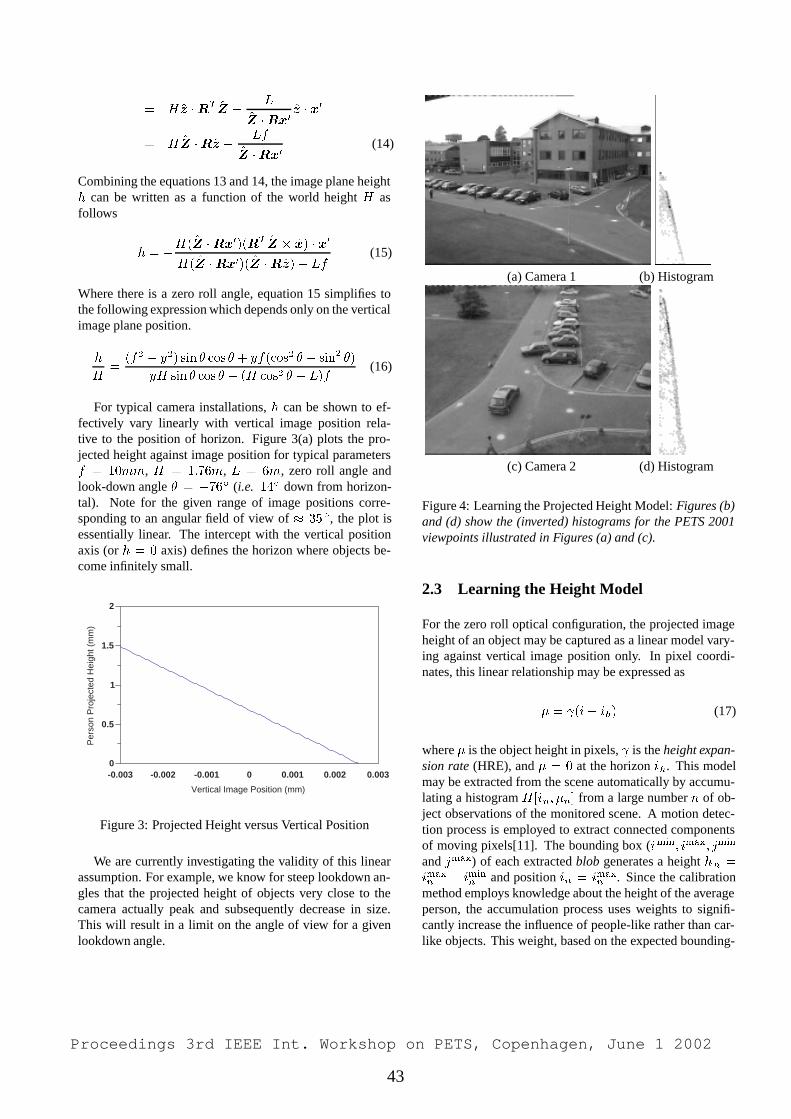
= H z �RT Z �
L
Z �Rx0
z � x0
= HZ �Rz �Lf
Z �Rx0
(14)
Combining the equations 13 and 14, the image plane heighth can be written as a function of the world height H asfollows
h = �
H(Z �Rx0)(RT Z � x) � x0
H(Z �Rx0)(Z �Rz)� Lf(15)
Where there is a zero roll angle, equation 15 simplifies tothe following expression which depends only on the verticalimage plane position.
h
H=
(f2 � y2) sin � cos � + yf(cos2 � � sin2 �)
yH sin � cos � � (H cos2 � � L)f(16)
For typical camera installations, h can be shown to ef-fectively vary linearly with vertical image position rela-tive to the position of horizon. Figure 3(a) plots the pro-jected height against image position for typical parametersf = 10mm, H = 1:76m, L = 6m, zero roll angle andlook-down angle � = �76Æ (i.e. 14Æ down from horizon-tal). Note for the given range of image positions corre-sponding to an angular field of view of � 35Æ, the plot isessentially linear. The intercept with the vertical positionaxis (or h = 0 axis) defines the horizon where objects be-come infinitely small.
-0.003 -0.002 -0.001 0 0.001 0.002 0.003
Vertical Image Position (mm)
0
0.5
1
1.5
2
Per
son
Pro
ject
ed H
eigh
t (m
m)
Figure 3: Projected Height versus Vertical Position
We are currently investigating the validity of this linearassumption. For example, we know for steep lookdown an-gles that the projected height of objects very close to thecamera actually peak and subsequently decrease in size.This will result in a limit on the angle of view for a givenlookdown angle.
(a) Camera 1 (b) Histogram
(c) Camera 2 (d) Histogram
Figure 4: Learning the Projected Height Model: Figures (b)and (d) show the (inverted) histograms for the PETS 2001viewpoints illustrated in Figures (a) and (c).
2.3 Learning the Height Model
For the zero roll optical configuration, the projected imageheight of an object may be captured as a linear model vary-ing against vertical image position only. In pixel coordi-nates, this linear relationship may be expressed as
� = (i� ih) (17)
where � is the object height in pixels, is the height expan-sion rate (HRE), and � = 0 at the horizon ih. This modelmay be extracted from the scene automatically by accumu-lating a histogram H [in; �n] from a large number n of ob-ject observations of the monitored scene. A motion detec-tion process is employed to extract connected componentsof moving pixels[11]. The bounding box (imin; imax; jmin
and jmax) of each extracted blob generates a height hn =
imaxn � iminn and position in = imaxn . Since the calibrationmethod employs knowledge about the height of the averageperson, the accumulation process uses weights to signifi-cantly increase the influence of people-like rather than car-like objects. This weight, based on the expected bounding-
Proceedings 3rd IEEE Int. Workshop on PETS, Copenhagen, June 1 2002
43
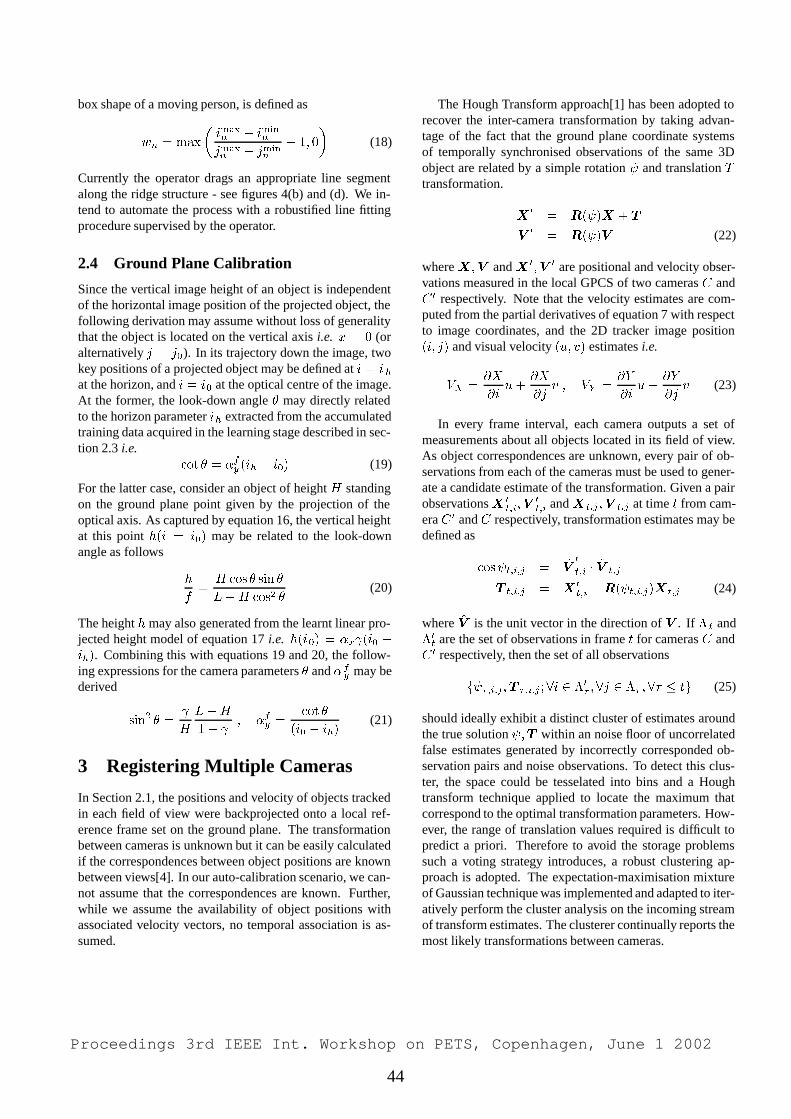
box shape of a moving person, is defined as
wn = max
�imaxn � iminn
jmaxn � jminn
� 1; 0
�(18)
Currently the operator drags an appropriate line segmentalong the ridge structure - see figures 4(b) and (d). We in-tend to automate the process with a robustified line fittingprocedure supervised by the operator.
2.4 Ground Plane Calibration
Since the vertical image height of an object is independentof the horizontal image position of the projected object, thefollowing derivation may assume without loss of generalitythat the object is located on the vertical axis i.e. x = 0 (oralternatively j = j0). In its trajectory down the image, twokey positions of a projected object may be defined at i = ihat the horizon, and i = i0 at the optical centre of the image.At the former, the look-down angle � may directly relatedto the horizon parameter ih extracted from the accumulatedtraining data acquired in the learning stage described in sec-tion 2.3 i.e.
cot � = �fy (ih � i0) (19)
For the latter case, consider an object of height H standingon the ground plane point given by the projection of theoptical axis. As captured by equation 16, the vertical heightat this point h(i = i0) may be related to the look-downangle as follows
h
f=
H cos � sin �
L�H cos2 �(20)
The height h may also generated from the learnt linear pro-jected height model of equation 17 i.e. h(i0) = �x (i0 �
ih). Combining this with equations 19 and 20, the follow-ing expressions for the camera parameters � and �f
y may bederived
sin2 � =
H
L�H
1� ; �fy =
cot �
(i0 � ih)(21)
3 Registering Multiple Cameras
In Section 2.1, the positions and velocity of objects trackedin each field of view were backprojected onto a local ref-erence frame set on the ground plane. The transformationbetween cameras is unknown but it can be easily calculatedif the correspondences between object positions are knownbetween views[4]. In our auto-calibration scenario, we can-not assume that the correspondences are known. Further,while we assume the availability of object positions withassociated velocity vectors, no temporal association is as-sumed.
The Hough Transform approach[1] has been adopted torecover the inter-camera transformation by taking advan-tage of the fact that the ground plane coordinate systemsof temporally synchronised observations of the same 3Dobject are related by a simple rotation and translation Ttransformation.
X0 = R( )X + T
V 0 = R( )V (22)
where X;V and X 0;V 0 are positional and velocity obser-vations measured in the local GPCS of two cameras C andC 0 respectively. Note that the velocity estimates are com-puted from the partial derivatives of equation 7 with respectto image coordinates, and the 2D tracker image position(i; j) and visual velocity (u; v) estimates i.e.
VX =@X
@iu+
@X
@jv ; VY =
@Y
@iu+
@Y
@jv (23)
In every frame interval, each camera outputs a set ofmeasurements about all objects located in its field of view.As object correspondences are unknown, every pair of ob-servations from each of the cameras must be used to gener-ate a candidate estimate of the transformation. Given a pairobservationsX 0
t;i;V0
t;i and Xt;j ;V t;j at time t from cam-era C 0 and C respectively, transformation estimates may bedefined as
cos t;i;j = V0
t;i � V t;j
T t;i;j = X 0
t;i �R( t;i;j)Xt;j (24)
where V is the unit vector in the direction of V . If �t and�0
t are the set of observations in frame t for cameras C andC 0 respectively, then the set of all observations
f �;i;j ;T �;i;j ;8i 2 �0
� ;8j 2 �� ;8� � tg (25)
should ideally exhibit a distinct cluster of estimates aroundthe true solution ;T within an noise floor of uncorrelatedfalse estimates generated by incorrectly corresponded ob-servation pairs and noise observations. To detect this clus-ter, the space could be tesselated into bins and a Houghtransform technique applied to locate the maximum thatcorrespond to the optimal transformation parameters. How-ever, the range of translation values required is difficult topredict a priori. Therefore to avoid the storage problemssuch a voting strategy introduces, a robust clustering ap-proach is adopted. The expectation-maximisation mixtureof Gaussian technique was implemented and adapted to iter-atively perform the cluster analysis on the incoming streamof transform estimates. The clusterer continually reports themost likely transformations between cameras.
Proceedings 3rd IEEE Int. Workshop on PETS, Copenhagen, June 1 2002
44
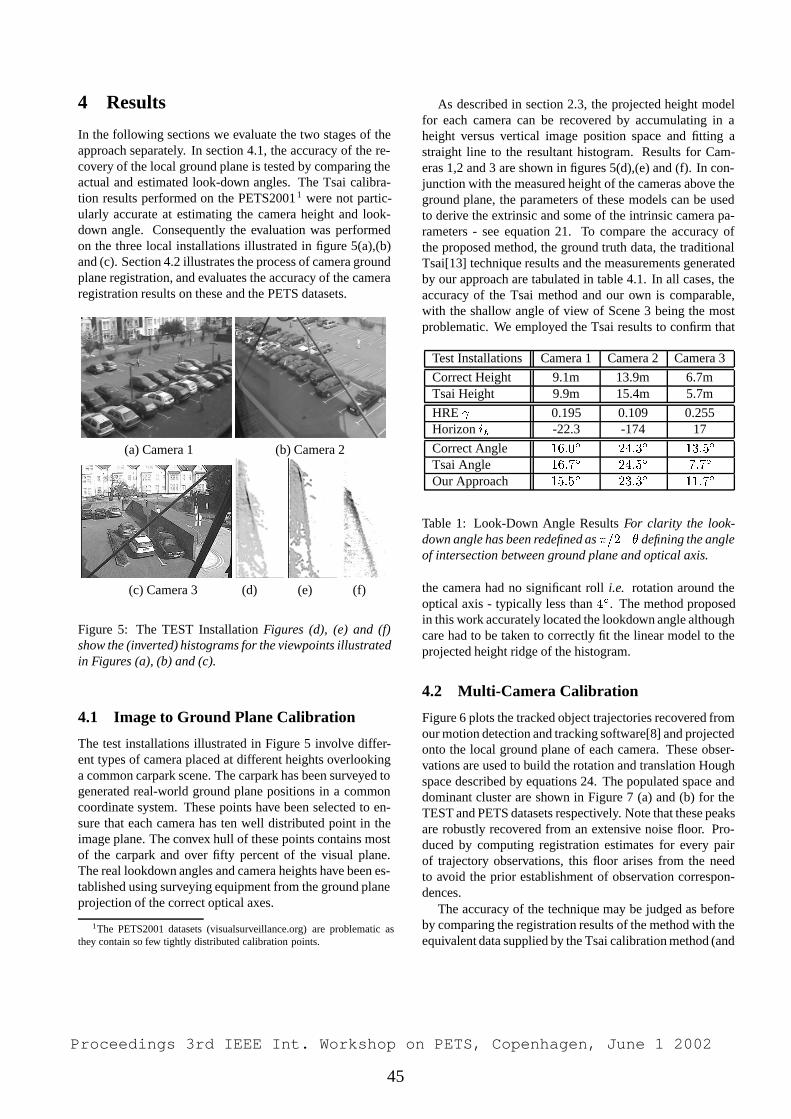
4 Results
In the following sections we evaluate the two stages of theapproach separately. In section 4.1, the accuracy of the re-covery of the local ground plane is tested by comparing theactual and estimated look-down angles. The Tsai calibra-tion results performed on the PETS20011 were not partic-ularly accurate at estimating the camera height and look-down angle. Consequently the evaluation was performedon the three local installations illustrated in figure 5(a),(b)and (c). Section 4.2 illustrates the process of camera groundplane registration, and evaluates the accuracy of the cameraregistration results on these and the PETS datasets.
(a) Camera 1 (b) Camera 2
(c) Camera 3 (d) (e) (f)
Figure 5: The TEST Installation Figures (d), (e) and (f)show the (inverted) histograms for the viewpoints illustratedin Figures (a), (b) and (c).
4.1 Image to Ground Plane Calibration
The test installations illustrated in Figure 5 involve differ-ent types of camera placed at different heights overlookinga common carpark scene. The carpark has been surveyed togenerated real-world ground plane positions in a commoncoordinate system. These points have been selected to en-sure that each camera has ten well distributed point in theimage plane. The convex hull of these points contains mostof the carpark and over fifty percent of the visual plane.The real lookdown angles and camera heights have been es-tablished using surveying equipment from the ground planeprojection of the correct optical axes.
1The PETS2001 datasets (visualsurveillance.org) are problematic asthey contain so few tightly distributed calibration points.
As described in section 2.3, the projected height modelfor each camera can be recovered by accumulating in aheight versus vertical image position space and fitting astraight line to the resultant histogram. Results for Cam-eras 1,2 and 3 are shown in figures 5(d),(e) and (f). In con-junction with the measured height of the cameras above theground plane, the parameters of these models can be usedto derive the extrinsic and some of the intrinsic camera pa-rameters - see equation 21. To compare the accuracy ofthe proposed method, the ground truth data, the traditionalTsai[13] technique results and the measurements generatedby our approach are tabulated in table 4.1. In all cases, theaccuracy of the Tsai method and our own is comparable,with the shallow angle of view of Scene 3 being the mostproblematic. We employed the Tsai results to confirm that
Test Installations Camera 1 Camera 2 Camera 3
Correct Height 9.1m 13.9m 6.7mTsai Height 9.9m 15.4m 5.7m
HRE 0.195 0.109 0.255Horizon ih -22.3 -174 17
Correct Angle 16:0Æ 24:3Æ 13:5Æ
Tsai Angle 16:7Æ 24:5Æ 7:7Æ
Our Approach 15:5Æ 23:3Æ 11:7Æ
Table 1: Look-Down Angle Results For clarity the look-down angle has been redefined as �=2�� defining the angleof intersection between ground plane and optical axis.
the camera had no significant roll i.e. rotation around theoptical axis - typically less than 4Æ. The method proposedin this work accurately located the lookdown angle althoughcare had to be taken to correctly fit the linear model to theprojected height ridge of the histogram.
4.2 Multi-Camera Calibration
Figure 6 plots the tracked object trajectories recovered fromour motion detection and tracking software[8] and projectedonto the local ground plane of each camera. These obser-vations are used to build the rotation and translation Houghspace described by equations 24. The populated space anddominant cluster are shown in Figure 7 (a) and (b) for theTEST and PETS datasets respectively. Note that these peaksare robustly recovered from an extensive noise floor. Pro-duced by computing registration estimates for every pairof trajectory observations, this floor arises from the needto avoid the prior establishment of observation correspon-dences.
The accuracy of the technique may be judged as beforeby comparing the registration results of the method with theequivalent data supplied by the Tsai calibration method (and
Proceedings 3rd IEEE Int. Workshop on PETS, Copenhagen, June 1 2002
45
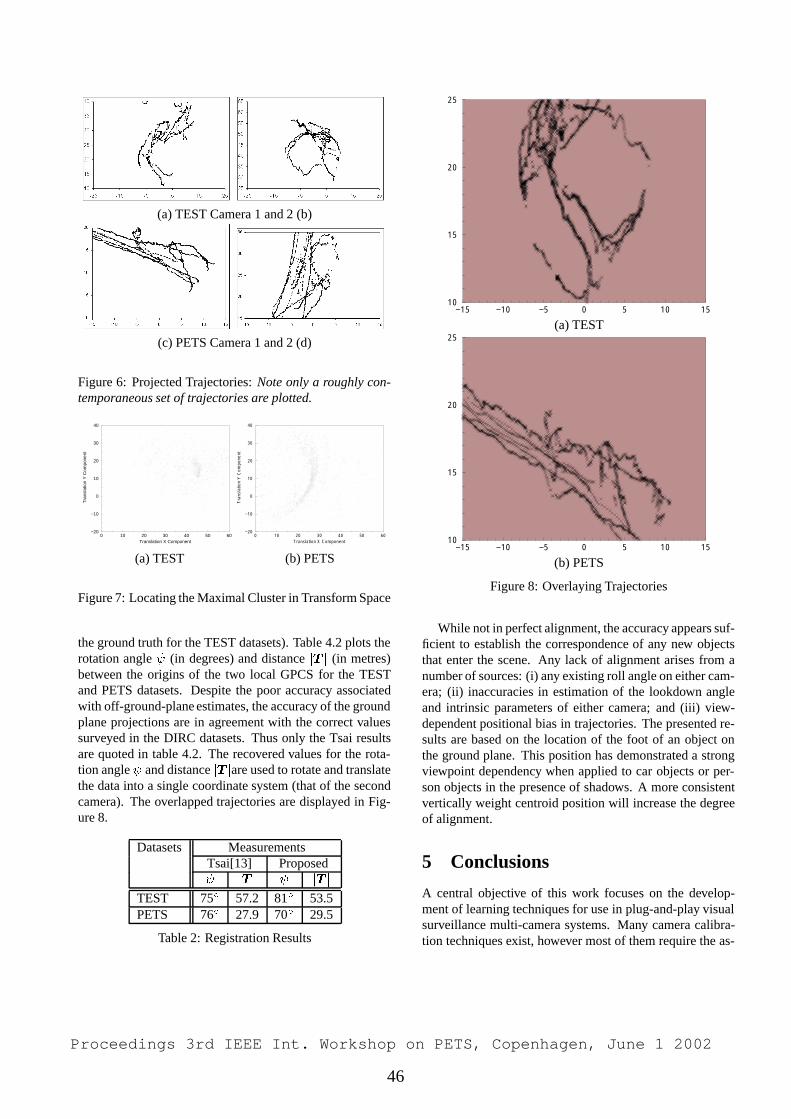
(a) TEST Camera 1 and 2 (b)
(c) PETS Camera 1 and 2 (d)
Figure 6: Projected Trajectories: Note only a roughly con-temporaneous set of trajectories are plotted.
0 10 20 30 40 50 60Translation X Component
−20
−10
0
10
20
30
40
Tra
nsla
tion
Y C
ompo
nent
0 10 20 30 40 50 60Translation X Component
−20
−10
0
10
20
30
40
Tra
nsla
tion
Y C
ompo
nent
(a) TEST (b) PETS
Figure 7: Locating the Maximal Cluster in Transform Space
the ground truth for the TEST datasets). Table 4.2 plots therotation angle (in degrees) and distance jT j (in metres)between the origins of the two local GPCS for the TESTand PETS datasets. Despite the poor accuracy associatedwith off-ground-plane estimates, the accuracy of the groundplane projections are in agreement with the correct valuessurveyed in the DIRC datasets. Thus only the Tsai resultsare quoted in table 4.2. The recovered values for the rota-tion angle and distance jT jare used to rotate and translatethe data into a single coordinate system (that of the secondcamera). The overlapped trajectories are displayed in Fig-ure 8.
Datasets MeasurementsTsai[13] Proposed jT j jT j
TEST 75Æ 57.2 81Æ 53.5PETS 76Æ 27.9 70Æ 29.5
Table 2: Registration Results
−15 −10 −5 0 5 10 1510
15
20
25
(a) TEST
−15 −10 −5 0 5 10 1510
15
20
25
(b) PETS
Figure 8: Overlaying Trajectories
While not in perfect alignment, the accuracy appears suf-ficient to establish the correspondence of any new objectsthat enter the scene. Any lack of alignment arises from anumber of sources: (i) any existing roll angle on either cam-era; (ii) inaccuracies in estimation of the lookdown angleand intrinsic parameters of either camera; and (iii) view-dependent positional bias in trajectories. The presented re-sults are based on the location of the foot of an object onthe ground plane. This position has demonstrated a strongviewpoint dependency when applied to car objects or per-son objects in the presence of shadows. A more consistentvertically weight centroid position will increase the degreeof alignment.
5 Conclusions
A central objective of this work focuses on the develop-ment of learning techniques for use in plug-and-play visualsurveillance multi-camera systems. Many camera calibra-tion techniques exist, however most of them require the as-
Proceedings 3rd IEEE Int. Workshop on PETS, Copenhagen, June 1 2002
46
sistance of an expert to tune a set of parameters. The under-lying strategy is to develop a suite of algorithms that couldbe installed by non-technical personnel, and as much as pos-sible based on self-adjusting techniques that learn how toadapt to the camera set-up, the environmental changes andpossibly to weather conditions. This paper proposes partof this work. This paper presents a novel camera calibra-tion approach, based on two separate stages. In the firststage a linear model of the projected height of objects in thescene is used in conjunction with world knowledge aboutthe average person height and the height of each camerato recover the image-plane to local-ground-plane transfor-mation of each camera. In the second stage, a clusteringtechnique (based on expectation-maximisation) is then usedto recover the transformation between these local groundplanes. A comparison between the proposed technique andthe standard approach of Tsai was carried out. Resultsfor both techniques, evaluated with ground truth measures,show that the accuracy of the proposed approach is similarto Tsai’s approach.
Although a more detailed evaluation is required, the pre-sented preliminarily results demonstrate that approach gen-erates sufficient accuracy to enable trajectory data to befused within a common ground plane coordinate system be-tween each pair of cameras. In particular, to robustly sup-port the plug and play the sensitivity of the approach to vi-olations in the assumptions of (i) projected height linearityand (ii) zero-roll angle must be investigated. Finally, themethod had to be tested on a new data set rather than thePETS2001 images as the lack of calibration points makesthe recover of accurate camera height problematic.
6 Acknowledgements
The authors gratefully acknowledge the support receivedboth from the EPSRC Grant GR/N17706 and from the VIG-ILANT project sponsored by Philip Crossland.
References
[1] Dana H. Ballard and Christopher M. Brown. ”Com-puter Vision”. Prentice-Hall, Inc., New Jersey, 1982.
[2] J. Black and T. Ellis. “Multi-Camera Image Track-ing”. In Second IEEE International Workshop on Per-formance Evaluation of Tracking and Surveillance,Hawaii, December 2001.
[3] B.A. Boghossian. “Motion-based Image ProcessingAlgorithms applied to Crowd Monitoring Systems”.PhD thesis, Kings College London, University of Lon-don, 2000.
[4] R.M. Haralick and H. Joo. ”2D-3D Pose Estimation”.Proceedings of the International Conference on Pat-tern Recognition, pages 385–391, November 14-171988.
[5] I.Haritaoglu, D.Harwood, and L.S.Davis. “W4: Real-time Surveillance of people and their Activities”.IEEE Transactions on Pattern Analysis and MachineIntelligence, 19(7):809–830, July 1997.
[6] Christopher Jaynes. “Multi-View Calibration fromPlanar Motion for Video Surveillance”. In SecondIEEE International Workshop on Visual Surveillance,pages 59–66, Fort Collins, Colorado, June 26 1999.
[7] A.J. Lipton, H. Fujiyoshi, and R.S. Patil. ”Mov-ing target classification and tracking from real-timevideo”. In Proceedings IEEE Image UnderstandingWorkshop, pages 129–136, 1998.
[8] J. Orwell, P. Remagnino, and G.A. Jones. “From Con-nected Components to Object Sequences”. In FirstIEEE International Workshop on Performance Eval-uation of Tracking and Surveillance, pages 72–79,2000.
[9] C.S. Regazzoni and A. Teschioni. “Real Time Track-ing of non rigid bodies for Surveillance applications”.In ISATA Conference, Firenze, 1997.
[10] J. Renno, J. Orwell, and G.A. Jones. “TowardsPlug-and-Play Visual Surveillance: Learning Track-ing Models”. In IEEE International Conference onImage Processing, page Accepted for Publication,Rochester, New York, September 22-25 2002.
[11] C. Stauffer and W.E.L. Grimson. “Learning Patternsof Activity using Real-Time Tracking”. IEEE Trans-actions on Pattern Analysis and Machine Intelligence,22(8):747–757, August 2000.
[12] G.P. Stein. “Tracking From Multiple Viewpoints:Self-Calibration Of Space And Time”. In DARPAImage Understanding Workshop, pages 1037–1042,Monterey, CA, November 1998.
[13] Roger Y. Tsai. “A versatile Camera Calibration Tech-nique for High-Accuracy 3D Machine Vision Metrol-ogy Using Off-the-Shelf TV Cameras and Lenses”.IEEE Journal of Robotics and Automation, RA-3(4):323–344, August 1987.
[14] C.R. Wren, A. Azarbayejani, T. Darrell, and A. P.Pentland. ”Pfinder: Real-time Tracking of the HumanBody”. IEEE Transactions on Pattern Analysis andMachine Intelligence, 19(7):780–785, July 1997.
Proceedings 3rd IEEE Int. Workshop on PETS, Copenhagen, June 1 2002
47
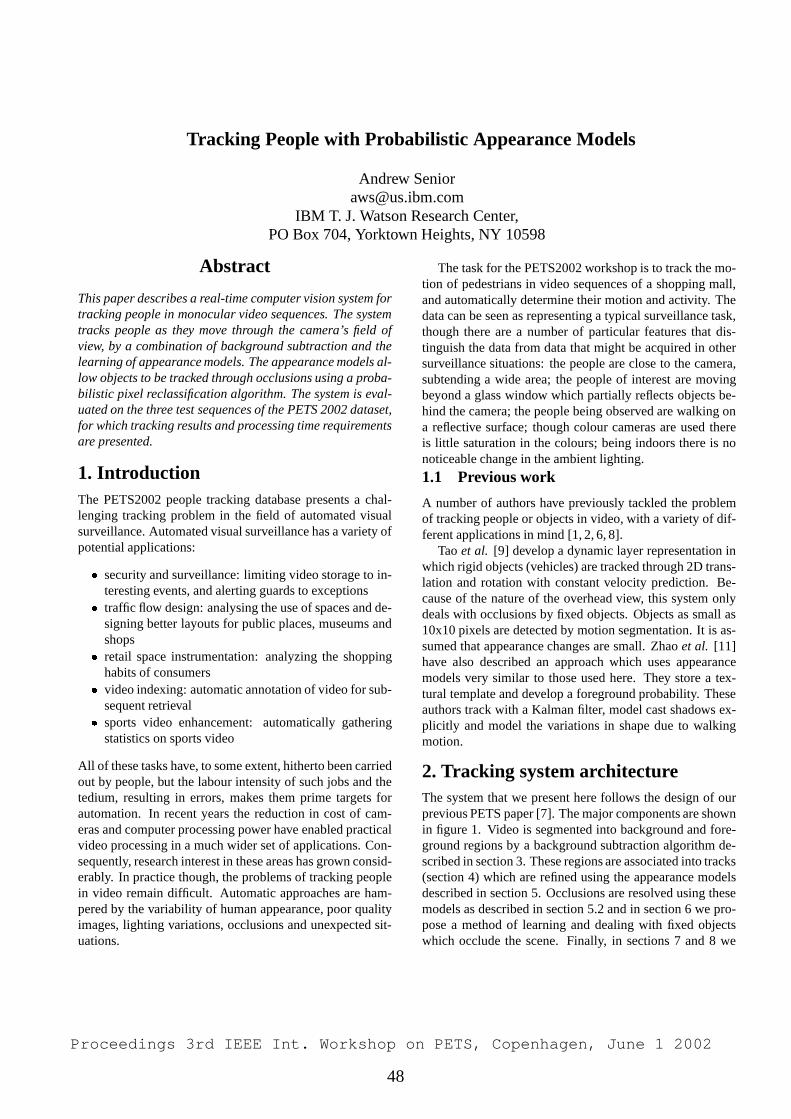
Tracking People with Probabilistic Appearance Models
Andrew [email protected]
IBM T. J. Watson Research Center,PO Box 704, Yorktown Heights, NY 10598
Abstract
This paper describes a real-time computer vision system fortracking people in monocular video sequences. The systemtracks people as they move through the camera’s field ofview, by a combination of background subtraction and thelearning of appearance models. The appearance models al-low objects to be tracked through occlusions using a proba-bilistic pixel reclassification algorithm. The system is eval-uated on the three test sequences of the PETS 2002 dataset,for which tracking results and processing time requirementsare presented.
1. IntroductionThe PETS2002 people tracking database presents a chal-lenging tracking problem in the field of automated visualsurveillance. Automated visual surveillance has a variety ofpotential applications:
� security and surveillance: limiting video storage to in-teresting events, and alerting guards to exceptions
� traffic flow design: analysing the use of spaces and de-signing better layouts for public places, museums andshops
� retail space instrumentation: analyzing the shoppinghabits of consumers
� video indexing: automatic annotation of video for sub-sequent retrieval
� sports video enhancement: automatically gatheringstatistics on sports video
All of these tasks have, to some extent, hitherto been carriedout by people, but the labour intensity of such jobs and thetedium, resulting in errors, makes them prime targets forautomation. In recent years the reduction in cost of cam-eras and computer processing power have enabled practicalvideo processing in a much wider set of applications. Con-sequently, research interest in these areas has grown consid-erably. In practice though, the problems of tracking peoplein video remain difficult. Automatic approaches are ham-pered by the variability of human appearance, poor qualityimages, lighting variations, occlusions and unexpected sit-uations.
The task for the PETS2002 workshop is to track the mo-tion of pedestrians in video sequences of a shopping mall,and automatically determine their motion and activity. Thedata can be seen as representing a typical surveillance task,though there are a number of particular features that dis-tinguish the data from data that might be acquired in othersurveillance situations: the people are close to the camera,subtending a wide area; the people of interest are movingbeyond a glass window which partially reflects objects be-hind the camera; the people being observed are walking ona reflective surface; though colour cameras are used thereis little saturation in the colours; being indoors there is nonoticeable change in the ambient lighting.
1.1 Previous work
A number of authors have previously tackled the problemof tracking people or objects in video, with a variety of dif-ferent applications in mind [1, 2, 6, 8].
Tao et al. [9] develop a dynamic layer representation inwhich rigid objects (vehicles) are tracked through 2D trans-lation and rotation with constant velocity prediction. Be-cause of the nature of the overhead view, this system onlydeals with occlusions by fixed objects. Objects as small as10x10 pixels are detected by motion segmentation. It is as-sumed that appearance changes are small. Zhao et al. [11]have also described an approach which uses appearancemodels very similar to those used here. They store a tex-tural template and develop a foreground probability. Theseauthors track with a Kalman filter, model cast shadows ex-plicitly and model the variations in shape due to walkingmotion.
2. Tracking system architectureThe system that we present here follows the design of ourprevious PETS paper [7]. The major components are shownin figure 1. Video is segmented into background and fore-ground regions by a background subtraction algorithm de-scribed in section 3. These regions are associated into tracks(section 4) which are refined using the appearance modelsdescribed in section 5. Occlusions are resolved using thesemodels as described in section 5.2 and in section 6 we pro-pose a method of learning and dealing with fixed objectswhich occlude the scene. Finally, in sections 7 and 8 we
Proceedings 3rd IEEE Int. Workshop on PETS, Copenhagen, June 1 2002
48
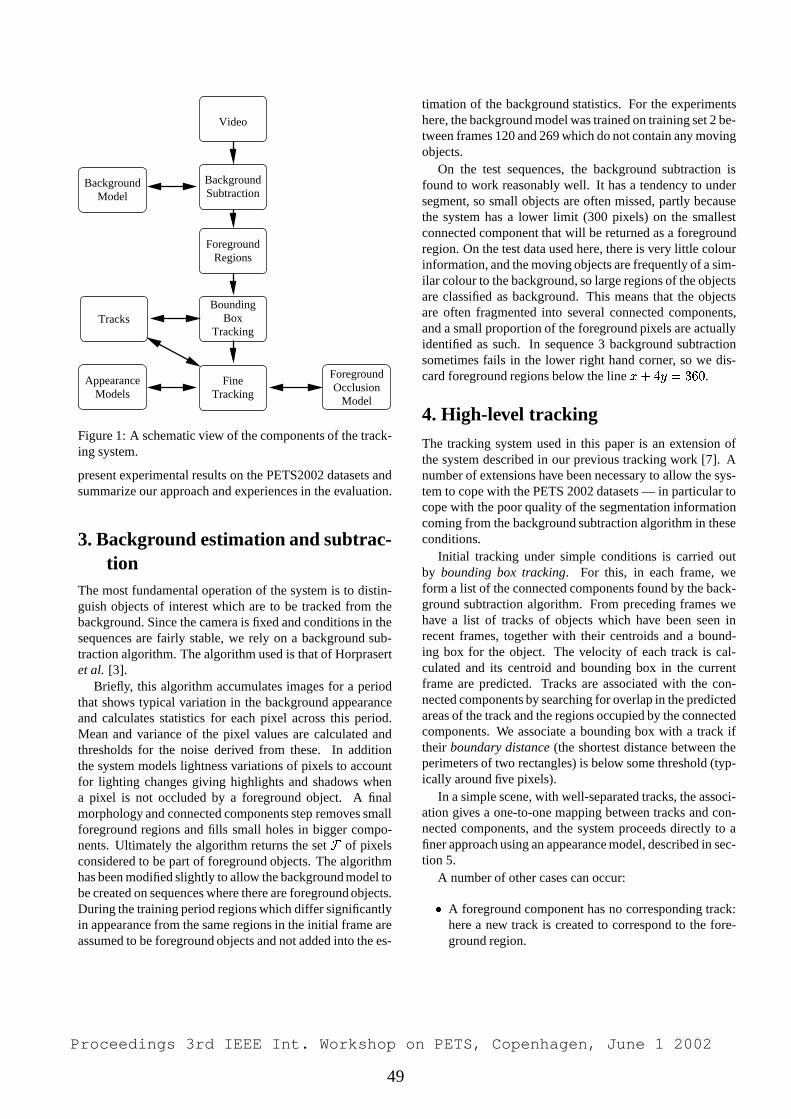
Video
OcclusionModel
AppearanceModels
BackgroundModel
BackgroundSubtraction
ForegroundRegions
BoundingBox
Tracking
FineTracking
Tracks
Foreground
Figure 1: A schematic view of the components of the track-ing system.
present experimental results on the PETS2002 datasets andsummarize our approach and experiences in the evaluation.
3. Background estimation and subtrac-tion
The most fundamental operation of the system is to distin-guish objects of interest which are to be tracked from thebackground. Since the camera is fixed and conditions in thesequences are fairly stable, we rely on a background sub-traction algorithm. The algorithm used is that of Horprasertet al. [3].
Briefly, this algorithm accumulates images for a periodthat shows typical variation in the background appearanceand calculates statistics for each pixel across this period.Mean and variance of the pixel values are calculated andthresholds for the noise derived from these. In additionthe system models lightness variations of pixels to accountfor lighting changes giving highlights and shadows whena pixel is not occluded by a foreground object. A finalmorphology and connected components step removes smallforeground regions and fills small holes in bigger compo-nents. Ultimately the algorithm returns the set
�of pixels
considered to be part of foreground objects. The algorithmhas been modified slightly to allow the background model tobe created on sequences where there are foreground objects.During the training period regions which differ significantlyin appearance from the same regions in the initial frame areassumed to be foreground objects and not added into the es-
timation of the background statistics. For the experimentshere, the background model was trained on training set 2 be-tween frames 120 and 269 which do not contain any movingobjects.
On the test sequences, the background subtraction isfound to work reasonably well. It has a tendency to undersegment, so small objects are often missed, partly becausethe system has a lower limit (300 pixels) on the smallestconnected component that will be returned as a foregroundregion. On the test data used here, there is very little colourinformation, and the moving objects are frequently of a sim-ilar colour to the background, so large regions of the objectsare classified as background. This means that the objectsare often fragmented into several connected components,and a small proportion of the foreground pixels are actuallyidentified as such. In sequence 3 background subtractionsometimes fails in the lower right hand corner, so we dis-card foreground regions below the line ����������� � .
4. High-level trackingThe tracking system used in this paper is an extension ofthe system described in our previous tracking work [7]. Anumber of extensions have been necessary to allow the sys-tem to cope with the PETS 2002 datasets — in particular tocope with the poor quality of the segmentation informationcoming from the background subtraction algorithm in theseconditions.
Initial tracking under simple conditions is carried outby bounding box tracking. For this, in each frame, weform a list of the connected components found by the back-ground subtraction algorithm. From preceding frames wehave a list of tracks of objects which have been seen inrecent frames, together with their centroids and a bound-ing box for the object. The velocity of each track is cal-culated and its centroid and bounding box in the currentframe are predicted. Tracks are associated with the con-nected components by searching for overlap in the predictedareas of the track and the regions occupied by the connectedcomponents. We associate a bounding box with a track iftheir boundary distance (the shortest distance between theperimeters of two rectangles) is below some threshold (typ-ically around five pixels).
In a simple scene, with well-separated tracks, the associ-ation gives a one-to-one mapping between tracks and con-nected components, and the system proceeds directly to afiner approach using an appearance model, described in sec-tion 5.
A number of other cases can occur:
� A foreground component has no corresponding track:here a new track is created to correspond to the fore-ground region.
Proceedings 3rd IEEE Int. Workshop on PETS, Copenhagen, June 1 2002
49
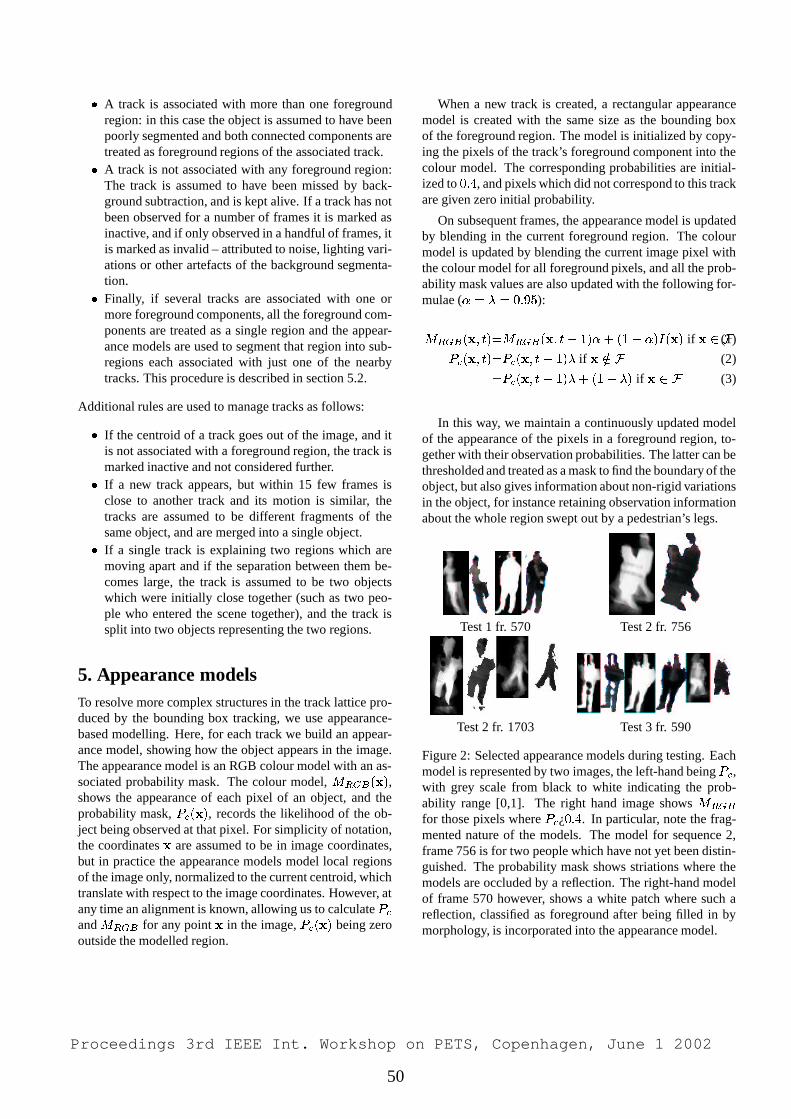
� A track is associated with more than one foregroundregion: in this case the object is assumed to have beenpoorly segmented and both connected components aretreated as foreground regions of the associated track.
� A track is not associated with any foreground region:The track is assumed to have been missed by back-ground subtraction, and is kept alive. If a track has notbeen observed for a number of frames it is marked asinactive, and if only observed in a handful of frames, itis marked as invalid – attributed to noise, lighting vari-ations or other artefacts of the background segmenta-tion.
� Finally, if several tracks are associated with one ormore foreground components, all the foreground com-ponents are treated as a single region and the appear-ance models are used to segment that region into sub-regions each associated with just one of the nearbytracks. This procedure is described in section 5.2.
Additional rules are used to manage tracks as follows:
� If the centroid of a track goes out of the image, and itis not associated with a foreground region, the track ismarked inactive and not considered further.
� If a new track appears, but within 15 few frames isclose to another track and its motion is similar, thetracks are assumed to be different fragments of thesame object, and are merged into a single object.
� If a single track is explaining two regions which aremoving apart and if the separation between them be-comes large, the track is assumed to be two objectswhich were initially close together (such as two peo-ple who entered the scene together), and the track issplit into two objects representing the two regions.
5. Appearance modelsTo resolve more complex structures in the track lattice pro-duced by the bounding box tracking, we use appearance-based modelling. Here, for each track we build an appear-ance model, showing how the object appears in the image.The appearance model is an RGB colour model with an as-sociated probability mask. The colour model, ����������� ,shows the appearance of each pixel of an object, and theprobability mask, ������ , records the likelihood of the ob-ject being observed at that pixel. For simplicity of notation,the coordinates are assumed to be in image coordinates,but in practice the appearance models model local regionsof the image only, normalized to the current centroid, whichtranslate with respect to the image coordinates. However, atany time an alignment is known, allowing us to calculate �and ������� for any point in the image, ������� being zerooutside the modelled region.
When a new track is created, a rectangular appearancemodel is created with the same size as the bounding boxof the foreground region. The model is initialized by copy-ing the pixels of the track’s foreground component into thecolour model. The corresponding probabilities are initial-ized to ��� � , and pixels which did not correspond to this trackare given zero initial probability.
On subsequent frames, the appearance model is updatedby blending in the current foreground region. The colourmodel is updated by blending the current image pixel withthe colour model for all foreground pixels, and all the prob-ability mask values are also updated with the following for-mulae ( � ��� � ��� ��� ):
�������������� � �!����������� ��"$#%�&� �'�&#�"(���&)*���� if (+ �(1)
��%������ � �, ������� ��"-#���� if /.+ � (2)
�, ������� ��"-#���� �'��"��1� if 2+ � (3)
In this way, we maintain a continuously updated modelof the appearance of the pixels in a foreground region, to-gether with their observation probabilities. The latter can bethresholded and treated as a mask to find the boundary of theobject, but also gives information about non-rigid variationsin the object, for instance retaining observation informationabout the whole region swept out by a pedestrian’s legs.
Test 1 fr. 570 Test 2 fr. 756
Test 2 fr. 1703 Test 3 fr. 590
Figure 2: Selected appearance models during testing. Eachmodel is represented by two images, the left-hand being 3� ,with grey scale from black to white indicating the prob-ability range [0,1]. The right hand image shows �$�����for those pixels where � ¿ ��� � . In particular, note the frag-mented nature of the models. The model for sequence 2,frame 756 is for two people which have not yet been distin-guished. The probability mask shows striations where themodels are occluded by a reflection. The right-hand modelof frame 570 however, shows a white patch where such areflection, classified as foreground after being filled in bymorphology, is incorporated into the appearance model.
Proceedings 3rd IEEE Int. Workshop on PETS, Copenhagen, June 1 2002
50
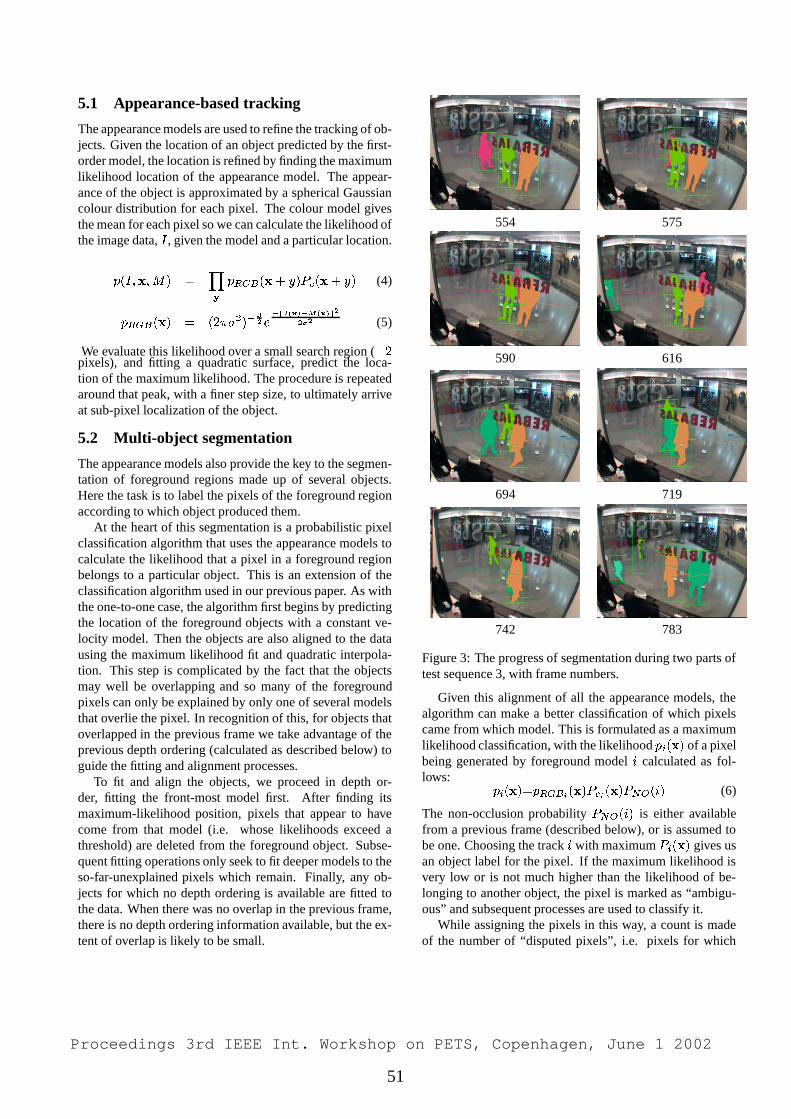
5.1 Appearance-based tracking
The appearance models are used to refine the tracking of ob-jects. Given the location of an object predicted by the first-order model, the location is refined by finding the maximumlikelihood location of the appearance model. The appear-ance of the object is approximated by a spherical Gaussiancolour distribution for each pixel. The colour model givesthe mean for each pixel so we can calculate the likelihood ofthe image data, ) , given the model and a particular location.
� �)1� �� � � ���� ����� �� ��� �& ��%�� � ��� (4)
� ����� ���� � ������� ���� ������������������� ������� ��"! � (5)
We evaluate this likelihood over a small search region ( #$�pixels), and fitting a quadratic surface, predict the loca-tion of the maximum likelihood. The procedure is repeatedaround that peak, with a finer step size, to ultimately arriveat sub-pixel localization of the object.
5.2 Multi-object segmentation
The appearance models also provide the key to the segmen-tation of foreground regions made up of several objects.Here the task is to label the pixels of the foreground regionaccording to which object produced them.
At the heart of this segmentation is a probabilistic pixelclassification algorithm that uses the appearance models tocalculate the likelihood that a pixel in a foreground regionbelongs to a particular object. This is an extension of theclassification algorithm used in our previous paper. As withthe one-to-one case, the algorithm first begins by predictingthe location of the foreground objects with a constant ve-locity model. Then the objects are also aligned to the datausing the maximum likelihood fit and quadratic interpola-tion. This step is complicated by the fact that the objectsmay well be overlapping and so many of the foregroundpixels can only be explained by only one of several modelsthat overlie the pixel. In recognition of this, for objects thatoverlapped in the previous frame we take advantage of theprevious depth ordering (calculated as described below) toguide the fitting and alignment processes.
To fit and align the objects, we proceed in depth or-der, fitting the front-most model first. After finding itsmaximum-likelihood position, pixels that appear to havecome from that model (i.e. whose likelihoods exceed athreshold) are deleted from the foreground object. Subse-quent fitting operations only seek to fit deeper models to theso-far-unexplained pixels which remain. Finally, any ob-jects for which no depth ordering is available are fitted tothe data. When there was no overlap in the previous frame,there is no depth ordering information available, but the ex-tent of overlap is likely to be small.
554 575
590 616
694 719
742 783
Figure 3: The progress of segmentation during two parts oftest sequence 3, with frame numbers.
Given this alignment of all the appearance models, thealgorithm can make a better classification of which pixelscame from which model. This is formulated as a maximumlikelihood classification, with the likelihood �% ���� of a pixelbeing generated by foreground model & calculated as fol-lows: �'% ���� � � �����( ���& ��"( ���& *) + �,&&� (6)
The non-occlusion probability -)�+ �,&&� is either availablefrom a previous frame (described below), or is assumed tobe one. Choosing the track & with maximum % ��� gives usan object label for the pixel. If the maximum likelihood isvery low or is not much higher than the likelihood of be-longing to another object, the pixel is marked as “ambigu-ous” and subsequent processes are used to classify it.
While assigning the pixels in this way, a count is madeof the number of “disputed pixels”, i.e. pixels for which
Proceedings 3rd IEEE Int. Workshop on PETS, Copenhagen, June 1 2002
51
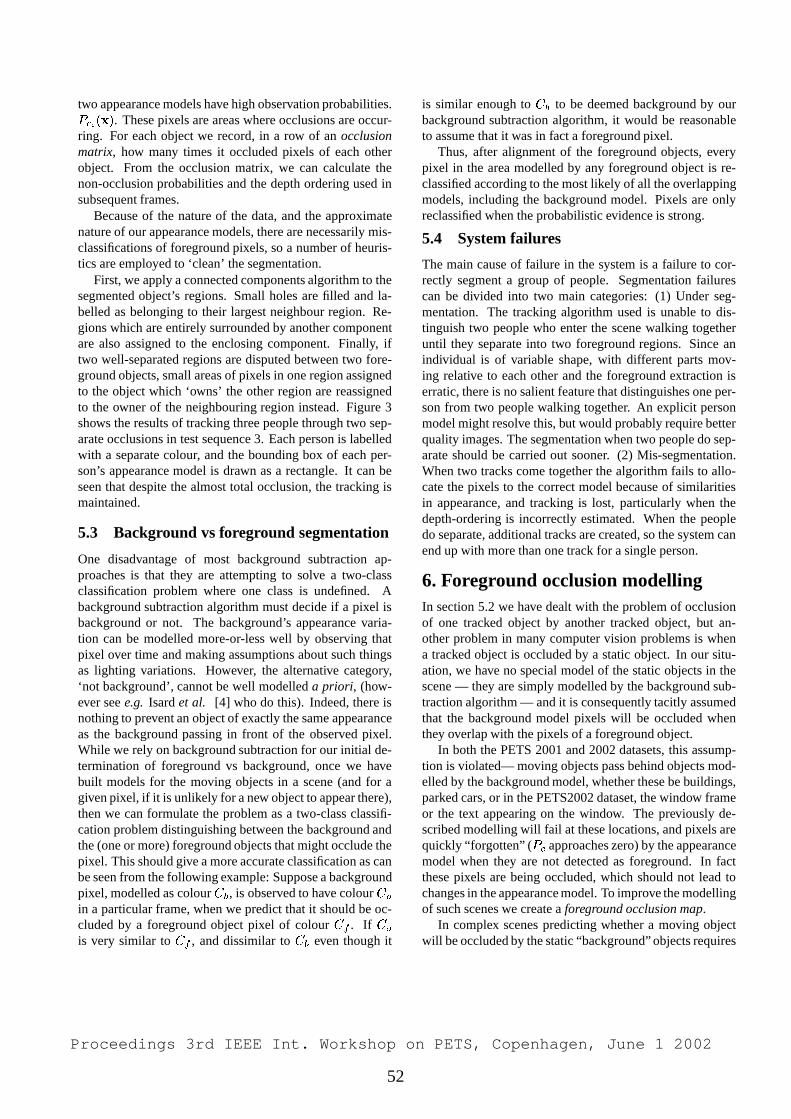
two appearance models have high observation probabilities. �"( ��� . These pixels are areas where occlusions are occur-ring. For each object we record, in a row of an occlusionmatrix, how many times it occluded pixels of each otherobject. From the occlusion matrix, we can calculate thenon-occlusion probabilities and the depth ordering used insubsequent frames.
Because of the nature of the data, and the approximatenature of our appearance models, there are necessarily mis-classifications of foreground pixels, so a number of heuris-tics are employed to ‘clean’ the segmentation.
First, we apply a connected components algorithm to thesegmented object’s regions. Small holes are filled and la-belled as belonging to their largest neighbour region. Re-gions which are entirely surrounded by another componentare also assigned to the enclosing component. Finally, iftwo well-separated regions are disputed between two fore-ground objects, small areas of pixels in one region assignedto the object which ‘owns’ the other region are reassignedto the owner of the neighbouring region instead. Figure 3shows the results of tracking three people through two sep-arate occlusions in test sequence 3. Each person is labelledwith a separate colour, and the bounding box of each per-son’s appearance model is drawn as a rectangle. It can beseen that despite the almost total occlusion, the tracking ismaintained.
5.3 Background vs foreground segmentation
One disadvantage of most background subtraction ap-proaches is that they are attempting to solve a two-classclassification problem where one class is undefined. Abackground subtraction algorithm must decide if a pixel isbackground or not. The background’s appearance varia-tion can be modelled more-or-less well by observing thatpixel over time and making assumptions about such thingsas lighting variations. However, the alternative category,‘not background’, cannot be well modelled a priori, (how-ever see e.g. Isard et al. [4] who do this). Indeed, there isnothing to prevent an object of exactly the same appearanceas the background passing in front of the observed pixel.While we rely on background subtraction for our initial de-termination of foreground vs background, once we havebuilt models for the moving objects in a scene (and for agiven pixel, if it is unlikely for a new object to appear there),then we can formulate the problem as a two-class classifi-cation problem distinguishing between the background andthe (one or more) foreground objects that might occlude thepixel. This should give a more accurate classification as canbe seen from the following example: Suppose a backgroundpixel, modelled as colour ��� , is observed to have colour ���in a particular frame, when we predict that it should be oc-cluded by a foreground object pixel of colour ��� . If � �is very similar to ��� , and dissimilar to � � even though it
is similar enough to � � to be deemed background by ourbackground subtraction algorithm, it would be reasonableto assume that it was in fact a foreground pixel.
Thus, after alignment of the foreground objects, everypixel in the area modelled by any foreground object is re-classified according to the most likely of all the overlappingmodels, including the background model. Pixels are onlyreclassified when the probabilistic evidence is strong.
5.4 System failures
The main cause of failure in the system is a failure to cor-rectly segment a group of people. Segmentation failurescan be divided into two main categories: (1) Under seg-mentation. The tracking algorithm used is unable to dis-tinguish two people who enter the scene walking togetheruntil they separate into two foreground regions. Since anindividual is of variable shape, with different parts mov-ing relative to each other and the foreground extraction iserratic, there is no salient feature that distinguishes one per-son from two people walking together. An explicit personmodel might resolve this, but would probably require betterquality images. The segmentation when two people do sep-arate should be carried out sooner. (2) Mis-segmentation.When two tracks come together the algorithm fails to allo-cate the pixels to the correct model because of similaritiesin appearance, and tracking is lost, particularly when thedepth-ordering is incorrectly estimated. When the peopledo separate, additional tracks are created, so the system canend up with more than one track for a single person.
6. Foreground occlusion modellingIn section 5.2 we have dealt with the problem of occlusionof one tracked object by another tracked object, but an-other problem in many computer vision problems is whena tracked object is occluded by a static object. In our situ-ation, we have no special model of the static objects in thescene — they are simply modelled by the background sub-traction algorithm — and it is consequently tacitly assumedthat the background model pixels will be occluded whenthey overlap with the pixels of a foreground object.
In both the PETS 2001 and 2002 datasets, this assump-tion is violated— moving objects pass behind objects mod-elled by the background model, whether these be buildings,parked cars, or in the PETS2002 dataset, the window frameor the text appearing on the window. The previously de-scribed modelling will fail at these locations, and pixels arequickly “forgotten” ( � approaches zero) by the appearancemodel when they are not detected as foreground. In factthese pixels are being occluded, which should not lead tochanges in the appearance model. To improve the modellingof such scenes we create a foreground occlusion map.
In complex scenes predicting whether a moving objectwill be occluded by the static “background” objects requires
Proceedings 3rd IEEE Int. Workshop on PETS, Copenhagen, June 1 2002
52
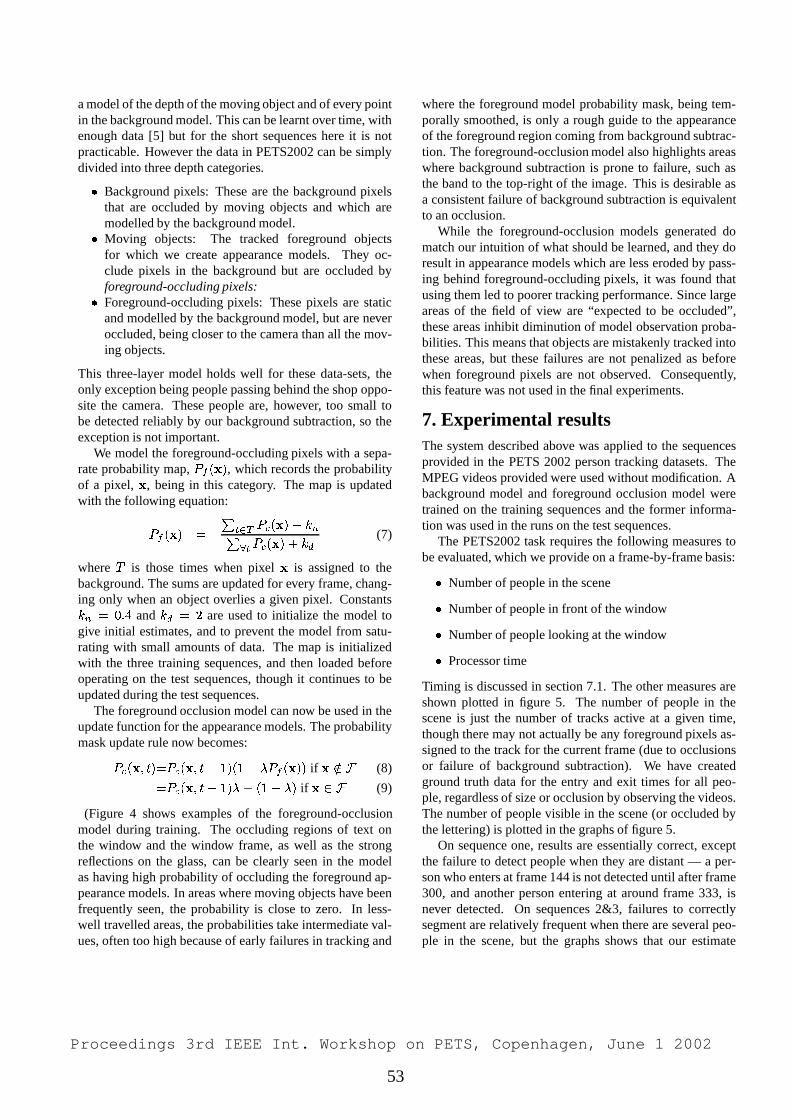
a model of the depth of the moving object and of every pointin the background model. This can be learnt over time, withenough data [5] but for the short sequences here it is notpracticable. However the data in PETS2002 can be simplydivided into three depth categories.
� Background pixels: These are the background pixelsthat are occluded by moving objects and which aremodelled by the background model.
� Moving objects: The tracked foreground objectsfor which we create appearance models. They oc-clude pixels in the background but are occluded byforeground-occluding pixels:
� Foreground-occluding pixels: These pixels are staticand modelled by the background model, but are neveroccluded, being closer to the camera than all the mov-ing objects.
This three-layer model holds well for these data-sets, theonly exception being people passing behind the shop oppo-site the camera. These people are, however, too small tobe detected reliably by our background subtraction, so theexception is not important.
We model the foreground-occluding pixels with a sepa-rate probability map, �*���� , which records the probabilityof a pixel, , being in this category. The map is updatedwith the following equation:
�*���� �������� ����� ���� � � � ��� ����� (7)
where � is those times when pixel is assigned to thebackground. The sums are updated for every frame, chang-ing only when an object overlies a given pixel. Constants� � ��� � and ��� � � are used to initialize the model togive initial estimates, and to prevent the model from satu-rating with small amounts of data. The map is initializedwith the three training sequences, and then loaded beforeoperating on the test sequences, though it continues to beupdated during the test sequences.
The foreground occlusion model can now be used in theupdate function for the appearance models. The probabilitymask update rule now becomes:
�%��� � � �, ���������"$#%� ��"��1 �*������ if .+ � (8)
�, ���������"$#%� � �'��"��*� if (+ � (9)
(Figure 4 shows examples of the foreground-occlusionmodel during training. The occluding regions of text onthe window and the window frame, as well as the strongreflections on the glass, can be clearly seen in the modelas having high probability of occluding the foreground ap-pearance models. In areas where moving objects have beenfrequently seen, the probability is close to zero. In less-well travelled areas, the probabilities take intermediate val-ues, often too high because of early failures in tracking and
where the foreground model probability mask, being tem-porally smoothed, is only a rough guide to the appearanceof the foreground region coming from background subtrac-tion. The foreground-occlusion model also highlights areaswhere background subtraction is prone to failure, such asthe band to the top-right of the image. This is desirable asa consistent failure of background subtraction is equivalentto an occlusion.
While the foreground-occlusion models generated domatch our intuition of what should be learned, and they doresult in appearance models which are less eroded by pass-ing behind foreground-occluding pixels, it was found thatusing them led to poorer tracking performance. Since largeareas of the field of view are “expected to be occluded”,these areas inhibit diminution of model observation proba-bilities. This means that objects are mistakenly tracked intothese areas, but these failures are not penalized as beforewhen foreground pixels are not observed. Consequently,this feature was not used in the final experiments.
7. Experimental resultsThe system described above was applied to the sequencesprovided in the PETS 2002 person tracking datasets. TheMPEG videos provided were used without modification. Abackground model and foreground occlusion model weretrained on the training sequences and the former informa-tion was used in the runs on the test sequences.
The PETS2002 task requires the following measures tobe evaluated, which we provide on a frame-by-frame basis:
� Number of people in the scene
� Number of people in front of the window
� Number of people looking at the window
� Processor time
Timing is discussed in section 7.1. The other measures areshown plotted in figure 5. The number of people in thescene is just the number of tracks active at a given time,though there may not actually be any foreground pixels as-signed to the track for the current frame (due to occlusionsor failure of background subtraction). We have createdground truth data for the entry and exit times for all peo-ple, regardless of size or occlusion by observing the videos.The number of people visible in the scene (or occluded bythe lettering) is plotted in the graphs of figure 5.
On sequence one, results are essentially correct, exceptthe failure to detect people when they are distant — a per-son who enters at frame 144 is not detected until after frame300, and another person entering at around frame 333, isnever detected. On sequences 2&3, failures to correctlysegment are relatively frequent when there are several peo-ple in the scene, but the graphs shows that our estimate
Proceedings 3rd IEEE Int. Workshop on PETS, Copenhagen, June 1 2002
53
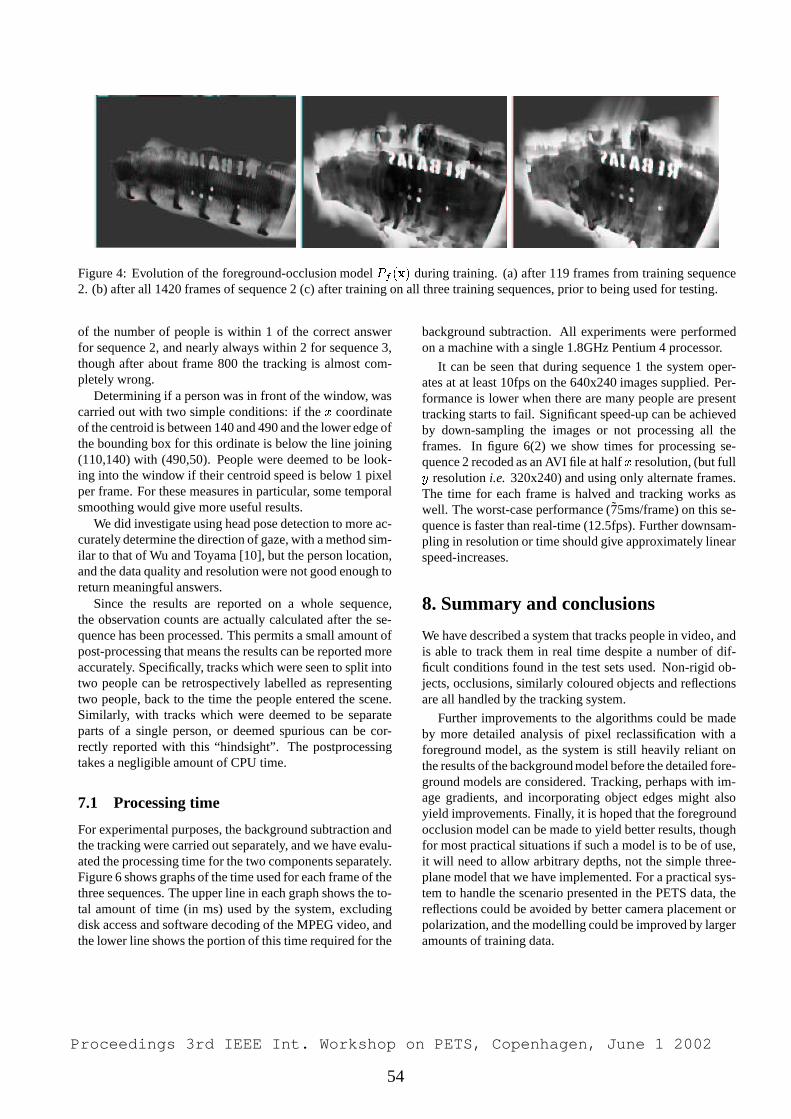
Figure 4: Evolution of the foreground-occlusion model �*���� during training. (a) after 119 frames from training sequence2. (b) after all 1420 frames of sequence 2 (c) after training on all three training sequences, prior to being used for testing.
of the number of people is within 1 of the correct answerfor sequence 2, and nearly always within 2 for sequence 3,though after about frame 800 the tracking is almost com-pletely wrong.
Determining if a person was in front of the window, wascarried out with two simple conditions: if the � coordinateof the centroid is between 140 and 490 and the lower edge ofthe bounding box for this ordinate is below the line joining(110,140) with (490,50). People were deemed to be look-ing into the window if their centroid speed is below 1 pixelper frame. For these measures in particular, some temporalsmoothing would give more useful results.
We did investigate using head pose detection to more ac-curately determine the direction of gaze, with a method sim-ilar to that of Wu and Toyama [10], but the person location,and the data quality and resolution were not good enough toreturn meaningful answers.
Since the results are reported on a whole sequence,the observation counts are actually calculated after the se-quence has been processed. This permits a small amount ofpost-processing that means the results can be reported moreaccurately. Specifically, tracks which were seen to split intotwo people can be retrospectively labelled as representingtwo people, back to the time the people entered the scene.Similarly, with tracks which were deemed to be separateparts of a single person, or deemed spurious can be cor-rectly reported with this “hindsight”. The postprocessingtakes a negligible amount of CPU time.
7.1 Processing time
For experimental purposes, the background subtraction andthe tracking were carried out separately, and we have evalu-ated the processing time for the two components separately.Figure 6 shows graphs of the time used for each frame of thethree sequences. The upper line in each graph shows the to-tal amount of time (in ms) used by the system, excludingdisk access and software decoding of the MPEG video, andthe lower line shows the portion of this time required for the
background subtraction. All experiments were performedon a machine with a single 1.8GHz Pentium 4 processor.
It can be seen that during sequence 1 the system oper-ates at at least 10fps on the 640x240 images supplied. Per-formance is lower when there are many people are presenttracking starts to fail. Significant speed-up can be achievedby down-sampling the images or not processing all theframes. In figure 6(2) we show times for processing se-quence 2 recoded as an AVI file at half � resolution, (but full� resolution i.e. 320x240) and using only alternate frames.The time for each frame is halved and tracking works aswell. The worst-case performance (75ms/frame) on this se-quence is faster than real-time (12.5fps). Further downsam-pling in resolution or time should give approximately linearspeed-increases.
8. Summary and conclusions
We have described a system that tracks people in video, andis able to track them in real time despite a number of dif-ficult conditions found in the test sets used. Non-rigid ob-jects, occlusions, similarly coloured objects and reflectionsare all handled by the tracking system.
Further improvements to the algorithms could be madeby more detailed analysis of pixel reclassification with aforeground model, as the system is still heavily reliant onthe results of the background model before the detailed fore-ground models are considered. Tracking, perhaps with im-age gradients, and incorporating object edges might alsoyield improvements. Finally, it is hoped that the foregroundocclusion model can be made to yield better results, thoughfor most practical situations if such a model is to be of use,it will need to allow arbitrary depths, not the simple three-plane model that we have implemented. For a practical sys-tem to handle the scenario presented in the PETS data, thereflections could be avoided by better camera placement orpolarization, and the modelling could be improved by largeramounts of training data.
Proceedings 3rd IEEE Int. Workshop on PETS, Copenhagen, June 1 2002
54
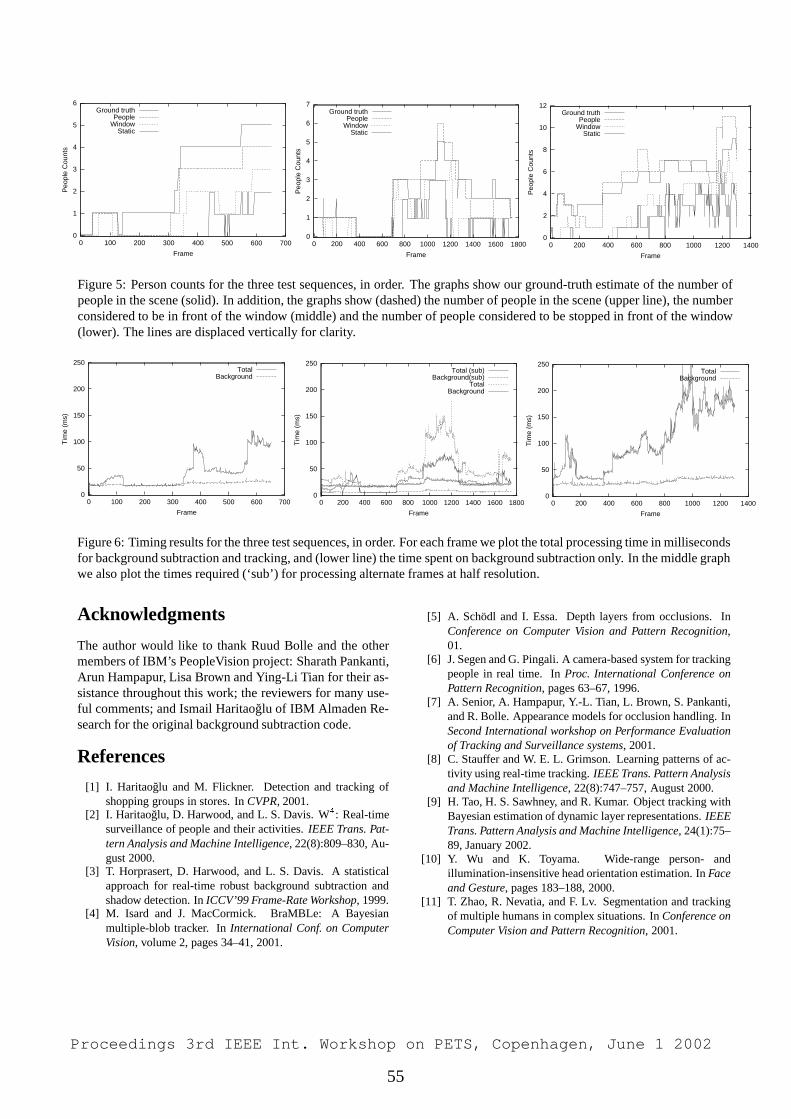
0
1
2
3
4
5
6
0 100 200 300 400 500 600 700
Peo
ple
Cou
nts
Frame
Ground truthPeople
WindowStatic
0
1
2
3
4
5
6
7
0 200 400 600 800 1000 1200 1400 1600 1800
Peo
ple
Cou
nts
Frame
Ground truthPeople
WindowStatic
0
2
4
6
8
10
12
0 200 400 600 800 1000 1200 1400
Peo
ple
Cou
nts
Frame
Ground truthPeople
WindowStatic
Figure 5: Person counts for the three test sequences, in order. The graphs show our ground-truth estimate of the number ofpeople in the scene (solid). In addition, the graphs show (dashed) the number of people in the scene (upper line), the numberconsidered to be in front of the window (middle) and the number of people considered to be stopped in front of the window(lower). The lines are displaced vertically for clarity.
0
50
100
150
200
250
0 100 200 300 400 500 600 700
Tim
e (m
s)
Frame
TotalBackground
0
50
100
150
200
250
0 200 400 600 800 1000 1200 1400 1600 1800
Tim
e (m
s)
Frame
Total (sub)Background(sub)
TotalBackground
0
50
100
150
200
250
0 200 400 600 800 1000 1200 1400
Tim
e (m
s)
Frame
TotalBackground
Figure 6: Timing results for the three test sequences, in order. For each frame we plot the total processing time in millisecondsfor background subtraction and tracking, and (lower line) the time spent on background subtraction only. In the middle graphwe also plot the times required (‘sub’) for processing alternate frames at half resolution.
Acknowledgments
The author would like to thank Ruud Bolle and the othermembers of IBM’s PeopleVision project: Sharath Pankanti,Arun Hampapur, Lisa Brown and Ying-Li Tian for their as-sistance throughout this work; the reviewers for many use-ful comments; and Ismail Haritaoglu of IBM Almaden Re-search for the original background subtraction code.
References
[1] I. Haritaoglu and M. Flickner. Detection and tracking ofshopping groups in stores. In CVPR, 2001.
[2] I. Haritaoglu, D. Harwood, and L. S. Davis. W � : Real-timesurveillance of people and their activities. IEEE Trans. Pat-tern Analysis and Machine Intelligence, 22(8):809–830, Au-gust 2000.
[3] T. Horprasert, D. Harwood, and L. S. Davis. A statisticalapproach for real-time robust background subtraction andshadow detection. In ICCV’99 Frame-Rate Workshop, 1999.
[4] M. Isard and J. MacCormick. BraMBLe: A Bayesianmultiple-blob tracker. In International Conf. on ComputerVision, volume 2, pages 34–41, 2001.
[5] A. Schodl and I. Essa. Depth layers from occlusions. InConference on Computer Vision and Pattern Recognition,01.
[6] J. Segen and G. Pingali. A camera-based system for trackingpeople in real time. In Proc. International Conference onPattern Recognition, pages 63–67, 1996.
[7] A. Senior, A. Hampapur, Y.-L. Tian, L. Brown, S. Pankanti,and R. Bolle. Appearance models for occlusion handling. InSecond International workshop on Performance Evaluationof Tracking and Surveillance systems, 2001.
[8] C. Stauffer and W. E. L. Grimson. Learning patterns of ac-tivity using real-time tracking. IEEE Trans. Pattern Analysisand Machine Intelligence, 22(8):747–757, August 2000.
[9] H. Tao, H. S. Sawhney, and R. Kumar. Object tracking withBayesian estimation of dynamic layer representations. IEEETrans. Pattern Analysis and Machine Intelligence, 24(1):75–89, January 2002.
[10] Y. Wu and K. Toyama. Wide-range person- andillumination-insensitive head orientation estimation. In Faceand Gesture, pages 183–188, 2000.
[11] T. Zhao, R. Nevatia, and F. Lv. Segmentation and trackingof multiple humans in complex situations. In Conference onComputer Vision and Pattern Recognition, 2001.
Proceedings 3rd IEEE Int. Workshop on PETS, Copenhagen, June 1 2002
55
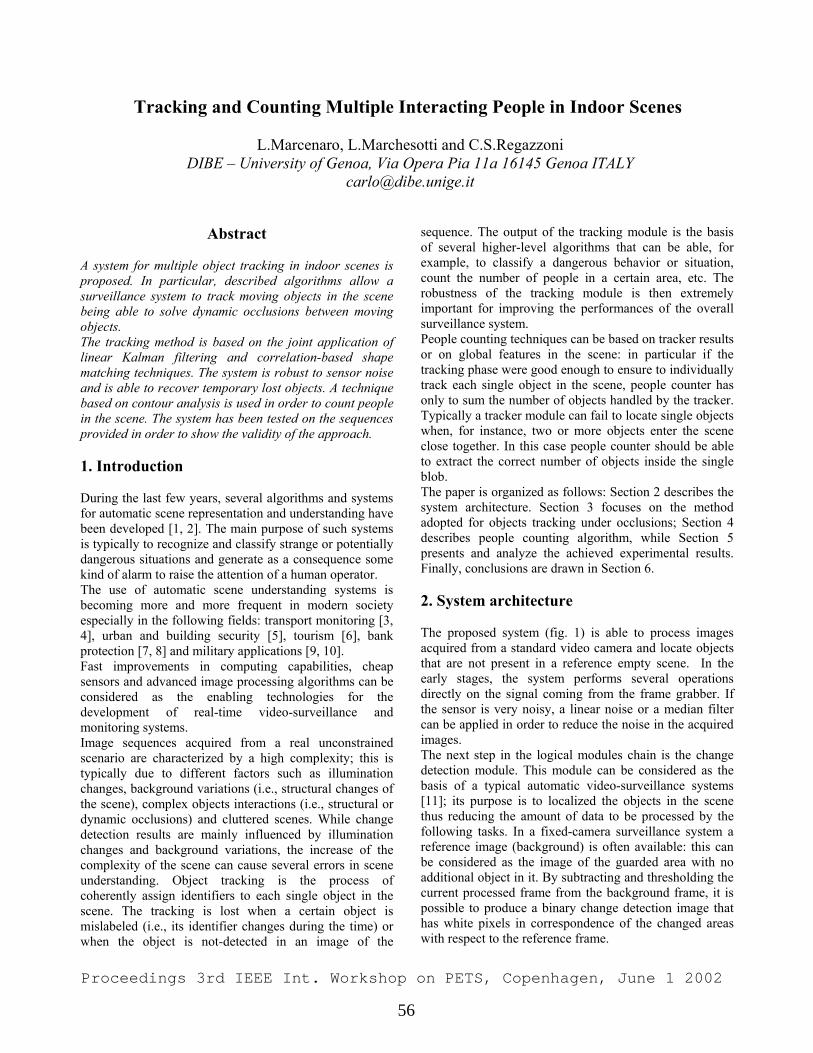
Tracking and Counting Multiple Interacting People in Indoor Scenes
L.Marcenaro, L.Marchesotti and C.S.Regazzoni DIBE – University of Genoa, Via Opera Pia 11a 16145 Genoa ITALY
Abstract
A system for multiple object tracking in indoor scenes is proposed. In particular, described algorithms allow a surveillance system to track moving objects in the scene being able to solve dynamic occlusions between moving objects. The tracking method is based on the joint application of linear Kalman filtering and correlation-based shape matching techniques. The system is robust to sensor noise and is able to recover temporary lost objects. A technique based on contour analysis is used in order to count people in the scene. The system has been tested on the sequences provided in order to show the validity of the approach. 1. Introduction During the last few years, several algorithms and systems for automatic scene representation and understanding have been developed [1, 2]. The main purpose of such systems is typically to recognize and classify strange or potentially dangerous situations and generate as a consequence some kind of alarm to raise the attention of a human operator. The use of automatic scene understanding systems is becoming more and more frequent in modern society especially in the following fields: transport monitoring [3, 4], urban and building security [5], tourism [6], bank protection [7, 8] and military applications [9, 10]. Fast improvements in computing capabilities, cheap sensors and advanced image processing algorithms can be considered as the enabling technologies for the development of real-time video-surveillance and monitoring systems. Image sequences acquired from a real unconstrained scenario are characterized by a high complexity; this is typically due to different factors such as illumination changes, background variations (i.e., structural changes of the scene), complex objects interactions (i.e., structural or dynamic occlusions) and cluttered scenes. While change detection results are mainly influenced by illumination changes and background variations, the increase of the complexity of the scene can cause several errors in scene understanding. Object tracking is the process of coherently assign identifiers to each single object in the scene. The tracking is lost when a certain object is mislabeled (i.e., its identifier changes during the time) or when the object is not-detected in an image of the
sequence. The output of the tracking module is the basis of several higher-level algorithms that can be able, for example, to classify a dangerous behavior or situation, count the number of people in a certain area, etc. The robustness of the tracking module is then extremely important for improving the performances of the overall surveillance system. People counting techniques can be based on tracker results or on global features in the scene: in particular if the tracking phase were good enough to ensure to individually track each single object in the scene, people counter has only to sum the number of objects handled by the tracker. Typically a tracker module can fail to locate single objects when, for instance, two or more objects enter the scene close together. In this case people counter should be able to extract the correct number of objects inside the single blob. The paper is organized as follows: Section 2 describes the system architecture. Section 3 focuses on the method adopted for objects tracking under occlusions; Section 4 describes people counting algorithm, while Section 5 presents and analyze the achieved experimental results. Finally, conclusions are drawn in Section 6. 2. System architecture The proposed system (fig. 1) is able to process images acquired from a standard video camera and locate objects that are not present in a reference empty scene. In the early stages, the system performs several operations directly on the signal coming from the frame grabber. If the sensor is very noisy, a linear noise or a median filter can be applied in order to reduce the noise in the acquired images. The next step in the logical modules chain is the change detection module. This module can be considered as the basis of a typical automatic video-surveillance systems [11]; its purpose is to localized the objects in the scene thus reducing the amount of data to be processed by the following tasks. In a fixed-camera surveillance system a reference image (background) is often available: this can be considered as the image of the guarded area with no additional object in it. By subtracting and thresholding the current processed frame from the background frame, it is possible to produce a binary change detection image that has white pixels in correspondence of the changed areas with respect to the reference frame.
Proceedings 3rd IEEE Int. Workshop on PETS, Copenhagen, June 1 2002
56
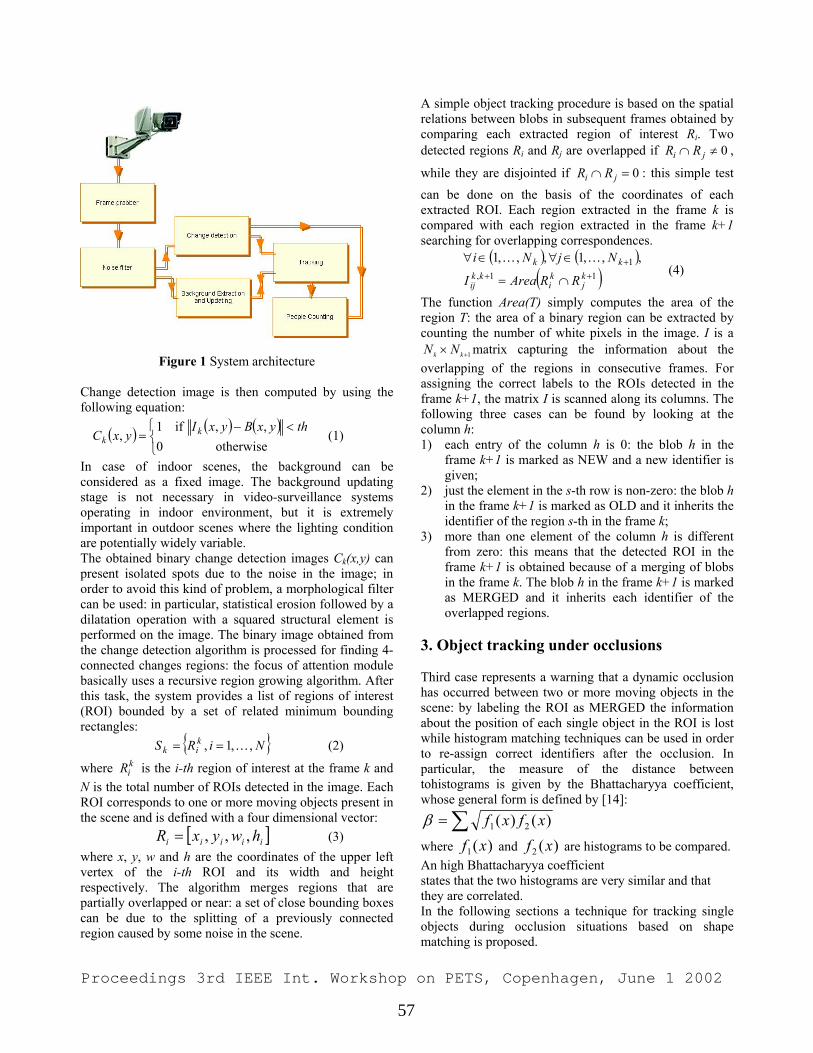
Figure 1 System architecture
Change detection image is then computed by using the following equation:
( ) ( ) ( ) <−
=otherwise0
,, if1,
thyxByxIyxC k
k (1)
In case of indoor scenes, the background can be considered as a fixed image. The background updating stage is not necessary in video-surveillance systems operating in indoor environment, but it is extremely important in outdoor scenes where the lighting condition are potentially widely variable. The obtained binary change detection images Ck(x,y) can present isolated spots due to the noise in the image; in order to avoid this kind of problem, a morphological filter can be used: in particular, statistical erosion followed by a dilatation operation with a squared structural element is performed on the image. The binary image obtained from the change detection algorithm is processed for finding 4-connected changes regions: the focus of attention module basically uses a recursive region growing algorithm. After this task, the system provides a list of regions of interest (ROI) bounded by a set of related minimum bounding rectangles: { }NiRS k
ik ,,1, K== (2)
where is the i-th region of interest at the frame k and N is the total number of ROIs detected in the image. Each ROI corresponds to one or more moving objects present in the scene and is defined with a four dimensional vector:
kiR
(3) [ iiiii hwyxR ,,,= ]where x, y, w and h are the coordinates of the upper left vertex of the i-th ROI and its width and height respectively. The algorithm merges regions that are partially overlapped or near: a set of close bounding boxes can be due to the splitting of a previously connected region caused by some noise in the scene.
A simple object tracking procedure is based on the spatial relations between blobs in subsequent frames obtained by comparing each extracted region of interest Ri. Two detected regions Ri and Rj are overlapped if ,
while they are disjointed if : this simple test can be done on the basis of the coordinates of each extracted ROI. Each region extracted in the frame k is compared with each region extracted in the frame k+1 searching for overlapping correspondences.
0≠∩ ji RR
0=∩ ji RR
( ) (
( )11,1 ,,,1,,,1
+++
∩=
∈∀∈∀kj
ki
kkij
kk
RRAreaI
NjNi KK ) (4)
The function Area(T) simply computes the area of the region T: the area of a binary region can be extracted by counting the number of white pixels in the image. I is a
1+× kk NN matrix capturing the information about the overlapping of the regions in consecutive frames. For assigning the correct labels to the ROIs detected in the frame k+1, the matrix I is scanned along its columns. The following three cases can be found by looking at the column h: 1) each entry of the column h is 0: the blob h in the
frame k+1 is marked as NEW and a new identifier is given;
2) just the element in the s-th row is non-zero: the blob h in the frame k+1 is marked as OLD and it inherits the identifier of the region s-th in the frame k;
3) more than one element of the column h is different from zero: this means that the detected ROI in the frame k+1 is obtained because of a merging of blobs in the frame k. The blob h in the frame k+1 is marked as MERGED and it inherits each identifier of the overlapped regions.
3. Object tracking under occlusions Third case represents a warning that a dynamic occlusion has occurred between two or more moving objects in the scene: by labeling the ROI as MERGED the information about the position of each single object in the ROI is lost while histogram matching techniques can be used in order to re-assign correct identifiers after the occlusion. In particular, the measure of the distance between tohistograms is given by the Bhattacharyya coefficient, whose general form is defined by [14]:
∑= )()( 21 xfxfβ where and are histograms to be compared. An high Bhattacharyya coefficient
)(1 xf )(2 xf
states that the two histograms are very similar and that they are correlated. In the following sections a technique for tracking single objects during occlusion situations based on shape matching is proposed.
Proceedings 3rd IEEE Int. Workshop on PETS, Copenhagen, June 1 2002
57
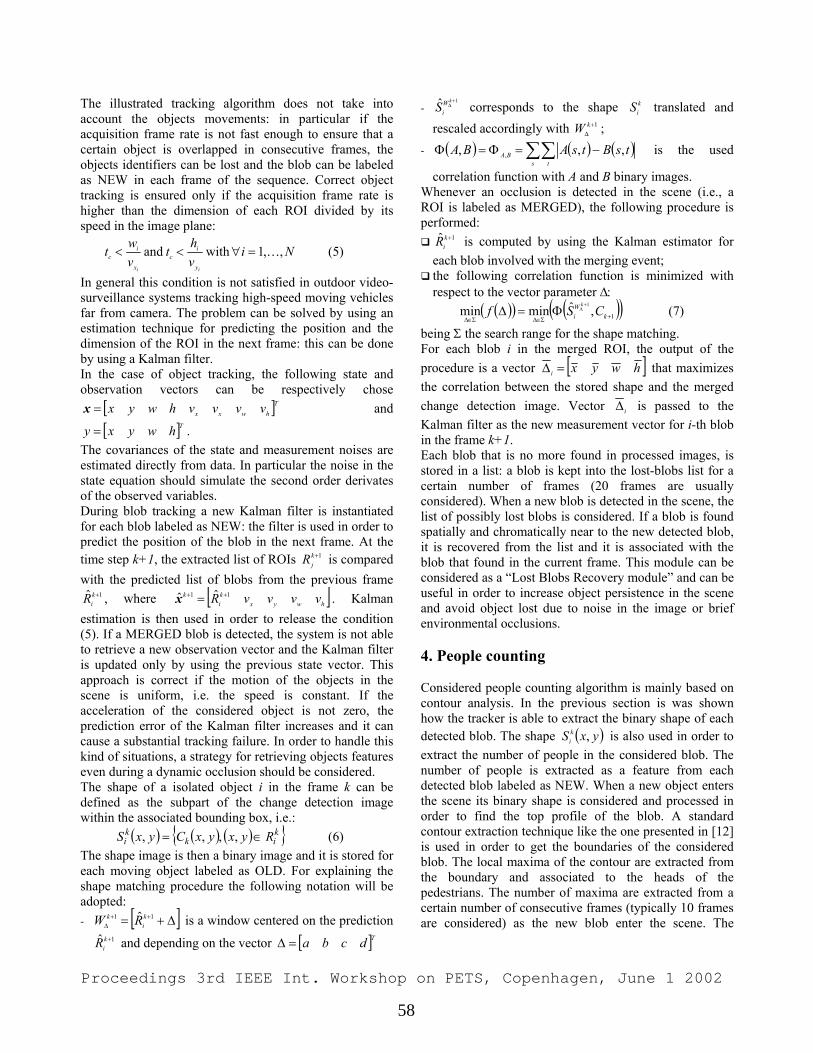
The illustrated tracking algorithm does not take into account the objects movements: in particular if the acquisition frame rate is not fast enough to ensure that a certain object is overlapped in consecutive frames, the objects identifiers can be lost and the blob can be labeled as NEW in each frame of the sequence. Correct object tracking is ensured only if the acquisition frame rate is higher than the dimension of each ROI divided by its speed in the image plane:
Nivht
vwt
ii y
ic
x
ic ,,1 with and K=∀<< (5)
In general this condition is not satisfied in outdoor video-surveillance systems tracking high-speed moving vehicles far from camera. The problem can be solved by using an estimation technique for predicting the position and the dimension of the ROI in the next frame: this can be done by using a Kalman filter. In the case of object tracking, the following state and observation vectors can be respectively chose
and
.
[ Thwxx vvvvhwyx=x
[ ]Thwyxy =
]
The covariances of the state and measurement noises are estimated directly from data. In particular the noise in the state equation should simulate the second order derivates of the observed variables. During blob tracking a new Kalman filter is instantiated for each blob labeled as NEW: the filter is used in order to predict the position of the blob in the next frame. At the time step k+1, the extracted list of ROIs is compared with the predicted list of blobs from the previous frame
, where
1+kjR
1ˆ +kiR [ ]hw vyx
ki
k vvvR 11 ˆˆ ++ =x . Kalman estimation is then used in order to release the condition (5). If a MERGED blob is detected, the system is not able to retrieve a new observation vector and the Kalman filter is updated only by using the previous state vector. This approach is correct if the motion of the objects in the scene is uniform, i.e. the speed is constant. If the acceleration of the considered object is not zero, the prediction error of the Kalman filter increases and it can cause a substantial tracking failure. In order to handle this kind of situations, a strategy for retrieving objects features even during a dynamic occlusion should be considered. The shape of a isolated object i in the frame k can be defined as the subpart of the change detection image within the associated bounding box, i. .: e ( ) ( ) ( ){ }k
ikki RyxyxCyxS ∈= ,,,, (6)
The shape image is then a binary image and it is stored for each moving object labeled as OLD. For explaining the shape matching procedure the following notation will be adopted: - [ ]∆+= ++
∆11 ˆ k
ik RW
1ˆ +kiR
is a window centered on the prediction
and depending on the vector [ ]Tdcba=∆
- corresponds to the shape translated and rescaled accordingly with W ;
1ˆ +∆kW
iS kiS
1+∆k
- ( ) ( ) ( )∑∑ −=Φ=Φs t
BA tsBtsABA ,,, , is the used
correlation function with A and B binary images. Whenever an occlusion is detected in the scene (i.e., a ROI is labeled as MERGED), the following procedure is performed: R is computed by using the Kalman estimator for each blob involved with the merging event;
1ˆ +ki
the following correlation function is minimized with respect to the vector parameter ∆:
( )( ) ( )( )1,ˆminmin1
+Σ∈∆Σ∈∆
+∆Φ=∆ k
Wi CSf
k
(7)
being Σ the search range for the shape matching. For each blob i in the merged ROI, the output of the procedure is a vector [ ]hwyxi =∆ that maximizes the correlation between the stored shape and the merged change detection image. Vector i∆ is passed to the Kalman filter as the new measurement vector for i-th blob in the frame k+1. Each blob that is no more found in processed images, is stored in a list: a blob is kept into the lost-blobs list for a certain number of frames (20 frames are usually considered). When a new blob is detected in the scene, the list of possibly lost blobs is considered. If a blob is found spatially and chromatically near to the new detected blob, it is recovered from the list and it is associated with the blob that found in the current frame. This module can be considered as a “Lost Blobs Recovery module” and can be useful in order to increase object persistence in the scene and avoid object lost due to noise in the image or brief environmental occlusions. 4. People counting Considered people counting algorithm is mainly based on contour analysis. In the previous section is was shown how the tracker is able to extract the binary shape of each detected blob. The shape is also used in order to extract the number of people in the considered blob. The number of people is extracted as a feature from each detected blob labeled as NEW. When a new object enters the scene its binary shape is considered and processed in order to find the top profile of the blob. A standard contour extraction technique like the one presented in [12] is used in order to get the boundaries of the considered blob. The local maxima of the contour are extracted from the boundary and associated to the heads of the pedestrians. The number of maxima are extracted from a certain number of consecutive frames (typically 10 frames are considered) as the new blob enter the scene. The
( yxS ki , )
Proceedings 3rd IEEE Int. Workshop on PETS, Copenhagen, June 1 2002
58
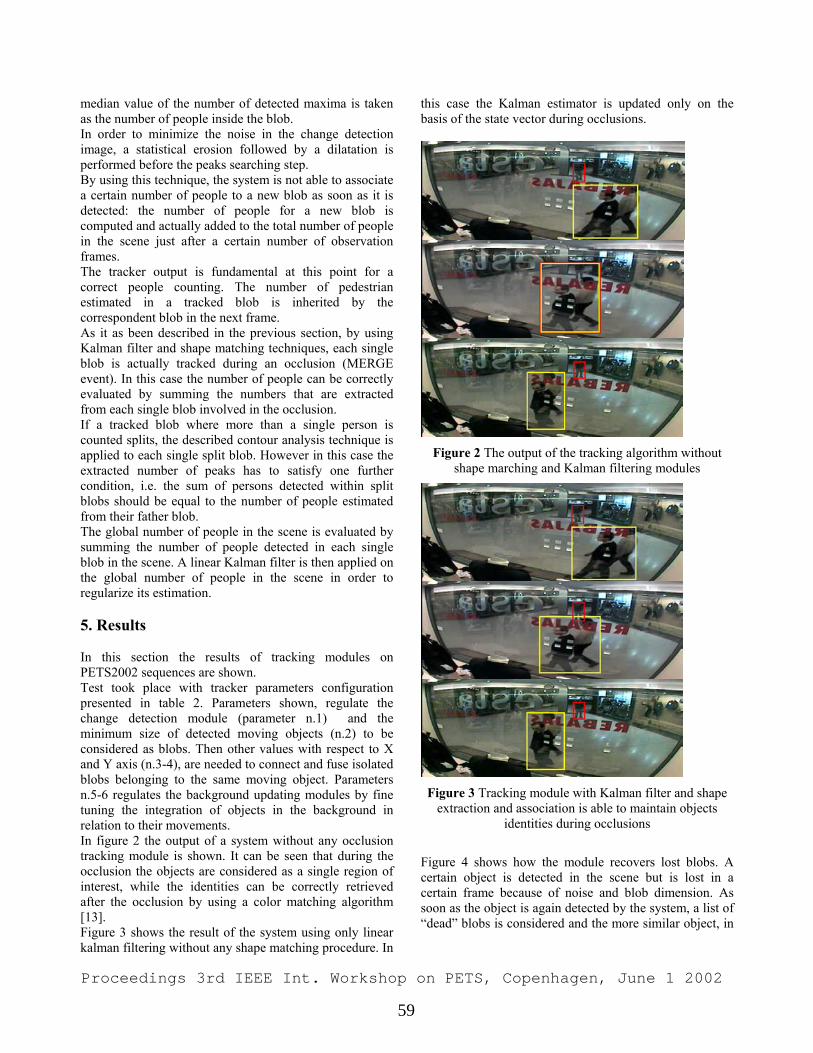
median value of the number of detected maxima is taken as the number of people inside the blob. In order to minimize the noise in the change detection image, a statistical erosion followed by a dilatation is performed before the peaks searching step. By using this technique, the system is not able to associate a certain number of people to a new blob as soon as it is detected: the number of people for a new blob is computed and actually added to the total number of people in the scene just after a certain number of observation frames. The tracker output is fundamental at this point for a correct people counting. The number of pedestrian estimated in a tracked blob is inherited by the correspondent blob in the next frame. As it as been described in the previous section, by using Kalman filter and shape matching techniques, each single blob is actually tracked during an occlusion (MERGE event). In this case the number of people can be correctly evaluated by summing the numbers that are extracted from each single blob involved in the occlusion. If a tracked blob where more than a single person is counted splits, the described contour analysis technique is applied to each single split blob. However in this case the extracted number of peaks has to satisfy one further condition, i.e. the sum of persons detected within split blobs should be equal to the number of people estimated from their father blob. The global number of people in the scene is evaluated by summing the number of people detected in each single blob in the scene. A linear Kalman filter is then applied on the global number of people in the scene in order to regularize its estimation. 5. Results In this section the results of tracking modules on PETS2002 sequences are shown. Test took place with tracker parameters configuration presented in table 2. Parameters shown, regulate the change detection module (parameter n.1) and the minimum size of detected moving objects (n.2) to be considered as blobs. Then other values with respect to X and Y axis (n.3-4), are needed to connect and fuse isolated blobs belonging to the same moving object. Parameters n.5-6 regulates the background updating modules by fine tuning the integration of objects in the background in relation to their movements. In figure 2 the output of a system without any occlusion tracking module is shown. It can be seen that during the occlusion the objects are considered as a single region of interest, while the identities can be correctly retrieved after the occlusion by using a color matching algorithm [13]. Figure 3 shows the result of the system using only linear kalman filtering without any shape matching procedure. In
this case the Kalman estimator is updated only on the basis of the state vector during occlusions.
Figure 2 The output of the tracking algorithm without
shape marching and Kalman filtering modules
Figure 3 Tracking module with Kalman filter and shape
extraction and association is able to maintain objects identities during occlusions
Figure 4 shows how the module recovers lost blobs. A certain object is detected in the scene but is lost in a certain frame because of noise and blob dimension. As soon as the object is again detected by the system, a list of “dead” blobs is considered and the more similar object, in
Proceedings 3rd IEEE Int. Workshop on PETS, Copenhagen, June 1 2002
59
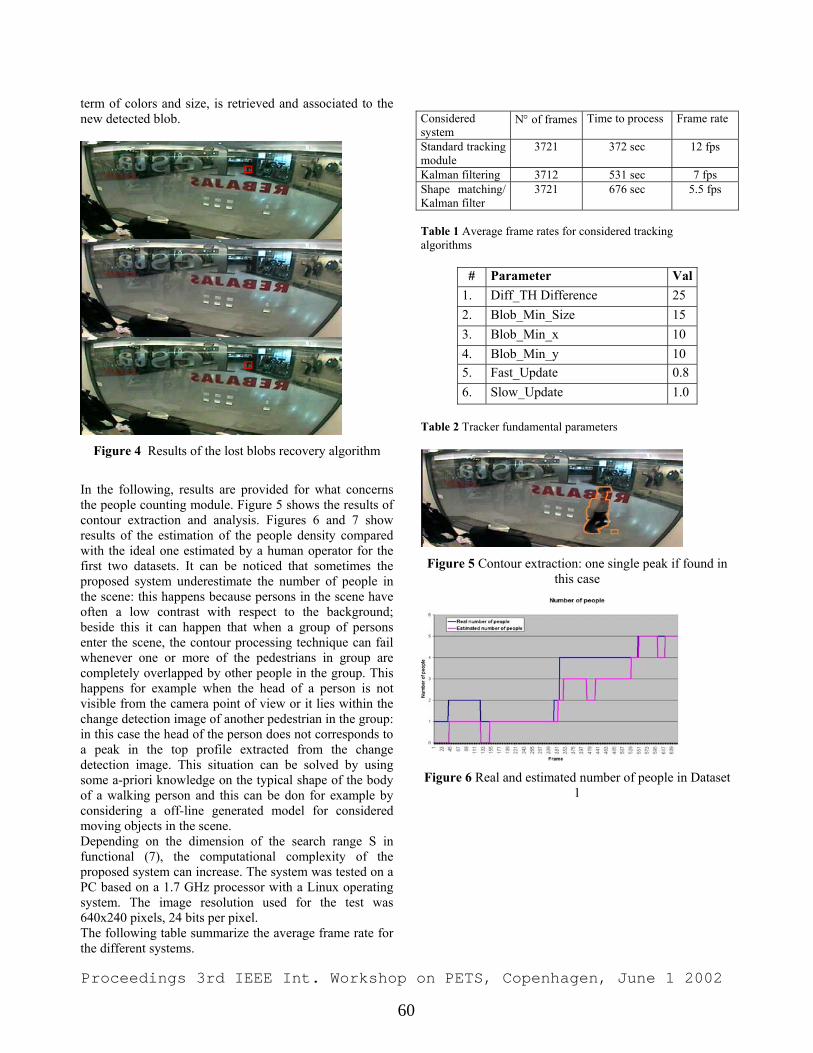
term of colors and size, is retrieved and associated to the new detected blob.
Figure 4 Results of the lost blobs recovery algorithm
In the following, results are provided for what concerns the people counting module. Figure 5 shows the results of contour extraction and analysis. Figures 6 and 7 show results of the estimation of the people density compared with the ideal one estimated by a human operator for the first two datasets. It can be noticed that sometimes the proposed system underestimate the number of people in the scene: this happens because persons in the scene have often a low contrast with respect to the background; beside this it can happen that when a group of persons enter the scene, the contour processing technique can fail whenever one or more of the pedestrians in group are completely overlapped by other people in the group. This happens for example when the head of a person is not visible from the camera point of view or it lies within the change detection image of another pedestrian in the group: in this case the head of the person does not corresponds to a peak in the top profile extracted from the change detection image. This situation can be solved by using some a-priori knowledge on the typical shape of the body of a walking person and this can be don for example by considering a off-line generated model for considered moving objects in the scene. Depending on the dimension of the search range S in functional (7), the computational complexity of the proposed system can increase. The system was tested on a PC based on a 1.7 GHz processor with a Linux operating system. The image resolution used for the test was 640x240 pixels, 24 bits per pixel. The following table summarize the average frame rate for the different systems.
Considered system
N° of frames Time to process Frame rate
Standard tracking module
3721 372 sec 12 fps
Kalman filtering 3712 531 sec 7 fps Shape matching/ Kalman filter
3721 676 sec 5.5 fps
Table 1 Average frame rates for considered tracking algorithms
# Parameter Val1. Diff_TH Difference 25 2. Blob_Min_Size 15 3. Blob_Min_x 10 4. Blob_Min_y 10 5. Fast_Update 0.8 6. Slow_Update 1.0
Table 2 Tracker fundamental parameters
Figure 5 Contour extraction: one single peak if found in
this case
Figure 6 Real and estimated number of people in Dataset
1
Proceedings 3rd IEEE Int. Workshop on PETS, Copenhagen, June 1 2002
60
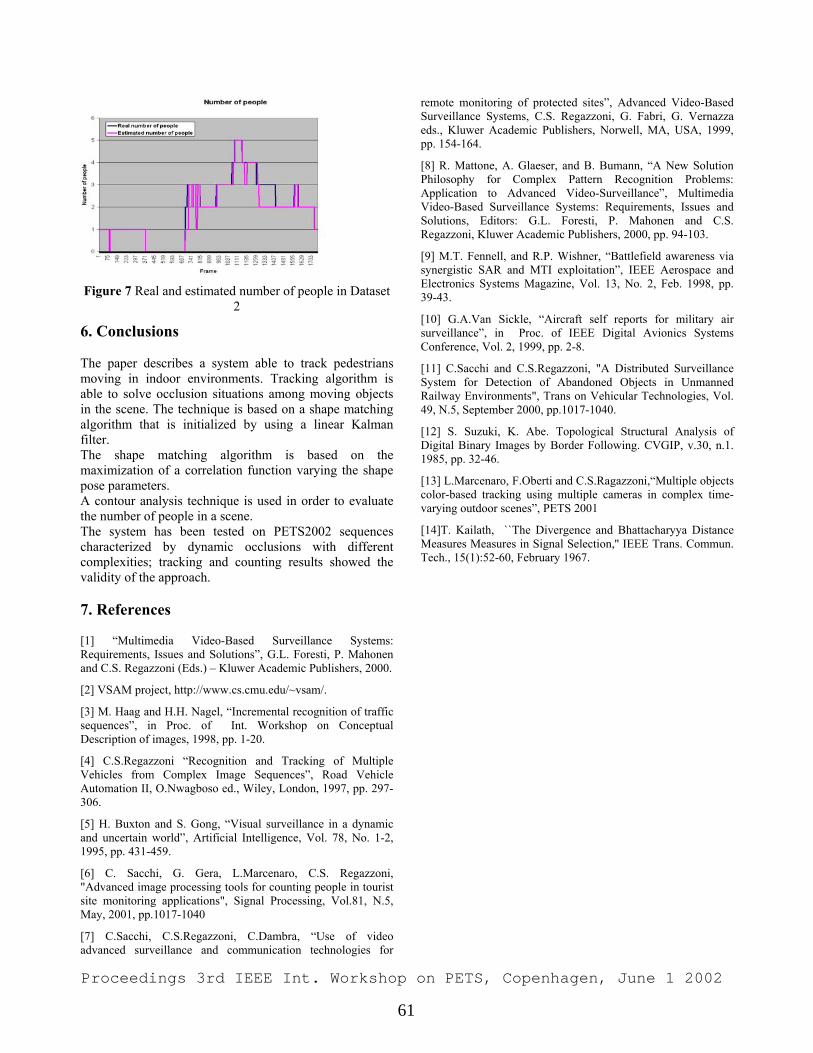
Figure 7 Real and estimated number of people in Dataset
2
6. Conclusions The paper describes a system able to track pedestrians moving in indoor environments. Tracking algorithm is able to solve occlusion situations among moving objects in the scene. The technique is based on a shape matching algorithm that is initialized by using a linear Kalman filter. The shape matching algorithm is based on the maximization of a correlation function varying the shape pose parameters. A contour analysis technique is used in order to evaluate the number of people in a scene. The system has been tested on PETS2002 sequences characterized by dynamic occlusions with different complexities; tracking and counting results showed the validity of the approach. 7. References [1] “Multimedia Video-Based Surveillance Systems: Requirements, Issues and Solutions”, G.L. Foresti, P. Mahonen and C.S. Regazzoni (Eds.) – Kluwer Academic Publishers, 2000.
[2] VSAM project, http://www.cs.cmu.edu/~vsam/.
[3] M. Haag and H.H. Nagel, “Incremental recognition of traffic sequences”, in Proc. of Int. Workshop on Conceptual Description of images, 1998, pp. 1-20.
[4] C.S.Regazzoni “Recognition and Tracking of Multiple Vehicles from Complex Image Sequences”, Road Vehicle Automation II, O.Nwagboso ed., Wiley, London, 1997, pp. 297-306.
[5] H. Buxton and S. Gong, “Visual surveillance in a dynamic and uncertain world”, Artificial Intelligence, Vol. 78, No. 1-2, 1995, pp. 431-459.
[6] C. Sacchi, G. Gera, L.Marcenaro, C.S. Regazzoni, "Advanced image processing tools for counting people in tourist site monitoring applications", Signal Processing, Vol.81, N.5, May, 2001, pp.1017-1040
[7] C.Sacchi, C.S.Regazzoni, C.Dambra, “Use of video advanced surveillance and communication technologies for
remote monitoring of protected sites”, Advanced Video-Based Surveillance Systems, C.S. Regazzoni, G. Fabri, G. Vernazza eds., Kluwer Academic Publishers, Norwell, MA, USA, 1999, pp. 154-164.
[8] R. Mattone, A. Glaeser, and B. Bumann, “A New Solution Philosophy for Complex Pattern Recognition Problems: Application to Advanced Video-Surveillance”, Multimedia Video-Based Surveillance Systems: Requirements, Issues and Solutions, Editors: G.L. Foresti, P. Mahonen and C.S. Regazzoni, Kluwer Academic Publishers, 2000, pp. 94-103.
[9] M.T. Fennell, and R.P. Wishner, “Battlefield awareness via synergistic SAR and MTI exploitation”, IEEE Aerospace and Electronics Systems Magazine, Vol. 13, No. 2, Feb. 1998, pp. 39-43.
[10] G.A.Van Sickle, “Aircraft self reports for military air surveillance”, in Proc. of IEEE Digital Avionics Systems Conference, Vol. 2, 1999, pp. 2-8.
[11] C.Sacchi and C.S.Regazzoni, "A Distributed Surveillance System for Detection of Abandoned Objects in Unmanned Railway Environments", Trans on Vehicular Technologies, Vol. 49, N.5, September 2000, pp.1017-1040.
[12] S. Suzuki, K. Abe. Topological Structural Analysis of Digital Binary Images by Border Following. CVGIP, v.30, n.1. 1985, pp. 32-46.
[13] L.Marcenaro, F.Oberti and C.S.Ragazzoni,“Multiple objects color-based tracking using multiple cameras in complex time-varying outdoor scenes”, PETS 2001
[14]T. Kailath, ``The Divergence and Bhattacharyya Distance Measures Measures in Signal Selection,'' IEEE Trans. Commun. Tech., 15(1):52-60, February 1967.
Proceedings 3rd IEEE Int. Workshop on PETS, Copenhagen, June 1 2002
61

Index of Authors
Crowley, J. L. ______________________1
Cucchiara, R. _____________________18
Ellis, T. __________________________26
Grana, C. ________________________18
Jaynes, C._________________________32
Jones, G. A. _______________________40
Marcenaro, L. _____________________56
Marchesotti, L. ____________________56
Pece, A. E. C. ______________________9
Piater, J. H. ________________________1
Prati, A. __________________________18
Regazzoni, C. S.____________________56
Remagnino, P. _____________________40
Renno, J. _________________________40
Richetto, S._________________________1
Senior, A. _________________________48
Steele, R. M. ______________________32
Webb, S.__________________________32
Xiong, Q. _________________________32