Embed Size (px)
Citation preview

Third quarter 2011
Alfa Laval AB (publ) PO Box 73 SE-221 00 Lund Sweden Corporate registration number: 556587-8054
Visiting address: Rudeboksvägen 1 Phone: + 46 46 36 65 00 Website: www.alfalaval.com
For more information, please contact: Gabriella Grotte, Investor Relations Manager Phone: +46 46 36 74 82, Mobile: +46 709 78 74 82, E-mail: [email protected]
“Order intake during the third quarter of the year reached a new record level of SEK 8.0 billion, out of which large orders again constituted more than SEK 500 million. Recently acquired Aalborg Industries contributed with SEK 700 million. Compared to the corresponding period last year order intake increased with 31 percent. On a like for like basis the increase was 21 percent. All regions showed growth and Asia, Latin America and Central and Eastern Europe accounted for 53 percent of the order intake for the Group. Process Industry, Marine & Diesel and Food had the strongest development. A continued high activity level within refinery, petrochemicals, land based diesel power plants and plants for vegetable oil production were contributing factors. Demand for Sanitary and OEM, both fast moving businesses, decreased somewhat – a development that can be linked to the increased macro economic uncertainty. Sales increased by 30 percent to SEK 7.6 billion at the same time as the operating result was SEK 1.4 billion, corresponding to an operating margin of 18.9 percent.”
Lars Renström, President and CEO Summary
Third quarter First nine months SEK millions 2011 2010 % % * 2011 2010 % % * Order intake 8,018 6,134 31 37 21,897 17,490 25 36Net sales 7,571 5,811 30 37 20,503 17,551 17 27Adjusted EBITA 1,431 1,141 25 3,900 3,345 17 - adjusted EBITA margin (%) 18.9 19.6 19.0 19.1 Result after financial items 1,113 1,044 7 3,295 3,091 7 Net income for the period 780 758 3 2,317 2,211 5 Earnings per share (SEK) 1.84 1.78 3 5.47 5.20 5 Cash flow** 1,031 1,118 -8 2,138 3,017 -29 Impact on EBITA of: - foreign exchange effects -114 124 -388 324 Impact on result after financial items of: - Aalborg integration costs - - -80 - - reversed restructuring provisions - - - 80 * excluding exchange rate variations ** from operating activities
Outlook for the fourth quarter "We expect that demand during the fourth quarter 2011 will be in line with or somewhat lower than in the third quarter." Earlier published outlook (July 19, 2011): “We expect demand during the third quarter 2011 to be higher than the third quarter of 2010.” The interim report has been reviewed by the company’s auditors, see page 23 for the review report.

Alfa Laval AB (publ) Interim report July 1 – September 30, 2011
Page 2 (23)
Management’s discussion and analysis
0
5,000
10,000
15,000
20,000
25,000
30,000
0
1,500
3,000
4,500
6,000
7,500
9,000
Q408 Q109 Q209 Q309 Q409 Q110 Q210 Q310 Q410 Q111 Q211 Q311
SEK millions12 months
SEK millionsquarter Orders received
Order intake per quarter Orders received rolling 12 months value
-32%
-37%
-30% -9%
-6%
+25%
+23%
+23%
+32%
% = change by quarter compared to corresponding period last year, at constant rates
-15%
+37%
+38%
Order bridge
Third quarter
Structural Currency Organic Third quarter change effects development Total
SEK millions 2010 (%) (%) (%) (%) 2011 Order intake 6,134 16.1 -6.6 21.2 30.7 8,018
Orders received amounted to SEK 8,018 (6,134) million for the third quarter. Excluding exchange rate variations, the order intake for the Group was 37.3 percent higher than the third quarter last year. Adjusted for acquisitions of businesses1), the corresponding figure is an increase by 21.2 percent. Orders received amounted to SEK 21,897 (17,490) million for the first nine months. Excluding exchange rate variations, the order intake for the Group was 35.7 percent higher than the same period last year. Adjusted for acquisitions of businesses 1), the corresponding figure is an increase by 25.5 percent. Orders received from the aftermarket Parts & Service constituted 25.3 (29.0) percent of the Group's total orders received for the first nine months. Excluding exchange rate variations, the order intake for Parts & Service increased by 18.7 percent during the first nine months 2011 compared to the corresponding period last year. Large orders 2) in the third quarter: During the third quarter 2011 Alfa Laval received large orders for SEK 525 (270) million: • An order to supply Alfa Laval Packinox heat exchangers to a petrochemical plant in Singapore. The
order value is about SEK 110 million and delivery is scheduled for 2012. • An order from a contractor in South Korea for heat exchangers to be installed in the first nuclear power
plant in the United Arab Emirates (UAE). The order is worth approximately SEK 60 million and deliveries are scheduled to start in 2013 and be completed in 2018.
1. Acquired businesses are: Aalborg Industries at May 1, 2011, a service company in the US at May 1, 2011, Olmi
S.p.A at December 6, 2010, Definox at November 1, 2010, Si Fang Stainless Steel Products Co. Ltd at April 1, 2010, Astepo S.r.l. at April 1, 2010.
2. Orders with a value over EUR 5 million.
Alfa Laval AB (publ) Interim report July 1 – September 30, 2011
Page 3 (23)
• An order for compact heat exchangers for a petrochemical plant in China. The order value is about SEK 50 million and delivery is scheduled for 2012.
• An order from a Japanese engineering company to supply heat exchangers for a new major natural gas project in Qatar. The order value is approximately SEK 90 million and delivery is scheduled for 2012.
• An order for supply of a complete process solution to a baby food manufacturer in India. The order value is about SEK 100 million and delivery is scheduled for 2013.
• An order to supply Alfa Laval Packinox heat exchangers to a refinery in Kazakhstan. The order value is approximately SEK 55 million and delivery is scheduled for 2012.
• An order to supply newly developed decanters for cleaning of industrial wastewater in Canada. The order value is approximately SEK 60 million and delivery is scheduled for 2012.
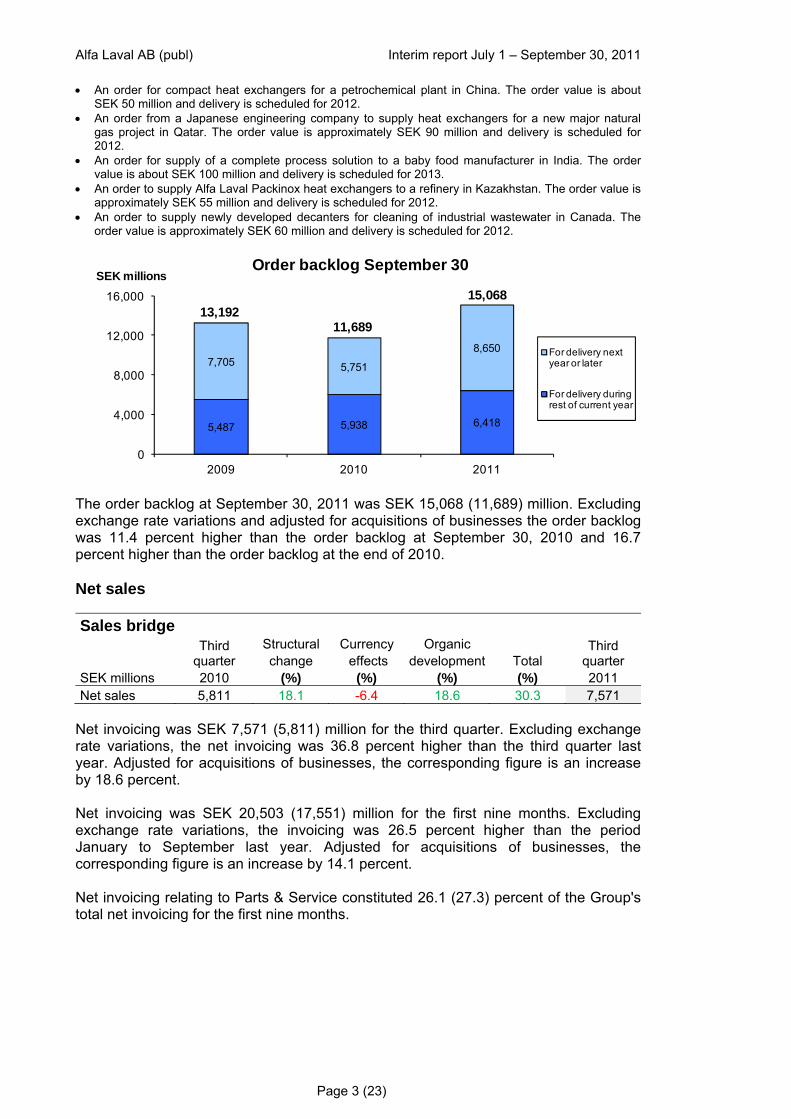
5,487 5,938 6,418
7,705 5,751
8,650
0
4,000
8,000
12,000
16,000
2009 2010 2011
SEK millionsOrder backlog September 30
For delivery next year or later
For delivery during rest of current year
13,19211,689
15,068
The order backlog at September 30, 2011 was SEK 15,068 (11,689) million. Excluding exchange rate variations and adjusted for acquisitions of businesses the order backlog was 11.4 percent higher than the order backlog at September 30, 2010 and 16.7 percent higher than the order backlog at the end of 2010. Net sales Sales bridge
Third quarter
Structural Currency Organic Third quarter change effects development Total
SEK millions 2010 (%) (%) (%) (%) 2011 Net sales 5,811 18.1 -6.4 18.6 30.3 7,571
Net invoicing was SEK 7,571 (5,811) million for the third quarter. Excluding exchange rate variations, the net invoicing was 36.8 percent higher than the third quarter last year. Adjusted for acquisitions of businesses, the corresponding figure is an increase by 18.6 percent. Net invoicing was SEK 20,503 (17,551) million for the first nine months. Excluding exchange rate variations, the invoicing was 26.5 percent higher than the period January to September last year. Adjusted for acquisitions of businesses, the corresponding figure is an increase by 14.1 percent. Net invoicing relating to Parts & Service constituted 26.1 (27.3) percent of the Group's total net invoicing for the first nine months.

Alfa Laval AB (publ) Interim report July 1 – September 30, 2011
Page 4 (23)
CONSOLIDATED COMPREHENSIVE INCOME
Third quarter First nine months Full year SEK millions 2011 2010 2011 2010 2010 Net sales 7,571 5,811 20,503 17,551 24,720Cost of goods sold -4,799 -3,478 -12,652 -10,593 -15,029Gross profit 2,772 2,333 7,851 6,958 9,691Sales costs -955 -785 -2,589 -2,328 -3,156Administration costs -302 -259 -941 -832 -1,224Research and development costs -158 -138 -473 -414 -625Other operating income * 100 113 267 350 494Other operating costs * -150 -214 -612 -595 -779Operating income 1,307 1,050 3,503 3,139 4,401Dividends and changes in fair value 2 2 5 4 2Interest income and financial exchange rate gains -86 5 288 225 327Interest expense and financial exchange rate losses -110 -13 -501 -277 -366Result after financial items 1,113 1,044 3,295 3,091 4,364Taxes -333 -286 -978 -880 -1,248Net income for the period 780 758 2,317 2,211 3,116Other comprehensive income: Cash flow hedges -192 212 -138 212 122Translation difference 345 -698 21 -558 -554Deferred tax on other comprehensive income 39 -67 80 -66 -36Comprehensive income for the period 972 205 2,280 1,799 2,648Net income attributable to: Owners of the parent 773 748 2,295 2,189 3,088Non-controlling interests 7 10 22 22 28Earnings per share (SEK) 1.84 1.78 5.47 5.20 7.34Average number of shares ** 419,456,315 419,456,315 419,456,315 420,843,698 420,494,001
Comprehensive income attributable to: Owners of the parent 964 204 2,264 1,783 2,625Non-controlling interests 7 1 15 16 23
* The line has been affected by comparison distortion items, see separate specification on page 6. ** Average number of shares has been affected by repurchase of shares. The gross margin has been affected by negative exchange rate effects and a negative mix effect mainly through a lower share of parts & service sales. In addition the gross margin in the quarter has been affected among others by somewhat lower metal prices and lower margins on certain contract based sales. This particular part of contract based sales emanates from orders that were received during the weaker part of the business cycle. Sales and administration expenses amounted to SEK 3,530 (3,160) million during the first nine months 2011. Adjusted for exchange rate variations and acquisitions of businesses, sales and administration expenses were 9.8 percent higher than the corresponding period last year. The costs for research and development have amounted to SEK 473 (414) million during the first nine months 2011, corresponding to 2.3 (2.4) percent of net sales. Adjusted for exchange rate variations and acquisitions of businesses, the costs for research and development have increased by 15.3 percent compared to the corresponding period last year.
Alfa Laval AB (publ) Interim report July 1 – September 30, 2011
Page 5 (23)
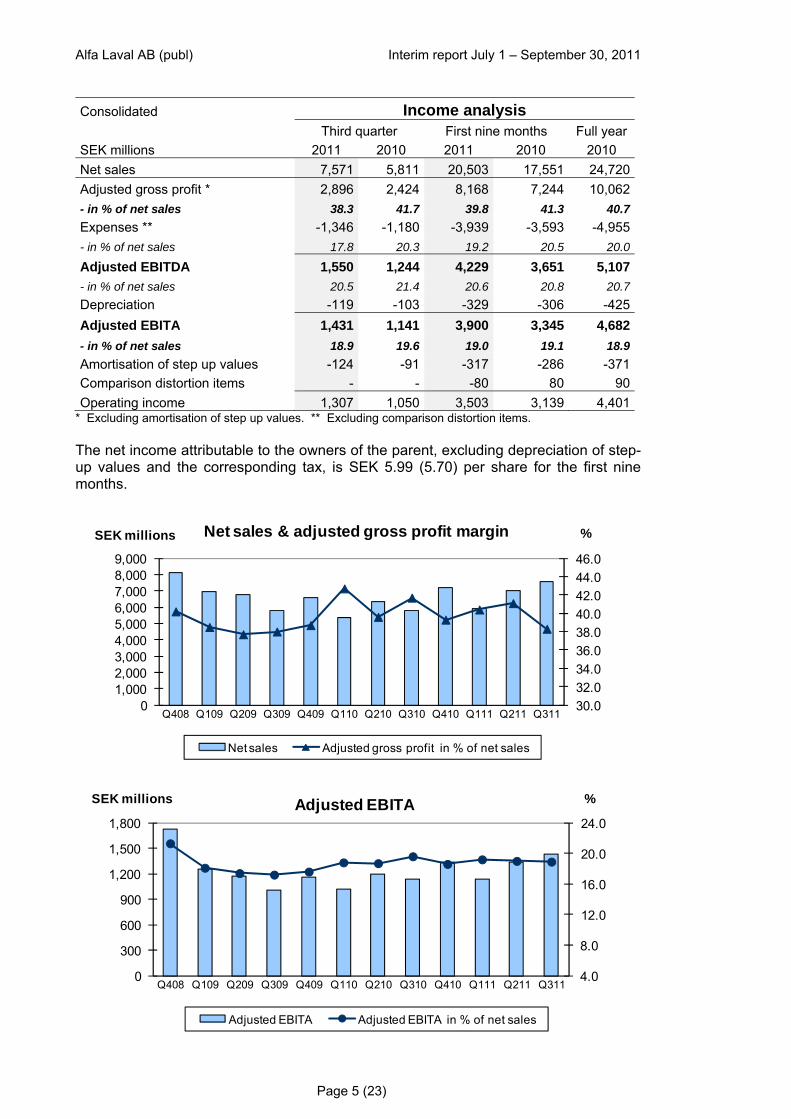
Consolidated Income analysis
Third quarter First nine months Full year SEK millions 2011 2010 2011 2010 2010 Net sales 7,571 5,811 20,503 17,551 24,720 Adjusted gross profit * 2,896 2,424 8,168 7,244 10,062 - in % of net sales 38.3 41.7 39.8 41.3 40.7 Expenses ** -1,346 -1,180 -3,939 -3,593 -4,955 - in % of net sales 17.8 20.3 19.2 20.5 20.0
Adjusted EBITDA 1,550 1,244 4,229 3,651 5,107 - in % of net sales 20.5 21.4 20.6 20.8 20.7 Depreciation -119 -103 -329 -306 -425 Adjusted EBITA 1,431 1,141 3,900 3,345 4,682 - in % of net sales 18.9 19.6 19.0 19.1 18.9 Amortisation of step up values -124 -91 -317 -286 -371 Comparison distortion items - - -80 80 90 Operating income 1,307 1,050 3,503 3,139 4,401
* Excluding amortisation of step up values. ** Excluding comparison distortion items. The net income attributable to the owners of the parent, excluding depreciation of step-up values and the corresponding tax, is SEK 5.99 (5.70) per share for the first nine months.
30.032.034.036.038.040.042.044.046.0
01,0002,0003,0004,0005,0006,0007,0008,0009,000
Q408 Q109 Q209 Q309 Q409 Q110 Q210 Q310 Q410 Q111 Q211 Q311
%SEK millions Net sales & adjusted gross profit margin
Net sales Adjusted gross profit in % of net sales
4.0
8.0
12.0
16.0
20.0
24.0
0
300
600
900
1,200
1,500
1,800
Q408 Q109 Q209 Q309 Q409 Q110 Q210 Q310 Q410 Q111 Q211 Q311
%SEK millions Adjusted EBITA
Adjusted EBITA Adjusted EBITA in % of net sales

Alfa Laval AB (publ) Interim report July 1 – September 30, 2011
Page 6 (23)
Consolidated Comparison distortion items
Third quarter First nine months Full year SEK millions 2011 2010 2011 2010 2010 Operational Other operating income 100 113 267 270 404 Comparison distortion income - - - 80 90 Total other operating income 100 113 267 350 494
Other operating costs -150 -214 -532 -595 -779 Comparison distortion costs - - -80 - - Total other operating costs -150 -214 -612 -595 -779
The operating income for the first nine months 2011 has been affected by comparison distortion items of SEK -80 (80) million. When applicable these are reported gross in the comprehensive income statement as a part of other operating income and other operating costs. The comparison distortion costs during the first nine months 2011 of SEK -80 million is related to non-recurring integration costs in connection with the acquisition of Aalborg Industries. The comparison distortion income during the first nine months 2010 of SEK 80 million related to reversal of unused parts of the provisions made in connection with the savings’ measures that were initiated during 2009. Since the actual costs for the measures became SEK 80 million lower the amount was reversed. Consolidated financial result and taxes The financial net has amounted to SEK -100 (-99) million, excluding realised and unrealised exchange rate losses and gains. The main elements of costs were interest on debt to the banking syndicate of SEK -26 (-1) million, interest on the bilateral term loans SEK -40 (-6) million, interest on the private placement of SEK -13 (-17) million and a net of dividends and other interest income and interest costs of SEK -21 (-75) million. The net of realised and unrealised exchange rate differences amounts to SEK -108 (51) million. Consolidated Key figures
September 30 December 31 2011 2010 2010 Return on capital employed (%) * 31.8 35.8 37.4 Return on equity capital (%) * 23.5 23.1 24.4 Solidity (%) ** 41.5 48.8 50.0 Net debt to EBITDA, times * 0.75 -0.08 -0.11 Debt ratio, times ** 0.29 -0.03 -0.04 Number of employees ** 15,997 12,095 12,618 * Calculated on a 12 months’ revolving basis. ** At the end of the period.
Operating segments Consolidated Orders received
Third quarter First nine months Full year SEK millions 2011 2010 2011 2010 2010 Equipment 4,367 3,220 12,057 9,601 12,945 Process Technology 3,651 2,913 9,840 7,880 10,923 Other 0 1 0 9 1 Total 8,018 6,134 21,897 17,490 23,869

Alfa Laval AB (publ) Interim report July 1 – September 30, 2011
Page 7 (23)
For the first nine months 2011 orders received for Equipment increased by 35.9 percent and net sales increased by 27.5 percent excluding exchange rate variations compared to the corresponding period last year. Adjusted for acquisitions of businesses, the corresponding figures are an increase by 21.8 percent and 12.1 percent respectively. For the first nine months 2011 orders received for Process Technology increased by 35.7 percent and net sales increased by 25.5 percent excluding exchange rate variations compared to the corresponding period last year. Adjusted for acquisitions of businesses, the corresponding figures are an increase by 30.2 percent and 17.2 percent respectively.
Industrial Equipment
Marine & Diesel
OEM
Sanitary
Food Technology
Energy & Environment
Process Industry
Parts & Service
Orders received by customer segment Q3 2011
Industrial Equipment
Marine & Diesel
OEM
Sanitary
Food Technology
Energy & Environment
Process Industry
Parts & Service
Orders received by customer segment YTD 2011
= increase
= decrease
= unchanged (+/- 3 %) compared to correspondingperiod last year, at constant rates adjusted for acquisitions of businesses
■ = Equipment
■ = Process Technology
= Parts & Service

Alfa Laval AB (publ) Interim report July 1 – September 30, 2011
Page 8 (23)
Equipment (all comments are after adjustment for exchange rate fluctuations) Order intake was unchanged in the third quarter compared with the same period last year due to a mixed demand situation in the different end markets. The Industrial Equipment segment was flat as a whole. Strong demand was reported for district heating and cooling applications as well as a good development for engine & transport applications. On the negative side was a lower demand for refrigeration applications as well as from fluid & utilities’ customers. In Sanitary order intake dropped somewhat, stemming primarily from a decline in the food and beverage industries, even as the activity in pharmaceuticals and personal care still was very good. The OEM segment also saw a lower activity level as the large customers started to take a cautious approach to the current macro economic turbulence and adjust the manufacturing pace. The order intake in the Marine & Diesel segment grew substantially. Demand was up for both the traditional Alfa Laval product range, including environmental solutions such as ballast water treatment, as well as the acquired Aalborg assortment. Demand for diesel power was also substantially higher. Parts & Service was flat. Process Technology (all comments are after adjustment for exchange rate fluctuations) Order intake was very strong for the division in the third quarter, with all segments recording growth compared to the same quarter last year. Above average growth for large contracts had a strong impact, but the base business* also showed a very good development. Parts & Service reported continued stable growth. Geographically all regions grew, with Asia being the strongest contributor. Growth in Energy & Environment was boosted by the oil & gas market unit, as continued high energy prices led to the realization of further capacity-related investments. A large order in Canada was also secured including newly developed equipment for industrial waste water treatment applications. Meanwhile, the power market unit was slightly below last year’s level. The same applied to the environment market unit that was affected by the very large waste-water treatment order secured in the US during the third quarter of 2010. Process Industry noted strong growth with a positive development across all market units, where life science, refinery and petrochemicals were particularly noteworthy. The latter benefitted from significant sales volumes of large Packinox heat exchangers, primarily to the fast growing part of the world where consumption patterns and structural growth continued to drive demand for petrochemical-related applications. Food Technology also had a very strong performance as applications for the vegetable oil market unit continued to grow, primarily in Asia and Latin America. A further contributing factor was orders for some large biodiesel solutions in Latin America. The market unit beverage and viscous food continued to grow, and a significant order for equipment to a baby food plant in India was secured in the period. The good development in Parts & Service was visible across the line, but a higher activity level among customers in Process Industry as well as in the Food area was particularly noticeable. * Base business and base orders refer to orders with an order value of less than EUR 0.5 million.

Alfa Laval AB (publ) Interim report July 1 – September 30, 2011
Page 9 (23)
Consolidated Net sales
Third quarter First nine months Full year SEK millions 2011 2010 2011 2010 2010 Equipment 4,517 3,375 11,999 10,159 14,065 Process Technology 3,054 2,434 8,504 7,373 10,632 Other 0 2 0 19 23 Total 7,571 5,811 20,503 17,551 24,720
The orders received and the net invoicing during the period have resulted in the following order backlog: Consolidated Order backlog
September 30 December 31 SEK millions 2011 2010 2010 Equipment 7,430 5,652 4,983 Process Technology 7,638 6,026 6,569 Other 0 11 0 Total 15,068 11,689 11,552
Consolidated Operating income
Third quarter First nine months Full year SEK millions 2011 2010 2011 2010 2010 Equipment 891 668 2,270 1,946 2,604 Process Technology 564 522 1,732 1,446 2,159 Other -143 -117 -368 -302 -405 Subtotal 1,312 1,073 3,634 3,090 4,358 Comparison distortion items - - -80 80 90 Consolidation adjustments * -5 -23 -51 -31 -47 Total 1,307 1,050 3,503 3,139 4,401 * Difference between management accounts and IFRS.
The increase in operating income for both Equipment and Process Technology during the first nine months 2011 compared to the corresponding period last year is mainly explained by increased volume, mitigated by higher costs and negative foreign exchange effects. Consolidated Assets Liabilities
September 30 December 31 September 30 December 31 SEK millions 2011 2010 2010 2011 2010 2010 Equipment 14,814 9,052 9,283 3,549 1,941 2,166 Process Technology 9,969 7,952 8,482 5,506 4,635 4,127 Other 5,429 4,279 4,456 3,279 2,061 2,286 Subtotal 30,212 21,283 22,221 12,334 8,637 8,579 Corporate 4,933 4,811 4,948 8,217 4,724 5,008 Total 35,145 26,094 27,169 20,551 13,361 13,587

Alfa Laval AB (publ) Interim report July 1 – September 30, 2011
Page 10 (23)
Consolidated Depreciation
Third quarter First nine months Full year SEK millions 2011 2010 2011 2010 2010 Equipment 98 62 236 189 256 Process Technology 66 48 180 138 198 Other 79 84 230 265 342 Total 243 194 646 592 796
Consolidated Investments
Third quarter First nine months Full year SEK millions 2011 2010 2011 2010 2010 Equipment 22 13 60 46 75 Process Technology 18 42 66 75 85 Other 75 37 157 106 269 Total 115 92 283 227 429
Information about products and services Consolidated Net sales by product/service *
Third quarter First nine months Full year SEK millions 2011 2010 2011 2010 2010 Own products within: Separation 1,555 1,379 4,555 4,325 6,043 Heat transfer 4,323 3,098 11,185 9,320 13,092 Fluid handling 748 666 2,231 1,929 2,700 Other 142 144 439 369 550 Associated products 512 243 1,197 784 1,144 Services 291 281 896 824 1,191 Total 7,571 5,811 20,503 17,551 24,720
* The split of own products within separation, heat transfer and fluid handling is a reflection of the current three main technologies. Other is own products outside these main technologies. Associated products are mainly purchased products that complement Alfa Laval’s product offering. Services cover all sorts of service, service agreements etc.
Alfa Laval AB (publ) Interim report July 1 – September 30, 2011
Page 11 (23)
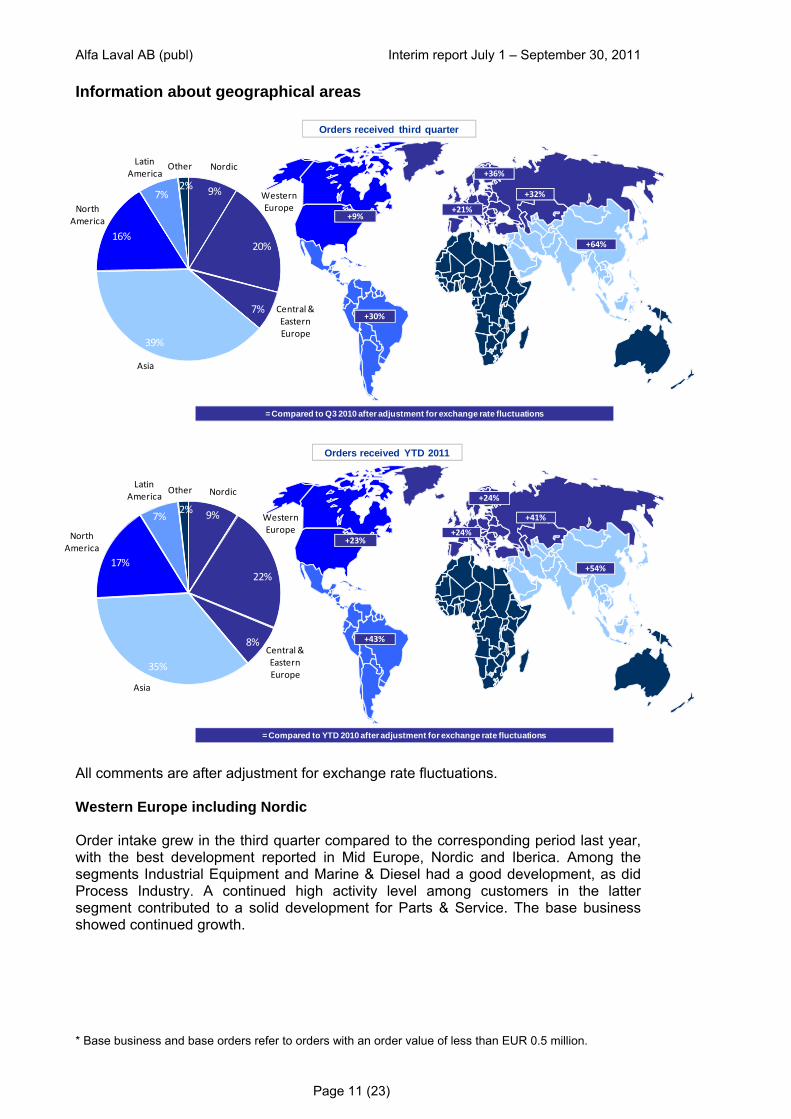
Information about geographical areas
Nordic
Western Europe
Central & Eastern Europe
Asia
North America
Latin America
Other
9%
20%
7%
39%
16%
7%2%
Orders received third quarter
= Compared to Q3 2010 after adjustment for exchange rate fluctuations
+36%
+21%
+32%
+64%
+9%
+30%
Nordic
Western Europe
Central & Eastern Europe
Asia
North America
Latin America
Other
9%
22%
8%
35%
17%
7%2%
Orders received YTD 2011
= Compared to YTD 2010 after adjustment for exchange rate fluctuations
+24%
+24%
+41%
+54%
+23%
+43%
All comments are after adjustment for exchange rate fluctuations. Western Europe including Nordic Order intake grew in the third quarter compared to the corresponding period last year, with the best development reported in Mid Europe, Nordic and Iberica. Among the segments Industrial Equipment and Marine & Diesel had a good development, as did Process Industry. A continued high activity level among customers in the latter segment contributed to a solid development for Parts & Service. The base business showed continued growth.
* Base business and base orders refer to orders with an order value of less than EUR 0.5 million.
Alfa Laval AB (publ) Interim report July 1 – September 30, 2011
Page 12 (23)
Central and Eastern Europe Order intake in Central & Eastern Europe was strong in both divisions during the third quarter, with a good activity level in the project related business as well as Parts & Service. Most segments did better than the corresponding period last year and Process Industry, Marine & Diesel and Food Technology did particularly well. Russia, Ukraine and Romania all reported good growth. North America Order intake grew in the region in the third quarter compared with the corresponding quarter last year, with most capital sales segments reporting a positive development. Energy & Environment was boosted by the development in the oil & gas market unit, as continued high energy prices led to the initiation of further capacity-related investments. Another positive impact to the segment came from the large industrial wastewater order which was won in Canada during the period. Demand for Parts & Service was up across the region, particularly in the US and a continued good development was also seen in the base business. Latin America Latin America had a good development during the third quarter, with growth in both divisions and particularly in the Process Industry, Parts & Service, Food Technology and Industrial Equipment segments. Countries with good order intake growth included Brazil, Argentina and Mexico. Asia Order intake showed a substantial increase in the third quarter compared to the same period last year. The performance was particularly strong in the Process Technology division, where the development was driven by large orders secured during the quarter. Marine & Diesel also performed well and continued to benefit from orders placed at the yards in China and Korea late last year. The base business continued to report growth and Parts & Service also had a good development. From a geographical view the positive development was broad based across most countries with the best performance seen in South East Asia, Japan and India. Consolidated Net sales
Third quarter First nine months Full year SEK millions 2011 2010 2011 2010 2010 To customers in: Sweden 229 205 687 590 849 Other EU 1,937 1,652 5,356 4,837 6,879 Other Europe 627 473 1,640 1,432 1,953 USA 962 787 2,804 2,406 3,354 Other North America 233 154 606 462 757 Latin America 612 372 1,449 1,145 1,531 Africa 52 88 152 188 242 China 1,103 752 2,768 2,292 3,144 Other Asia 1,714 1,237 4,747 3,945 5,648 Oceania 102 91 294 254 363 Total 7,571 5,811 20,503 17,551 24,720
Net sales are reported by country on the basis of invoicing address, which is normally the same as the delivery address.
Alfa Laval AB (publ) Interim report July 1 – September 30, 2011
Page 13 (23)
Consolidated Non-current assets
September 30 December 31 SEK millions 2011 2010 2010 Sweden 1,542 1,622 1,598 Denmark 6,131 826 789 Other EU 3,833 3,347 3,890 Other Europe 339 352 349 USA 2,246 2,003 2,016 Other North America 118 120 125 Latin America 167 160 167 Africa 1 1 1 Asia 3,072 3,011 3,045 Oceania 92 91 97 Subtotal 17,541 11,533 12,077 Pension assets 325 169 235 Deferred tax asset 1,303 1,253 1,301 Total 19,169 12,955 13,613
Information about major customers Alfa Laval does not have any customer that accounts for 10 percent or more of net sales. Tetra Pak within the Tetra Laval Group is Alfa Laval's single largest customer with a volume amounting to about 4 percent of net sales.

Alfa Laval AB (publ) Interim report July 1 – September 30, 2011
Page 14 (23)
CONSOLIDATED CASH FLOWS
Third quarter First nine months Full year SEK millions 2011 2010 2011 2010 2010 Operating activities Operating income 1,307 1,050 3,503 3,139 4,401Adjustment for depreciation 243 194 646 592 796Adjustment for other non-cash items -23 231 48 190 145
1,527 1,475 4,197 3,921 5,342Taxes paid -293 -416 -1,031 -959 -1,215
1,234 1,059 3,166 2,962 4,127Changes in working capital: Increase(-)/decrease(+) of receivables -137 157 -46 269 360 Increase(-)/decrease(+) of inventories 943 14 -1,261 -512 -536 Increase(+)/decrease(-) of liabilities -1,065 -163 229 391 332 Increase(+)/decrease(-) of provisions 56 51 50 -93 -185Increase(-)/decrease(+) in working capital *** -203 59 -1,028 55 -29
1,031 1,118 2,138 3,017 4,098
Investing activities Investments in fixed assets (Capex) -115 -92 -283 -227 -429Divestment of fixed assets -2 0 1 4 31Acquisition of businesses -60 -102 -4,954 -423 -1,019
-177 -194 -5,236 -646 -1,417Financing activities Received interests and dividends 26 8 57 73 52Paid interests -67 -9 -148 -108 -139Realised financial exchange differences -92 27 232 25 3Repurchase of shares - - - -253 -253Dividends to owners of the parent - - -1,258 -1,055 -1,055Dividends to non-controlling interests - 1 -10 -9 -9Increase(-)/decrease(+) of financial assets -25 -126 219 -246 -389Increase(+)/decrease(-) of borrowings *** -691 -640 4,412 -660 -641
-849 -739 3,504 -2,233 -2,431
Cash flow for the period 5 185 406 138 250Cash and bank at the beginning of the period 1,695 1,107 1,328 1,112 1,112Translation difference in cash and bank 22 -91 -12 -49 -34Cash and bank at the end of the period 1,722 1,201 1,722 1,201 1,328
Free cash flow per share (SEK) * 2.04 2.20 -7.39 5.63 6.38Capex in relation to sales 1.5% 1.6% 1.4% 1.3% 1.7%Average number of shares ** 419,456,315 419,456,315 419,456,315 420,843,698 420,494,001
* Free cash flow is the sum of cash flows from operating and investing activities. ** Average number of shares has been affected by repurchase of shares. *** The split of the cash flow on operating activities and financing activities for the first six months has been corrected related to the acquisition of Aalborg. During the first nine months 2011 cash flows from operating and investing activities amounted to SEK -3,098 (2,371) million. The change compared to last year is mainly due to the increase in acquisitions of businesses in 2011. Depreciation, excluding allocated step-up values, was SEK 329 (306) million during the first nine months, whereas investments in fixed assets were SEK 283 (227) million.
Alfa Laval AB (publ) Interim report July 1 – September 30, 2011
Page 15 (23)
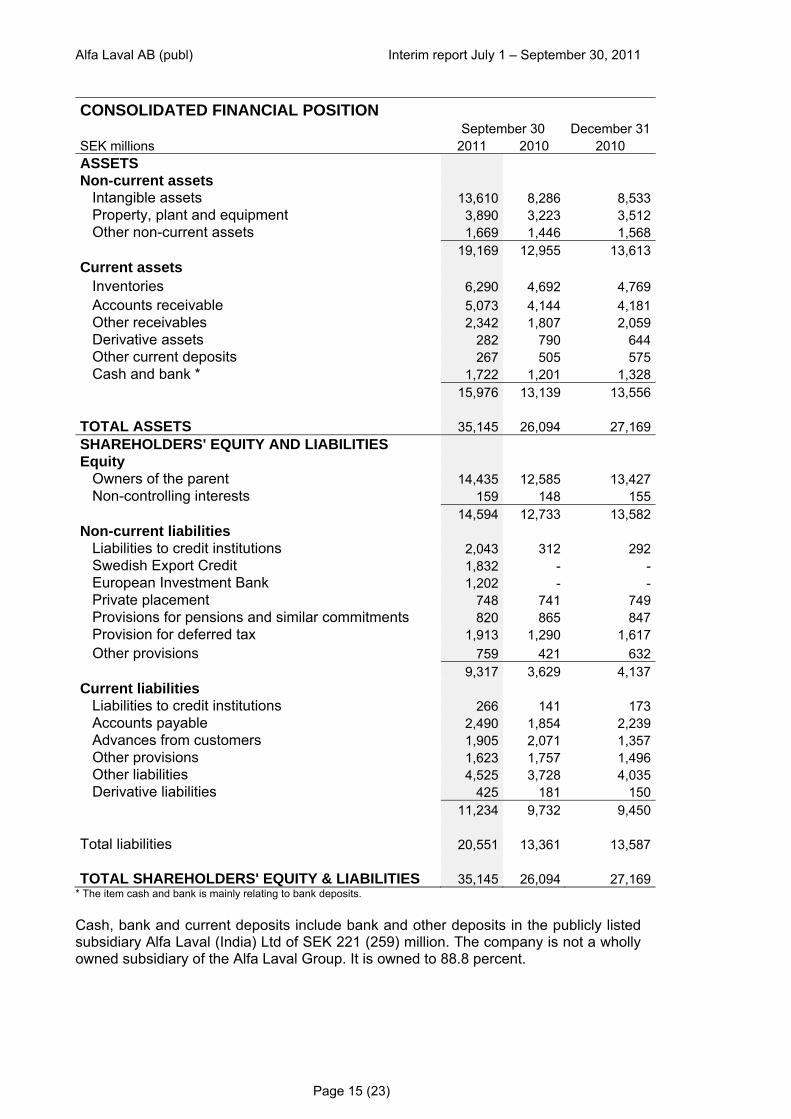
CONSOLIDATED FINANCIAL POSITION
September 30 December 31 SEK millions 2011 2010 2010 ASSETS Non-current assets Intangible assets 13,610 8,286 8,533 Property, plant and equipment 3,890 3,223 3,512 Other non-current assets 1,669 1,446 1,568
19,169 12,955 13,613 Current assets Inventories 6,290 4,692 4,769 Accounts receivable 5,073 4,144 4,181 Other receivables 2,342 1,807 2,059 Derivative assets 282 790 644 Other current deposits 267 505 575 Cash and bank * 1,722 1,201 1,328
15,976 13,139 13,556
TOTAL ASSETS 35,145 26,094 27,169 SHAREHOLDERS' EQUITY AND LIABILITIES Equity Owners of the parent 14,435 12,585 13,427 Non-controlling interests 159 148 155
14,594 12,733 13,582 Non-current liabilities Liabilities to credit institutions 2,043 312 292 Swedish Export Credit 1,832 - - European Investment Bank 1,202 - - Private placement 748 741 749 Provisions for pensions and similar commitments 820 865 847 Provision for deferred tax 1,913 1,290 1,617 Other provisions 759 421 632
9,317 3,629 4,137 Current liabilities Liabilities to credit institutions 266 141 173 Accounts payable 2,490 1,854 2,239 Advances from customers 1,905 2,071 1,357 Other provisions 1,623 1,757 1,496 Other liabilities 4,525 3,728 4,035 Derivative liabilities 425 181 150
11,234 9,732 9,450
Total liabilities 20,551 13,361 13,587
TOTAL SHAREHOLDERS' EQUITY & LIABILITIES 35,145 26,094 27,169 * The item cash and bank is mainly relating to bank deposits. Cash, bank and current deposits include bank and other deposits in the publicly listed subsidiary Alfa Laval (India) Ltd of SEK 221 (259) million. The company is not a wholly owned subsidiary of the Alfa Laval Group. It is owned to 88.8 percent.
Alfa Laval AB (publ) Interim report July 1 – September 30, 2011
Page 16 (23)
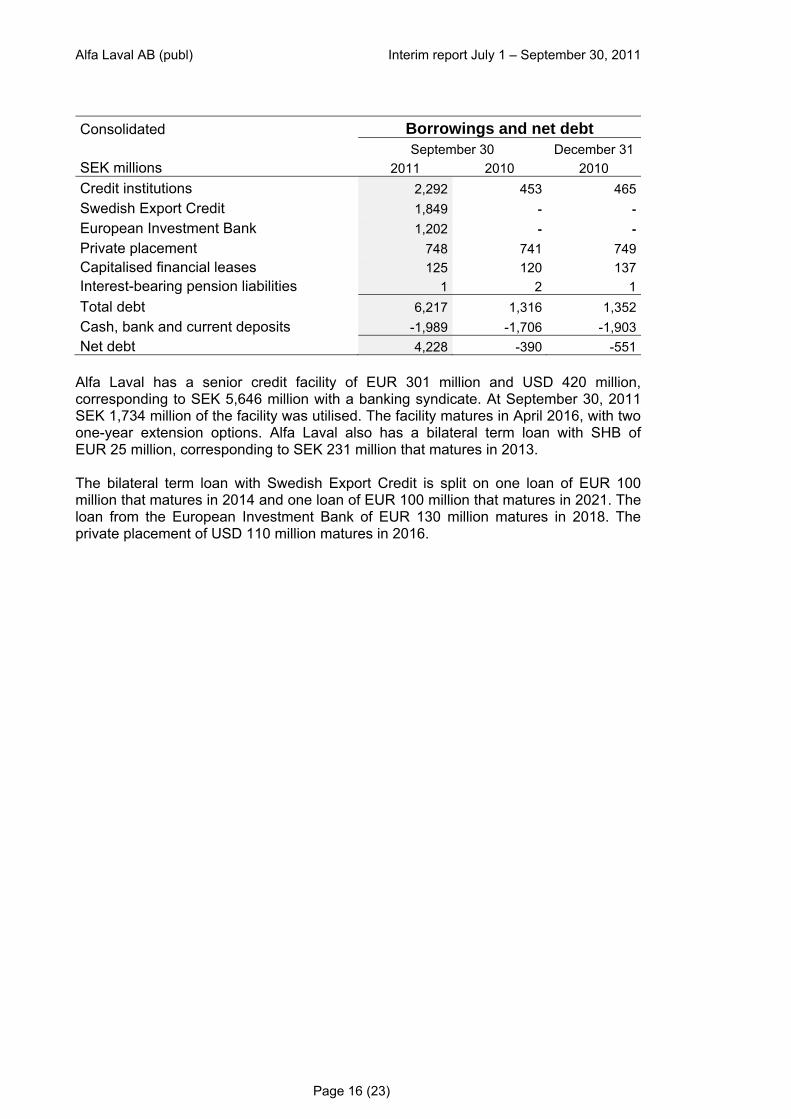
Consolidated Borrowings and net debt
September 30 December 31 SEK millions 2011 2010 2010 Credit institutions 2,292 453 465 Swedish Export Credit 1,849 - - European Investment Bank 1,202 - - Private placement 748 741 749 Capitalised financial leases 125 120 137 Interest-bearing pension liabilities 1 2 1 Total debt 6,217 1,316 1,352 Cash, bank and current deposits -1,989 -1,706 -1,903 Net debt 4,228 -390 -551
Alfa Laval has a senior credit facility of EUR 301 million and USD 420 million, corresponding to SEK 5,646 million with a banking syndicate. At September 30, 2011 SEK 1,734 million of the facility was utilised. The facility matures in April 2016, with two one-year extension options. Alfa Laval also has a bilateral term loan with SHB of EUR 25 million, corresponding to SEK 231 million that matures in 2013. The bilateral term loan with Swedish Export Credit is split on one loan of EUR 100 million that matures in 2014 and one loan of EUR 100 million that matures in 2021. The loan from the European Investment Bank of EUR 130 million matures in 2018. The private placement of USD 110 million matures in 2016.

Alfa Laval AB (publ) Interim report July 1 – September 30, 2011
Page 17 (23)
CHANGES IN CONSOLIDATED EQUITY
First nine months Full year SEK millions 2011 2010 2010 At the beginning of the period 13,582 12,229 12,229
Changes attributable to:
Owners of the parent Comprehensive income
Comprehensive income for the period 2,264 1,783 2,625 Transactions with shareholders
Repurchase of shares - -253 -253 Increase of ownership in subsidiaries with non-controlling interests 2 -3 -3 Dividends -1,258 -1,055 -1,055
-1,256 -1,311 -1,311
Subtotal 1,008 472 1,314 Non-controlling interests
Comprehensive income Comprehensive income for the period 15 16 23
Transactions with shareholders Decrease of non-controlling interests -1 -2 -2 Non-controlling interests in acquired companies 0 27 27 Dividends -10 -9 -9
-11 16 16
Subtotal 4 32 39
At the end of the period 14,594 12,733 13,582 Cancellation of repurchased shares and a corresponding bonus issue On March 21, 2011 when the notice to the Annual General Meeting was sent the number of repurchased shares was 2,583,151. The Annual General Meeting 2011 decided to cancel these repurchased shares. Cancellation of these shares means that the share capital will decrease with SEK 7 million. At the same time the Annual General Meeting decided to increase the share capital through a bonus issue of the same amount without issuing any shares. In this way the size of the share capital was restored and the company did not have to obtain permission from Bolagsverket or if disputed the local court to cancel the repurchased shares. This means that the number of shares has developed as follows: Specification of number of shares Number Number of shares at January 1, 2011 422,039,466 Cancellation of re-purchased shares -2,583,151 Number of shares at September 30, 2011 419,456,315
Repurchase of shares The Annual General Meeting 2011 gave the Board a mandate to decide on repurchase of the company’s shares – if the Board deems this appropriate – until the next Annual General Meeting. The mandate referred to repurchase of up to 5 percent of the issued shares with the purpose to cancel the repurchased shares and reduce the share
Alfa Laval AB (publ) Interim report July 1 – September 30, 2011
Page 18 (23)
capital. The repurchase would be made through purchases on OMX Nordic Exchange Stockholm. Until September 30, 2011 Alfa Laval has not made any repurchases. Ownership and legal structure Alfa Laval AB (publ) is the parent company of the Alfa Laval Group. The company had 35,698 (34,070) shareholders on September 30, 2011. The largest owner is Tetra Laval B.V., the Netherlands who owns 21.2 (18.7) percent. The increase in ownership is to 0.1 percent due to the cancellation of the shares repurchased by the company and for the remaining part to the acquisitions of shares that Tetra Laval B.V. made in the third quarter 2011. Next to the largest owner there are nine institutional investors with ownership in the range of 8.4 to 1.1 percent. These ten largest shareholders own 50.2 (46.6) percent of the shares. Material factors of risk and uncertainty The main factors of risk and uncertainty facing the Group concern the price development of metals, fluctuations in major currencies and the business cycle. It is the company’s opinion that the description of risks made in the Annual Report for 2010 is still correct. Asbestos-related lawsuits The Alfa Laval Group was as of September 30, 2011, named as a co-defendant in a total of 682 asbestos-related lawsuits with a total of approximately 768 plaintiffs. Alfa Laval strongly believes the claims against the Group are without merit and intends to vigorously contest each lawsuit. Based on current information and Alfa Laval’s understanding of these lawsuits, Alfa Laval continues to believe that these lawsuits will not have a material adverse effect on the Group’s financial condition or results of operation. Purchase of businesses In a press release on September 19, 2011 Alfa Laval communicated its proposal to buy all outstanding shares in its subsidiary Alfa Laval India Ltd and seek delisting of the shares from Bombay Stock Exchange Limited and National Stock Exchange of India Limited. The proposal comes on the back of regulatory changes in India which requires Alfa Laval India Ltd to have a minimum public float of 25 percent or seek delisting. At present, Alfa Laval holds 88.8 percent of the share capital of Alfa Laval India, meaning the public float is 11.2 percent. The objective is to achieve full ownership of the subsidiary, which will provide Alfa Laval with increased operational flexibility to support the business and meet the customers’ needs. Alfa Laval has requested that the Board of Directors of Alfa Laval India Ltd. take all actions required under the delisting regulations, including arranging a postal ballot for the shareholders to consider the delisting proposal. The delisting process is expected to take approximately four to five months. As a part of the process a floor price of INR 2,045 per share for the acquisition of the minority’s shares has been established. If all shareholders tender their shares to Alfa Laval at this floor price the acquisition will incur a consideration of SEK 583 million. If the final price per share gets higher the consideration will increase correspondingly. If not all shareholders tender their shares the consideration decreases in the same way. In order for the acquisition to get completed two thirds of all voting minority shareholders must first vote in favour of Alfa Laval’s proposal. Then minority shareholders together holding at least 50 percent of the public float must be willing to sell at the final price that Alfa Laval accepts based on a reverse book building process. When Alfa Laval has achieved an ownership of 94.4 percent, Alfa Laval India Ltd can apply for delisting. Should Alfa Laval not succeed to achieve an ownership of 94.4

Alfa Laval AB (publ) Interim report July 1 – September 30, 2011
Page 19 (23)
percent in the currently ongoing process the company is required to increase the public float to 25 percent within the stipulated period. On May 1, 2011 Alfa Laval acquired a well established service company in the US. The company is a leading provider on the North American market specialized in serving equipment for centrifugal separation. “The acquisition is another step in the ambition to serve the market with alternative offerings”, says Lars Renström, President and CEO of the Alfa Laval Group. The company will remain a separate organization as they will continue to offer their own products and services to the industry, under their own brand. During the period May to September 2011 the company has added SEK 41 million in orders received, SEK 44 million in invoicing and SEK 12 million in adjusted EBITA to Alfa Laval. If the company had been acquired at January 1, 2011 the corresponding figures would have been SEK 78 million, SEK 80 million and SEK 21 million respectively. At the end of September 2011 the number of employees was 48. In a press release on December 21, 2010, Alfa Laval announced that an agreement had been signed to acquire Aalborg Industries Holding A/S from Altor 2003 Fund, LD Equity and the Company’s management. Aalborg Industries had some 2,750 employees and generated sales of about SEK 3.3 billion in 2010. Clearances from all concerned regulatory authorities were received at the beginning of May 2011. Aalborg Industries are consolidated into the Alfa Laval Group as of May 1, 2011. Aalborg will be fully integrated into Alfa Laval. Non-recurring costs for the integration are estimated at SEK 80 million. During the latter part of 2013 the annual synergy is estimated at SEK 100 million. The acquisition, which adds complementary energy-efficient and environmental solutions, represents a significant business opportunity as it supports Alfa Laval’s existing offer to the marine and off-shore markets. Another opportunity lies in the introduction of Aalborg’s products to customers in completely new end markets, through Alfa Laval’s sales network. “Aalborg Industries is an excellent fit and I’m very pleased to welcome a strong and well-run company into Alfa Laval”, says Lars Renström, President and CEO of the Alfa Laval Group. The acquisition further strengthens Alfa Laval’s product offering in heat transfer. It adds market-leading positions with products such as boilers and thermal fluid systems, as well as inert gas systems, with significant barriers to entry. These include extensive certification processes, a strong innovation track record and a global service network. The company’s strong manufacturing and engineering presence in fast-growing markets such as China, Vietnam and Brazil, as well as the aftermarket potential generated by a large installed base, are also highly attractive attributes. During the period May to September 2011 Aalborg has added SEK 1,191 million in orders received, SEK 1,394 million in invoicing and SEK 299 million in adjusted EBITA to Alfa Laval. If Aalborg had been acquired at January 1, 2011 the corresponding figures would have been SEK 2 340 million, SEK 2 493 million and SEK 543 million respectively. At the end of September 2011 the number of employees was 2,673. Four business segments are concerned by the integration: Marine & Diesel, Process Industry and Parts & Service for both Equipment and Process Technology. For the period May to September 2011 the orders received for Aalborg is referring to Marine & Diesel to 62 %, to Process Industry to 7 %, to Equipment Parts & Service to 27 % and to Process Technology Parts & Service to 4 %.
Alfa Laval AB (publ) Interim report July 1 – September 30, 2011
Page 20 (23)
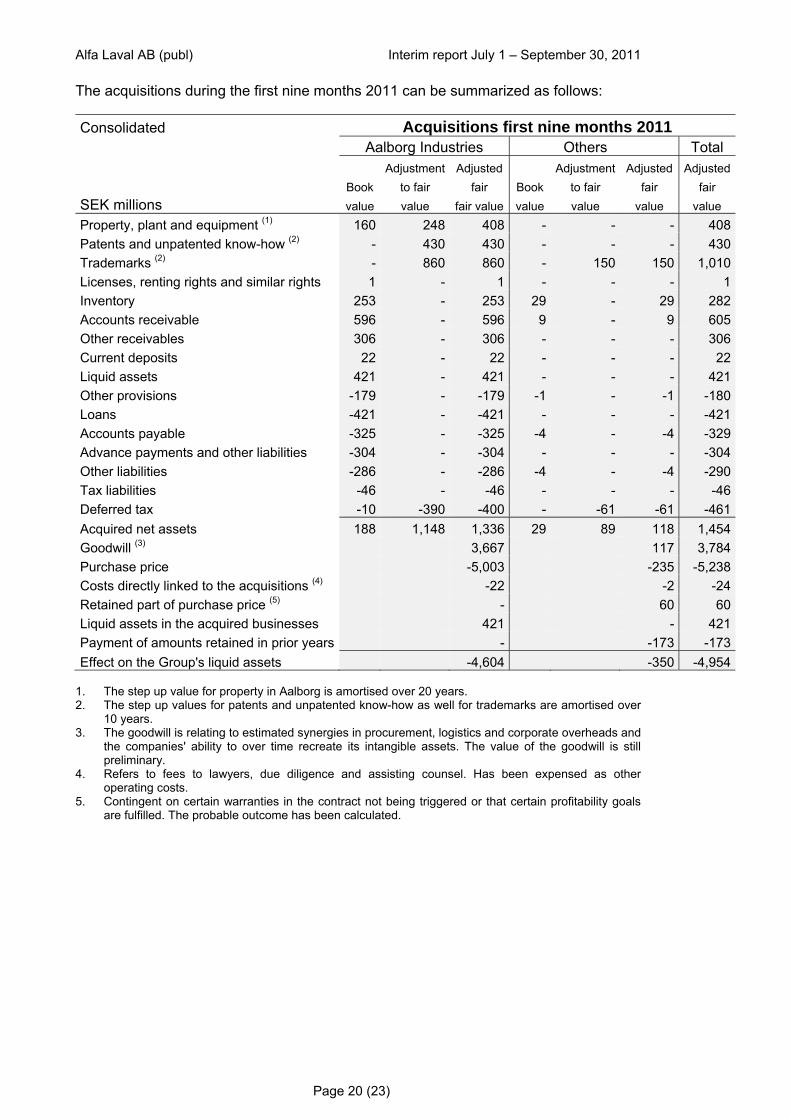
The acquisitions during the first nine months 2011 can be summarized as follows: Consolidated Acquisitions first nine months 2011
Aalborg Industries Others Total Adjustment Adjusted Adjustment Adjusted Adjusted
Book to fair fair Book to fair fair fair SEK millions value value fair value value value value value Property, plant and equipment (1) 160 248 408 - - - 408Patents and unpatented know-how (2) - 430 430 - - - 430Trademarks (2) - 860 860 - 150 150 1,010Licenses, renting rights and similar rights 1 - 1 - - - 1Inventory 253 - 253 29 - 29 282Accounts receivable 596 - 596 9 - 9 605Other receivables 306 - 306 - - - 306Current deposits 22 - 22 - - - 22Liquid assets 421 - 421 - - - 421Other provisions -179 - -179 -1 - -1 -180Loans -421 - -421 - - - -421Accounts payable -325 - -325 -4 - -4 -329Advance payments and other liabilities -304 - -304 - - - -304Other liabilities -286 - -286 -4 - -4 -290Tax liabilities -46 - -46 - - - -46Deferred tax -10 -390 -400 - -61 -61 -461Acquired net assets 188 1,148 1,336 29 89 118 1,454Goodwill (3) 3,667 117 3,784Purchase price -5,003 -235 -5,238Costs directly linked to the acquisitions (4) -22 -2 -24Retained part of purchase price (5) - 60 60Liquid assets in the acquired businesses 421 - 421Payment of amounts retained in prior years - -173 -173Effect on the Group's liquid assets -4,604 -350 -4,954
1. The step up value for property in Aalborg is amortised over 20 years. 2. The step up values for patents and unpatented know-how as well for trademarks are amortised over
10 years. 3. The goodwill is relating to estimated synergies in procurement, logistics and corporate overheads and
the companies' ability to over time recreate its intangible assets. The value of the goodwill is still preliminary.
4. Refers to fees to lawyers, due diligence and assisting counsel. Has been expensed as other operating costs.
5. Contingent on certain warranties in the contract not being triggered or that certain profitability goals are fulfilled. The probable outcome has been calculated.
Alfa Laval AB (publ) Interim report July 1 – September 30, 2011
Page 21 (23)
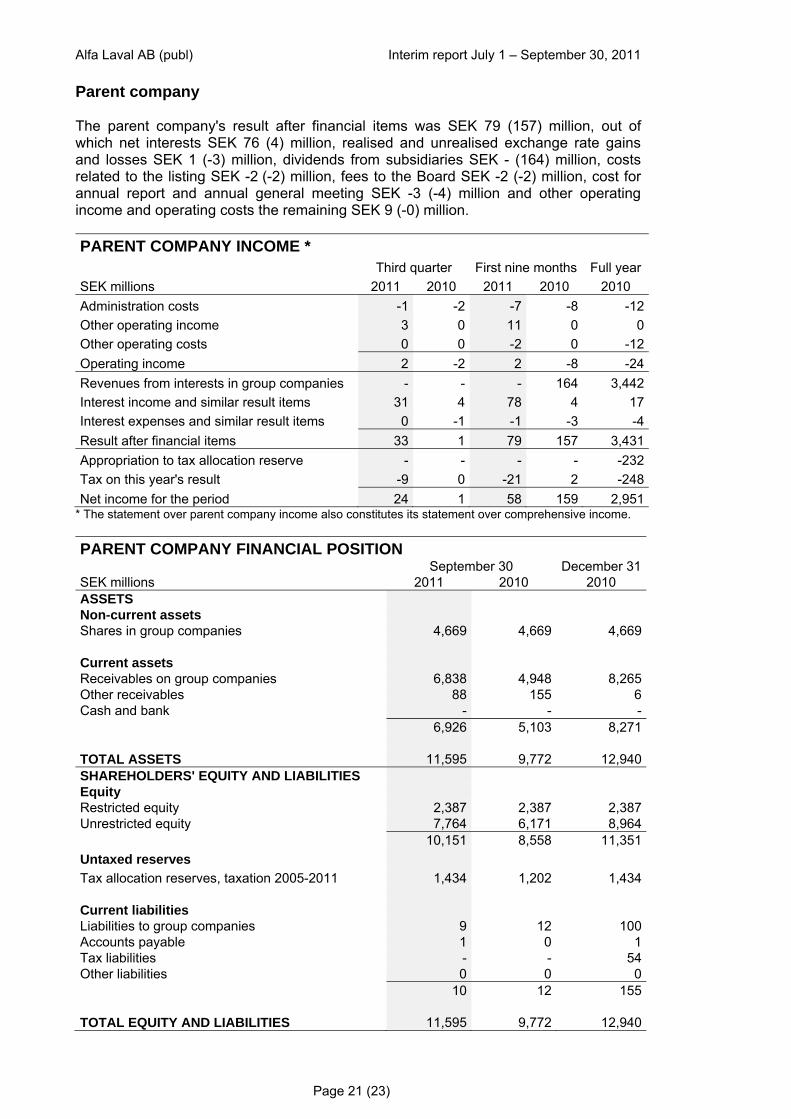
Parent company The parent company's result after financial items was SEK 79 (157) million, out of which net interests SEK 76 (4) million, realised and unrealised exchange rate gains and losses SEK 1 (-3) million, dividends from subsidiaries SEK - (164) million, costs related to the listing SEK -2 (-2) million, fees to the Board SEK -2 (-2) million, cost for annual report and annual general meeting SEK -3 (-4) million and other operating income and operating costs the remaining SEK 9 (-0) million. PARENT COMPANY INCOME *
Third quarter First nine months Full year SEK millions 2011 2010 2011 2010 2010 Administration costs -1 -2 -7 -8 -12 Other operating income 3 0 11 0 0 Other operating costs 0 0 -2 0 -12 Operating income 2 -2 2 -8 -24 Revenues from interests in group companies - - - 164 3,442 Interest income and similar result items 31 4 78 4 17 Interest expenses and similar result items 0 -1 -1 -3 -4 Result after financial items 33 1 79 157 3,431 Appropriation to tax allocation reserve - - - - -232 Tax on this year's result -9 0 -21 2 -248 Net income for the period 24 1 58 159 2,951
* The statement over parent company income also constitutes its statement over comprehensive income. PARENT COMPANY FINANCIAL POSITION
September 30 December 31 SEK millions 2011 2010 2010 ASSETS Non-current assets Shares in group companies 4,669 4,669 4,669
Current assets Receivables on group companies 6,838 4,948 8,265 Other receivables 88 155 6 Cash and bank - - -
6,926 5,103 8,271
TOTAL ASSETS 11,595 9,772 12,940 SHAREHOLDERS' EQUITY AND LIABILITIES Equity Restricted equity 2,387 2,387 2,387 Unrestricted equity 7,764 6,171 8,964
10,151 8,558 11,351 Untaxed reserves Tax allocation reserves, taxation 2005-2011 1,434 1,202 1,434
Current liabilities Liabilities to group companies 9 12 100 Accounts payable 1 0 1 Tax liabilities - - 54 Other liabilities 0 0 0
10 12 155
TOTAL EQUITY AND LIABILITIES 11,595 9,772 12,940
Alfa Laval AB (publ) Interim report July 1 – September 30, 2011
Page 22 (23)
Accounting principles The interim report for the third quarter 2011 is prepared in accordance with IAS 34 Interim Financial Reporting and the Swedish Annual Accounts Act. The accounting principles are according to IFRS (International Financial Reporting Standards) as adopted by the European Union. Third quarter refers to the period July 1 to September 30. First nine months refers to the period January 1 to September 30. Full year refers to the period January 1 to December 31. In the report the measures adjusted EBITA and adjusted EBITDA are used. Adjusted EBITA is defined as earnings before interests, taxes, amortisation of step up values and comparison distortion items. Adjusted EBITDA is defined as earnings before interests, taxes, depreciation, amortisation of step up values and comparison distortion items. The accounting and valuation principles of the parent company comply with the Swedish Annual Accounts Act and the recommendation RFR 2.3 “Accounting for legal entities” issued by the Council for Financial Reporting in Sweden. Date for the next financial reports The fourth quarter and full year 2011 report will be published on February 7, 2012. Alfa Laval will publish interim reports during 2012 at the following dates: Interim report for the first quarter April 23 Interim report for the second quarter July 17 Interim report for the third quarter October 23 Nomination Committee for the Annual General Meeting 2012 In accordance with a resolution taken at the Annual General Meeting of Alfa Laval AB on April 27, 2011, the Chairman of the Board, Anders Narvinger, has contacted the largest shareholders to constitute the Nomination Committee in preparation of the Annual General Meeting 2011. The following persons have accepted to be part of the Nomination Committee: Finn Rausing, Tetra Laval, Bo Selling, Alecta, Claes Dahlbäck, Foundation Asset Management, Jan Andersson, Swedbank Robur Fonder and Lars-Åke Bokenberger, AMF Pension. The Annual General Meeting of Alfa Laval AB will be held at Färs & Frosta Sparbank Arena, Klostergårdens idrottsområde, Stattenavägen in Lund, Sweden on Monday April 23, 2012, at 16.00 (CET). Shareholders who wish to submit proposals for the Nomination Committee in preparation of the Annual General Meeting can turn to the Chairman of the Board of Alfa Laval AB, Anders Narvinger or to the other shareholder representatives. Contact can also be made directly via e-mail to [email protected].
Alfa Laval AB (publ) Interim report July 1 – September 30, 2011
Page 23 (23)
The interim report has been issued on October 21, 2011 at CET 7.30 a.m. by the President and Chief Executive Officer Lars Renström by proxy from the Board of Directors. Lund, October 21, 2011, Lars Renström President and Chief Executive Officer Alfa Laval AB (publ) Review report Introduction We have performed a review of the condensed interim financial statements (the interim report) for Alfa Laval AB (publ) at September 30, 2011 and the nine months’ period then ended. The Board of Directors and the President are responsible for the preparation and presentation of this interim report in accordance with IAS 34 and the Swedish Annual Accounts Act. Our responsibility is to express a conclusion on this interim report based on our review. Scope of review We conducted our review in accordance with the Standard on Review Engagements SÖG 2410 “Review of Interim Financial Information Performed by the Independent Auditor of the Entity”. A review consists of making inquiries, primarily of persons responsible for financial and accounting matters, and applying analytical and other review procedures. A review is substantially less in scope than an audit conducted in accordance with the International Standards on Auditing, ISA and other generally accepted auditing practices. The procedures performed in a review do not enable us to obtain a level of assurance that would make us aware of all significant matters that might be identified in an audit. Therefore, the conclusion expressed based on a review does not give the same level of assurance as a conclusion expressed based on an audit. Conclusion Based on our review, nothing has come to our attention that causes us to believe that the interim report, in all material aspects, is not prepared for the Group in accordance with IAS 34 and the Swedish Annual Accounts Act and for the Parent company in accordance with the Swedish Annual Accounts Act. Lund, October 21, 2011, Kerstin Mouchard Staffan Landén Authorised Public Accountant Authorised Public Accountant