Embed Size (px)
Citation preview
Advised by Harris Associates L.P.
J U N E 3 0 , 2 0 0 7
T H I R D Q U A R T E R R E P O R T
Merrill Corp - Harris-Oakmark 3rd Quarterly Report [Funds] 07-31-2007 [AUX] | tgordona | 19-Jul-07 01:59 | 07-16988-2.aa | Sequence: 1CHKSUM Content: 63481 Layout: 53150 Graphics: 6756 CLEAN
JOB: 07-16988-2 CYCLE#;BL#: 4; 0 TRIM: 7.75" x 9.75" AS: Merrill Chicago: 312-786-6300 COMPOSITECOLORS: Black, Cyan, Magenta, PANTONE 484 cmyk, PANTONE 541 cmyk, Yellow, Yellow 9%, ~note-color 2, ~note-color 3 GRAPHICS: TRAPTYPE4.eps, TWIG2.eps, oakmark_new_4c_logo.eps V1.5
President’s Letter . . . . . . . . . . . . . . . . . . . . . . . . . . . . . . . . . . . . . . . . . . . . . . . . . . . . . . . . 1
Summary Information. . . . . . . . . . . . . . . . . . . . . . . . . . . . . . . . . . . . . . . . . . . . . . . . . . . . 2
Commentary on The Oakmark and Oakmark Select Funds . . . . . . . . . . . . . . . . . . . . 4
The Oakmark FundLetter from the Portfolio Managers. . . . . . . . . . . . . . . . . . . . . . . . . . . . . . . . . . . . . . . . . . 6Schedule of Investments . . . . . . . . . . . . . . . . . . . . . . . . . . . . . . . . . . . . . . . . . . . . . . . . . . 7
The Oakmark Select FundLetter from the Portfolio Managers. . . . . . . . . . . . . . . . . . . . . . . . . . . . . . . . . . . . . . . . . 11Schedule of Investments . . . . . . . . . . . . . . . . . . . . . . . . . . . . . . . . . . . . . . . . . . . . . . . . . 12
The Oakmark Equity and Income FundLetter from the Portfolio Managers. . . . . . . . . . . . . . . . . . . . . . . . . . . . . . . . . . . . . . . . . 14Schedule of Investments . . . . . . . . . . . . . . . . . . . . . . . . . . . . . . . . . . . . . . . . . . . . . . . . . 16
The Oakmark Global FundLetter from the Portfolio Managers. . . . . . . . . . . . . . . . . . . . . . . . . . . . . . . . . . . . . . . . . 21Global Diversification Chart . . . . . . . . . . . . . . . . . . . . . . . . . . . . . . . . . . . . . . . . . . . . . . 23Schedule of Investments . . . . . . . . . . . . . . . . . . . . . . . . . . . . . . . . . . . . . . . . . . . . . . . . . 24
The Oakmark Global Select FundLetter from the Portfolio Managers. . . . . . . . . . . . . . . . . . . . . . . . . . . . . . . . . . . . . . . . . 29Global Diversification Chart . . . . . . . . . . . . . . . . . . . . . . . . . . . . . . . . . . . . . . . . . . . . . . 31Schedule of Investments . . . . . . . . . . . . . . . . . . . . . . . . . . . . . . . . . . . . . . . . . . . . . . . . . 32
Commentary on The International and International Small Cap Funds . . . . . . . . 35
The Oakmark International FundLetter from the Portfolio Manager . . . . . . . . . . . . . . . . . . . . . . . . . . . . . . . . . . . . . . . . . 36International Diversification Chart . . . . . . . . . . . . . . . . . . . . . . . . . . . . . . . . . . . . . . . . 38Schedule of Investments . . . . . . . . . . . . . . . . . . . . . . . . . . . . . . . . . . . . . . . . . . . . . . . . . 39
The Oakmark International Small Cap FundLetter from the Portfolio Managers. . . . . . . . . . . . . . . . . . . . . . . . . . . . . . . . . . . . . . . . . 44International Diversification Chart . . . . . . . . . . . . . . . . . . . . . . . . . . . . . . . . . . . . . . . . 46Schedule of Investments . . . . . . . . . . . . . . . . . . . . . . . . . . . . . . . . . . . . . . . . . . . . . . . . . 47
Oakmark Philosophy and Process . . . . . . . . . . . . . . . . . . . . . . . . . . . . . . . . . . . . . . . . . 55
The Oakmark Glossary. . . . . . . . . . . . . . . . . . . . . . . . . . . . . . . . . . . . . . . . . . . . . . . . . . . 56
Trustees and Officers . . . . . . . . . . . . . . . . . . . . . . . . . . . . . . . . . . . . . . . . . . . . . . . . . . . . 57
2007 Third Quarter Report
THE OAKMARK FUNDS
FORWARD-LOOKING STATEMENT DISCLOSURE
One of our most important responsibilities as mutual fund managers is tocommunicate with shareholders in an open and direct manner. Some of ourcomments in our letters to shareholders are based on current managementexpectations and are considered “forward-looking statements”. Actual futureresults, however, may prove to be different from our expectations. You canidentify forward-looking statements by words such as “estimate”, “may”, “will”,“expect”, “believe”, “plan” and other similar terms. We cannot promise futurereturns. Our opinions are a reflection of our best judgment at the time thisreport is compiled, and we disclaim any obligation to update or alter forward-looking statements as a result of new information, future events, or otherwise.
Merrill Corp - Harris-Oakmark 3rd Quarterly Report [Funds] 07-31-2007 [AUX] | tgordona | 19-Jul-07 01:59 | 07-16988-2.aa | Sequence: 2CHKSUM Content: 50984 Layout: 19794 Graphics: No Graphics CLEAN
JOB: 07-16988-2 CYCLE#;BL#: 4; 0 TRIM: 7.75" x 9.75" AS: Merrill Chicago: 312-786-6300 COMPOSITECOLORS: Black, PANTONE 364 U, PANTONE 541 U, ~note-color 2 GRAPHICS: none V1.5
1
President’s Letter
Dear Fellow Shareholders,Domestic and international stock markets advancedstrongly in the quarter ended June 30, extending theirgains of the past several quarters. International marketindexes again showed the highest returns, benefiting fromthe weakness of the dollar. Strong worldwide economicgrowth, robust corporate profits, and record high levels ofacquisition activity, generated by corporate purchasersand private equity/leveraged buyout houses, drove thisperformance. The strength comes despite a jump in long-term U.S. interest rates and credit concerns about the weakU.S. housing and mortgage sector. With the strength inthe quarter, most of the broader U.S. and internationalequity indexes finished the quarter up over 20% from ayear ago. Importantly, every one of our Funds achieved anew all-time high net asset value during the quarter.
Credit Cycles and Investment RiskTimes are good. The U.S. economic expansion is in itssixth year. World economic growth is also strong, led by thesurging Chinese and Indian economies. World stock marketindexes are setting new records. Liquidity is high andlenders are anxious to put money to work. Large($10 billion plus) leveraged buyouts (“LBOs”), which takepublic companies private using borrowed money, havebecome commonplace and are fueling the market’sstrength. In fact, investors have concluded that they arenow such a permanent part of the landscape that theprivate equity firms that sponsor these deals are selling theirown business to the investing public at rich valuations.
As often happens in extended good times, investors whohope to extend their winning streak (or keep up with themarket) reach for returns by taking on additional risk. Asthe memories of difficult times fade, investors can loseperspective on the downside of the risk/reward tradeoff.Premiums demanded for riskier loans and investmentsnarrow, and eventually we find ourselves where we aretoday—where capital available for risky investments isexceedingly abundant and receives little reward for thehigh risk it bears. Today we see these excesses in the high-yield bond market, in the flow of loans and investorequity into LBOs and hedge funds, in the strong flows ofcapital into emerging markets such as China, in the highvalues assigned to low quality cyclical businesses, anduntil recently in the U.S. mortgage market.
We have noted these excesses for some time, and severalof our Fund managers touch upon them again in theirletters this quarter. We believe, however, that some ofthese imbalances may be starting to correct—particularlyin the mortgage and high-yield debt markets. The timingand severity of the inevitable correction and the eventsthat will trigger the shift are difficult to forecast. Creditand risk cycles often last much longer than logic mightpredict. We suggest, though, that the unwinding of thecurrent cycle will be painful for investors who have
reached for risky investments and that, as has been thecase in most past cycles, markets will overcorrect.
At Oakmark, our value investing discipline and bottom-upstock picking help us to avoid many of the pitfalls of therisk cycle. We focus on business value and limiting risk,which enables us to concentrate our analysis uponrisk/reward tradeoffs so that we only take on extra riskwhen we believe we will be richly rewarded. As anexample, we sold most of our high-yield bond holdings in2005, when yield premiums narrowed to levels that wedeemed inadequate. Likewise, we have found ourselvesshifting our equity holdings—stock by stock—to higherquality, lower risk, large-cap companies that we believeoffer larger discounts to value and lower risk than most oftheir cyclical counterparts. Finally, as David Herro notes inhis letter, while Chinese stocks have drawn many eagerinvestors seeking to capitalize upon the country’s soaringeconomy and stock market, we have avoided investmentsin Chinese stocks due to their inflated valuations,corporate governance issues, and political risk.
Looking forward, as the current cycle matures, we willcontinue to weigh our alternatives patiently andunemotionally in order to find the most attractiveinvestments. If credit markets shift dramatically and offerus the compelling risk/reward payoff that we seek, we arelikely to become owners of many of the same investmentsthat we have shunned for the past several years.
Thank you for entrusting your investments to The OakmarkFunds. We welcome your comments and questions. Youcan reach us via e-mail at [email protected].
John R. RaittPresident of The Oakmark FundsPresident and CEO of Harris Associates L.P.
June 30, 2007
Merrill Corp - Harris-Oakmark 3rd Quarterly Report [Funds] 07-31-2007 [AUX] | sgirard | 26-Jul-07 16:50 | 07-16988-2.ba | Sequence: 1CHKSUM Content: 54849 Layout: 42193 Graphics: 37550 CLEAN
JOB: 07-16988-2 CYCLE#;BL#: 13; 0 TRIM: 7.75" x 9.75" AS: Merrill Chicago: 312-786-6300 COMPOSITECOLORS: Black, PANTONE 364 U, ~note-color 1, ~note-color 2, ~note-color 3 GRAPHICS: John R. Raitt photo.eps V1.5
THE OAKMARK FUNDS
2 T H E O A K M A R K F U N D S
Summary Information
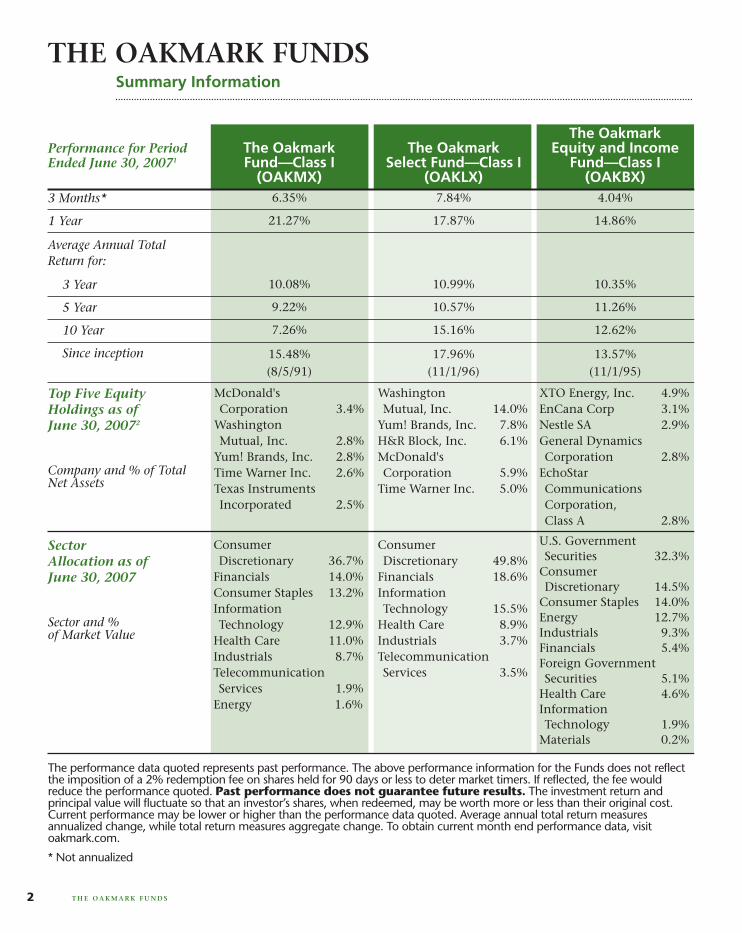
The performance data quoted represents past performance. The above performance information for the Funds does not reflectthe imposition of a 2% redemption fee on shares held for 90 days or less to deter market timers. If reflected, the fee wouldreduce the performance quoted. Past performance does not guarantee future results. The investment return andprincipal value will fluctuate so that an investor’s shares, when redeemed, may be worth more or less than their original cost.Current performance may be lower or higher than the performance data quoted. Average annual total return measuresannualized change, while total return measures aggregate change. To obtain current month end performance data, visitoakmark.com.
* Not annualized
The OakmarkPerformance for Period The Oakmark The Oakmark Equity and IncomeEnded June 30, 20071 Fund—Class I Select Fund—Class I Fund—Class I
(OAKMX) (OAKLX) (OAKBX)
Average Annual TotalReturn for:
U.S. Government Securities 32.3%
Consumer Discretionary 14.5%
Consumer Staples 14.0%Energy 12.7%Industrials 9.3%Financials 5.4%Foreign Government Securities 5.1%
Health Care 4.6%Information Technology 1.9%
Materials 0.2%
Consumer Discretionary 49.8%
Financials 18.6%Information Technology 15.5%
Health Care 8.9%Industrials 3.7%Telecommunication Services 3.5%
Consumer Discretionary 36.7%
Financials 14.0%Consumer Staples 13.2%Information Technology 12.9%
Health Care 11.0%Industrials 8.7%Telecommunication Services 1.9%
Energy 1.6%
Sector Allocation as of June 30, 2007
Sector and % of Market Value
XTO Energy, Inc. 4.9%EnCana Corp 3.1%Nestle SA 2.9%General DynamicsCorporation 2.8%
EchoStarCommunicationsCorporation,Class A 2.8%
WashingtonMutual, Inc. 14.0%
Yum! Brands, Inc. 7.8%H&R Block, Inc. 6.1%McDonald'sCorporation 5.9%
Time Warner Inc. 5.0%
McDonald'sCorporation 3.4%
WashingtonMutual, Inc. 2.8%
Yum! Brands, Inc. 2.8%Time Warner Inc. 2.6%Texas InstrumentsIncorporated 2.5%
Top Five EquityHoldings as ofJune 30, 20072
Company and % of TotalNet Assets
13.57%(11/1/95)
17.96%(11/1/96)
15.48%(8/5/91)
Since inception
12.62%15.16%7.26%10 Year
11.26%10.57%9.22%5 Year
10.35%10.99%10.08%3 Year
14.86%17.87%21.27%1 Year
4.04%7.84%6.35%3 Months*
Merrill Corp - Harris-Oakmark 3rd Quarterly Report [Funds] 07-31-2007 [AUX] | sgirard | 26-Jul-07 16:50 | 07-16988-2.bc | Sequence: 1CHKSUM Content: 43934 Layout: 6154 Graphics: No Graphics CLEAN
JOB: 07-16988-2 CYCLE#;BL#: 13; 0 TRIM: 7.75" x 9.75" AS: Merrill Chicago: 312-786-6300 COMPOSITECOLORS: Black, PANTONE 364 U, ~HTML color, ~note-color 2 GRAPHICS: none V1.5
3T H E O A K M A R K F U N D S
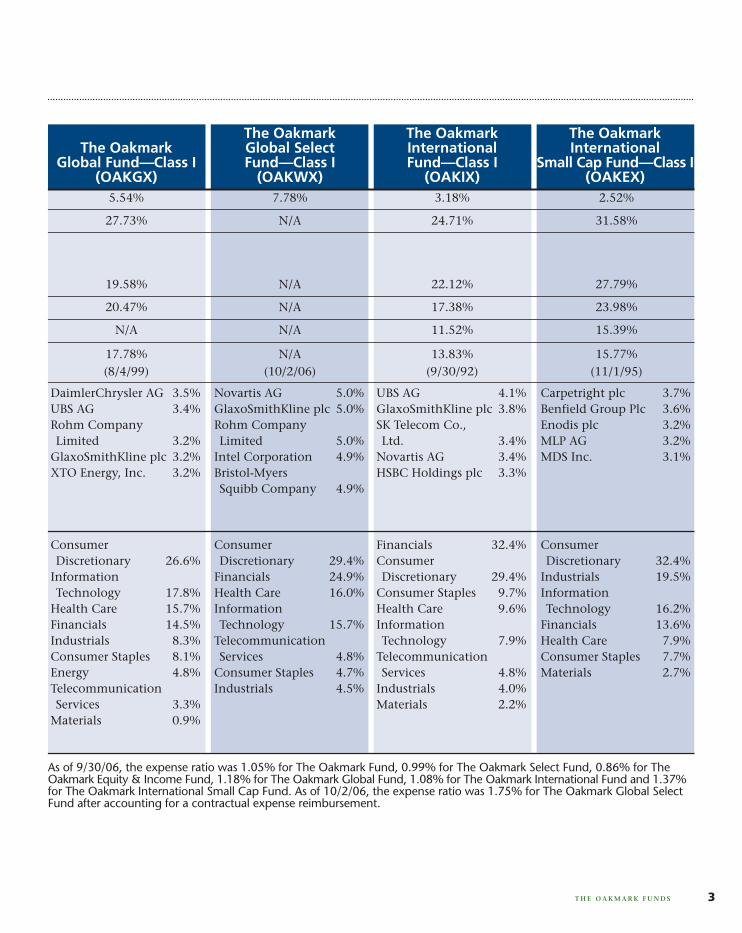
As of 9/30/06, the expense ratio was 1.05% for The Oakmark Fund, 0.99% for The Oakmark Select Fund, 0.86% for TheOakmark Equity & Income Fund, 1.18% for The Oakmark Global Fund, 1.08% for The Oakmark International Fund and 1.37%for The Oakmark International Small Cap Fund. As of 10/2/06, the expense ratio was 1.75% for The Oakmark Global SelectFund after accounting for a contractual expense reimbursement.
The Oakmark The Oakmark The OakmarkThe Oakmark Global Select International International
Global Fund—Class I Fund—Class I Fund—Class I Small Cap Fund—Class I(OAKGX) (OAKWX) (OAKIX) (OAKEX)
Consumer Discretionary 32.4%
Industrials 19.5%Information Technology 16.2%
Financials 13.6%Health Care 7.9%Consumer Staples 7.7%Materials 2.7%
Financials 32.4%Consumer Discretionary 29.4%
Consumer Staples 9.7%Health Care 9.6%Information Technology 7.9%
Telecommunication Services 4.8%
Industrials 4.0%Materials 2.2%
Consumer Discretionary 29.4%
Financials 24.9%Health Care 16.0%Information Technology 15.7%
Telecommunication Services 4.8%
Consumer Staples 4.7%Industrials 4.5%
Consumer Discretionary 26.6%
Information Technology 17.8%
Health Care 15.7%Financials 14.5%Industrials 8.3%Consumer Staples 8.1%Energy 4.8%Telecommunication Services 3.3%
Materials 0.9%
Carpetright plc 3.7%Benfield Group Plc 3.6%Enodis plc 3.2%MLP AG 3.2%MDS Inc. 3.1%
UBS AG 4.1%GlaxoSmithKline plc 3.8%SK Telecom Co.,Ltd. 3.4%
Novartis AG 3.4%HSBC Holdings plc 3.3%
Novartis AG 5.0%GlaxoSmithKline plc 5.0%Rohm CompanyLimited 5.0%
Intel Corporation 4.9%Bristol-MyersSquibb Company 4.9%
DaimlerChrysler AG 3.5%UBS AG 3.4%Rohm CompanyLimited 3.2%
GlaxoSmithKline plc 3.2%XTO Energy, Inc. 3.2%
15.77%(11/1/95)
13.83%(9/30/92)
N/A(10/2/06)
17.78%(8/4/99)
15.39%11.52%N/AN/A
23.98%17.38%N/A20.47%
27.79%22.12%N/A19.58%
31.58%24.71%N/A27.73%
2.52%3.18%7.78%5.54%
Merrill Corp - Harris-Oakmark 3rd Quarterly Report [Funds] 07-31-2007 [AUX] | sgirard | 26-Jul-07 16:50 | 07-16988-2.bc | Sequence: 2CHKSUM Content: 6150 Layout: 58582 Graphics: No Graphics CLEAN
JOB: 07-16988-2 CYCLE#;BL#: 13; 0 TRIM: 7.75" x 9.75" AS: Merrill Chicago: 312-786-6300 COMPOSITECOLORS: Black, PANTONE 364 U, PANTONE 541 U, ~HTML color, ~note-color 2, ~note-color 3 GRAPHICS: none V1.5
THE OAKMARK AND OAKMARK SELECT FUNDS
Private equity. The term iseverywhere. You can’t go to afinancial website, read thebusiness section of anewspaper, or watch stockmarket shows on TV withouthearing about private equity.Some say it’s already overdoneand will suffer the bad endingthat all bubbles inevitablysuffer. Some say it’s early, andthey still want more of theircapital invested in privateequity. Some argue that privateequity is stealing companies
from an uninformed public, while others say that privateequity has inflated the entire stock market. What is it?Why all the sudden interest? Most importantly, how doesit affect our Funds?
In the most general sense, private equity is simplyownership interest in a company whose stock does nottrade publicly. More specifically, the term “private equity”today usually refers to the capital, which is normally highlyleveraged, that is used to purchase a publicly held company.This type of transaction has roots back to the 1960s, butreally began to blossom in the 1980s with the emergence ofwhat was then called the “junk bond” market. One of themost difficult hurdles to pass before paying a premium totake a company private was obtaining the financing thatfacilitated a highly leveraged acquisition. The creation of apublic market for very high risk debt made getting past thathurdle much easier. The logic behind those transactionswas typically that the entrepreneurial buyer had a plan toradically increase the value of the business, perhaps bymaking tough decisions that corporate managers lackingeconomic alignment with their shareholders wereunwilling to make, such as selling divisions anddownsizing. The debt for such a transaction was expensive,frequently six percentage points or more above Treasuries.But, with lots of low hanging fruit, it was worth the cost,and the returns on leveraged private equity were high.
As always happens, however, the markets adjusted.Competition among buyout firms grew, bond ownersdemanded higher returns, and most importantly, corporatemanagements reformed, adopting the “maximizeshareholder value” mantra, making high-return targetsdifficult to find. For the next twenty years or so, privateequity faded to the background. Recently, however, thespread between Treasuries and what is noweuphemistically called the “high yield” bond market hashit record lows. Bond buyers, hungrier than ever for yield,
now demand only a three percentage point premium toTreasuries, half the historical spread. With bond buyerstaking so much of the risk for so little of the return,levering up has again become profitable. In fact the after-tax cost of capital is now lower for private equity firmsthan it is for many cash-rich companies. A private equityfirm can offer a safe harbor with no Sarbanes-Oxley, nopublic disclosure of executive compensation, and nopressure from investors to meet quarterly earnings targets.Financially, a leveraged private company also enjoys a bigreduction in income tax payments (which is becauseinterest to debt holders is deductible, while payments toshareholders aren’t), and a leverage-enhanced equityreturn that is about twice the return of a typical stock.
Imagine a debt-free company that is growing earnings 10%per year and that sells in the stock market at sixteen timesearnings. It accepts a 25% acquisition premium, gettingpurchased for twenty times earnings. The private buyerthen increases the leverage to eight times cashflow, paying8% in annual interest. After five years, the companyre-enters the public marketplace, again at the same sixteentimes earnings it sold for before it was acquired. Had thecompany remained public, the annual return toshareholders would have been only the 10% that earningsgrew (since we assumed the P/E3 ratio didn’t change). But,the return to the private equity holder in the aboveexample is not just 10%. In fact, it exceeds the 20%compound annual return target that most private equityfirms set as their hurdle. The tax payments fall sharply,the debt buyer allows for a very low cost of capital, andwith no change in the operations, the equity returns aredoubled. Magic! That’s why we’re seeing record volumes ofsuch transactions. Private equity firms no longer need todevise operational strategies that increase earnings andgrow value, but rather, most of today’s transactions succeedpurely on financial arbitrage.
Who’s funding all this? Back in the old days, investors paidup significantly to have a public market for a security.“Marketable securities,” both debt and equity, wereconsidered preferable to unmarketable securities. Theywere viewed, correctly in our opinion, as less risky thanprivate securities because they were easier to sell. But today,the tables have oddly turned. In an article about a localcompany that was getting acquired, CDW Corporation,the Chicago Tribune quoted an analyst as saying that oneof the reasons this well run company should go privatewas that it would “allow CDW more access to capital.”4
After I stopped laughing at what I thought was a misprint,I realized that today, it might actually be true. There issuch a strong desire, misguided in our opinion, byinstitutional investors (endowment funds, foundations,
4 T H E O A K M A R K A N D O A K M A R K S E L E C T F U N D S
At Oakmark, we are long-term investors. We attempt to identify growing businesses that are managedto benefit their shareholders. We will purchase stock in those businesses only when priced substantiallybelow our estimate of intrinsic value. After purchase, we patiently wait for the gap between stock priceand intrinsic value to close.
Merrill Corp - Harris-Oakmark 3rd Quarterly Report [Funds] 07-31-2007 [AUX] | sgirard | 26-Jul-07 16:50 | 07-16988-2.da | Sequence: 1CHKSUM Content: 12945 Layout: 18193 Graphics: 35064 CLEAN
JOB: 07-16988-2 CYCLE#;BL#: 13; 0 TRIM: 7.75" x 9.75" AS: Merrill Chicago: 312-786-6300 COMPOSITECOLORS: Black, PANTONE 364 U, ~note-color 2, ~note-color 3 GRAPHICS: w_c_nygren_photo_c.eps V1.5
pension plans) to increase their exposure to “alternativeinvestments” (read: high fee private partnerships) that itmight be generally true that illiquid private investmentsare in greater demand than are liquid public investments.
At Oakmark, we’re buying public equity interests in whatwe believe are some of the greatest businesses in the world,and we’re paying lower prices than private equity is payingfor what we view as mediocre businesses. But investordemand is falling for traditional public equity investment,while it is rapidly growing for private equity. Hmmm. Thatstrikes us as an anomaly that is likely to reverse. To theextent private equity has provided a tail wind for thewhole market, it has provided a much more powerful assistto mid-cap companies than to large-cap. When privateequity slows, which it inevitably will, the loss of thattailwind shouldn’t hurt large-cap stocks as much as it willhurt small- and mid-caps. By purchasing the businesses webelieve are most attractively valued, independent ofwhether or not they are likely to get acquired, we believewe are well positioned no matter how long the privateequity boom continues.
Some shareholders have asked if we aren’t concerned thatprivate equity will buy out all of our companies. To me,that’s like asking: “Are you worried that if you win thelottery you might not be able to do it again?” We welcomeacquisition bids on any of our holdings. If a potential buyer
believes a company is worth a lot more than its market price,and they want to submit a proposal to purchase it, weapplaud. But what if they’re not offering full value? Once anacquisition proposal is made, our focus is as much on theprocess as it is on the price. We believe that today’sacquisition market is so competitive that, almost bydefinition, an open process will result in a fair price. Lastyear when Knight-Ridder was being sold, we weredisappointed that the price we got for our shares wasn’thigher. We were, however, highly confident that the processhad been fair and open, and therefore believed that thebuyer was indeed the high bidder. With a year of hindsightand with lower valuations on newspapers today, both in thestock market and in transactions, the Knight-Ridder priceappears to have been quite good. An open process with alevel playing field is the best insurance we can get that weare obtaining the highest possible price. And if one of ourholdings is considering a proposal to be acquired and youfeel you’re getting shut out from making a higher bid, pleaselet us know. We can make a lot of noise when we need to.
William C. Nygren, CFAPortfolio [email protected]
June 30, 2007
5T H E O A K M A R K A N D O A K M A R K S E L E C T F U N D S
Merrill Corp - Harris-Oakmark 3rd Quarterly Report [Funds] 07-31-2007 [AUX] | sgirard | 26-Jul-07 16:50 | 07-16988-2.da | Sequence: 2CHKSUM Content: 64529 Layout: 53488 Graphics: No Graphics CLEAN
JOB: 07-16988-2 CYCLE#;BL#: 13; 0 TRIM: 7.75" x 9.75" AS: Merrill Chicago: 312-786-6300 COMPOSITECOLORS: Black, PANTONE 364 U, ~note-color 2, ~note-color 3 GRAPHICS: none V1.5
The Oakmark Fund increased in value by 6%during the quarter. Since the Fund was flat in thefirst calendar quarter, the year-to-date increase isalso 6%. The strength in the stock market and ourportfolio was consistent with strong corporateearnings and continued heavy share repurchaseand acquisition activity. For the quarter, sixteen ofour stocks achieved double-digit gains comparedto only two suffering double-digit losses. Our twolargest positive contributors, Texas Instrumentsand Intel, each up 25%, benefited from betterthan expected earnings. Both stocks continue tosell at less than our estimate of business value, sodespite the price increase, we still find bothattractive. During the quarter we added three newpositions and eliminated two. Our purchase ofBest Buy is described below. We also addedpositions in Capital One Financial (COF - $78)and Federal Express (FDX - $111), which areexplained on our website. First Data was sold afterKKR announced their intent to purchase thecompany. Echostar was sold because the stock hadperformed well and was approaching our estimateof business value.
Best-Buy (BBY - $47)
Best Buy is the world’s largest retailer of consumerelectronics. With over 1100 stores and salesapproaching $40 billion, Best Buy has not onlythe largest market share in the U.S. but has morethan twice the share of the number twocompetitor. And with their market share stillunder 25%, most of the market remains in thehands of less efficient competitors. Over the pastfive years, Best Buy has grown per-share sales andearnings at 12% and 18% respectively. We expectthe consumer electronics category to continue togrow faster than other retail categories, and wealso expect Best Buy’s aggressive expansion toincrease their market share. Despite the trackrecord and the long-term opportunity created bytheir competitive advantages, the stock fell from$60 last year to $44. Subtracting their $6 per shareof excess cash (and its related interest income)Best Buy stock now sells at only 14 times expectedearnings. The company has been an aggressiveacquirer of their own stock so far this year, and itjust announced plans to buy back an additional25% of their outstanding shares. We believe thatBest Buy is a superior business and thereforebelieve that investors will again reward it with asuperior multiple.
June 30, 2007
Kevin G. Grant, CFAPortfolio [email protected]
William C. Nygren, CFAPortfolio [email protected]
Report from Bill Nygren and Kevin Grant, Portfolio Managers
THE OAKMARK FUND
6
Average Annual Total Returns(as of 6/30/07)
Total Return 1-year 5-year 10-year SinceLast 3 Months* Inception
(8/5/91)
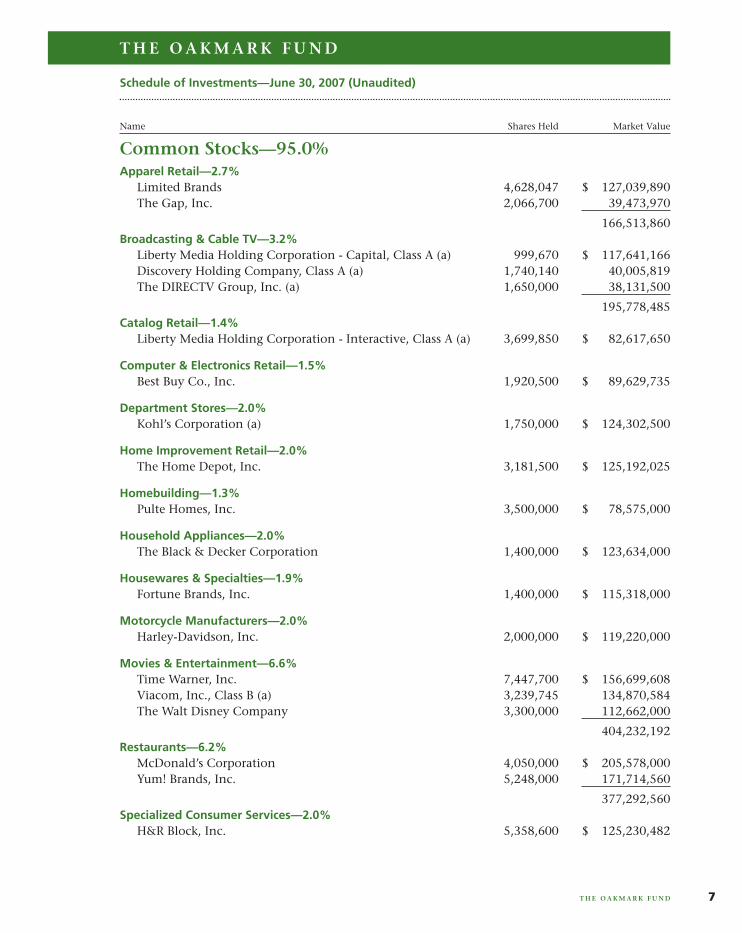
Oakmark Fund (Class I) 6.35% 21.27% 9.22% 7.26% 15.48%S&P 500 6.28% 20.59% 10.71% 7.13% 11.13%Dow Jones Average6 9.11% 23.03% 10.18% 7.85% 12.39%Lipper Large Cap Value Index7 6.47% 21.48% 11.30% 7.59% 11.09%
The graph and table do not reflect the deduction of taxes that a shareholder would payon fund distributions or the redemption of fund shares.Expense Ratio as of 9/30/06 was 1.05%.The performance data quoted represents past performance. Theabove performance information for the Fund does not reflect theimposition of a 2% redemption fee on shares held for 90 days orless to deter market timers. If reflected, the fee would reduce theperformance quoted. Past performance does not guarantee futureresults. The investment return and principal value will fluctuate sothat an investor’s shares, when redeemed, may be worth more orless than their original cost. Current performance may be lower orhigher than the performance data quoted. Average annual totalreturn measures annualized change, while total return measuresaggregate change. To obtain most recent month-end performancedata, visit oakmark.com.
* Not annualized
The OakmarkFund (Class I)$98,630
S & P 500$53,534
12/92 12/94 12/96 12/98 12/00 12/02 12/048/5/91 6/0712/06
$10,000
$20,000
$30,000
$40,000
$50,000
$60,000
$70,000
$100,000
$90,000
$80,000
T H E O A K M A R K F U N D
THE VALUE OF A $10,000 INVESTMENT IN THEOAKMARK FUND FROM ITS INCEPTION (8/5/91) TOPRESENT (6/30/07) AS COMPARED TO THESTANDARD & POOR’S 500 INDEX5
Merrill Corp - Harris-Oakmark 3rd Quarterly Report [Funds] 07-31-2007 [AUX] | sgirard | 26-Jul-07 16:50 | 07-16988-2.ea | Sequence: 1CHKSUM Content: 42674 Layout: 24538 Graphics: 13284 CLEAN
JOB: 07-16988-2 CYCLE#;BL#: 13; 0 TRIM: 7.75" x 9.75" AS: Merrill Chicago: 312-786-6300 COMPOSITECOLORS: Black, PANTONE 364 U, ~note-color 2 GRAPHICS: 16988-2 Oakmark.eps, kevin_grant_photo.eps, w_c_nygren_photo_c.eps V1.5
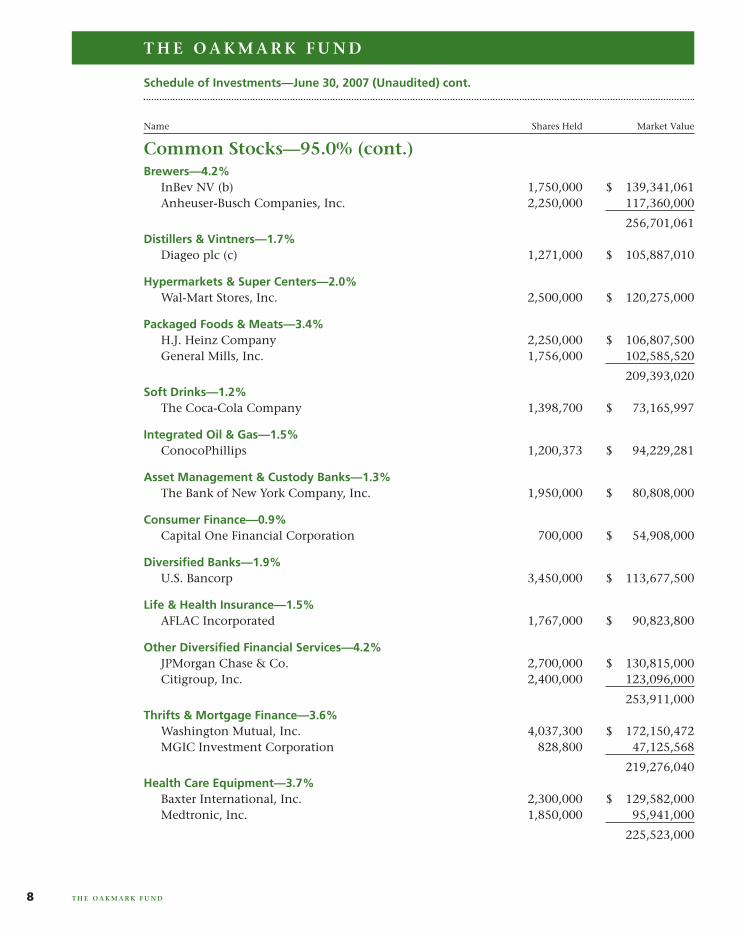
Apparel Retail—2.7%Limited Brands 4,628,047 $ 127,039,890The Gap, Inc. 2,066,700 39,473,970
166,513,860Broadcasting & Cable TV—3.2%
Liberty Media Holding Corporation - Capital, Class A (a) 999,670 $ 117,641,166Discovery Holding Company, Class A (a) 1,740,140 40,005,819The DIRECTV Group, Inc. (a) 1,650,000 38,131,500
195,778,485Catalog Retail—1.4%
Liberty Media Holding Corporation - Interactive, Class A (a) 3,699,850 $ 82,617,650
Computer & Electronics Retail—1.5%Best Buy Co., Inc. 1,920,500 $ 89,629,735
Department Stores—2.0%Kohl’s Corporation (a) 1,750,000 $ 124,302,500
Home Improvement Retail—2.0%The Home Depot, Inc. 3,181,500 $ 125,192,025
Homebuilding—1.3%Pulte Homes, Inc. 3,500,000 $ 78,575,000
Household Appliances—2.0%The Black & Decker Corporation 1,400,000 $ 123,634,000
Housewares & Specialties—1.9%Fortune Brands, Inc. 1,400,000 $ 115,318,000
Motorcycle Manufacturers—2.0%Harley-Davidson, Inc. 2,000,000 $ 119,220,000
Movies & Entertainment—6.6%Time Warner, Inc. 7,447,700 $ 156,699,608Viacom, Inc., Class B (a) 3,239,745 134,870,584The Walt Disney Company 3,300,000 112,662,000
404,232,192Restaurants—6.2%
McDonald’s Corporation 4,050,000 $ 205,578,000Yum! Brands, Inc. 5,248,000 171,714,560
377,292,560Specialized Consumer Services—2.0%
H&R Block, Inc. 5,358,600 $ 125,230,482
Schedule of Investments—June 30, 2007 (Unaudited)
Name Shares Held Market Value
T H E O A K M A R K F U N D
T H E O A K M A R K F U N D 7
Common Stocks—95.0%
Merrill Corp - Harris-Oakmark 3rd Quarterly Report [Funds] 07-31-2007 [AUX] | sgirard | 26-Jul-07 16:50 | 07-16988-2.ea | Sequence: 2CHKSUM Content: 7377 Layout: 1091 Graphics: No Graphics CLEAN
JOB: 07-16988-2 CYCLE#;BL#: 13; 0 TRIM: 7.75" x 9.75" AS: Merrill Chicago: 312-786-6300 COMPOSITECOLORS: Black, PANTONE 364 U, ~note-color 2, ~note-color 3 GRAPHICS: none V1.5
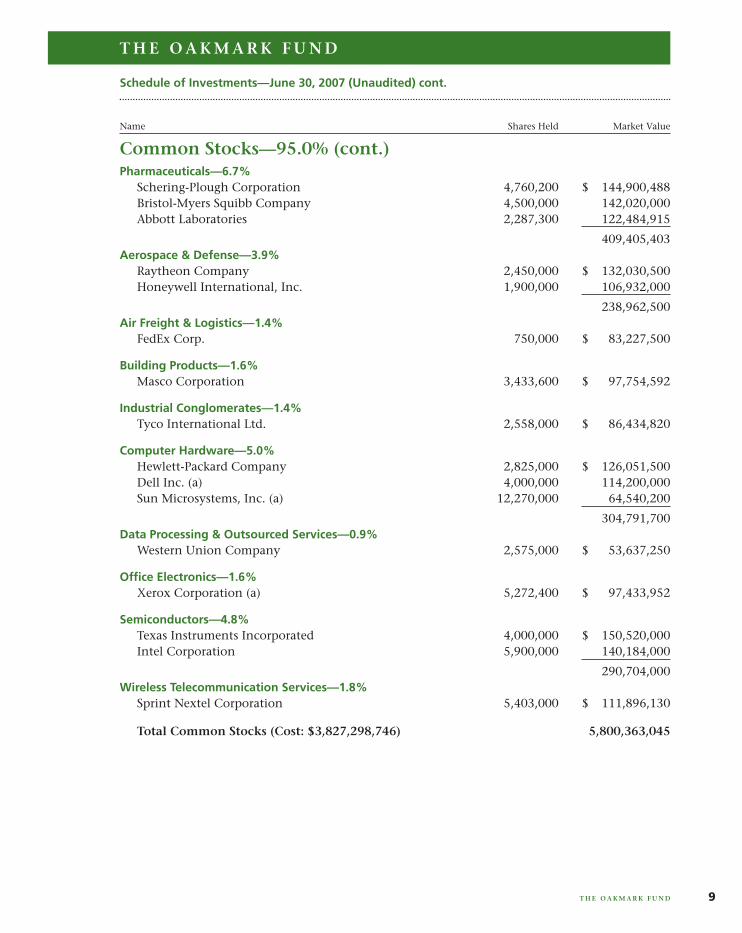
Brewers—4.2%InBev NV (b) 1,750,000 $ 139,341,061Anheuser-Busch Companies, Inc. 2,250,000 117,360,000
256,701,061Distillers & Vintners—1.7%
Diageo plc (c) 1,271,000 $ 105,887,010
Hypermarkets & Super Centers—2.0%Wal-Mart Stores, Inc. 2,500,000 $ 120,275,000
Packaged Foods & Meats—3.4%H.J. Heinz Company 2,250,000 $ 106,807,500General Mills, Inc. 1,756,000 102,585,520
209,393,020Soft Drinks—1.2%
The Coca-Cola Company 1,398,700 $ 73,165,997
Integrated Oil & Gas—1.5%ConocoPhillips 1,200,373 $ 94,229,281
Asset Management & Custody Banks—1.3%The Bank of New York Company, Inc. 1,950,000 $ 80,808,000
Consumer Finance—0.9%Capital One Financial Corporation 700,000 $ 54,908,000
Diversified Banks—1.9%U.S. Bancorp 3,450,000 $ 113,677,500
Life & Health Insurance—1.5%AFLAC Incorporated 1,767,000 $ 90,823,800
Other Diversified Financial Services—4.2%JPMorgan Chase & Co. 2,700,000 $ 130,815,000Citigroup, Inc. 2,400,000 123,096,000
253,911,000Thrifts & Mortgage Finance—3.6%
Washington Mutual, Inc. 4,037,300 $ 172,150,472MGIC Investment Corporation 828,800 47,125,568
219,276,040Health Care Equipment—3.7%
Baxter International, Inc. 2,300,000 $ 129,582,000Medtronic, Inc. 1,850,000 95,941,000
225,523,000
Schedule of Investments—June 30, 2007 (Unaudited) cont.
Name Shares Held Market Value
T H E O A K M A R K F U N D
T H E O A K M A R K F U N D8
Common Stocks—95.0% (cont.)
Merrill Corp - Harris-Oakmark 3rd Quarterly Report [Funds] 07-31-2007 [AUX] | sgirard | 26-Jul-07 16:50 | 07-16988-2.ea | Sequence: 3CHKSUM Content: 8664 Layout: 23726 Graphics: No Graphics CLEAN
JOB: 07-16988-2 CYCLE#;BL#: 13; 0 TRIM: 7.75" x 9.75" AS: Merrill Chicago: 312-786-6300 COMPOSITECOLORS: Black, PANTONE 364 U, ~note-color 2, ~note-color 3 GRAPHICS: none V1.5
Pharmaceuticals—6.7%Schering-Plough Corporation 4,760,200 $ 144,900,488Bristol-Myers Squibb Company 4,500,000 142,020,000Abbott Laboratories 2,287,300 122,484,915
409,405,403Aerospace & Defense—3.9%
Raytheon Company 2,450,000 $ 132,030,500Honeywell International, Inc. 1,900,000 106,932,000
238,962,500Air Freight & Logistics—1.4%
FedEx Corp. 750,000 $ 83,227,500
Building Products—1.6%Masco Corporation 3,433,600 $ 97,754,592
Industrial Conglomerates—1.4%Tyco International Ltd. 2,558,000 $ 86,434,820
Computer Hardware—5.0%Hewlett-Packard Company 2,825,000 $ 126,051,500Dell Inc. (a) 4,000,000 114,200,000Sun Microsystems, Inc. (a) 12,270,000 64,540,200
304,791,700Data Processing & Outsourced Services—0.9%
Western Union Company 2,575,000 $ 53,637,250
Office Electronics—1.6%Xerox Corporation (a) 5,272,400 $ 97,433,952
Semiconductors—4.8%Texas Instruments Incorporated 4,000,000 $ 150,520,000Intel Corporation 5,900,000 140,184,000
290,704,000Wireless Telecommunication Services—1.8%
Sprint Nextel Corporation 5,403,000 $ 111,896,130
Total Common Stocks (Cost: $3,827,298,746) 5,800,363,045
Schedule of Investments—June 30, 2007 (Unaudited) cont.
Name Shares Held Market Value
T H E O A K M A R K F U N D
T H E O A K M A R K F U N D 9
Common Stocks—95.0% (cont.)
Merrill Corp - Harris-Oakmark 3rd Quarterly Report [Funds] 07-31-2007 [AUX] | sgirard | 26-Jul-07 16:50 | 07-16988-2.ea | Sequence: 4CHKSUM Content: 5662 Layout: 38548 Graphics: No Graphics CLEAN
JOB: 07-16988-2 CYCLE#;BL#: 13; 0 TRIM: 7.75" x 9.75" AS: Merrill Chicago: 312-786-6300 COMPOSITECOLORS: Black, PANTONE 364 U, ~note-color 2, ~note-color 3 GRAPHICS: none V1.5
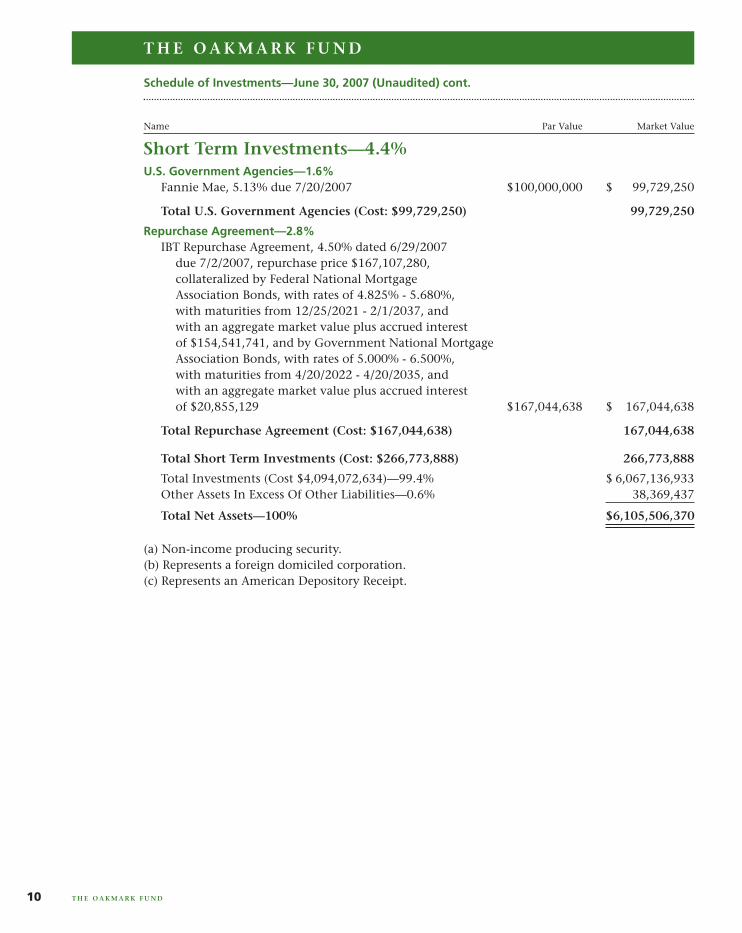
U.S. Government Agencies—1.6%Fannie Mae, 5.13% due 7/20/2007 $100,000,000 $ 99,729,250
Total U.S. Government Agencies (Cost: $99,729,250) 99,729,250
Repurchase Agreement—2.8%IBT Repurchase Agreement, 4.50% dated 6/29/2007
due 7/2/2007, repurchase price $167,107,280, collateralized by Federal National Mortgage Association Bonds, with rates of 4.825% - 5.680%, with maturities from 12/25/2021 - 2/1/2037, and with an aggregate market value plus accrued interest of $154,541,741, and by Government National Mortgage Association Bonds, with rates of 5.000% - 6.500%, with maturities from 4/20/2022 - 4/20/2035, and with an aggregate market value plus accrued interest of $20,855,129 $167,044,638 $ 167,044,638
Total Repurchase Agreement (Cost: $167,044,638) 167,044,638
Total Short Term Investments (Cost: $266,773,888) 266,773,888
Total Investments (Cost $4,094,072,634)—99.4% $ 6,067,136,933Other Assets In Excess Of Other Liabilities—0.6% 38,369,437
Total Net Assets—100% $6,105,506,370
(a) Non-income producing security.(b) Represents a foreign domiciled corporation.(c) Represents an American Depository Receipt.
Schedule of Investments—June 30, 2007 (Unaudited) cont.
Name Par Value Market Value
T H E O A K M A R K F U N D
T H E O A K M A R K F U N D10
Short Term Investments—4.4%
Merrill Corp - Harris-Oakmark 3rd Quarterly Report [Funds] 07-31-2007 [AUX] | sgirard | 26-Jul-07 16:50 | 07-16988-2.ea | Sequence: 5CHKSUM Content: 13649 Layout: 23726 Graphics: No Graphics CLEAN
JOB: 07-16988-2 CYCLE#;BL#: 13; 0 TRIM: 7.75" x 9.75" AS: Merrill Chicago: 312-786-6300 COMPOSITECOLORS: Black, PANTONE 364 U, ~note-color 2, ~note-color 3 GRAPHICS: none V1.5
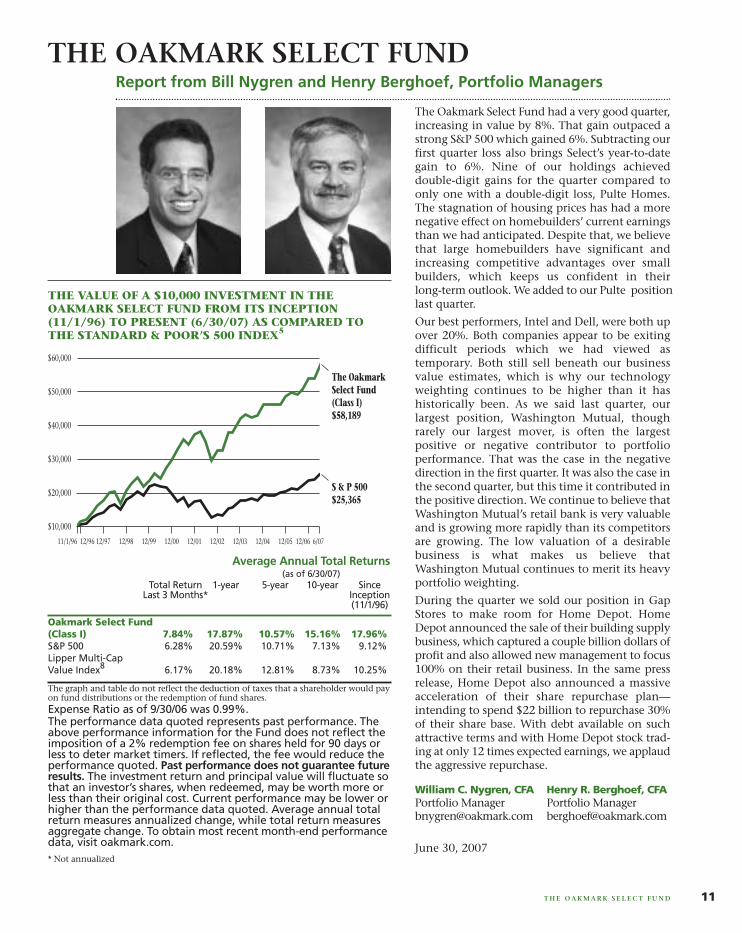
The Oakmark Select Fund had a very good quarter,increasing in value by 8%. That gain outpaced astrong S&P 500 which gained 6%. Subtracting ourfirst quarter loss also brings Select’s year-to-dategain to 6%. Nine of our holdings achieveddouble-digit gains for the quarter compared toonly one with a double-digit loss, Pulte Homes.The stagnation of housing prices has had a morenegative effect on homebuilders’ current earningsthan we had anticipated. Despite that, we believethat large homebuilders have significant andincreasing competitive advantages over smallbuilders, which keeps us confident in theirlong-term outlook. We added to our Pulte positionlast quarter.
Our best performers, Intel and Dell, were both upover 20%. Both companies appear to be exitingdifficult periods which we had viewed astemporary. Both still sell beneath our businessvalue estimates, which is why our technologyweighting continues to be higher than it hashistorically been. As we said last quarter, ourlargest position, Washington Mutual, thoughrarely our largest mover, is often the largestpositive or negative contributor to portfolioperformance. That was the case in the negativedirection in the first quarter. It was also the case inthe second quarter, but this time it contributed inthe positive direction. We continue to believe thatWashington Mutual’s retail bank is very valuableand is growing more rapidly than its competitorsare growing. The low valuation of a desirablebusiness is what makes us believe thatWashington Mutual continues to merit its heavyportfolio weighting.
During the quarter we sold our position in GapStores to make room for Home Depot. HomeDepot announced the sale of their building supplybusiness, which captured a couple billion dollars ofprofit and also allowed new management to focus100% on their retail business. In the same pressrelease, Home Depot also announced a massiveacceleration of their share repurchase plan—intending to spend $22 billion to repurchase 30%of their share base. With debt available on suchattractive terms and with Home Depot stock trad-ing at only 12 times expected earnings, we applaudthe aggressive repurchase.
June 30, 2007
Henry R. Berghoef, CFAPortfolio [email protected]
William C. Nygren, CFAPortfolio [email protected]
Report from Bill Nygren and Henry Berghoef, Portfolio Managers
11T H E O A K M A R K S E L E C T F U N D
THE VALUE OF A $10,000 INVESTMENT IN THEOAKMARK SELECT FUND FROM ITS INCEPTION(11/1/96) TO PRESENT (6/30/07) AS COMPARED TOTHE STANDARD & POOR’S 500 INDEX5
Average Annual Total Returns(as of 6/30/07)
Total Return 1-year 5-year 10-year SinceLast 3 Months* Inception
(11/1/96)
Oakmark Select Fund (Class I) 7.84% 17.87% 10.57% 15.16% 17.96%S&P 500 6.28% 20.59% 10.71% 7.13% 9.12%Lipper Multi-Cap Value Index8 6.17% 20.18% 12.81% 8.73% 10.25%
The graph and table do not reflect the deduction of taxes that a shareholder would payon fund distributions or the redemption of fund shares.Expense Ratio as of 9/30/06 was 0.99%.The performance data quoted represents past performance. Theabove performance information for the Fund does not reflect theimposition of a 2% redemption fee on shares held for 90 days orless to deter market timers. If reflected, the fee would reduce theperformance quoted. Past performance does not guarantee futureresults. The investment return and principal value will fluctuate sothat an investor’s shares, when redeemed, may be worth more orless than their original cost. Current performance may be lower orhigher than the performance data quoted. Average annual totalreturn measures annualized change, while total return measuresaggregate change. To obtain most recent month-end performancedata, visit oakmark.com.* Not annualized
The OakmarkSelect Fund(Class I)$58,189
S & P 500$25,365
11/1/96 6/0712/0612/96 12/97 12/98 12/99 12/00 12/01 12/02 12/03 12/04 12/05
$10,000
$20,000
$30,000
$40,000
$60,000
$50,000
THE OAKMARK SELECT FUND
Merrill Corp - Harris-Oakmark 3rd Quarterly Report [Funds] 07-31-2007 [AUX] | sgirard | 26-Jul-07 16:51 | 07-16988-2.ec | Sequence: 1CHKSUM Content: 63698 Layout: 7090 Graphics: 10484 CLEAN
JOB: 07-16988-2 CYCLE#;BL#: 13; 0 TRIM: 7.75" x 9.75" AS: Merrill Chicago: 312-786-6300 COMPOSITECOLORS: Black, PANTONE 364 U, ~note-color 1, ~note-color 2, ~note-color 3 GRAPHICS: 16988-2 Sel line.eps, henry_berghoef_photo.eps, w_c_nygren_photo_c.eps V1.5
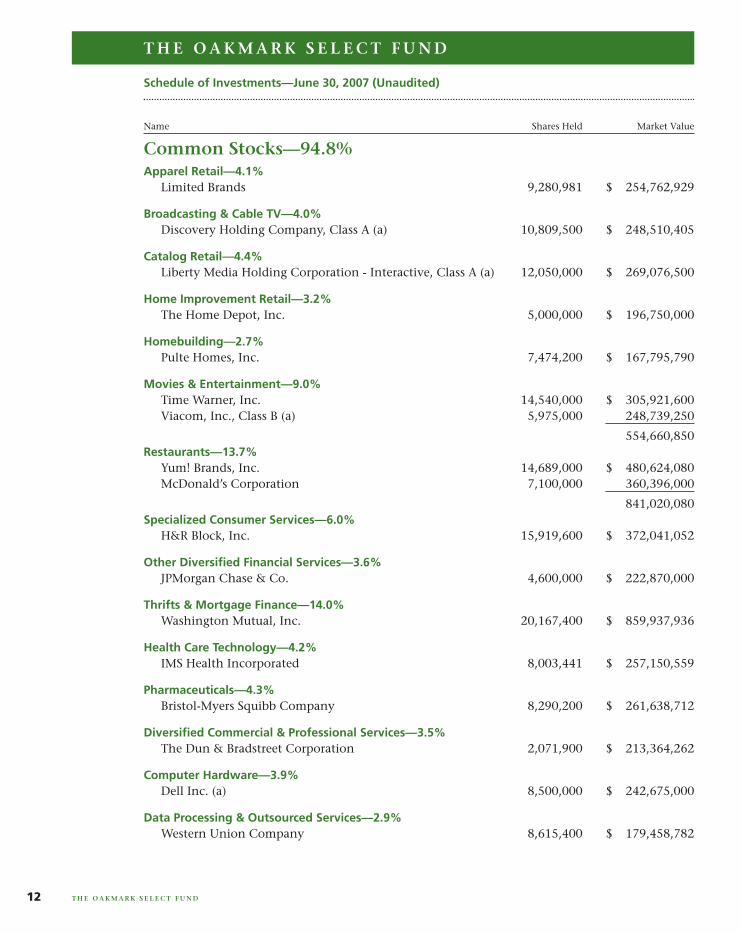
Apparel Retail—4.1%Limited Brands 9,280,981 $ 254,762,929
Broadcasting & Cable TV—4.0%Discovery Holding Company, Class A (a) 10,809,500 $ 248,510,405
Catalog Retail—4.4%Liberty Media Holding Corporation - Interactive, Class A (a) 12,050,000 $ 269,076,500
Home Improvement Retail—3.2%The Home Depot, Inc. 5,000,000 $ 196,750,000
Homebuilding—2.7%Pulte Homes, Inc. 7,474,200 $ 167,795,790
Movies & Entertainment—9.0%Time Warner, Inc. 14,540,000 $ 305,921,600Viacom, Inc., Class B (a) 5,975,000 248,739,250
554,660,850Restaurants—13.7%
Yum! Brands, Inc. 14,689,000 $ 480,624,080McDonald’s Corporation 7,100,000 360,396,000
841,020,080Specialized Consumer Services—6.0%
H&R Block, Inc. 15,919,600 $ 372,041,052
Other Diversified Financial Services—3.6%JPMorgan Chase & Co. 4,600,000 $ 222,870,000
Thrifts & Mortgage Finance—14.0%Washington Mutual, Inc. 20,167,400 $ 859,937,936
Health Care Technology—4.2%IMS Health Incorporated 8,003,441 $ 257,150,559
Pharmaceuticals—4.3%Bristol-Myers Squibb Company 8,290,200 $ 261,638,712
Diversified Commercial & Professional Services—3.5%The Dun & Bradstreet Corporation 2,071,900 $ 213,364,262
Computer Hardware—3.9%Dell Inc. (a) 8,500,000 $ 242,675,000
Data Processing & Outsourced Services—2.9%Western Union Company 8,615,400 $ 179,458,782
Schedule of Investments—June 30, 2007 (Unaudited)
Name Shares Held Market Value
T H E O A K M A R K S E L E C T F U N D
T H E O A K M A R K S E L E C T F U N D12
Common Stocks—94.8%
Merrill Corp - Harris-Oakmark 3rd Quarterly Report [Funds] 07-31-2007 [AUX] | sgirard | 26-Jul-07 16:51 | 07-16988-2.ec | Sequence: 2CHKSUM Content: 44015 Layout: 23726 Graphics: No Graphics CLEAN
JOB: 07-16988-2 CYCLE#;BL#: 13; 0 TRIM: 7.75" x 9.75" AS: Merrill Chicago: 312-786-6300 COMPOSITECOLORS: Black, PANTONE 364 U, ~note-color 2, ~note-color 3 GRAPHICS: none V1.5
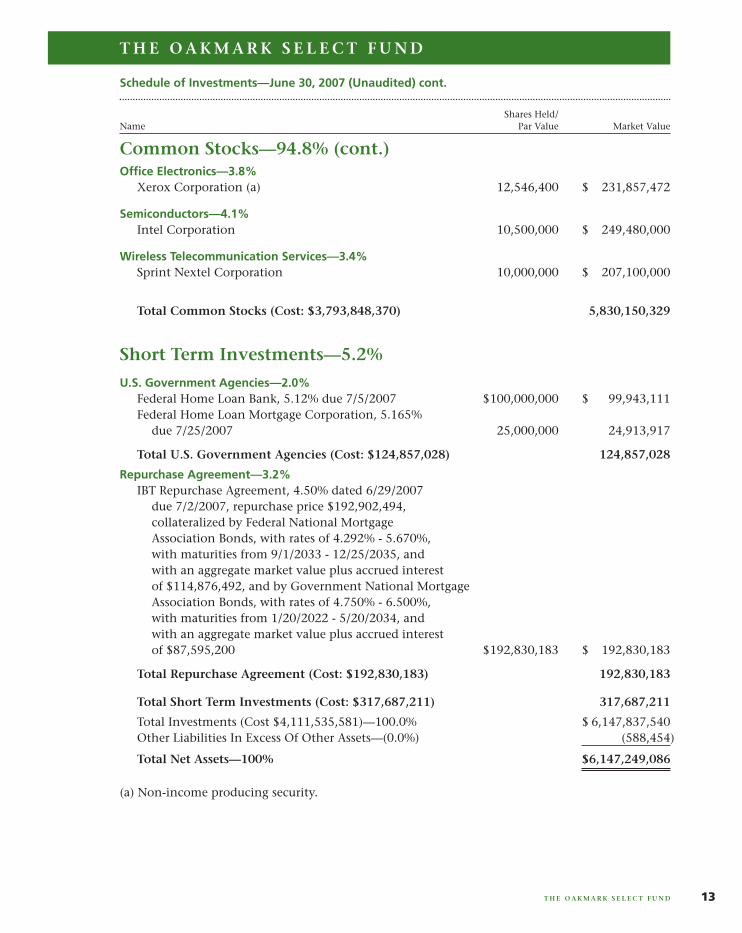
Office Electronics—3.8%Xerox Corporation (a) 12,546,400 $ 231,857,472
Semiconductors—4.1%Intel Corporation 10,500,000 $ 249,480,000
Wireless Telecommunication Services—3.4%Sprint Nextel Corporation 10,000,000 $ 207,100,000
Total Common Stocks (Cost: $3,793,848,370) 5,830,150,329
Short Term Investments—5.2%
U.S. Government Agencies—2.0%Federal Home Loan Bank, 5.12% due 7/5/2007 $100,000,000 $ 99,943,111Federal Home Loan Mortgage Corporation, 5.165%
due 7/25/2007 25,000,000 24,913,917
Total U.S. Government Agencies (Cost: $124,857,028) 124,857,028
Repurchase Agreement—3.2%IBT Repurchase Agreement, 4.50% dated 6/29/2007
due 7/2/2007, repurchase price $192,902,494, collateralized by Federal National Mortgage Association Bonds, with rates of 4.292% - 5.670%, with maturities from 9/1/2033 - 12/25/2035, and with an aggregate market value plus accrued interest of $114,876,492, and by Government National Mortgage Association Bonds, with rates of 4.750% - 6.500%, with maturities from 1/20/2022 - 5/20/2034, and with an aggregate market value plus accrued interest of $87,595,200 $192,830,183 $ 192,830,183
Total Repurchase Agreement (Cost: $192,830,183) 192,830,183
Total Short Term Investments (Cost: $317,687,211) 317,687,211
Total Investments (Cost $4,111,535,581)—100.0% $ 6,147,837,540Other Liabilities In Excess Of Other Assets—(0.0%) (588,454)
Total Net Assets—100% $6,147,249,086
(a) Non-income producing security.
Schedule of Investments—June 30, 2007 (Unaudited) cont.
Shares Held/Name Par Value Market Value
T H E O A K M A R K S E L E C T F U N D
T H E O A K M A R K S E L E C T F U N D 13
Common Stocks—94.8% (cont.)
Merrill Corp - Harris-Oakmark 3rd Quarterly Report [Funds] 07-31-2007 [AUX] | sgirard | 26-Jul-07 16:51 | 07-16988-2.ec | Sequence: 3CHKSUM Content: 16253 Layout: 38548 Graphics: No Graphics CLEAN
JOB: 07-16988-2 CYCLE#;BL#: 13; 0 TRIM: 7.75" x 9.75" AS: Merrill Chicago: 312-786-6300 COMPOSITECOLORS: Black, PANTONE 364 U, ~note-color 2, ~note-color 3 GRAPHICS: none V1.5
“Life can only be understood backwards; but itmust be lived forwards.”Kierkegaard
Quarter ReviewThe Equity and Income Fund achieved a returnof 4% in the quarter ended June 30, 2007, match-ing the 4% return that Lipper reported for itsBalanced Fund Index. For the first six months ofthe current calendar year, the Fund earned 7% andthe Lipper Balanced Fund Index returned 6%.Moreover, we are pleased to report a return of 14%compounded annually since the inception of theEquity and Income Fund. Strong contributors toperformance during this quarter were MedImmune(acquired by AstraZeneca); EnCana (strong long-term fundamentals and rebound in energy prices);XTO Energy (continuation of outstanding funda-mental results coupled with potential restructur-ing); ConocoPhillips (rebound in energy pricesand strong refining margins); Ingersoll-Rand(restructuring). Detractors from returns for thequarter were SAFECO (concern about pricing com-petition in personal auto); News Corporation(uncertainty surrounding the potential acquisi-tion of Dow Jones); and UST (Altria entered intothe smokeless tobacco arena).As value investors, we are especially happy whenmerger and acquisition activity confirms that wehave been searching for value in the right places.During the quarter, your Fund benefited from thisactivity in a number of its holdings. As men-tioned above, MedImmune was acquired byAstraZeneca at a significant premium to its thenmarket value and at a price at the high end ofmost assessments of the firm’s private marketvalue. Another long-term holding in the Equityand Income Fund, Ceridian, received a buy-outoffer of $36 per share from a combination of pri-vate and public equity investors. Finally, CDWCorporation is being taken private at a price of$87.75 per share by private equity firm MadisonDearborn Partners, LLC. On balance, we arepleased with this buyout activity. We will confessto a certain sadness, however, where we under-stood the valuation parameters and prospects ofa business and it is called away from us. In allthree of the above instances, a major factor inthis activity was the arbitrage opportunity avail-able in the longer end of the high-yield debt mar-kets. Put simply, buyout companies are able toobtain “junk” financing at a spread roughly300 basis points over the equivalent maturityrisk-free U.S. Treasury; the historic pricing for suchdebt has typically been between 600 to 800 basispoints above the risk-free U.S. Treasury. One ofthe current market mysteries is why high-yieldinvestors have accepted such low compensationfor their risk. It also indicates why we have beenunable to find acceptable investments in thehigh-yield marketplace.
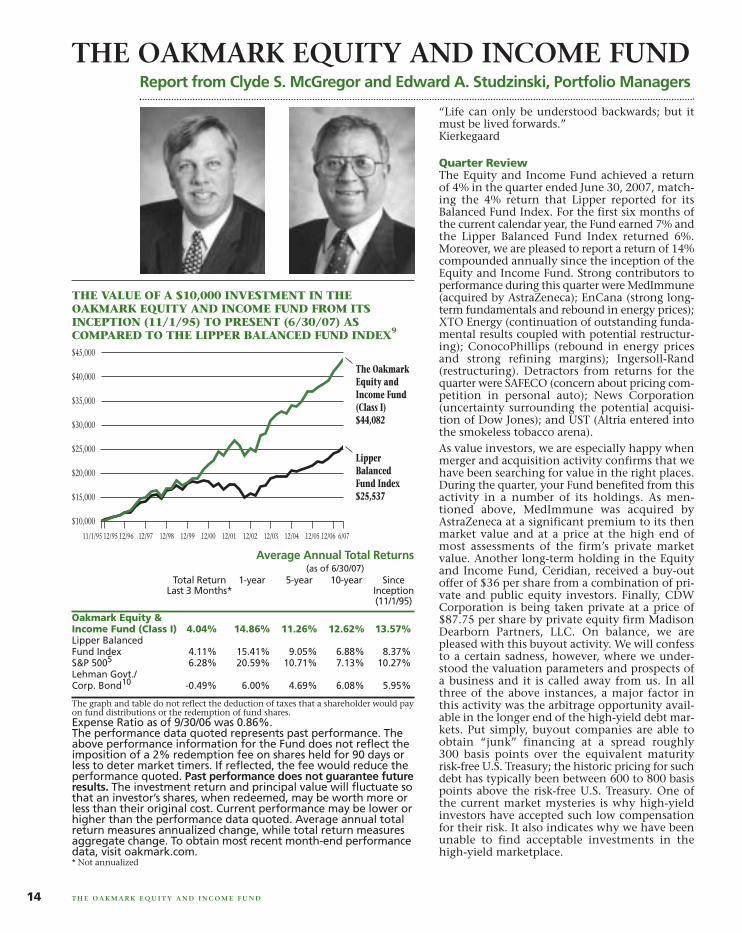
Report from Clyde S. McGregor and Edward A. Studzinski, Portfolio Managers
THE OAKMARK EQUITY AND INCOME FUND
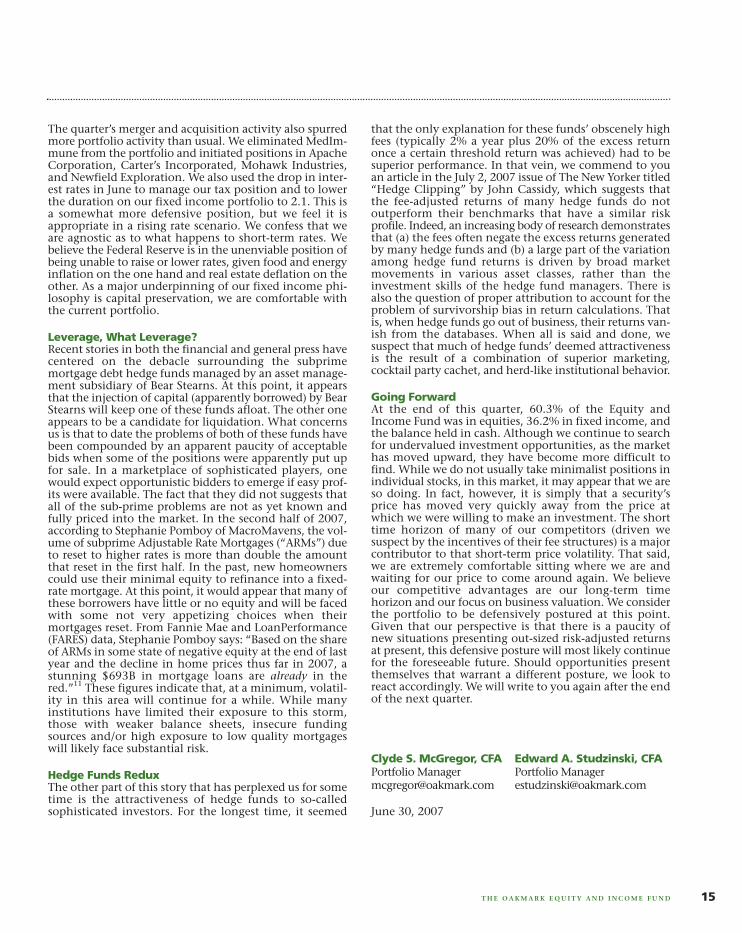
THE VALUE OF A $10,000 INVESTMENT IN THEOAKMARK EQUITY AND INCOME FUND FROM ITSINCEPTION (11/1/95) TO PRESENT (6/30/07) ASCOMPARED TO THE LIPPER BALANCED FUND INDEX9
Average Annual Total Returns(as of 6/30/07)
Total Return 1-year 5-year 10-year Since Last 3 Months* Inception
(11/1/95)
Oakmark Equity & Income Fund (Class I) 4.04% 14.86% 11.26% 12.62% 13.57%Lipper BalancedFund Index 4.11% 15.41% 9.05% 6.88% 8.37%S&P 5005 6.28% 20.59% 10.71% 7.13% 10.27%Lehman Govt./Corp. Bond10 -0.49% 6.00% 4.69% 6.08% 5.95%
The graph and table do not reflect the deduction of taxes that a shareholder would payon fund distributions or the redemption of fund shares.Expense Ratio as of 9/30/06 was 0.86%.The performance data quoted represents past performance. Theabove performance information for the Fund does not reflect theimposition of a 2% redemption fee on shares held for 90 days orless to deter market timers. If reflected, the fee would reduce theperformance quoted. Past performance does not guarantee futureresults. The investment return and principal value will fluctuate sothat an investor’s shares, when redeemed, may be worth more orless than their original cost. Current performance may be lower orhigher than the performance data quoted. Average annual totalreturn measures annualized change, while total return measuresaggregate change. To obtain most recent month-end performancedata, visit oakmark.com.* Not annualized
The OakmarkEquity andIncome Fund(Class I)$44,082
LipperBalancedFund Index$25,537
11/1/95 6/0712/0612/95 12/96 12/97 12/98 12/99 12/00 12/01 12/02 12/03 12/04 12/05
$10,000
$15,000
$20,000
$25,000
$35,000
$30,000
$45,000
$40,000
14 T H E O A K M A R K E Q U I T Y A N D I N C O M E F U N D
Merrill Corp - Harris-Oakmark 3rd Quarterly Report [Funds] 07-31-2007 [AUX] | sgirard | 26-Jul-07 16:51 | 07-16988-2.ee | Sequence: 1CHKSUM Content: 4898 Layout: 40866 Graphics: 38512 CLEAN
JOB: 07-16988-2 CYCLE#;BL#: 13; 0 TRIM: 7.75" x 9.75" AS: Merrill Chicago: 312-786-6300 COMPOSITECOLORS: Black, PANTONE 364 U, ~note-color 2 GRAPHICS: 16988-2 Eqty Inc line.eps, clyde_s_mcgregor_photo.eps, edward_studzinski_photo.eps V1.5
The quarter’s merger and acquisition activity also spurredmore portfolio activity than usual. We eliminated MedIm-mune from the portfolio and initiated positions in ApacheCorporation, Carter’s Incorporated, Mohawk Industries,and Newfield Exploration. We also used the drop in inter-est rates in June to manage our tax position and to lowerthe duration on our fixed income portfolio to 2.1. This isa somewhat more defensive position, but we feel it isappropriate in a rising rate scenario. We confess that weare agnostic as to what happens to short-term rates. Webelieve the Federal Reserve is in the unenviable position ofbeing unable to raise or lower rates, given food and energyinflation on the one hand and real estate deflation on theother. As a major underpinning of our fixed income phi-losophy is capital preservation, we are comfortable withthe current portfolio.
Leverage, What Leverage?Recent stories in both the financial and general press havecentered on the debacle surrounding the subprimemortgage debt hedge funds managed by an asset manage-ment subsidiary of Bear Stearns. At this point, it appearsthat the injection of capital (apparently borrowed) by BearStearns will keep one of these funds afloat. The other oneappears to be a candidate for liquidation. What concernsus is that to date the problems of both of these funds havebeen compounded by an apparent paucity of acceptablebids when some of the positions were apparently put upfor sale. In a marketplace of sophisticated players, onewould expect opportunistic bidders to emerge if easy prof-its were available. The fact that they did not suggests thatall of the sub-prime problems are not as yet known andfully priced into the market. In the second half of 2007,according to Stephanie Pomboy of MacroMavens, the vol-ume of subprime Adjustable Rate Mortgages (“ARMs”) dueto reset to higher rates is more than double the amountthat reset in the first half. In the past, new homeownerscould use their minimal equity to refinance into a fixed-rate mortgage. At this point, it would appear that many ofthese borrowers have little or no equity and will be facedwith some not very appetizing choices when theirmortgages reset. From Fannie Mae and LoanPerformance(FARES) data, Stephanie Pomboy says: “Based on the shareof ARMs in some state of negative equity at the end of lastyear and the decline in home prices thus far in 2007, astunning $693B in mortgage loans are already in thered.”11 These figures indicate that, at a minimum, volatil-ity in this area will continue for a while. While manyinstitutions have limited their exposure to this storm,those with weaker balance sheets, insecure fundingsources and/or high exposure to low quality mortgageswill likely face substantial risk.
Hedge Funds ReduxThe other part of this story that has perplexed us for sometime is the attractiveness of hedge funds to so-calledsophisticated investors. For the longest time, it seemed
that the only explanation for these funds’ obscenely highfees (typically 2% a year plus 20% of the excess returnonce a certain threshold return was achieved) had to besuperior performance. In that vein, we commend to youan article in the July 2, 2007 issue of The New Yorker titled“Hedge Clipping” by John Cassidy, which suggests thatthe fee-adjusted returns of many hedge funds do notoutperform their benchmarks that have a similar riskprofile. Indeed, an increasing body of research demonstratesthat (a) the fees often negate the excess returns generatedby many hedge funds and (b) a large part of the variationamong hedge fund returns is driven by broad marketmovements in various asset classes, rather than theinvestment skills of the hedge fund managers. There isalso the question of proper attribution to account for theproblem of survivorship bias in return calculations. Thatis, when hedge funds go out of business, their returns van-ish from the databases. When all is said and done, wesuspect that much of hedge funds’ deemed attractivenessis the result of a combination of superior marketing,cocktail party cachet, and herd-like institutional behavior.
Going ForwardAt the end of this quarter, 60.3% of the Equity andIncome Fund was in equities, 36.2% in fixed income, andthe balance held in cash. Although we continue to searchfor undervalued investment opportunities, as the markethas moved upward, they have become more difficult tofind. While we do not usually take minimalist positions inindividual stocks, in this market, it may appear that we areso doing. In fact, however, it is simply that a security’sprice has moved very quickly away from the price atwhich we were willing to make an investment. The shorttime horizon of many of our competitors (driven wesuspect by the incentives of their fee structures) is a majorcontributor to that short-term price volatility. That said,we are extremely comfortable sitting where we are andwaiting for our price to come around again. We believeour competitive advantages are our long-term timehorizon and our focus on business valuation. We considerthe portfolio to be defensively postured at this point.Given that our perspective is that there is a paucity ofnew situations presenting out-sized risk-adjusted returnsat present, this defensive posture will most likely continuefor the foreseeable future. Should opportunities presentthemselves that warrant a different posture, we look toreact accordingly. We will write to you again after the endof the next quarter.
June 30, 2007
Edward A. Studzinski, CFAPortfolio [email protected]
Clyde S. McGregor, CFAPortfolio [email protected]
15T H E O A K M A R K E Q U I T Y A N D I N C O M E F U N D
Merrill Corp - Harris-Oakmark 3rd Quarterly Report [Funds] 07-31-2007 [AUX] | sgirard | 26-Jul-07 16:51 | 07-16988-2.ee | Sequence: 2CHKSUM Content: 42405 Layout: 37518 Graphics: No Graphics CLEAN
JOB: 07-16988-2 CYCLE#;BL#: 13; 0 TRIM: 7.75" x 9.75" AS: Merrill Chicago: 312-786-6300 COMPOSITECOLORS: Black, PANTONE 364 U, ~note-color 2 GRAPHICS: none V1.5
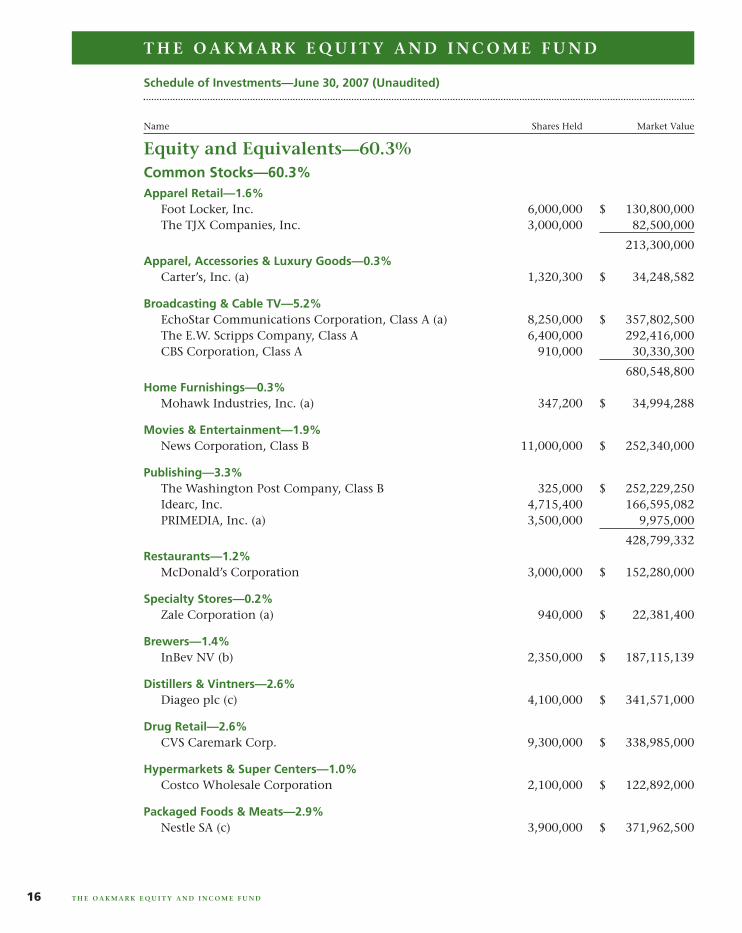
Common Stocks—60.3%Apparel Retail—1.6%
Foot Locker, Inc. 6,000,000 $ 130,800,000The TJX Companies, Inc. 3,000,000 82,500,000
213,300,000Apparel, Accessories & Luxury Goods—0.3%
Carter’s, Inc. (a) 1,320,300 $ 34,248,582
Broadcasting & Cable TV—5.2%EchoStar Communications Corporation, Class A (a) 8,250,000 $ 357,802,500The E.W. Scripps Company, Class A 6,400,000 292,416,000CBS Corporation, Class A 910,000 30,330,300
680,548,800Home Furnishings—0.3%
Mohawk Industries, Inc. (a) 347,200 $ 34,994,288
Movies & Entertainment—1.9%News Corporation, Class B 11,000,000 $ 252,340,000
Publishing—3.3%The Washington Post Company, Class B 325,000 $ 252,229,250Idearc, Inc. 4,715,400 166,595,082PRIMEDIA, Inc. (a) 3,500,000 9,975,000
428,799,332Restaurants—1.2%
McDonald’s Corporation 3,000,000 $ 152,280,000
Specialty Stores—0.2%Zale Corporation (a) 940,000 $ 22,381,400
Brewers—1.4%InBev NV (b) 2,350,000 $ 187,115,139
Distillers & Vintners—2.6%Diageo plc (c) 4,100,000 $ 341,571,000
Drug Retail—2.6%CVS Caremark Corp. 9,300,000 $ 338,985,000
Hypermarkets & Super Centers—1.0%Costco Wholesale Corporation 2,100,000 $ 122,892,000
Packaged Foods & Meats—2.9%Nestle SA (c) 3,900,000 $ 371,962,500
Schedule of Investments—June 30, 2007 (Unaudited)
Name Shares Held Market Value
T H E O A K M A R K E Q U I T Y A N D I N C O M E F U N D
T H E O A K M A R K E Q U I T Y A N D I N C O M E F U N D16
Equity and Equivalents—60.3%
Merrill Corp - Harris-Oakmark 3rd Quarterly Report [Funds] 07-31-2007 [AUX] | sgirard | 26-Jul-07 16:51 | 07-16988-2.ee | Sequence: 3CHKSUM Content: 54127 Layout: 9740 Graphics: No Graphics CLEAN
JOB: 07-16988-2 CYCLE#;BL#: 13; 0 TRIM: 7.75" x 9.75" AS: Merrill Chicago: 312-786-6300 COMPOSITECOLORS: Black, PANTONE 364 U, ~note-color 2, ~note-color 3 GRAPHICS: none V1.5
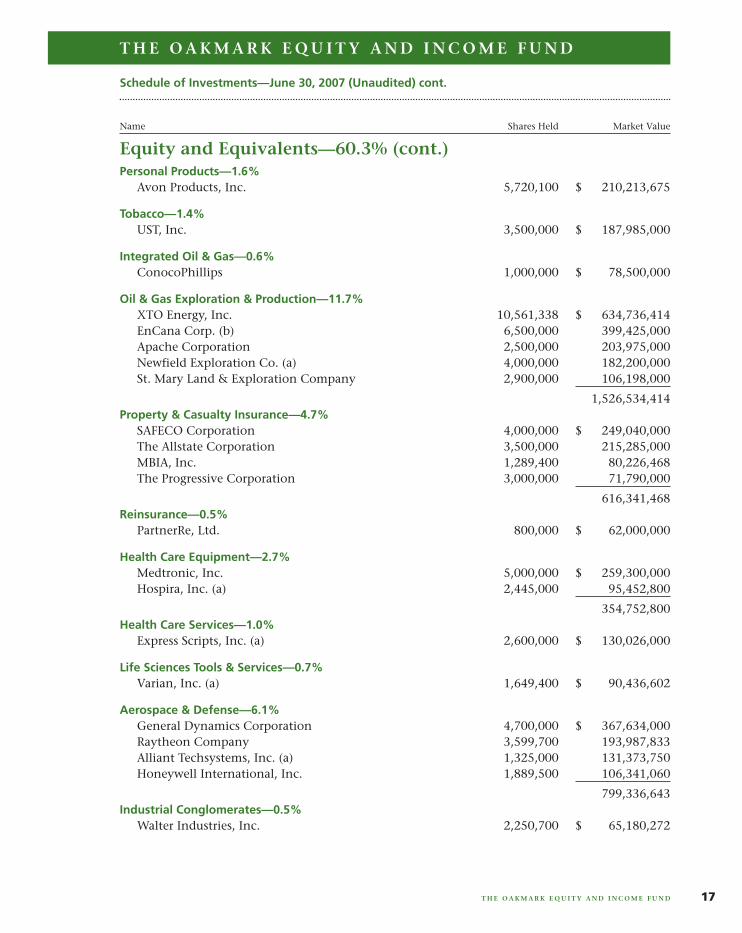
Personal Products—1.6%Avon Products, Inc. 5,720,100 $ 210,213,675
Tobacco—1.4%UST, Inc. 3,500,000 $ 187,985,000
Integrated Oil & Gas—0.6%ConocoPhillips 1,000,000 $ 78,500,000
Oil & Gas Exploration & Production—11.7%XTO Energy, Inc. 10,561,338 $ 634,736,414EnCana Corp. (b) 6,500,000 399,425,000Apache Corporation 2,500,000 203,975,000Newfield Exploration Co. (a) 4,000,000 182,200,000St. Mary Land & Exploration Company 2,900,000 106,198,000
1,526,534,414Property & Casualty Insurance—4.7%
SAFECO Corporation 4,000,000 $ 249,040,000The Allstate Corporation 3,500,000 215,285,000MBIA, Inc. 1,289,400 80,226,468The Progressive Corporation 3,000,000 71,790,000
616,341,468Reinsurance—0.5%
PartnerRe, Ltd. 800,000 $ 62,000,000
Health Care Equipment—2.7%Medtronic, Inc. 5,000,000 $ 259,300,000Hospira, Inc. (a) 2,445,000 95,452,800
354,752,800Health Care Services—1.0%
Express Scripts, Inc. (a) 2,600,000 $ 130,026,000
Life Sciences Tools & Services—0.7%Varian, Inc. (a) 1,649,400 $ 90,436,602
Aerospace & Defense—6.1%General Dynamics Corporation 4,700,000 $ 367,634,000Raytheon Company 3,599,700 193,987,833Alliant Techsystems, Inc. (a) 1,325,000 131,373,750Honeywell International, Inc. 1,889,500 106,341,060
799,336,643Industrial Conglomerates—0.5%
Walter Industries, Inc. 2,250,700 $ 65,180,272
Schedule of Investments—June 30, 2007 (Unaudited) cont.
Name Shares Held Market Value
T H E O A K M A R K E Q U I T Y A N D I N C O M E F U N D
T H E O A K M A R K E Q U I T Y A N D I N C O M E F U N D 17
Equity and Equivalents—60.3% (cont.)
Merrill Corp - Harris-Oakmark 3rd Quarterly Report [Funds] 07-31-2007 [AUX] | sgirard | 26-Jul-07 16:51 | 07-16988-2.ee | Sequence: 4CHKSUM Content: 22334 Layout: 38548 Graphics: No Graphics CLEAN
JOB: 07-16988-2 CYCLE#;BL#: 13; 0 TRIM: 7.75" x 9.75" AS: Merrill Chicago: 312-786-6300 COMPOSITECOLORS: Black, PANTONE 364 U, ~note-color 2, ~note-color 3 GRAPHICS: none V1.5
Industrial Machinery—2.4%Ingersoll-Rand Co., Class A 3,880,000 $ 212,701,600Mueller Water Products, Inc., Class B 6,719,153 100,787,295
313,488,895Application Software—0.3%
Mentor Graphics Corporation (a) 3,288,318 $ 43,307,148
Data Processing & Outsourced Services—0.3%Ceridian Corporation (a) 995,400 $ 34,839,000
Semiconductors—0.5%International Rectifier Corporation (a) 1,599,700 $ 59,604,822
Technology Distributors—0.8%CDW Corporation (a) 1,200,000 $ 101,964,000
Paper Products—0.0%Schweitzer-Mauduit International, Inc. 53,300 $ 1,652,300
Total Common Stocks (Cost: $5,504,840,811) 7,857,581,080
Total Equity And Equivalents (Cost: $5,504,840,811) 7,857,581,080
Fixed Income—36.2%
Corporate Bonds—0.1%Paper Packaging—0.1%
Sealed Air Corporation, 144A, 5.625% due 7/15/2013 (d) $ 20,000,000 $ 19,701,400
Total Corporate Bonds (Cost: $20,156,776) 19,701,400
Government and Agency Securities—36.1%Canadian Government Bonds—4.5%
Canada Government, 2.75% due 12/1/2007 CAD 250,000,000 $ 232,942,971Canada Government, 3.75% due 6/1/2008 CAD 250,000,000 232,856,137Canada Government, 4.25% due 12/1/2008 CAD 125,000,000 116,915,394
582,714,502France Government Bonds—0.4%
France Government, 3.00% due 7/25/2012,Inflation Indexed EUR 39,148,900 $ 54,444,785
U.S. Government Notes—31.2%United States Treasury Notes, 4.875% due 5/15/2009 750,000,000 $ 749,648,250United States Treasury Notes, 5.125% due 6/30/2011 500,000,000 503,789,000United States Treasury Notes, 5.125% due 6/30/2008 500,000,000 500,469,000
Schedule of Investments—June 30, 2007 (Unaudited) cont.
Shares Held/Name Par Value Market Value
T H E O A K M A R K E Q U I T Y A N D I N C O M E F U N D
T H E O A K M A R K E Q U I T Y A N D I N C O M E F U N D18
Equity and Equivalents—60.3% (cont.)
Merrill Corp - Harris-Oakmark 3rd Quarterly Report [Funds] 07-31-2007 [AUX] | sgirard | 26-Jul-07 16:51 | 07-16988-2.ee | Sequence: 5CHKSUM Content: 60173 Layout: 23726 Graphics: No Graphics CLEAN
JOB: 07-16988-2 CYCLE#;BL#: 13; 0 TRIM: 7.75" x 9.75" AS: Merrill Chicago: 312-786-6300 COMPOSITECOLORS: Black, PANTONE 364 U, ~note-color 2, ~note-color 3 GRAPHICS: none V1.5
U.S. Government Notes—31.2% (cont.)United States Treasury Notes, 4.875% due 2/15/2012 500,000,000 $ 499,375,000United States Treasury Notes, 4.875% due 1/31/2009 500,000,000 499,336,000United States Treasury Notes, 5.00% due 8/15/2011 250,000,000 251,093,750United States Treasury Notes, 4.875% due 8/15/2009 250,000,000 249,824,250United States Treasury Notes, 4.875% due 8/31/2008 250,000,000 249,609,500United States Treasury Notes, 4.75% due 12/31/2008 250,000,000 249,238,250United States Treasury Notes, 4.75% due 3/31/2011 250,000,000 248,613,250United States Treasury Notes, 3.625% due 1/15/2008,
Inflation Indexed 63,940,000 63,979,963
4,064,976,213
Total Government and Agency Securities (Cost: $4,670,355,049) 4,702,135,500
Total Fixed Income (Cost: $4,690,511,825) 4,721,836,900
Short Term Investments—4.8%
U.S. Government Agencies—1.6%Fannie Mae, 5.13% due 7/20/2007 $100,000,000 $ 99,729,250Federal Home Loan Mortgage Corporation, 5.165%
due 7/25/2007 100,000,000 99,655,669
Total U.S. Government Agencies (Cost: $199,384,919) 199,384,919
Repurchase Agreement—3.2%IBT Repurchase Agreement, 4.50% dated 6/29/2007
due 7/2/2007, repurchase price $418,990,770, collateralized by Federal National Mortgage Association Bonds, with rates of 4.155% - 5.920%, with maturities from 8/25/2032 - 5/25/2036, and with an aggregate market value plus accrued interest of $415,911,047, and by a Government National Mortgage Association Bond, with a rate of 6.000%, with a maturity of 7/20/2034, and with a market value plus accrued interest of $23,864,345 $418,833,707 $ 418,833,707
Total Repurchase Agreement (Cost: $418,833,707) 418,833,707
Total Short Term Investments (Cost: $618,218,626) 618,218,626
Total Investments (Cost $10,813,571,262)—101.3% $ 13,197,636,606Other Liabilities In Excess Of Other Assets—(1.3%) (163,157,317)
Total Net Assets—100% $13,034,479,289
Schedule of Investments—June 30, 2007 (Unaudited) cont.
Name Par Value Market Value
T H E O A K M A R K E Q U I T Y A N D I N C O M E F U N D
T H E O A K M A R K E Q U I T Y A N D I N C O M E F U N D 19
Fixed Income—36.2% (cont.)
Merrill Corp - Harris-Oakmark 3rd Quarterly Report [Funds] 07-31-2007 [AUX] | sgirard | 26-Jul-07 16:51 | 07-16988-2.ee | Sequence: 6CHKSUM Content: 49078 Layout: 38548 Graphics: No Graphics CLEAN
JOB: 07-16988-2 CYCLE#;BL#: 13; 0 TRIM: 7.75" x 9.75" AS: Merrill Chicago: 312-786-6300 COMPOSITECOLORS: Black, PANTONE 364 U, ~note-color 2, ~note-color 3 GRAPHICS: none V1.5

(a) Non-income producing security.(b) Represents a foreign domiciled corporation.(c) Represents an American Depository Receipt.(d) Security exempt from registration under Rule 144A of the Securities Act of 1933. These securities
may be resold in transactions exempt from registration, normally to qualified institutional buyers.
Key to abbreviations:CAD: Canadian DollarEUR: Euro Dollar
Schedule of Investments—June 30, 2007 (Unaudited) cont.
T H E O A K M A R K E Q U I T Y A N D I N C O M E F U N D
T H E O A K M A R K E Q U I T Y A N D I N C O M E F U N D20
Merrill Corp - Harris-Oakmark 3rd Quarterly Report [Funds] 07-31-2007 [AUX] | sgirard | 26-Jul-07 16:51 | 07-16988-2.ee | Sequence: 7CHKSUM Content: 13227 Layout: 23726 Graphics: No Graphics CLEAN
JOB: 07-16988-2 CYCLE#;BL#: 13; 0 TRIM: 7.75" x 9.75" AS: Merrill Chicago: 312-786-6300 COMPOSITECOLORS: Black, PANTONE 364 U, ~note-color 2, ~note-color 3 GRAPHICS: none V1.5
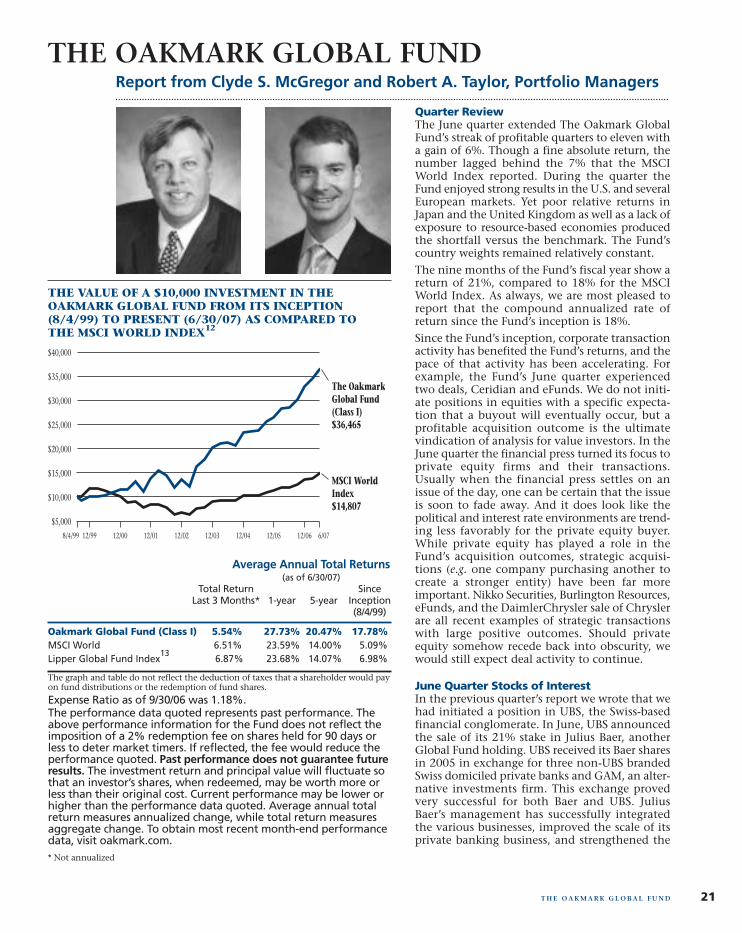
Quarter ReviewThe June quarter extended The Oakmark GlobalFund’s streak of profitable quarters to eleven witha gain of 6%. Though a fine absolute return, thenumber lagged behind the 7% that the MSCIWorld Index reported. During the quarter theFund enjoyed strong results in the U.S. and severalEuropean markets. Yet poor relative returns inJapan and the United Kingdom as well as a lack ofexposure to resource-based economies producedthe shortfall versus the benchmark. The Fund’scountry weights remained relatively constant.
The nine months of the Fund’s fiscal year show areturn of 21%, compared to 18% for the MSCIWorld Index. As always, we are most pleased toreport that the compound annualized rate ofreturn since the Fund’s inception is 18%.
Since the Fund’s inception, corporate transactionactivity has benefited the Fund’s returns, and thepace of that activity has been accelerating. Forexample, the Fund’s June quarter experiencedtwo deals, Ceridian and eFunds. We do not initi-ate positions in equities with a specific expecta-tion that a buyout will eventually occur, but aprofitable acquisition outcome is the ultimatevindication of analysis for value investors. In theJune quarter the financial press turned its focus toprivate equity firms and their transactions.Usually when the financial press settles on anissue of the day, one can be certain that the issueis soon to fade away. And it does look like thepolitical and interest rate environments are trend-ing less favorably for the private equity buyer.While private equity has played a role in theFund’s acquisition outcomes, strategic acquisi-tions (e.g. one company purchasing another tocreate a stronger entity) have been far moreimportant. Nikko Securities, Burlington Resources,eFunds, and the DaimlerChrysler sale of Chryslerare all recent examples of strategic transactionswith large positive outcomes. Should privateequity somehow recede back into obscurity, wewould still expect deal activity to continue.
June Quarter Stocks of InterestIn the previous quarter’s report we wrote that wehad initiated a position in UBS, the Swiss-basedfinancial conglomerate. In June, UBS announcedthe sale of its 21% stake in Julius Baer, anotherGlobal Fund holding. UBS received its Baer sharesin 2005 in exchange for three non-UBS brandedSwiss domiciled private banks and GAM, an alter-native investments firm. This exchange provedvery successful for both Baer and UBS. JuliusBaer’s management has successfully integratedthe various businesses, improved the scale of itsprivate banking business, and strengthened the
Report from Clyde S. McGregor and Robert A. Taylor, Portfolio Managers
THE OAKMARK GLOBAL FUND
THE VALUE OF A $10,000 INVESTMENT IN THEOAKMARK GLOBAL FUND FROM ITS INCEPTION(8/4/99) TO PRESENT (6/30/07) AS COMPARED TOTHE MSCI WORLD INDEX12
The OakmarkGlobal Fund(Class I)$36,465
MSCI WorldIndex$14,807
8/4/99 6/0712/0612/99 12/00 12/01 12/02 12/03 12/04 12/05
$5,000
$10,000
$15,000
$20,000
$25,000
$40,000
$35,000
$30,000
21
Average Annual Total Returns(as of 6/30/07)
Total Return SinceLast 3 Months* 1-year 5-year Inception
(8/4/99)
Oakmark Global Fund (Class I) 5.54% 27.73% 20.47% 17.78%MSCI World 6.51% 23.59% 14.00% 5.09%Lipper Global Fund Index
136.87% 23.68% 14.07% 6.98%
The graph and table do not reflect the deduction of taxes that a shareholder would payon fund distributions or the redemption of fund shares.
Expense Ratio as of 9/30/06 was 1.18%.The performance data quoted represents past performance. Theabove performance information for the Fund does not reflect theimposition of a 2% redemption fee on shares held for 90 days orless to deter market timers. If reflected, the fee would reduce theperformance quoted. Past performance does not guarantee futureresults. The investment return and principal value will fluctuate sothat an investor’s shares, when redeemed, may be worth more orless than their original cost. Current performance may be lower orhigher than the performance data quoted. Average annual totalreturn measures annualized change, while total return measuresaggregate change. To obtain most recent month-end performancedata, visit oakmark.com.* Not annualized
T H E O A K M A R K G L O B A L F U N D
Merrill Corp - Harris-Oakmark 3rd Quarterly Report [Funds] 07-31-2007 [AUX] | sgirard | 26-Jul-07 16:51 | 07-16988-2.ha | Sequence: 1CHKSUM Content: 46745 Layout: 5252 Graphics: 51161 CLEAN
JOB: 07-16988-2 CYCLE#;BL#: 13; 0 TRIM: 7.75" x 9.75" AS: Merrill Chicago: 312-786-6300 COMPOSITECOLORS: Black, PANTONE 541 U, ~note-color 2 GRAPHICS: 16988-2 Gbl line.eps, clyde_s_mcgregor_photo.eps, r_a_taylor_photo_d.eps V1.5
product offering for its clients. Julius Baer’s share pricenearly doubled over UBS’s holding period.
It would be easy to conclude that UBS’s decision to sell itsholdings in Baer must be a negative indication for Baer.We disagree with this conclusion. First, Julius Baer isrepurchasing almost 6% of the shares, signaling that man-agement feels that the company’s shares are still underval-ued. Second, UBS management is using the sale proceedsto repurchase their own shares, again evincing confidencein the UBS share valuation. We also draw comfort fromthe valuation UBS is obtaining on its Baer shares. If weapply the same multiples to UBS’s private banking andasset management operations, the resulting valuation onthe investment banking and Swiss retail banking busi-nesses is quite modest (less than book value).
GlaxoSmithKline (“GSK”), the large UK-based pharmaceu-tical company, suffered a significant setback in the quarterwhen the New England Journal of Medicine published astudy appearing to indicate increased circulatory systemrisk to patients using the company’s diabetes drug Avandia.While experts have found the study’s conclusions to becontroversial, the negative effect on the sales of Avandiahas been incontrovertible. We do not have the ability topredict the future for this drug, but we do believe that thedrop in GSK’s stock price fairly reflects the negative case.
As noted above, corporate restructuring and merger activ-ity again proved important to the Fund’s return. eFunds(yes, that is the company’s official name) auctioned itselfsuccessfully during the quarter, making the stock the mostimportant contributor to returns in this period. eFundshas been part of the portfolio since late 2001, and we willmiss it. The company has generally grown its businessvalue per share, but its stock price has been quite volatile,giving your Fund’s managers periodic opportunities toincrease the holding at desirable prices. Ceridian, the pay-roll processing and stored value card company, alsoannounced a sale agreement in the quarter, and we exitedthis holding. The Ceridian investment goes back to theearliest days of the Fund. While far from your manage-ment team’s finest hour, the Ceridian experience doesdemonstrate the value of purchasing at a good price. Busi-ness value growth per share at Ceridian came in well belowour expectations over the entire 7+ year holding period.[Remember Y2K? Ceridian may be the only company inwhich we invested actually to have suffered a Y2K problem.]Despite the fundamental disappointments, the stock endedup performing adequately, generating a double-digit com-pound rate of return from inception of the holding.
Other companies’ shares that contributed meaningfully tothe Fund’s results include Intel (U.S.), DaimlerChrysler(Germany), Adecco (Switzerland), Discovery Holding(U.S.), XTO Energy (U.S.), and SK Telecom (South Korea).Overall weakness in Japan’s stock market caused our hold-ings in two Japanese brokerage firms, Daiwa and NikkoSecurities, to lose ground in the period. News Corp. shares
retreated after the company announced its tender offerfor Dow Jones.
ActivityNew purchases balanced sales for the quarter, which keptthe Fund’s count of holdings flat at 51. As noted above, weeliminated the Ceridian position after the company’sacquisition announcement, and we also sold the holdingsof Brunswick (U.S.) and NTT Docomo (Japan) because wefound greater opportunities in new purchases of Apache(U.S.), MDS (Canada), and Omron (Japan). Apache is anoil and gas exploration company with a solid track recordof growth, returns, cost efficiency, and reserve replace-ment. Management has made many opportunistic acqui-sitions and has proven unusually adept at introducingnew development approaches on properties that itacquires. In natural gas, Apache’s five-year record for find-ing costs of $1.54/MCF ranks among the best in the indus-try, and the company has achieved this record whilegrowing rapidly. Apache has been particularly successfulin recent years in Egypt and Australia. The company isthe largest oil producer in Egypt and continues to growproduction there.
MDS is a life science company operating with three divi-sions. Its contract research organization provides clinicaltrials and other services primarily for generic pharmaceu-tical companies. The Nordion division supplies radioiso-topes for nuclear imaging and therapeutic procedures aswell as cobalt-60 (used for sterilization). The third divi-sion, Sciex, manufactures medical instruments, primarilymass spectrometers, which are used in pharmaceutical,academic, and government research laboratories.
Our third purchase was Omron, a Japanese manufacturerof factory automation products and systems. The end mar-kets for these products are industrial, electronic compo-nents, automotive, and healthcare. The most profitablebusiness, industrial automation, has been helped by strongcapital expenditures over the past few years. New applica-tions, such as the need for products to be traceable, shouldhelp to dampen a cyclical downturn. The managementteam fits our definition of quality given the capital alloca-tion decisions made over the past few years. Managementhas been actively divesting underperforming companiesand reducing costs. Furthermore, management has repur-chased almost 15% of the company’s outstanding shares.
We thank you for being our shareholders and welcomeyour suggestions and comments.
June 30, 2007
Robert A. Taylor, CFAPortfolio [email protected]
Clyde S. McGregor, CFAPortfolio [email protected]
22 T H E O A K M A R K G L O B A L F U N D
Merrill Corp - Harris-Oakmark 3rd Quarterly Report [Funds] 07-31-2007 [AUX] | sgirard | 26-Jul-07 16:51 | 07-16988-2.ha | Sequence: 2CHKSUM Content: 57917 Layout: 56074 Graphics: No Graphics CLEAN
JOB: 07-16988-2 CYCLE#;BL#: 13; 0 TRIM: 7.75" x 9.75" AS: Merrill Chicago: 312-786-6300 COMPOSITECOLORS: Black, PANTONE 541 U, ~note-color 2 GRAPHICS: none V1.5
23T H E O A K M A R K G L O B A L F U N D
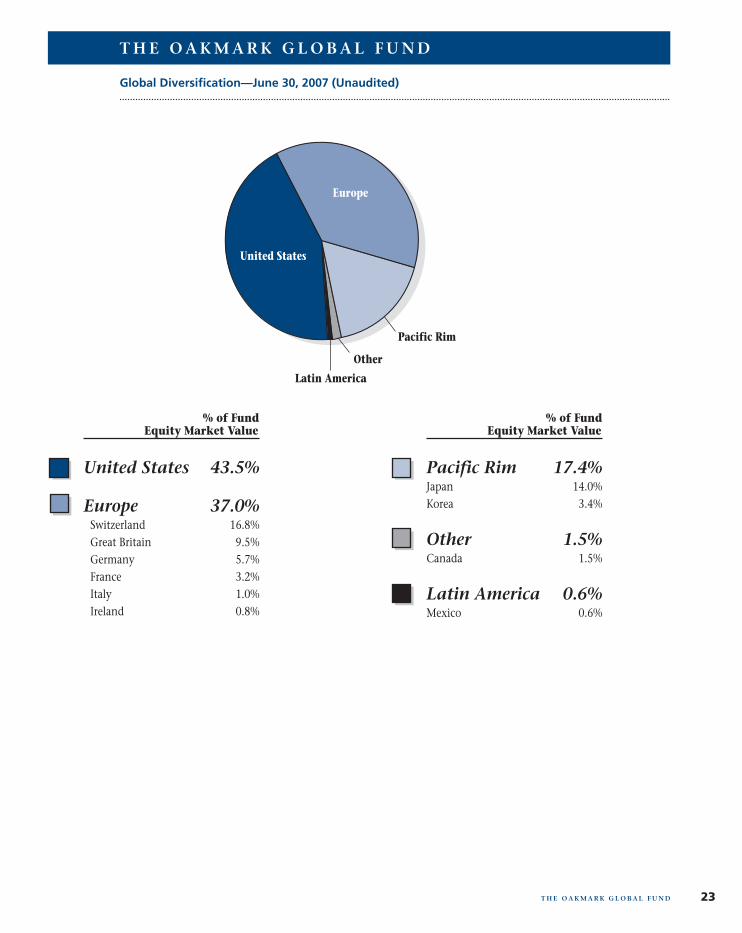
Global Diversification—June 30, 2007 (Unaudited)
Pacific Rim 17.4%Japan 14.0%Korea 3.4%
Other 1.5%Canada 1.5%
Latin America 0.6%Mexico 0.6%
United States 43.5%
Europe 37.0% Switzerland 16.8% Great Britain 9.5% Germany 5.7% France 3.2% Italy 1.0% Ireland 0.8%
Europe
United States
Pacific Rim
Other
Latin America
% of Fund Equity Market Value
% of Fund Equity Market Value
T H E O A K M A R K G L O B A L F U N D
Merrill Corp - Harris-Oakmark 3rd Quarterly Report [Funds] 07-31-2007 [AUX] | sgirard | 26-Jul-07 16:51 | 07-16988-2.ha | Sequence: 3CHKSUM Content: 36445 Layout: 13495 Graphics: 28797 CLEAN
JOB: 07-16988-2 CYCLE#;BL#: 13; 0 TRIM: 7.75" x 9.75" AS: Merrill Chicago: 312-786-6300 COMPOSITECOLORS: Black, PANTONE 541 U, ~note-color 2, ~note-color 3 GRAPHICS: 16988-2 Gbl pie.eps V1.5
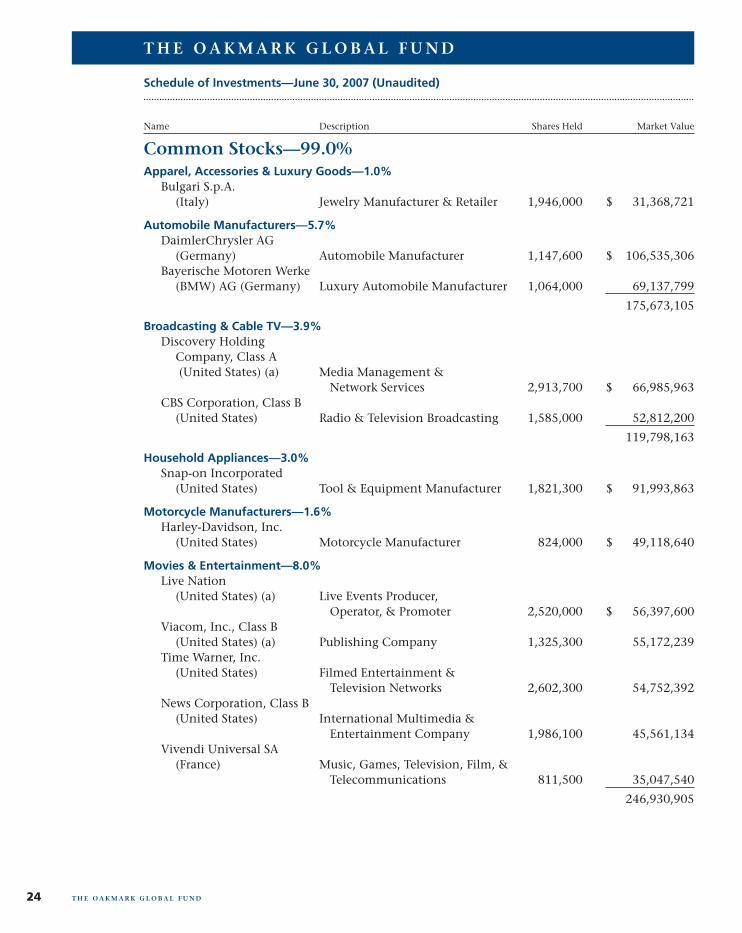
Common Stocks—99.0%
Schedule of Investments—June 30, 2007 (Unaudited)
Name Description Shares Held Market Value
T H E O A K M A R K G L O B A L F U N D
T H E O A K M A R K G L O B A L F U N D24
Apparel, Accessories & Luxury Goods—1.0%Bulgari S.p.A.
(Italy) Jewelry Manufacturer & Retailer 1,946,000 $ 31,368,721
Automobile Manufacturers—5.7%DaimlerChrysler AG
(Germany) Automobile Manufacturer 1,147,600 $ 106,535,306Bayerische Motoren Werke
(BMW) AG (Germany) Luxury Automobile Manufacturer 1,064,000 69,137,799
175,673,105
Broadcasting & Cable TV—3.9%Discovery Holding
Company, Class A(United States) (a) Media Management &
Network Services 2,913,700 $ 66,985,963CBS Corporation, Class B
(United States) Radio & Television Broadcasting 1,585,000 52,812,200
119,798,163
Household Appliances—3.0%Snap-on Incorporated
(United States) Tool & Equipment Manufacturer 1,821,300 $ 91,993,863
Motorcycle Manufacturers—1.6%Harley-Davidson, Inc.
(United States) Motorcycle Manufacturer 824,000 $ 49,118,640
Movies & Entertainment—8.0%Live Nation
(United States) (a) Live Events Producer, Operator, & Promoter 2,520,000 $ 56,397,600
Viacom, Inc., Class B (United States) (a) Publishing Company 1,325,300 55,172,239
Time Warner, Inc. (United States) Filmed Entertainment &
Television Networks 2,602,300 54,752,392News Corporation, Class B
(United States) International Multimedia & Entertainment Company 1,986,100 45,561,134
Vivendi Universal SA (France) Music, Games, Television, Film, &
Telecommunications 811,500 35,047,540
246,930,905
Merrill Corp - Harris-Oakmark 3rd Quarterly Report [Funds] 07-31-2007 [AUX] | sgirard | 26-Jul-07 16:51 | 07-16988-2.ha | Sequence: 4CHKSUM Content: 44973 Layout: 18237 Graphics: No Graphics CLEAN
JOB: 07-16988-2 CYCLE#;BL#: 13; 0 TRIM: 7.75" x 9.75" AS: Merrill Chicago: 312-786-6300 COMPOSITECOLORS: Black, PANTONE 541 U, ~note-color 2, ~note-color 3 GRAPHICS: none V1.5
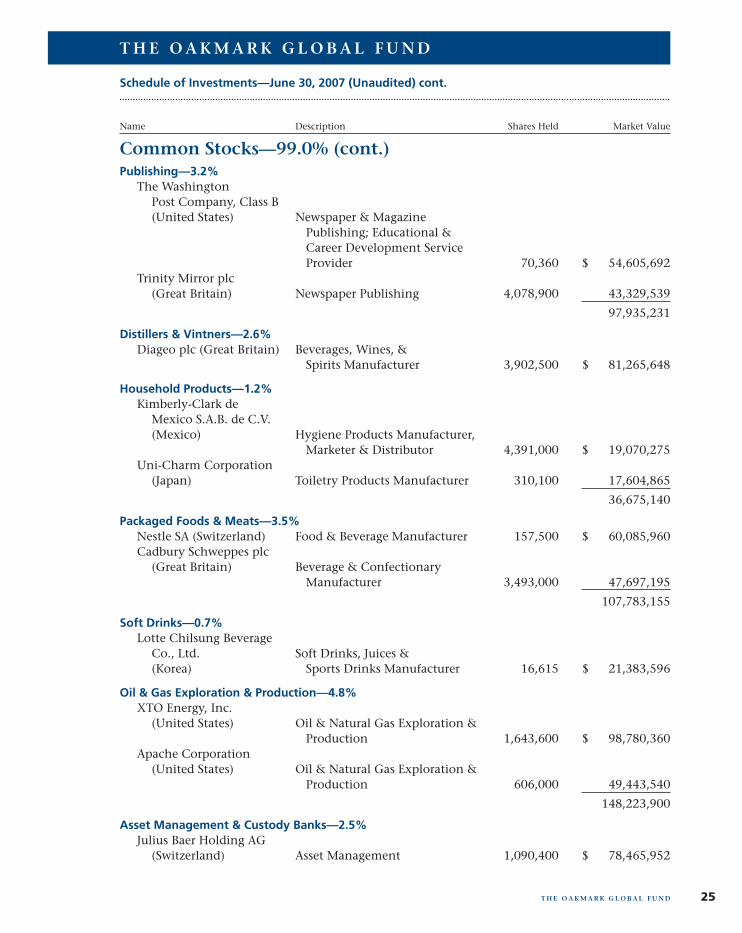
Common Stocks—99.0% (cont.)
Schedule of Investments—June 30, 2007 (Unaudited) cont.
Name Description Shares Held Market Value
T H E O A K M A R K G L O B A L F U N D
T H E O A K M A R K G L O B A L F U N D 25
Publishing—3.2%The Washington
Post Company, Class B (United States) Newspaper & Magazine
Publishing; Educational & Career Development Service Provider 70,360 $ 54,605,692
Trinity Mirror plc (Great Britain) Newspaper Publishing 4,078,900 43,329,539
97,935,231
Distillers & Vintners—2.6%Diageo plc (Great Britain) Beverages, Wines, &
Spirits Manufacturer 3,902,500 $ 81,265,648
Household Products—1.2%Kimberly-Clark de
Mexico S.A.B. de C.V. (Mexico) Hygiene Products Manufacturer,
Marketer & Distributor 4,391,000 $ 19,070,275Uni-Charm Corporation
(Japan) Toiletry Products Manufacturer 310,100 17,604,865
36,675,140
Packaged Foods & Meats—3.5%Nestle SA (Switzerland) Food & Beverage Manufacturer 157,500 $ 60,085,960Cadbury Schweppes plc
(Great Britain) Beverage & Confectionary Manufacturer 3,493,000 47,697,195
107,783,155
Soft Drinks—0.7%Lotte Chilsung Beverage
Co., Ltd. Soft Drinks, Juices & (Korea) Sports Drinks Manufacturer 16,615 $ 21,383,596
Oil & Gas Exploration & Production—4.8%XTO Energy, Inc.
(United States) Oil & Natural Gas Exploration & Production 1,643,600 $ 98,780,360
Apache Corporation (United States) Oil & Natural Gas Exploration &
Production 606,000 49,443,540
148,223,900
Asset Management & Custody Banks—2.5%Julius Baer Holding AG
(Switzerland) Asset Management 1,090,400 $ 78,465,952
Merrill Corp - Harris-Oakmark 3rd Quarterly Report [Funds] 07-31-2007 [AUX] | sgirard | 26-Jul-07 16:51 | 07-16988-2.ha | Sequence: 5CHKSUM Content: 14224 Layout: 35917 Graphics: No Graphics CLEAN
JOB: 07-16988-2 CYCLE#;BL#: 13; 0 TRIM: 7.75" x 9.75" AS: Merrill Chicago: 312-786-6300 COMPOSITECOLORS: Black, PANTONE 541 U, ~note-color 2, ~note-color 3 GRAPHICS: none V1.5
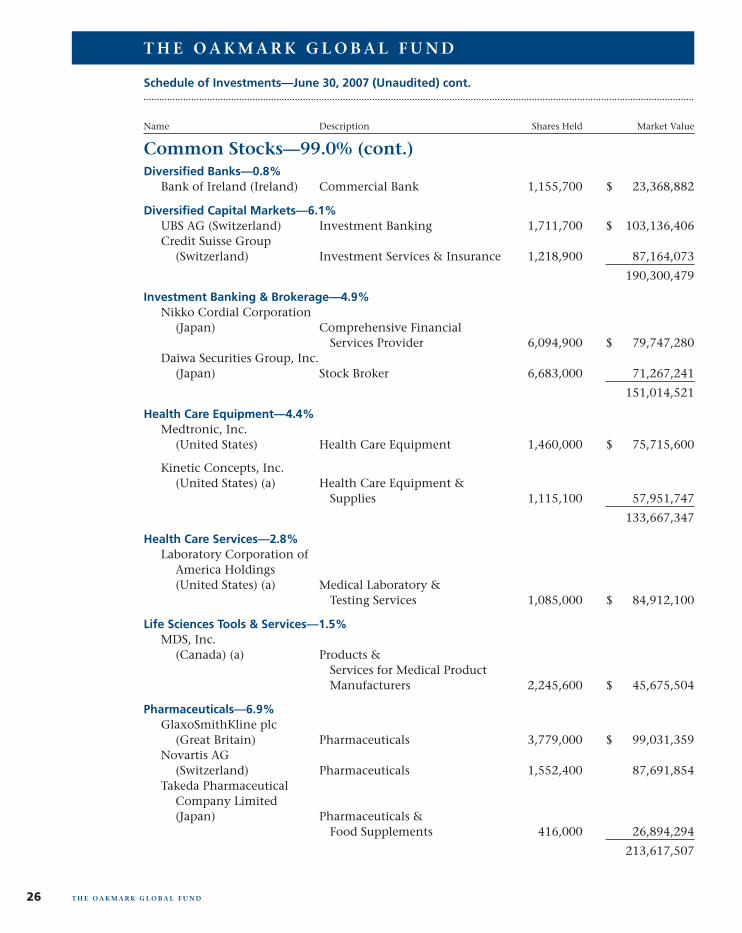
Common Stocks—99.0% (cont.)
Schedule of Investments—June 30, 2007 (Unaudited) cont.
Name Description Shares Held Market Value
T H E O A K M A R K G L O B A L F U N D
T H E O A K M A R K G L O B A L F U N D26
Diversified Banks—0.8%Bank of Ireland (Ireland) Commercial Bank 1,155,700 $ 23,368,882
Diversified Capital Markets—6.1%UBS AG (Switzerland) Investment Banking 1,711,700 $ 103,136,406Credit Suisse Group
(Switzerland) Investment Services & Insurance 1,218,900 87,164,073
190,300,479
Investment Banking & Brokerage—4.9%Nikko Cordial Corporation
(Japan) Comprehensive Financial Services Provider 6,094,900 $ 79,747,280
Daiwa Securities Group, Inc. (Japan) Stock Broker 6,683,000 71,267,241
151,014,521
Health Care Equipment—4.4%Medtronic, Inc.
(United States) Health Care Equipment 1,460,000 $ 75,715,600
Kinetic Concepts, Inc. (United States) (a) Health Care Equipment &
Supplies 1,115,100 57,951,747
133,667,347
Health Care Services—2.8%Laboratory Corporation of
America Holdings (United States) (a) Medical Laboratory &
Testing Services 1,085,000 $ 84,912,100
Life Sciences Tools & Services—1.5%MDS, Inc.
(Canada) (a) Products & Services for Medical Product Manufacturers 2,245,600 $ 45,675,504
Pharmaceuticals—6.9%GlaxoSmithKline plc
(Great Britain) Pharmaceuticals 3,779,000 $ 99,031,359Novartis AG
(Switzerland) Pharmaceuticals 1,552,400 87,691,854Takeda Pharmaceutical
Company Limited (Japan) Pharmaceuticals &
Food Supplements 416,000 26,894,294
213,617,507
Merrill Corp - Harris-Oakmark 3rd Quarterly Report [Funds] 07-31-2007 [AUX] | sgirard | 26-Jul-07 16:51 | 07-16988-2.ha | Sequence: 6CHKSUM Content: 45742 Layout: 18237 Graphics: No Graphics CLEAN
JOB: 07-16988-2 CYCLE#;BL#: 13; 0 TRIM: 7.75" x 9.75" AS: Merrill Chicago: 312-786-6300 COMPOSITECOLORS: Black, PANTONE 541 U, ~note-color 2, ~note-color 3 GRAPHICS: none V1.5
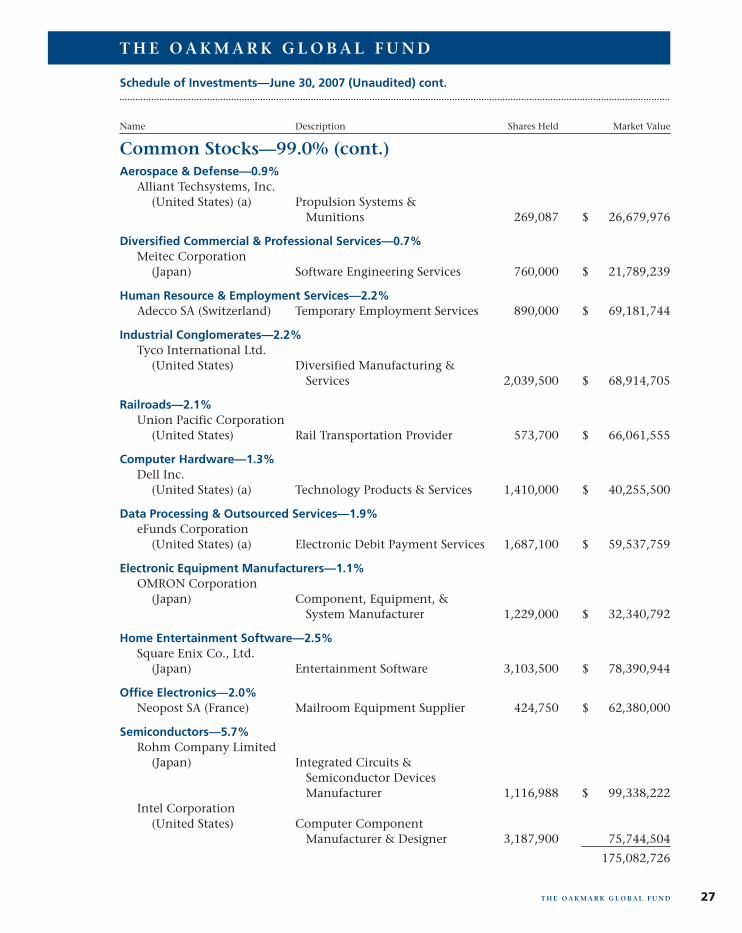
Common Stocks—99.0% (cont.)
Schedule of Investments—June 30, 2007 (Unaudited) cont.
Name Description Shares Held Market Value
T H E O A K M A R K G L O B A L F U N D
T H E O A K M A R K G L O B A L F U N D 27
Aerospace & Defense—0.9%Alliant Techsystems, Inc.
(United States) (a) Propulsion Systems & Munitions 269,087 $ 26,679,976
Diversified Commercial & Professional Services—0.7%Meitec Corporation
(Japan) Software Engineering Services 760,000 $ 21,789,239
Human Resource & Employment Services—2.2%Adecco SA (Switzerland) Temporary Employment Services 890,000 $ 69,181,744
Industrial Conglomerates—2.2%Tyco International Ltd.
(United States) Diversified Manufacturing & Services 2,039,500 $ 68,914,705
Railroads—2.1%Union Pacific Corporation
(United States) Rail Transportation Provider 573,700 $ 66,061,555
Computer Hardware—1.3%Dell Inc.
(United States) (a) Technology Products & Services 1,410,000 $ 40,255,500
Data Processing & Outsourced Services—1.9%eFunds Corporation
(United States) (a) Electronic Debit Payment Services 1,687,100 $ 59,537,759
Electronic Equipment Manufacturers—1.1%OMRON Corporation
(Japan) Component, Equipment, & System Manufacturer 1,229,000 $ 32,340,792
Home Entertainment Software—2.5%Square Enix Co., Ltd.
(Japan) Entertainment Software 3,103,500 $ 78,390,944
Office Electronics—2.0%Neopost SA (France) Mailroom Equipment Supplier 424,750 $ 62,380,000
Semiconductors—5.7%Rohm Company Limited
(Japan) Integrated Circuits & Semiconductor Devices Manufacturer 1,116,988 $ 99,338,222
Intel Corporation (United States) Computer Component
Manufacturer & Designer 3,187,900 75,744,504
175,082,726
Merrill Corp - Harris-Oakmark 3rd Quarterly Report [Funds] 07-31-2007 [AUX] | sgirard | 26-Jul-07 16:51 | 07-16988-2.ha | Sequence: 7CHKSUM Content: 14244 Layout: 35917 Graphics: No Graphics CLEAN
JOB: 07-16988-2 CYCLE#;BL#: 13; 0 TRIM: 7.75" x 9.75" AS: Merrill Chicago: 312-786-6300 COMPOSITECOLORS: Black, PANTONE 541 U, ~note-color 2, ~note-color 3 GRAPHICS: none V1.5
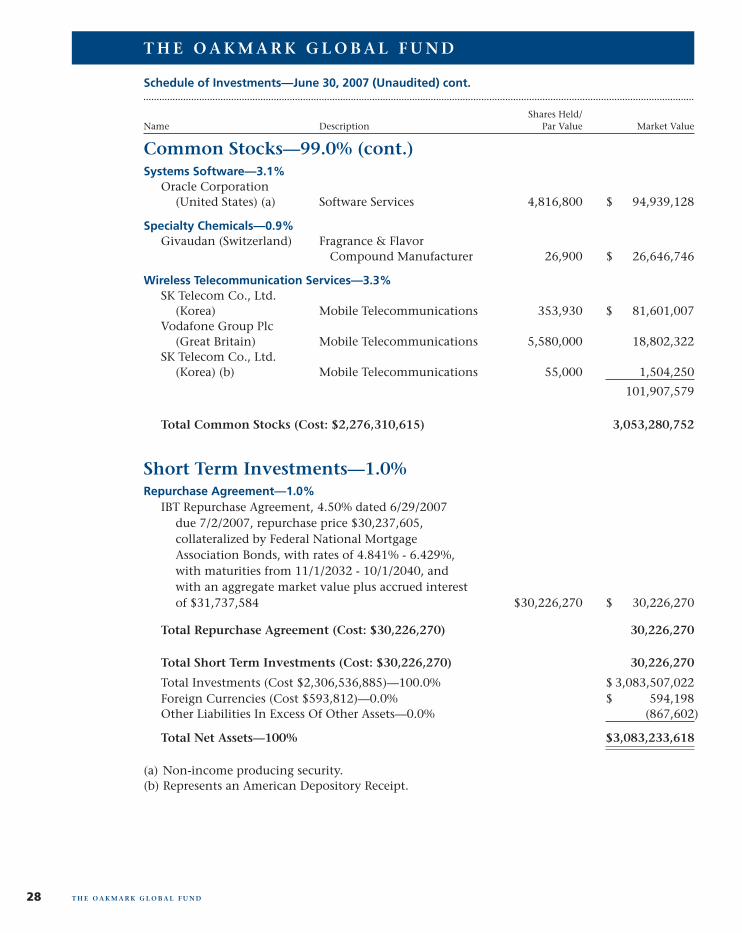
Common Stocks—99.0% (cont.)
Schedule of Investments—June 30, 2007 (Unaudited) cont.
Shares Held/Name Description Par Value Market Value
T H E O A K M A R K G L O B A L F U N D
T H E O A K M A R K G L O B A L F U N D28
Systems Software—3.1%Oracle Corporation
(United States) (a) Software Services 4,816,800 $ 94,939,128
Specialty Chemicals—0.9%Givaudan (Switzerland) Fragrance & Flavor
Compound Manufacturer 26,900 $ 26,646,746
Wireless Telecommunication Services—3.3%SK Telecom Co., Ltd.
(Korea) Mobile Telecommunications 353,930 $ 81,601,007Vodafone Group Plc
(Great Britain) Mobile Telecommunications 5,580,000 18,802,322SK Telecom Co., Ltd.
(Korea) (b) Mobile Telecommunications 55,000 1,504,250
101,907,579
Total Common Stocks (Cost: $2,276,310,615) 3,053,280,752
Short Term Investments—1.0%Repurchase Agreement—1.0%
IBT Repurchase Agreement, 4.50% dated 6/29/2007 due 7/2/2007, repurchase price $30,237,605, collateralized by Federal National Mortgage Association Bonds, with rates of 4.841% - 6.429%, with maturities from 11/1/2032 - 10/1/2040, and with an aggregate market value plus accrued interest of $31,737,584 $30,226,270 $ 30,226,270
Total Repurchase Agreement (Cost: $30,226,270) 30,226,270
Total Short Term Investments (Cost: $30,226,270) 30,226,270
Total Investments (Cost $2,306,536,885)—100.0% $ 3,083,507,022Foreign Currencies (Cost $593,812)—0.0% $ 594,198Other Liabilities In Excess Of Other Assets—0.0% (867,602)
Total Net Assets—100% $3,083,233,618
(a) Non-income producing security.(b) Represents an American Depository Receipt.
Merrill Corp - Harris-Oakmark 3rd Quarterly Report [Funds] 07-31-2007 [AUX] | sgirard | 26-Jul-07 16:51 | 07-16988-2.ha | Sequence: 8CHKSUM Content: 62973 Layout: 18107 Graphics: No Graphics CLEAN
JOB: 07-16988-2 CYCLE#;BL#: 13; 0 TRIM: 7.75" x 9.75" AS: Merrill Chicago: 312-786-6300 COMPOSITECOLORS: Black, PANTONE 541 U, ~note-color 2, ~note-color 3 GRAPHICS: none V1.5
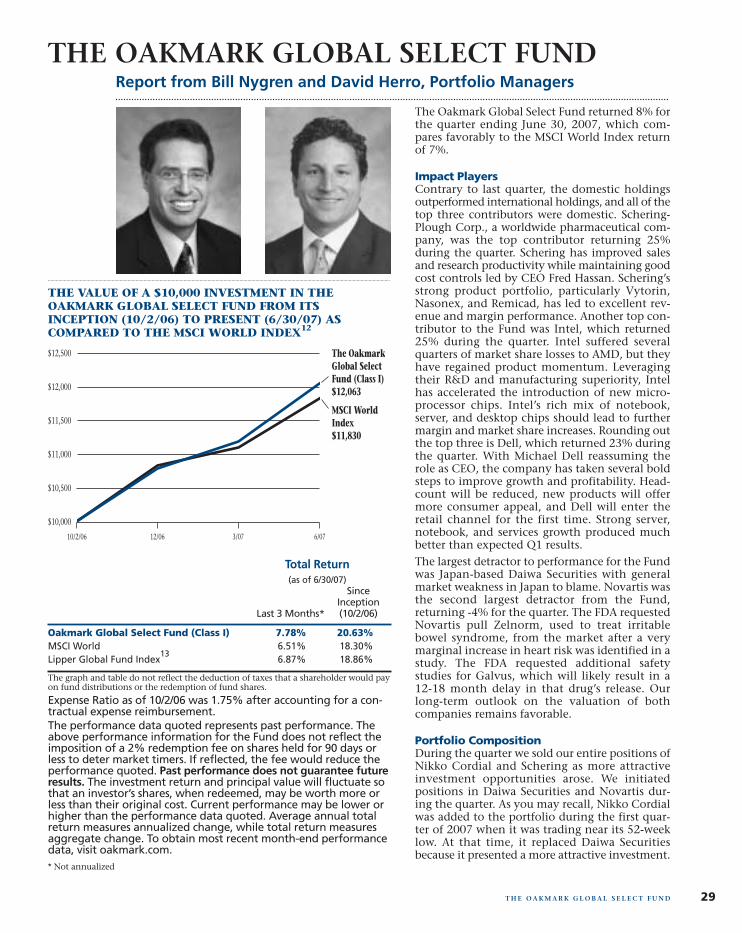
The Oakmark Global Select Fund returned 8% forthe quarter ending June 30, 2007, which com-pares favorably to the MSCI World Index returnof 7%.
Impact PlayersContrary to last quarter, the domestic holdingsoutperformed international holdings, and all of thetop three contributors were domestic. Schering-Plough Corp., a worldwide pharmaceutical com-pany, was the top contributor returning 25%during the quarter. Schering has improved salesand research productivity while maintaining goodcost controls led by CEO Fred Hassan. Schering’sstrong product portfolio, particularly Vytorin,Nasonex, and Remicad, has led to excellent rev-enue and margin performance. Another top con-tributor to the Fund was Intel, which returned25% during the quarter. Intel suffered severalquarters of market share losses to AMD, but theyhave regained product momentum. Leveragingtheir R&D and manufacturing superiority, Intelhas accelerated the introduction of new micro-processor chips. Intel’s rich mix of notebook,server, and desktop chips should lead to furthermargin and market share increases. Rounding outthe top three is Dell, which returned 23% duringthe quarter. With Michael Dell reassuming therole as CEO, the company has taken several boldsteps to improve growth and profitability. Head-count will be reduced, new products will offermore consumer appeal, and Dell will enter theretail channel for the first time. Strong server,notebook, and services growth produced muchbetter than expected Q1 results.The largest detractor to performance for the Fundwas Japan-based Daiwa Securities with generalmarket weakness in Japan to blame. Novartis wasthe second largest detractor from the Fund,returning -4% for the quarter. The FDA requestedNovartis pull Zelnorm, used to treat irritablebowel syndrome, from the market after a verymarginal increase in heart risk was identified in astudy. The FDA requested additional safetystudies for Galvus, which will likely result in a12-18 month delay in that drug’s release. Ourlong-term outlook on the valuation of bothcompanies remains favorable.
Portfolio CompositionDuring the quarter we sold our entire positions ofNikko Cordial and Schering as more attractiveinvestment opportunities arose. We initiatedpositions in Daiwa Securities and Novartis dur-ing the quarter. As you may recall, Nikko Cordialwas added to the portfolio during the first quar-ter of 2007 when it was trading near its 52-weeklow. At that time, it replaced Daiwa Securitiesbecause it presented a more attractive investment.
Report from Bill Nygren and David Herro, Portfolio Managers
THE OAKMARK GLOBAL SELECT FUND
THE VALUE OF A $10,000 INVESTMENT IN THEOAKMARK GLOBAL SELECT FUND FROM ITSINCEPTION (10/2/06) TO PRESENT (6/30/07) ASCOMPARED TO THE MSCI WORLD INDEX12
Total Return(as of 6/30/07)
SinceInception
Last 3 Months* (10/2/06)
Oakmark Global Select Fund (Class I) 7.78% 20.63%MSCI World 6.51% 18.30%Lipper Global Fund Index
136.87% 18.86%
The graph and table do not reflect the deduction of taxes that a shareholder would payon fund distributions or the redemption of fund shares.
Expense Ratio as of 10/2/06 was 1.75% after accounting for a con-tractual expense reimbursement.The performance data quoted represents past performance. Theabove performance information for the Fund does not reflect theimposition of a 2% redemption fee on shares held for 90 days orless to deter market timers. If reflected, the fee would reduce theperformance quoted. Past performance does not guarantee futureresults. The investment return and principal value will fluctuate sothat an investor’s shares, when redeemed, may be worth more orless than their original cost. Current performance may be lower orhigher than the performance data quoted. Average annual totalreturn measures annualized change, while total return measuresaggregate change. To obtain most recent month-end performancedata, visit oakmark.com.* Not annualized
29T H E O A K M A R K G L O B A L S E L E C T F U N D
The OakmarkGlobal SelectFund (Class I)$12,063
MSCI WorldIndex$11,830
10/2/06 6/0712/06 3/07
$10,000
$12,500
$10,500
$11,000
$11,500
$12,000
Merrill Corp - Harris-Oakmark 3rd Quarterly Report [Funds] 07-31-2007 [AUX] | sgirard | 26-Jul-07 16:52 | 07-16988-2.hc | Sequence: 1CHKSUM Content: 56685 Layout: 35025 Graphics: 21984 CLEAN
JOB: 07-16988-2 CYCLE#;BL#: 13; 0 TRIM: 7.75" x 9.75" AS: Merrill Chicago: 312-786-6300 COMPOSITECOLORS: Black, PANTONE 541 U, ~note-color 2, ~note-color 3 GRAPHICS: 16988-2 Gbl Sel line.eps, David G Herro new photo.eps, w_c_nygren_photo_c.eps V1.5
Since then, Nikko’s stock price has risen, reflecting Citi-
group’s bid to acquire a majority shareholding. Due to the
price increase, the holding was sold from the portfolio as
Daiwa again represented a more attractive investment.
As long-term value investors, we continue to focus on
finding attractive, under-valued companies trading at
discounts with management teams focused on buildingshareholder value.
June 30, 2007
David G. Herro, CFAPortfolio [email protected]
William C. Nygren, CFAPortfolio [email protected]
30 T H E O A K M A R K G L O B A L S E L E C T F U N D
Merrill Corp - Harris-Oakmark 3rd Quarterly Report [Funds] 07-31-2007 [AUX] | sgirard | 26-Jul-07 16:52 | 07-16988-2.hc | Sequence: 2CHKSUM Content: 43908 Layout: 30013 Graphics: No Graphics CLEAN
JOB: 07-16988-2 CYCLE#;BL#: 13; 0 TRIM: 7.75" x 9.75" AS: Merrill Chicago: 312-786-6300 COMPOSITECOLORS: Black, PANTONE 541 U, ~note-color 2 GRAPHICS: none V1.5
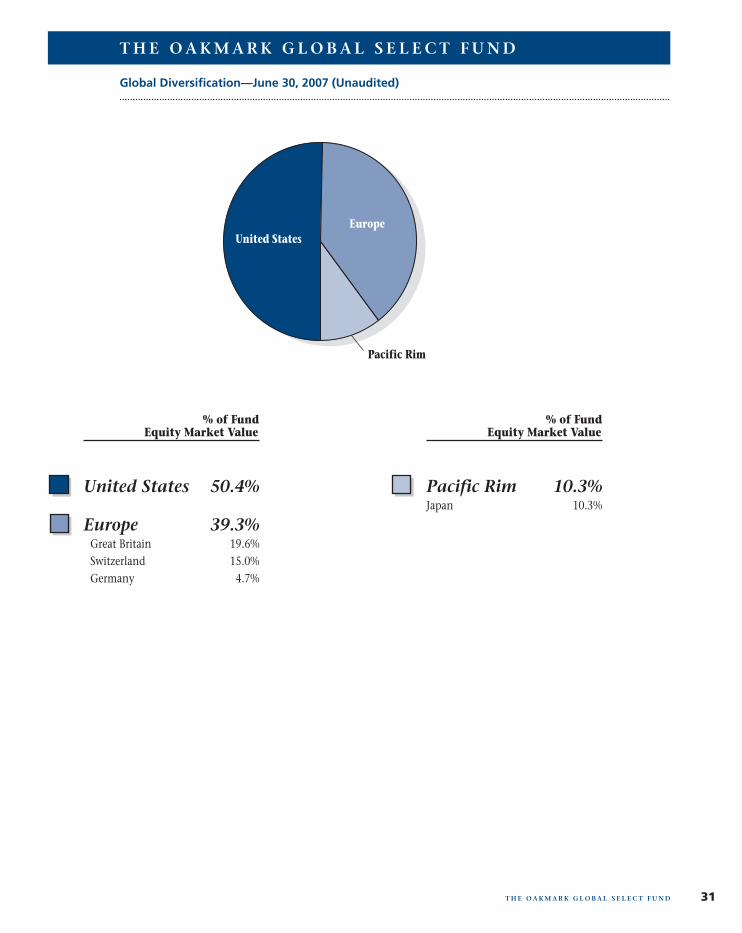
31T H E O A K M A R K G L O B A L S E L E C T F U N D
Global Diversification—June 30, 2007 (Unaudited)
Pacific Rim 10.3%Japan 10.3%
United States 50.4%
Europe 39.3% Great Britain 19.6% Switzerland 15.0% Germany 4.7%
Pacific Rim
% of Fund Equity Market Value
% of Fund Equity Market Value
United StatesEurope
T H E O A K M A R K G L O B A L S E L E C T F U N D
Merrill Corp - Harris-Oakmark 3rd Quarterly Report [Funds] 07-31-2007 [AUX] | sgirard | 26-Jul-07 16:52 | 07-16988-2.hc | Sequence: 3CHKSUM Content: 33398 Layout: 13495 Graphics: 30544 CLEAN
JOB: 07-16988-2 CYCLE#;BL#: 13; 0 TRIM: 7.75" x 9.75" AS: Merrill Chicago: 312-786-6300 COMPOSITECOLORS: Black, PANTONE 541 U, ~note-color 2, ~note-color 3 GRAPHICS: 16988-2 Gbl Sel pie.eps V1.5
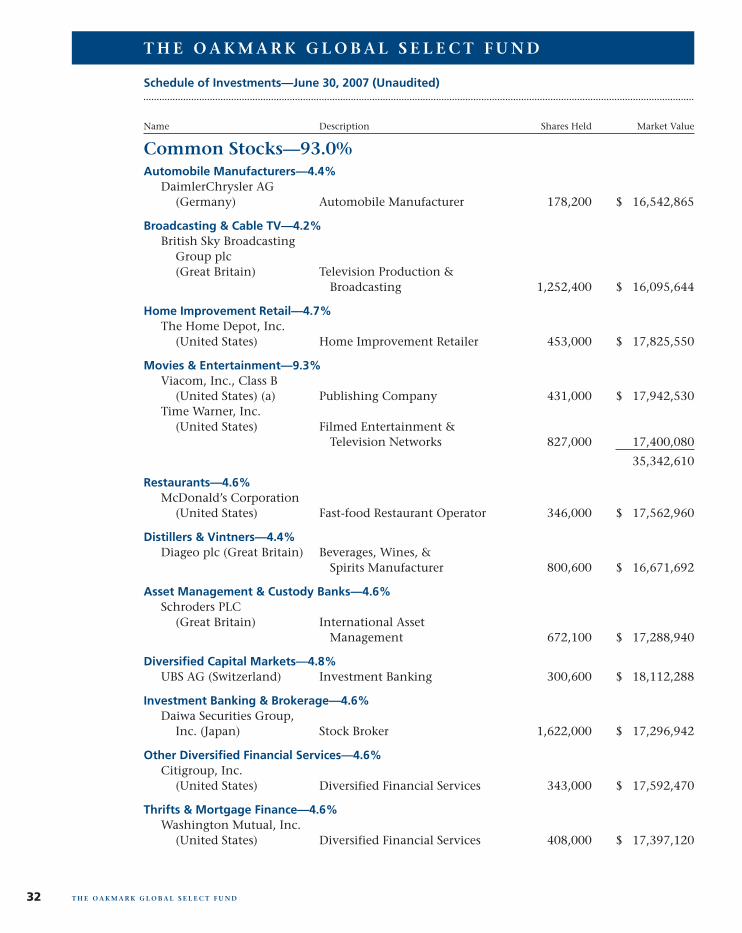
Common Stocks—93.0%
Schedule of Investments—June 30, 2007 (Unaudited)
Name Description Shares Held Market Value
T H E O A K M A R K G L O B A L S E L E C T F U N D
T H E O A K M A R K G L O B A L S E L E C T F U N D32
Automobile Manufacturers—4.4%DaimlerChrysler AG
(Germany) Automobile Manufacturer 178,200 $ 16,542,865
Broadcasting & Cable TV—4.2%British Sky Broadcasting
Group plc (Great Britain) Television Production &
Broadcasting 1,252,400 $ 16,095,644
Home Improvement Retail—4.7%The Home Depot, Inc.
(United States) Home Improvement Retailer 453,000 $ 17,825,550
Movies & Entertainment—9.3%Viacom, Inc., Class B
(United States) (a) Publishing Company 431,000 $ 17,942,530Time Warner, Inc.
(United States) Filmed Entertainment &Television Networks 827,000 17,400,080
35,342,610
Restaurants—4.6%McDonald’s Corporation
(United States) Fast-food Restaurant Operator 346,000 $ 17,562,960
Distillers & Vintners—4.4%Diageo plc (Great Britain) Beverages, Wines, &
Spirits Manufacturer 800,600 $ 16,671,692
Asset Management & Custody Banks—4.6%Schroders PLC
(Great Britain) International AssetManagement 672,100 $ 17,288,940
Diversified Capital Markets—4.8%UBS AG (Switzerland) Investment Banking 300,600 $ 18,112,288
Investment Banking & Brokerage—4.6%Daiwa Securities Group,
Inc. (Japan) Stock Broker 1,622,000 $ 17,296,942
Other Diversified Financial Services—4.6%Citigroup, Inc.
(United States) Diversified Financial Services 343,000 $ 17,592,470
Thrifts & Mortgage Finance—4.6%Washington Mutual, Inc.
(United States) Diversified Financial Services 408,000 $ 17,397,120
Merrill Corp - Harris-Oakmark 3rd Quarterly Report [Funds] 07-31-2007 [AUX] | sgirard | 26-Jul-07 16:52 | 07-16988-2.hc | Sequence: 4CHKSUM Content: 22063 Layout: 18237 Graphics: No Graphics CLEAN
JOB: 07-16988-2 CYCLE#;BL#: 13; 0 TRIM: 7.75" x 9.75" AS: Merrill Chicago: 312-786-6300 COMPOSITECOLORS: Black, PANTONE 541 U, ~note-color 2, ~note-color 3 GRAPHICS: none V1.5
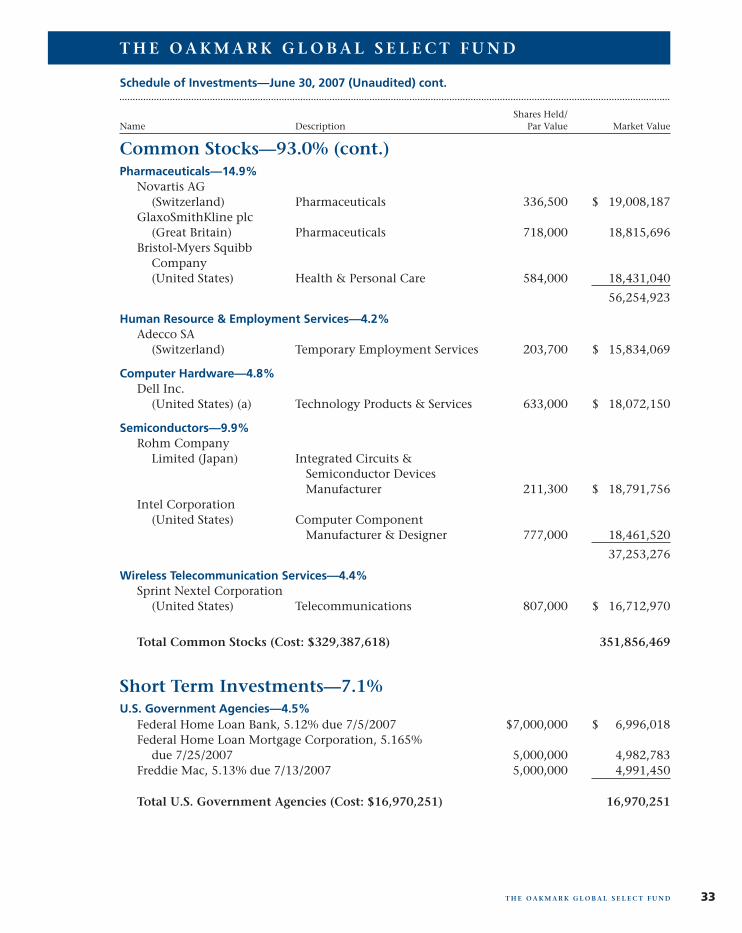
Common Stocks—93.0% (cont.)
Schedule of Investments—June 30, 2007 (Unaudited) cont.
Shares Held/Name Description Par Value Market Value
T H E O A K M A R K G L O B A L S E L E C T F U N D
T H E O A K M A R K G L O B A L S E L E C T F U N D 33
Pharmaceuticals—14.9%Novartis AG
(Switzerland) Pharmaceuticals 336,500 $ 19,008,187GlaxoSmithKline plc
(Great Britain) Pharmaceuticals 718,000 18,815,696Bristol-Myers Squibb
Company(United States) Health & Personal Care 584,000 18,431,040
56,254,923
Human Resource & Employment Services—4.2%Adecco SA
(Switzerland) Temporary Employment Services 203,700 $ 15,834,069
Computer Hardware—4.8%Dell Inc.
(United States) (a) Technology Products & Services 633,000 $ 18,072,150
Semiconductors—9.9%Rohm Company
Limited (Japan) Integrated Circuits &Semiconductor DevicesManufacturer 211,300 $ 18,791,756
Intel Corporation(United States) Computer Component
Manufacturer & Designer 777,000 18,461,520
37,253,276
Wireless Telecommunication Services—4.4%Sprint Nextel Corporation
(United States) Telecommunications 807,000 $ 16,712,970
Total Common Stocks (Cost: $329,387,618) 351,856,469
Short Term Investments—7.1%U.S. Government Agencies—4.5%
Federal Home Loan Bank, 5.12% due 7/5/2007 $7,000,000 $ 6,996,018Federal Home Loan Mortgage Corporation, 5.165%
due 7/25/2007 5,000,000 4,982,783Freddie Mac, 5.13% due 7/13/2007 5,000,000 4,991,450
Total U.S. Government Agencies (Cost: $16,970,251) 16,970,251
Merrill Corp - Harris-Oakmark 3rd Quarterly Report [Funds] 07-31-2007 [AUX] | sgirard | 26-Jul-07 16:52 | 07-16988-2.hc | Sequence: 5CHKSUM Content: 28598 Layout: 33001 Graphics: No Graphics CLEAN
JOB: 07-16988-2 CYCLE#;BL#: 13; 0 TRIM: 7.75" x 9.75" AS: Merrill Chicago: 312-786-6300 COMPOSITECOLORS: Black, PANTONE 541 U, ~note-color 2, ~note-color 3 GRAPHICS: none V1.5
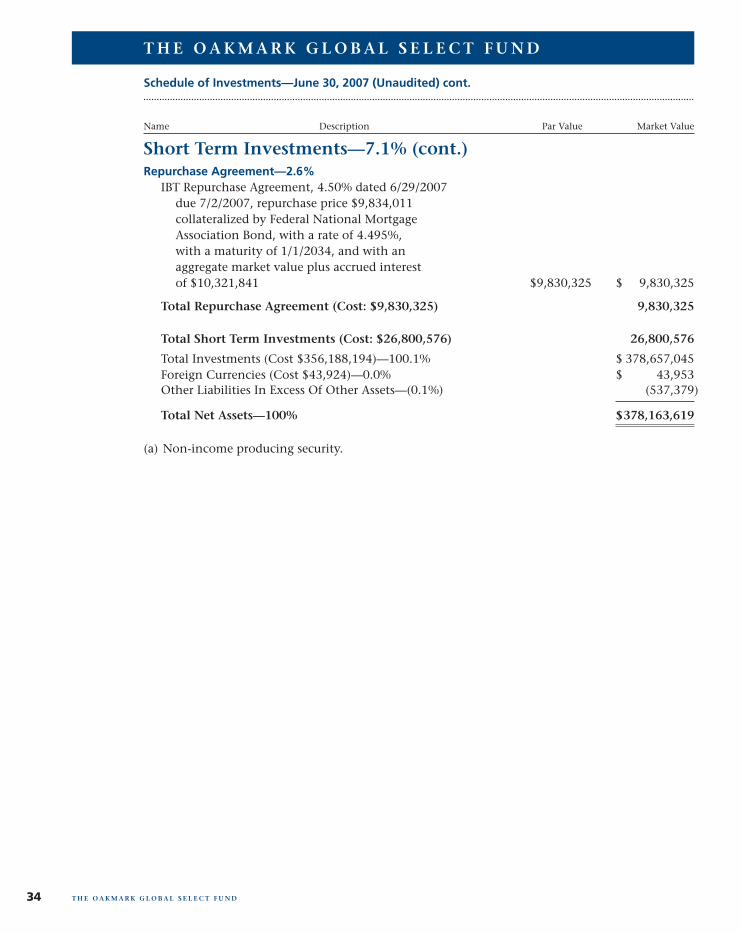
Short Term Investments—7.1% (cont.)
Schedule of Investments—June 30, 2007 (Unaudited) cont.
Name Description Par Value Market Value
T H E O A K M A R K G L O B A L S E L E C T F U N D
T H E O A K M A R K G L O B A L S E L E C T F U N D34
Repurchase Agreement—2.6%IBT Repurchase Agreement, 4.50% dated 6/29/2007
due 7/2/2007, repurchase price $9,834,011collateralized by Federal National MortgageAssociation Bond, with a rate of 4.495%,with a maturity of 1/1/2034, and with anaggregate market value plus accrued interestof $10,321,841 $9,830,325 $ 9,830,325
Total Repurchase Agreement (Cost: $9,830,325) 9,830,325
Total Short Term Investments (Cost: $26,800,576) 26,800,576
Total Investments (Cost $356,188,194)—100.1% $ 378,657,045Foreign Currencies (Cost $43,924)—0.0% $ 43,953Other Liabilities In Excess Of Other Assets—(0.1%) (537,379)
Total Net Assets—100% $378,163,619
(a) Non-income producing security.
Merrill Corp - Harris-Oakmark 3rd Quarterly Report [Funds] 07-31-2007 [AUX] | sgirard | 26-Jul-07 16:52 | 07-16988-2.hc | Sequence: 6CHKSUM Content: 15384 Layout: 18107 Graphics: No Graphics CLEAN
JOB: 07-16988-2 CYCLE#;BL#: 13; 0 TRIM: 7.75" x 9.75" AS: Merrill Chicago: 312-786-6300 COMPOSITECOLORS: Black, PANTONE 541 U, ~note-color 2, ~note-color 3 GRAPHICS: none V1.5
Fellow Shareholders,Both of our InternationalFunds, Oakmark InternationalFund and Oakmark Interna-tional Small Cap Fund gener-ated acceptable absolute returnsfor the quarter. Though we aredisappointed with the relativeshort-term performance of bothFunds, we believe that it is moreimportant to focus on theportfolios’ quality, valuation,and long-term performance. Atthis time, we are quite enthused
with the make-up of the portfolios, and we believe that theseportfolios will continue to outperform in the long term. Wefeel that risk is being mispriced in global equity markets andthat the undervalued and high quality companies in ourportfolios will eventually deliver strong performance. As youwill read in the individual Fund letters, today’s “dogs”—thosestocks that have been a drag on portfolio return—often turninto tomorrow’s stars. We are quite confident that those secu-rities that have dampened performance will not only recoverbut will lead to solid absolute and relative performance.
China, Unsafe at Any Speed?We continue to receive lots of questions on why weremain uninvested in China, the world’s fastest growingmajor economy. Recall that our investment style is thatof long-term value investors. We seek to invest in compa-nies that are of high quality but also sell at low prices.Today the stocks of Chinese companies represent neither:they are richly priced and they are of low quality. As anexample, the major Chinese bank stocks trade at overthree times book value and 15-20 times earnings. Most ofthe banks we own are at 10-12 times earnings and trade atone to two times book value. Before Chinese bank stockscould even be listed and sold to foreign investors, theyhad to remove the bad loans from their books, whichrepresented 30% of their portfolios. This begs the questionof whether the lending practices that caused the bad loansin the first place have radically changed, or is it simply amatter of time before history repeats itself?Most major Chinese companies are still state controlled,which means that politics will most certainly enter corpo-rate decision making. The state is directly involved incritical banking matters, ranging from capital allocation to
pricing to investment criteria, all of which could lead toless than optimal results for foreign investors.China is also an environmental nightmare. Though thelack of environmental regulations has helped it become alow cost country for producing goods and has attractedmanufacturers from all over the world, China’s air, water,and soil have rapidly deteriorated. Any traveler to Chinacan easily observe this well-documented phenomenon.Additionally, aggressive “entrepreneurs” have called intoquestion the safety and quality of much of what has beenproduced. Recently, pet food, toys, tooth paste, coughsyrup, and ATVs have been made either toxic by theaddition of cheap materials or unsafe by poor design. Webelieve that China will have to deal with these issues,which will eventually affect the cost of production andpossibly make it a less competitive place to invest andproduce. In our view, if the current pace of environmen-tal decay is maintained, it would be catastrophic not onlyfor China but also for the globe.Lastly, we are seeing signs that the Chinese market isnow speculatively priced. Besides—and maybe becauseof—stretched valuations, new listings are coming tomarket raising billions and billions of dollars. Some arenew industry participants, and some are raising capitalfor huge expansion projects. Often, the economicrationale of the listing is unclear, though that doesn’tseem to matter because most China-themed deals areheavily over subscribed. We cannot ignore the parallelswith the tech bubble as we watch the theme “Growth ofChina” become so prevalent. In the late 90s, the advanceof the internet was the dominant theme, but investorsfound out the hard way that a macro theme does notalways correlate with corporate profitability.It is true that there will be growth in China for as far asthe eye can see: strong growth in fixed capital, economicliberalization, and some positive microeconomic funda-mentals will lead to productivity enhancement. However,this does not mean it is safe to invest in Chinese stocks attoday’s prices.
David G. Herro, CFAPortfolio [email protected]
June 30, 2007
35T H E O A K M A R K I N T E R N AT I O N A L A N D O A K M A R K I N T E R N AT I O N A L S M A L L C A P F U N D S
THE OAKMARK INTERNATIONAL AND OAKMARK INTERNATIONAL SMALL CAP FUNDS
Merrill Corp - Harris-Oakmark 3rd Quarterly Report [Funds] 07-31-2007 [AUX] | sgirard | 26-Jul-07 16:52 | 07-16988-2.hd | Sequence: 1CHKSUM Content: 48218 Layout: 55875 Graphics: 63776 CLEAN
JOB: 07-16988-2 CYCLE#;BL#: 13; 0 TRIM: 7.75" x 9.75" AS: Merrill Chicago: 312-786-6300 COMPOSITECOLORS: Black, PANTONE 541 U, ~HTML color, ~note-color 2 GRAPHICS: David G Herro new photo.eps V1.5
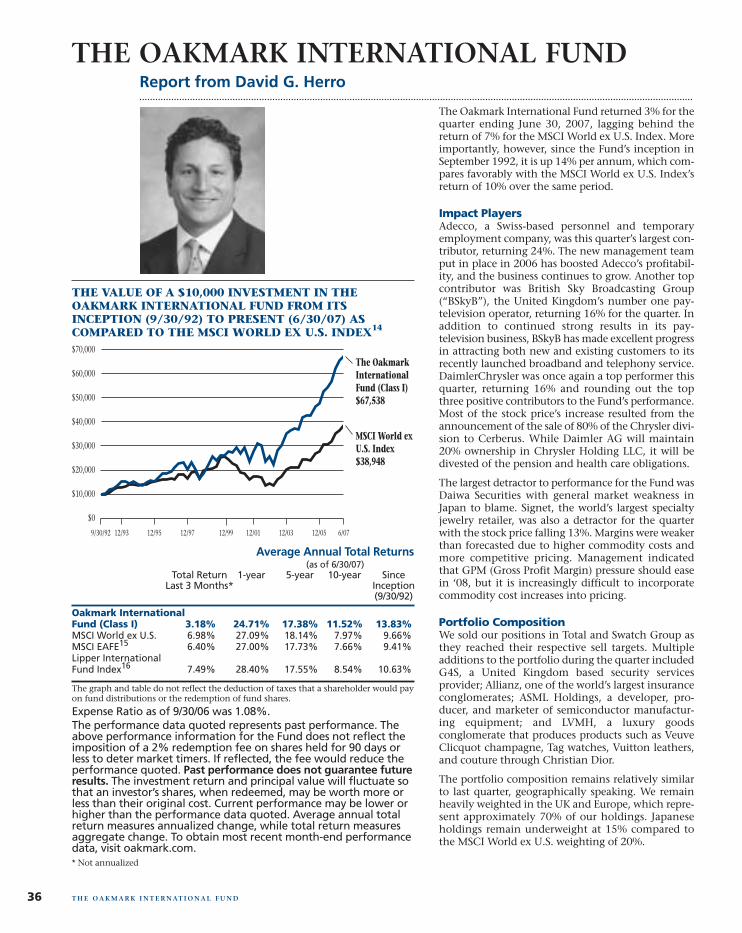
The Oakmark International Fund returned 3% for thequarter ending June 30, 2007, lagging behind thereturn of 7% for the MSCI World ex U.S. Index. Moreimportantly, however, since the Fund’s inception inSeptember 1992, it is up 14% per annum, which com-pares favorably with the MSCI World ex U.S. Index’sreturn of 10% over the same period.
Impact PlayersAdecco, a Swiss-based personnel and temporaryemployment company, was this quarter’s largest con-tributor, returning 24%. The new management teamput in place in 2006 has boosted Adecco’s profitabil-ity, and the business continues to grow. Another topcontributor was British Sky Broadcasting Group(“BSkyB”), the United Kingdom’s number one pay-television operator, returning 16% for the quarter. Inaddition to continued strong results in its pay-television business, BSkyB has made excellent progressin attracting both new and existing customers to itsrecently launched broadband and telephony service.DaimlerChrysler was once again a top performer thisquarter, returning 16% and rounding out the topthree positive contributors to the Fund’s performance.Most of the stock price’s increase resulted from theannouncement of the sale of 80% of the Chrysler divi-sion to Cerberus. While Daimler AG will maintain20% ownership in Chrysler Holding LLC, it will bedivested of the pension and health care obligations.
The largest detractor to performance for the Fund wasDaiwa Securities with general market weakness inJapan to blame. Signet, the world’s largest specialtyjewelry retailer, was also a detractor for the quarterwith the stock price falling 13%. Margins were weakerthan forecasted due to higher commodity costs andmore competitive pricing. Management indicatedthat GPM (Gross Profit Margin) pressure should easein ‘08, but it is increasingly difficult to incorporatecommodity cost increases into pricing.
Portfolio CompositionWe sold our positions in Total and Swatch Group asthey reached their respective sell targets. Multipleadditions to the portfolio during the quarter includedG4S, a United Kingdom based security servicesprovider; Allianz, one of the world’s largest insuranceconglomerates; ASML Holdings, a developer, pro-ducer, and marketer of semiconductor manufactur-ing equipment; and LVMH, a luxury goodsconglomerate that produces products such as VeuveClicquot champagne, Tag watches, Vuitton leathers,and couture through Christian Dior.
The portfolio composition remains relatively similarto last quarter, geographically speaking. We remainheavily weighted in the UK and Europe, which repre-sent approximately 70% of our holdings. Japaneseholdings remain underweight at 15% compared tothe MSCI World ex U.S. weighting of 20%.
Report from David G. Herro
THE OAKMARK INTERNATIONAL FUND
36 T H E O A K M A R K I N T E R N AT I O N A L F U N D
THE VALUE OF A $10,000 INVESTMENT IN THEOAKMARK INTERNATIONAL FUND FROM ITSINCEPTION (9/30/92) TO PRESENT (6/30/07) ASCOMPARED TO THE MSCI WORLD EX U.S. INDEX14
The OakmarkInternationalFund (Class I)$67,538
MSCI World exU.S. Index$38,948
9/30/92 6/07
$70,000
$10,000
$20,000
$30,000
$40,000
$50,000
$60,000
12/93 12/95 12/97 12/99 12/01 12/03 12/05
$0
Average Annual Total Returns(as of 6/30/07)
Total Return 1-year 5-year 10-year SinceLast 3 Months* Inception
(9/30/92)
Oakmark InternationalFund (Class I) 3.18% 24.71% 17.38% 11.52% 13.83%MSCI World ex U.S. 6.98% 27.09% 18.14% 7.97% 9.66%MSCI EAFE15 6.40% 27.00% 17.73% 7.66% 9.41%Lipper InternationalFund Index16 7.49% 28.40% 17.55% 8.54% 10.63%
The graph and table do not reflect the deduction of taxes that a shareholder would payon fund distributions or the redemption of fund shares.
Expense Ratio as of 9/30/06 was 1.08%.The performance data quoted represents past performance. Theabove performance information for the Fund does not reflect theimposition of a 2% redemption fee on shares held for 90 days orless to deter market timers. If reflected, the fee would reduce theperformance quoted. Past performance does not guarantee futureresults. The investment return and principal value will fluctuate sothat an investor’s shares, when redeemed, may be worth more orless than their original cost. Current performance may be lower orhigher than the performance data quoted. Average annual totalreturn measures annualized change, while total return measuresaggregate change. To obtain most recent month-end performancedata, visit oakmark.com.* Not annualized
Merrill Corp - Harris-Oakmark 3rd Quarterly Report [Funds] 07-31-2007 [AUX] | sgirard | 26-Jul-07 16:52 | 07-16988-2.he | Sequence: 1CHKSUM Content: 6443 Layout: 18254 Graphics: 30759 CLEAN
JOB: 07-16988-2 CYCLE#;BL#: 13; 0 TRIM: 7.75" x 9.75" AS: Merrill Chicago: 312-786-6300 COMPOSITECOLORS: Black, PANTONE 541 U, ~note-color 2 GRAPHICS: 16988-2 Intl line.eps, David G Herro new photo.eps V1.5
T H E O A K M A R K I N T E R N AT I O N A L F U N D 37
In closing we would like to remind you that we measure our per-
formance over the long term. Short-term fluctuations in themar-
ket actually create opportunities for us to invest in under-valued
foreign companies that have fallen out of favor in the market-
place. We continue to focus on finding attractive, under-valued
foreign companies with management teams focused on buildingshareholder value.
June 30, 2007
David G. Herro, CFAPortfolio [email protected]
Merrill Corp - Harris-Oakmark 3rd Quarterly Report [Funds] 07-31-2007 [AUX] | sgirard | 26-Jul-07 16:52 | 07-16988-2.he | Sequence: 2CHKSUM Content: 47974 Layout: 47563 Graphics: No Graphics CLEAN
JOB: 07-16988-2 CYCLE#;BL#: 13; 0 TRIM: 7.75" x 9.75" AS: Merrill Chicago: 312-786-6300 COMPOSITECOLORS: Black, PANTONE 541 U, ~note-color 2 GRAPHICS: none V1.5
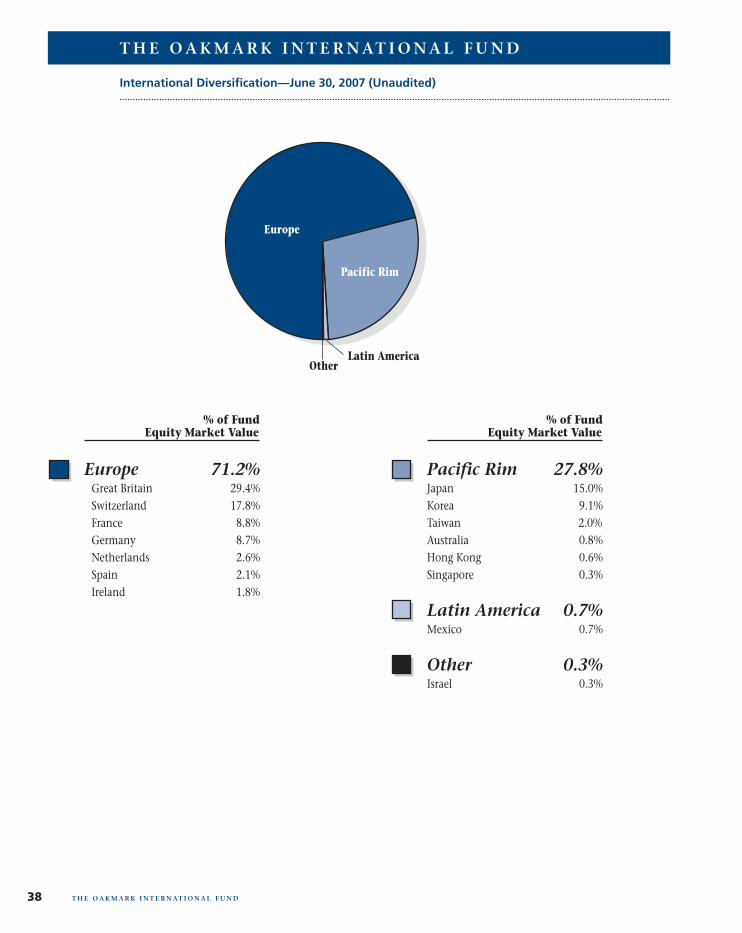
38 T H E O A K M A R K I N T E R N AT I O N A L F U N D
International Diversification—June 30, 2007 (Unaudited)
Pacific Rim 27.8%Japan 15.0%Korea 9.1%Taiwan 2.0%Australia 0.8%Hong Kong 0.6%Singapore 0.3%
Latin America 0.7%Mexico 0.7%
Other 0.3%Israel 0.3%
Europe 71.2% Great Britain 29.4% Switzerland 17.8% France 8.8% Germany 8.7% Netherlands 2.6% Spain 2.1% Ireland 1.8%
% of Fund Equity Market Value
% of Fund Equity Market Value
Latin AmericaOther
Europe
Pacific Rim
T H E O A K M A R K I N T E R N AT I O N A L F U N D
Merrill Corp - Harris-Oakmark 3rd Quarterly Report [Funds] 07-31-2007 [AUX] | sgirard | 26-Jul-07 16:52 | 07-16988-2.he | Sequence: 3CHKSUM Content: 33073 Layout: 10188 Graphics: 33087 CLEAN
JOB: 07-16988-2 CYCLE#;BL#: 13; 0 TRIM: 7.75" x 9.75" AS: Merrill Chicago: 312-786-6300 COMPOSITECOLORS: Black, PANTONE 541 U, ~note-color 2, ~note-color 3 GRAPHICS: 16988-2 Intl pie.eps V1.5
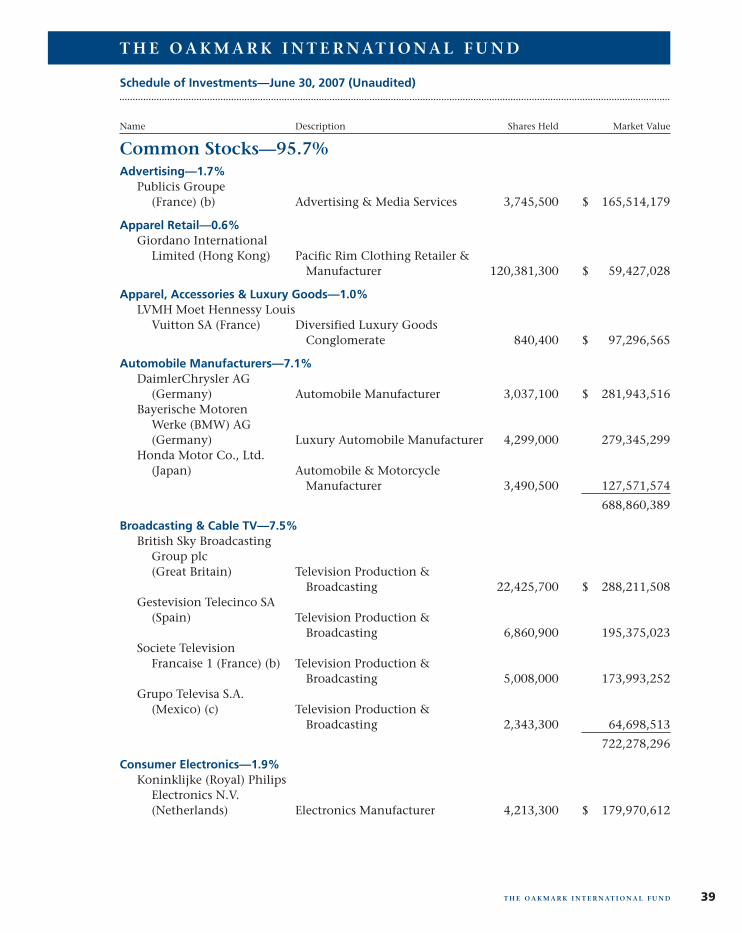
Common Stocks—95.7%
Schedule of Investments—June 30, 2007 (Unaudited)
Name Description Shares Held Market Value
T H E O A K M A R K I N T E R N AT I O N A L F U N D
T H E O A K M A R K I N T E R N AT I O N A L F U N D 39
Advertising—1.7%Publicis Groupe
(France) (b) Advertising & Media Services 3,745,500 $ 165,514,179
Apparel Retail—0.6%Giordano International
Limited (Hong Kong) Pacific Rim Clothing Retailer &Manufacturer 120,381,300 $ 59,427,028
Apparel, Accessories & Luxury Goods—1.0%LVMH Moet Hennessy Louis
Vuitton SA (France) Diversified Luxury GoodsConglomerate 840,400 $ 97,296,565
Automobile Manufacturers—7.1%DaimlerChrysler AG
(Germany) Automobile Manufacturer 3,037,100 $ 281,943,516Bayerische Motoren
Werke (BMW) AG(Germany) Luxury Automobile Manufacturer 4,299,000 279,345,299
Honda Motor Co., Ltd.(Japan) Automobile & Motorcycle
Manufacturer 3,490,500 127,571,574
688,860,389
Broadcasting & Cable TV—7.5%British Sky Broadcasting
Group plc(Great Britain) Television Production &
Broadcasting 22,425,700 $ 288,211,508Gestevision Telecinco SA
(Spain) Television Production &Broadcasting 6,860,900 195,375,023
Societe TelevisionFrancaise 1 (France) (b) Television Production &
Broadcasting 5,008,000 173,993,252Grupo Televisa S.A.
(Mexico) (c) Television Production &Broadcasting 2,343,300 64,698,513
722,278,296
Consumer Electronics—1.9%Koninklijke (Royal) Philips
Electronics N.V. (Netherlands) Electronics Manufacturer 4,213,300 $ 179,970,612
Merrill Corp - Harris-Oakmark 3rd Quarterly Report [Funds] 07-31-2007 [AUX] | sgirard | 26-Jul-07 16:52 | 07-16988-2.he | Sequence: 4CHKSUM Content: 26902 Layout: 35215 Graphics: No Graphics CLEAN
JOB: 07-16988-2 CYCLE#;BL#: 13; 0 TRIM: 7.75" x 9.75" AS: Merrill Chicago: 312-786-6300 COMPOSITECOLORS: Black, PANTONE 541 U, ~note-color 2 GRAPHICS: none V1.5
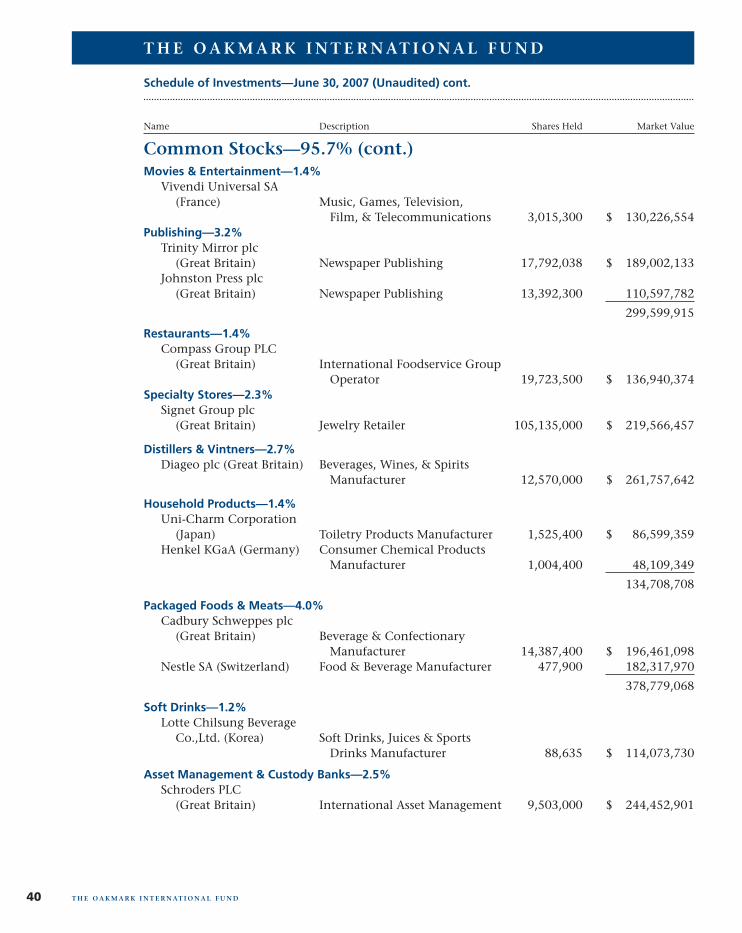
Common Stocks—95.7% (cont.)
Schedule of Investments—June 30, 2007 (Unaudited) cont.
Name Description Shares Held Market Value
T H E O A K M A R K I N T E R N AT I O N A L F U N D
T H E O A K M A R K I N T E R N AT I O N A L F U N D40
Movies & Entertainment—1.4%Vivendi Universal SA
(France) Music, Games, Television, Film, & Telecommunications 3,015,300 $ 130,226,554
Publishing—3.2%Trinity Mirror plc
(Great Britain) Newspaper Publishing 17,792,038 $ 189,002,133Johnston Press plc
(Great Britain) Newspaper Publishing 13,392,300 110,597,782
299,599,915
Restaurants—1.4%Compass Group PLC
(Great Britain) International Foodservice GroupOperator 19,723,500 $ 136,940,374
Specialty Stores—2.3%Signet Group plc
(Great Britain) Jewelry Retailer 105,135,000 $ 219,566,457
Distillers & Vintners—2.7%Diageo plc (Great Britain) Beverages, Wines, & Spirits
Manufacturer 12,570,000 $ 261,757,642
Household Products—1.4%Uni-Charm Corporation
(Japan) Toiletry Products Manufacturer 1,525,400 $ 86,599,359Henkel KGaA (Germany) Consumer Chemical Products
Manufacturer 1,004,400 48,109,349
134,708,708
Packaged Foods & Meats—4.0%Cadbury Schweppes plc
(Great Britain) Beverage & Confectionary Manufacturer 14,387,400 $ 196,461,098
Nestle SA (Switzerland) Food & Beverage Manufacturer 477,900 182,317,970
378,779,068
Soft Drinks—1.2%Lotte Chilsung Beverage
Co.,Ltd. (Korea) Soft Drinks, Juices & SportsDrinks Manufacturer 88,635 $ 114,073,730
Asset Management & Custody Banks—2.5%Schroders PLC
(Great Britain) International Asset Management 9,503,000 $ 244,452,901
Merrill Corp - Harris-Oakmark 3rd Quarterly Report [Funds] 07-31-2007 [AUX] | sgirard | 26-Jul-07 16:52 | 07-16988-2.he | Sequence: 5CHKSUM Content: 12114 Layout: 45762 Graphics: No Graphics CLEAN
JOB: 07-16988-2 CYCLE#;BL#: 13; 0 TRIM: 7.75" x 9.75" AS: Merrill Chicago: 312-786-6300 COMPOSITECOLORS: Black, PANTONE 541 U, ~note-color 2 GRAPHICS: none V1.5
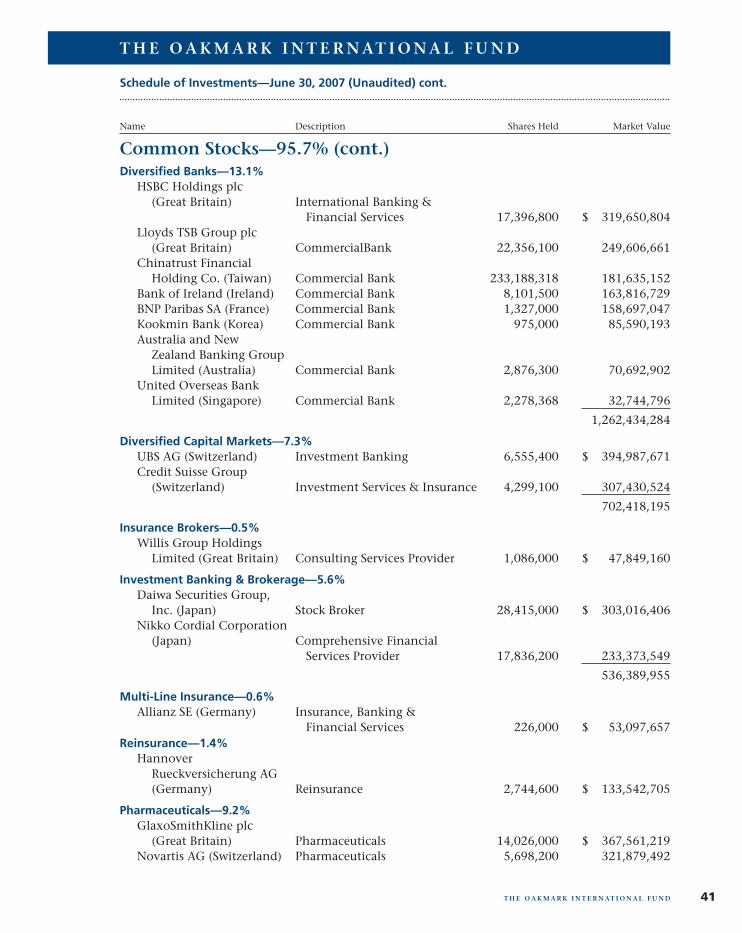
Common Stocks—95.7% (cont.)
Schedule of Investments—June 30, 2007 (Unaudited) cont.
Name Description Shares Held Market Value
T H E O A K M A R K I N T E R N AT I O N A L F U N D
T H E O A K M A R K I N T E R N AT I O N A L F U N D 41
Diversified Banks—13.1%HSBC Holdings plc
(Great Britain) International Banking &Financial Services 17,396,800 $ 319,650,804
Lloyds TSB Group plc(Great Britain) CommercialBank 22,356,100 249,606,661
Chinatrust FinancialHolding Co. (Taiwan) Commercial Bank 233,188,318 181,635,152
Bank of Ireland (Ireland) Commercial Bank 8,101,500 163,816,729BNP Paribas SA (France) Commercial Bank 1,327,000 158,697,047Kookmin Bank (Korea) Commercial Bank 975,000 85,590,193Australia and New
Zealand Banking GroupLimited (Australia) Commercial Bank 2,876,300 70,692,902
United Overseas BankLimited (Singapore) Commercial Bank 2,278,368 32,744,796
1,262,434,284
Diversified Capital Markets—7.3%UBS AG (Switzerland) Investment Banking 6,555,400 $ 394,987,671Credit Suisse Group
(Switzerland) Investment Services & Insurance 4,299,100 307,430,524
702,418,195
Insurance Brokers—0.5%Willis Group Holdings
Limited (Great Britain) Consulting Services Provider 1,086,000 $ 47,849,160
Investment Banking & Brokerage—5.6%Daiwa Securities Group,
Inc. (Japan) Stock Broker 28,415,000 $ 303,016,406Nikko Cordial Corporation
(Japan) Comprehensive Financial Services Provider 17,836,200 233,373,549
536,389,955
Multi-Line Insurance—0.6%Allianz SE (Germany) Insurance, Banking &
Financial Services 226,000 $ 53,097,657Reinsurance—1.4%
Hannover Rueckversicherung AG(Germany) Reinsurance 2,744,600 $ 133,542,705
Pharmaceuticals—9.2%GlaxoSmithKline plc
(Great Britain) Pharmaceuticals 14,026,000 $ 367,561,219Novartis AG (Switzerland) Pharmaceuticals 5,698,200 321,879,492
Merrill Corp - Harris-Oakmark 3rd Quarterly Report [Funds] 07-31-2007 [AUX] | sgirard | 26-Jul-07 16:52 | 07-16988-2.he | Sequence: 6CHKSUM Content: 17073 Layout: 35215 Graphics: No Graphics CLEAN
JOB: 07-16988-2 CYCLE#;BL#: 13; 0 TRIM: 7.75" x 9.75" AS: Merrill Chicago: 312-786-6300 COMPOSITECOLORS: Black, PANTONE 541 U, ~note-color 2 GRAPHICS: none V1.5
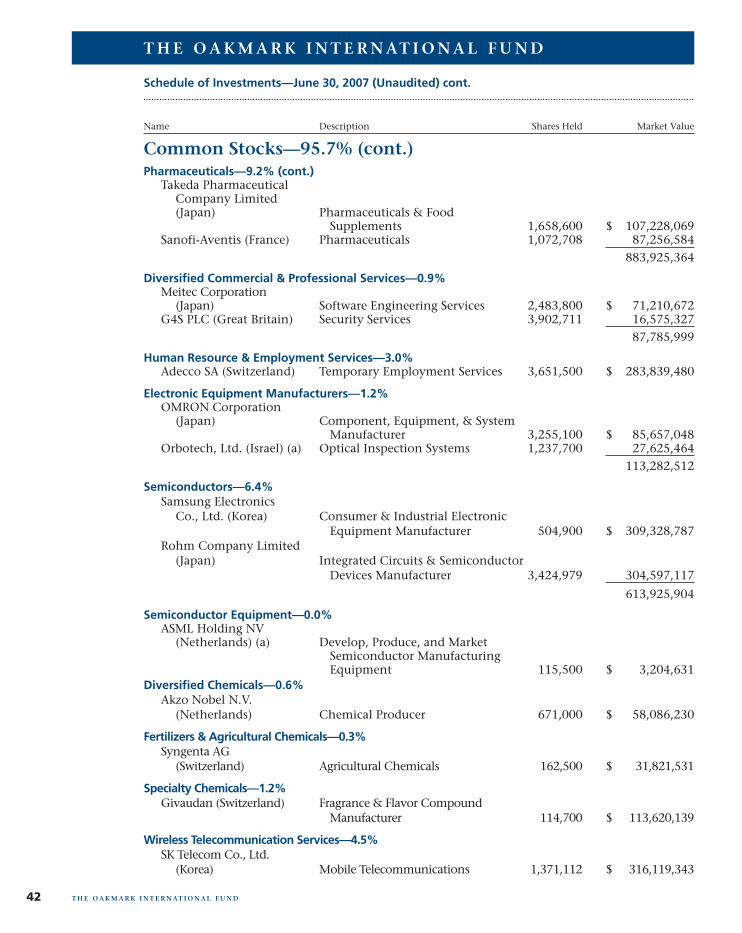
Common Stocks—95.7% (cont.)
Schedule of Investments—June 30, 2007 (Unaudited) cont.
Name Description Shares Held Market Value
T H E O A K M A R K I N T E R N AT I O N A L F U N D
T H E O A K M A R K I N T E R N AT I O N A L F U N D42
Pharmaceuticals—9.2% (cont.)Takeda Pharmaceutical
Company Limited(Japan) Pharmaceuticals & Food
Supplements 1,658,600 $ 107,228,069Sanofi-Aventis (France) Pharmaceuticals 1,072,708 87,256,584
883,925,364
Diversified Commercial & Professional Services—0.9%Meitec Corporation
(Japan) Software Engineering Services 2,483,800 $ 71,210,672G4S PLC (Great Britain) Security Services 3,902,711 16,575,327
87,785,999
Human Resource & Employment Services—3.0%Adecco SA (Switzerland) Temporary Employment Services 3,651,500 $ 283,839,480
Electronic Equipment Manufacturers—1.2%OMRON Corporation
(Japan) Component, Equipment, & SystemManufacturer 3,255,100 $ 85,657,048
Orbotech, Ltd. (Israel) (a) Optical Inspection Systems 1,237,700 27,625,464113,282,512
Semiconductors—6.4%Samsung Electronics
Co., Ltd. (Korea) Consumer & Industrial ElectronicEquipment Manufacturer 504,900 $ 309,328,787
Rohm Company Limited(Japan) Integrated Circuits & Semiconductor
Devices Manufacturer 3,424,979 304,597,117
613,925,904
Semiconductor Equipment—0.0%ASML Holding NV
(Netherlands) (a) Develop, Produce, and MarketSemiconductor ManufacturingEquipment 115,500 $ 3,204,631
Diversified Chemicals—0.6%Akzo Nobel N.V.
(Netherlands) Chemical Producer 671,000 $ 58,086,230
Fertilizers & Agricultural Chemicals—0.3%Syngenta AG
(Switzerland) Agricultural Chemicals 162,500 $ 31,821,531
Specialty Chemicals—1.2%Givaudan (Switzerland) Fragrance & Flavor Compound
Manufacturer 114,700 $ 113,620,139
Wireless Telecommunication Services—4.5%SK Telecom Co., Ltd.
(Korea) Mobile Telecommunications 1,371,112 $ 316,119,343
Merrill Corp - Harris-Oakmark 3rd Quarterly Report [Funds] 07-31-2007 [AUX] | sgirard | 26-Jul-07 16:52 | 07-16988-2.he | Sequence: 7CHKSUM Content: 30785 Layout: 60465 Graphics: No Graphics CLEAN
JOB: 07-16988-2 CYCLE#;BL#: 13; 0 TRIM: 7.75" x 9.75" AS: Merrill Chicago: 312-786-6300 COMPOSITECOLORS: Black, PANTONE 541 U, ~note-color 2 GRAPHICS: none V1.5
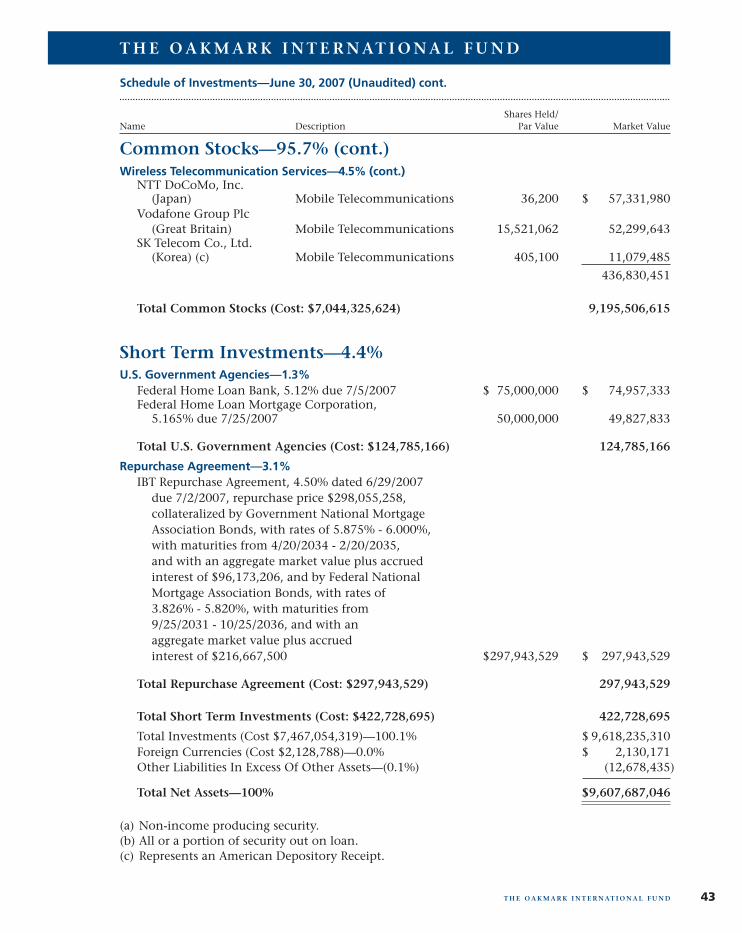
Common Stocks—95.7% (cont.)
Schedule of Investments—June 30, 2007 (Unaudited) cont.
Shares Held/Name Description Par Value Market Value
T H E O A K M A R K I N T E R N AT I O N A L F U N D
T H E O A K M A R K I N T E R N AT I O N A L F U N D 43
Wireless Telecommunication Services—4.5% (cont.)NTT DoCoMo, Inc.
(Japan) Mobile Telecommunications 36,200 $ 57,331,980Vodafone Group Plc
(Great Britain) Mobile Telecommunications 15,521,062 52,299,643SK Telecom Co., Ltd.
(Korea) (c) Mobile Telecommunications 405,100 11,079,485
436,830,451
Total Common Stocks (Cost: $7,044,325,624) 9,195,506,615
Short Term Investments—4.4%U.S. Government Agencies—1.3%
Federal Home Loan Bank, 5.12% due 7/5/2007 $ 75,000,000 $ 74,957,333Federal Home Loan Mortgage Corporation,
5.165% due 7/25/2007 50,000,000 49,827,833
Total U.S. Government Agencies (Cost: $124,785,166) 124,785,166
Repurchase Agreement—3.1%IBT Repurchase Agreement, 4.50% dated 6/29/2007
due 7/2/2007, repurchase price $298,055,258,collateralized by Government National MortgageAssociation Bonds, with rates of 5.875% - 6.000%,with maturities from 4/20/2034 - 2/20/2035,and with an aggregate market value plus accruedinterest of $96,173,206, and by Federal NationalMortgage Association Bonds, with rates of3.826% - 5.820%, with maturities from9/25/2031 - 10/25/2036, and with anaggregate market value plus accruedinterest of $216,667,500 $297,943,529 $ 297,943,529
Total Repurchase Agreement (Cost: $297,943,529) 297,943,529
Total Short Term Investments (Cost: $422,728,695) 422,728,695
Total Investments (Cost $7,467,054,319)—100.1% $ 9,618,235,310Foreign Currencies (Cost $2,128,788)—0.0% $ 2,130,171Other Liabilities In Excess Of Other Assets—(0.1%) (12,678,435)
Total Net Assets—100% $9,607,687,046
(a) Non-income producing security.(b) All or a portion of security out on loan.(c) Represents an American Depository Receipt.
Merrill Corp - Harris-Oakmark 3rd Quarterly Report [Funds] 07-31-2007 [AUX] | sgirard | 26-Jul-07 16:52 | 07-16988-2.he | Sequence: 8CHKSUM Content: 4425 Layout: 35215 Graphics: No Graphics CLEAN
JOB: 07-16988-2 CYCLE#;BL#: 13; 0 TRIM: 7.75" x 9.75" AS: Merrill Chicago: 312-786-6300 COMPOSITECOLORS: Black, PANTONE 541 U, ~note-color 2 GRAPHICS: none V1.5
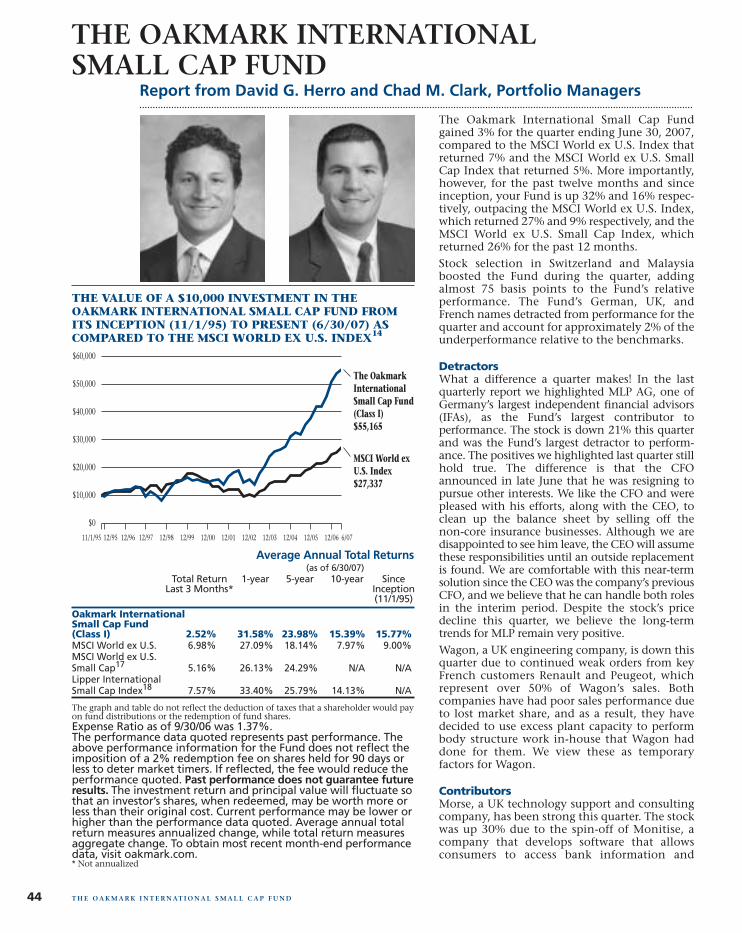
The Oakmark International Small Cap Fundgained 3% for the quarter ending June 30, 2007,compared to the MSCI World ex U.S. Index thatreturned 7% and the MSCI World ex U.S. SmallCap Index that returned 5%. More importantly,however, for the past twelve months and sinceinception, your Fund is up 32% and 16% respec-tively, outpacing the MSCI World ex U.S. Index,which returned 27% and 9% respectively, and theMSCI World ex U.S. Small Cap Index, whichreturned 26% for the past 12 months.Stock selection in Switzerland and Malaysiaboosted the Fund during the quarter, addingalmost 75 basis points to the Fund’s relativeperformance. The Fund’s German, UK, andFrench names detracted from performance for thequarter and account for approximately 2% of theunderperformance relative to the benchmarks.
DetractorsWhat a difference a quarter makes! In the lastquarterly report we highlighted MLP AG, one ofGermany’s largest independent financial advisors(IFAs), as the Fund’s largest contributor toperformance. The stock is down 21% this quarterand was the Fund’s largest detractor to perform-ance. The positives we highlighted last quarter stillhold true. The difference is that the CFOannounced in late June that he was resigning topursue other interests. We like the CFO and werepleased with his efforts, along with the CEO, toclean up the balance sheet by selling off thenon-core insurance businesses. Although we aredisappointed to see him leave, the CEO will assumethese responsibilities until an outside replacementis found. We are comfortable with this near-termsolution since the CEO was the company’s previousCFO, and we believe that he can handle both rolesin the interim period. Despite the stock’s pricedecline this quarter, we believe the long-termtrends for MLP remain very positive.Wagon, a UK engineering company, is down thisquarter due to continued weak orders from keyFrench customers Renault and Peugeot, whichrepresent over 50% of Wagon’s sales. Bothcompanies have had poor sales performance dueto lost market share, and as a result, they havedecided to use excess plant capacity to performbody structure work in-house that Wagon haddone for them. We view these as temporaryfactors for Wagon.
ContributorsMorse, a UK technology support and consultingcompany, has been strong this quarter. The stockwas up 30% due to the spin-off of Monitise, acompany that develops software that allowsconsumers to access bank information and
Report from David G. Herro and Chad M. Clark, Portfolio Managers
THE OAKMARK INTERNATIONAL SMALL CAP FUND
THE VALUE OF A $10,000 INVESTMENT IN THEOAKMARK INTERNATIONAL SMALL CAP FUND FROMITS INCEPTION (11/1/95) TO PRESENT (6/30/07) ASCOMPARED TO THE MSCI WORLD EX U.S. INDEX14
Average Annual Total Returns(as of 6/30/07)
Total Return 1-year 5-year 10-year Since Last 3 Months* Inception
(11/1/95)
Oakmark International Small Cap Fund (Class I) 2.52% 31.58% 23.98% 15.39% 15.77%MSCI World ex U.S. 6.98% 27.09% 18.14% 7.97% 9.00%MSCI World ex U.S. Small Cap17 5.16% 26.13% 24.29% N/A N/ALipper International Small Cap Index18 7.57% 33.40% 25.79% 14.13% N/A
The graph and table do not reflect the deduction of taxes that a shareholder would payon fund distributions or the redemption of fund shares.Expense Ratio as of 9/30/06 was 1.37%.The performance data quoted represents past performance. Theabove performance information for the Fund does not reflect theimposition of a 2% redemption fee on shares held for 90 days orless to deter market timers. If reflected, the fee would reduce theperformance quoted. Past performance does not guarantee futureresults. The investment return and principal value will fluctuate sothat an investor’s shares, when redeemed, may be worth more orless than their original cost. Current performance may be lower orhigher than the performance data quoted. Average annual totalreturn measures annualized change, while total return measuresaggregate change. To obtain most recent month-end performancedata, visit oakmark.com.* Not annualized
The OakmarkInternationalSmall Cap Fund(Class I)$55,165
MSCI World exU.S. Index$27,337
11/1/95 6/07
$0
$60,000
$10,000
$20,000
$30,000
$40,000
$50,000
12/95 12/96 12/97 12/98 12/99 12/00 12/01 12/02 12/03 12/04 12/05 12/06
44 T H E O A K M A R K I N T E R N AT I O N A L S M A L L C A P F U N D
Merrill Corp - Harris-Oakmark 3rd Quarterly Report [Funds] 07-31-2007 [AUX] | sgirard | 26-Jul-07 16:52 | 07-16988-2.hg | Sequence: 1CHKSUM Content: 1807 Layout: 42413 Graphics: 59597 CLEAN
JOB: 07-16988-2 CYCLE#;BL#: 13; 0 TRIM: 7.75" x 9.75" AS: Merrill Chicago: 312-786-6300 COMPOSITECOLORS: Black, PANTONE 541 U, ~note-color 2, ~note-color 3 GRAPHICS: 16988-2 Intl Sm Cap line.eps, Chad_M_Clark_photo.eps, David G Herro new photo.eps V1.5
T H E O A K M A R K I N T E R N AT I O N A L S M A L L C A P F U N D 45
perform transactions via their mobile phones. Thebusiness is in its infancy, but it has huge potential becauseof its relationships with top UK-banking institutions,HSBC and Royal Bank of Scotland, as well as many mobilephone providers.Media Prima, Malaysia’s largest free-to-air broadcaster, rose22% in the quarter. The group’s newly acquired televisionchannel, “9,” is performing well, as are its radio and outdooradvertising assets. The Malaysian advertising market isexpected to be strong the second half of 2007 with televi-sion, radio, and outdoor taking share from print advertising.We discussed South Korean Daekyo Co. at the end of thefirst quarter when it was the largest performance detractor.At the beginning of the year, Daekyo raised prices on itseducational materials, which caused subscriptions andsubsequently its share price to decline. During the latterpart of June, the share price rose markedly, and for thequarter the stock returned 18%. Daekyo has begun restruc-turing its unprofitable education-related divisions and hasinitiated a small share buyback program. Better manage-ment, combined with the continued rise in value of thegroup’s holding in Shinhan Financial, were the key driv-ers of Daekyo’s share price in the quarter.
Portfolio CompositionIt was an active quarter for trading in our portfolio, andthe Fund exited many positions that reached fair value,including Veda Advantage, Lisi, Pfeiffer Vacuum Technol-ogy, Asia Satellite Telecom, Prosegur Seguridad, and GuritHolding. New additions included MDS Inc., a leading
Canadian provider of products and services to the globallife sciences market; Duerr AG, a German company thatengineers and builds plants and manufactures machineryfor the automotive industry; Estavis, a German real estatecompany; and Amplifon, an Italian company that sup-plies services and equipment to treat hearing loss.Geographically, our portfolio weightings remain quitesimilar to last quarter, with the exception of adding Cana-dian holding, MDS, to the portfolio. Europe and the UKrepresent a little more than 60% of investments, NorthAmerica is approximately 3%, Latin America is around2%, and the majority of the balance excluding cash isinvested in the Pacific Rim.
As we close, we encourage you to keep in mind our invest-ment time horizon is measured in years, not quarters. Weview ourselves as investors, not traders, and we focus onthe long-term business dynamic of a company and itsmanagement. We generally expect to hold a stock for atleast three to five years. Over time, we have found it takesthis long for the market’s view of a company’s value toconverge with our view. As long-term value investors, wewill continue to focus on finding attractive, under-valuedforeign companies with management teams focused onbuilding shareholder value.
June 30, 2007
Chad M. Clark, CFAPortfolio [email protected]
David G. Herro, CFAPortfolio [email protected]
Merrill Corp - Harris-Oakmark 3rd Quarterly Report [Funds] 07-31-2007 [AUX] | sgirard | 26-Jul-07 16:52 | 07-16988-2.hg | Sequence: 2CHKSUM Content: 58274 Layout: 36773 Graphics: No Graphics CLEAN
JOB: 07-16988-2 CYCLE#;BL#: 13; 0 TRIM: 7.75" x 9.75" AS: Merrill Chicago: 312-786-6300 COMPOSITECOLORS: Black, PANTONE 541 U, ~note-color 2 GRAPHICS: none V1.5
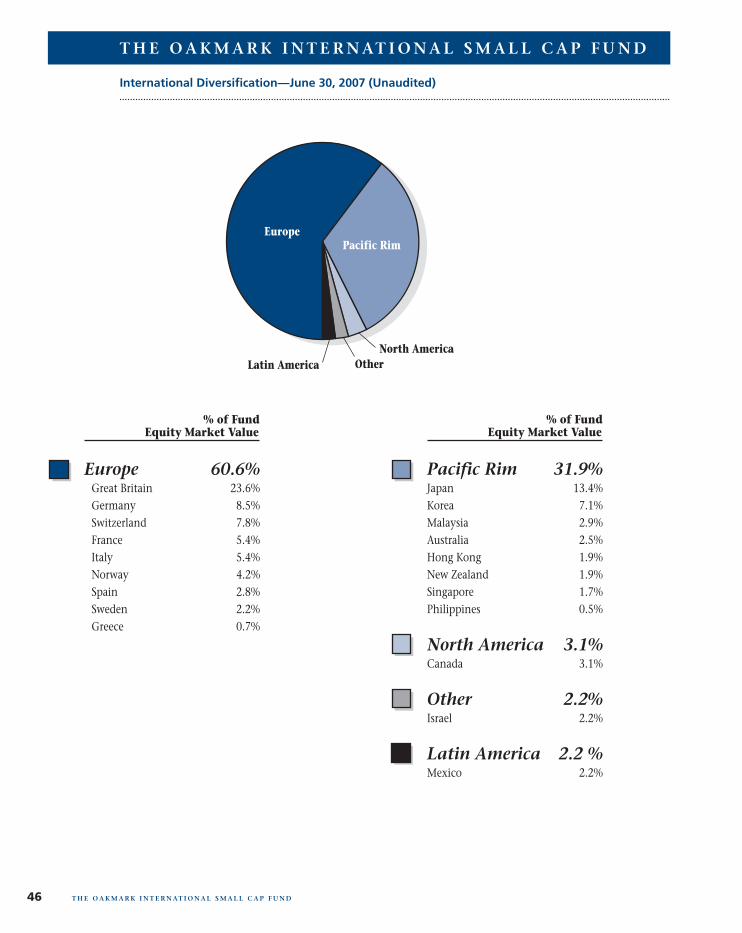
46 T H E O A K M A R K I N T E R N AT I O N A L S M A L L C A P F U N D
International Diversification—June 30, 2007 (Unaudited)
Pacific Rim 31.9%Japan 13.4%Korea 7.1%Malaysia 2.9%Australia 2.5%Hong Kong 1.9%New Zealand 1.9%Singapore 1.7%Philippines 0.5%
North America 3.1%Canada 3.1%
Other 2.2%Israel 2.2%
Latin America 2.2 %Mexico 2.2%
Europe 60.6% Great Britain 23.6% Germany 8.5% Switzerland 7.8% France 5.4% Italy 5.4% Norway 4.2% Spain 2.8% Sweden 2.2% Greece 0.7%
% of Fund Equity Market Value
% of Fund Equity Market Value
North AmericaOther
EuropePacific Rim
Latin America
T H E O A K M A R K I N T E R N AT I O N A L S M A L L C A P F U N D
Merrill Corp - Harris-Oakmark 3rd Quarterly Report [Funds] 07-31-2007 [AUX] | sgirard | 26-Jul-07 16:52 | 07-16988-2.hg | Sequence: 3CHKSUM Content: 15347 Layout: 10188 Graphics: 533 CLEAN
JOB: 07-16988-2 CYCLE#;BL#: 13; 0 TRIM: 7.75" x 9.75" AS: Merrill Chicago: 312-786-6300 COMPOSITECOLORS: Black, PANTONE 541 U, ~note-color 2, ~note-color 3 GRAPHICS: 16988-2 Intl Sm Cap pie.eps V1.5
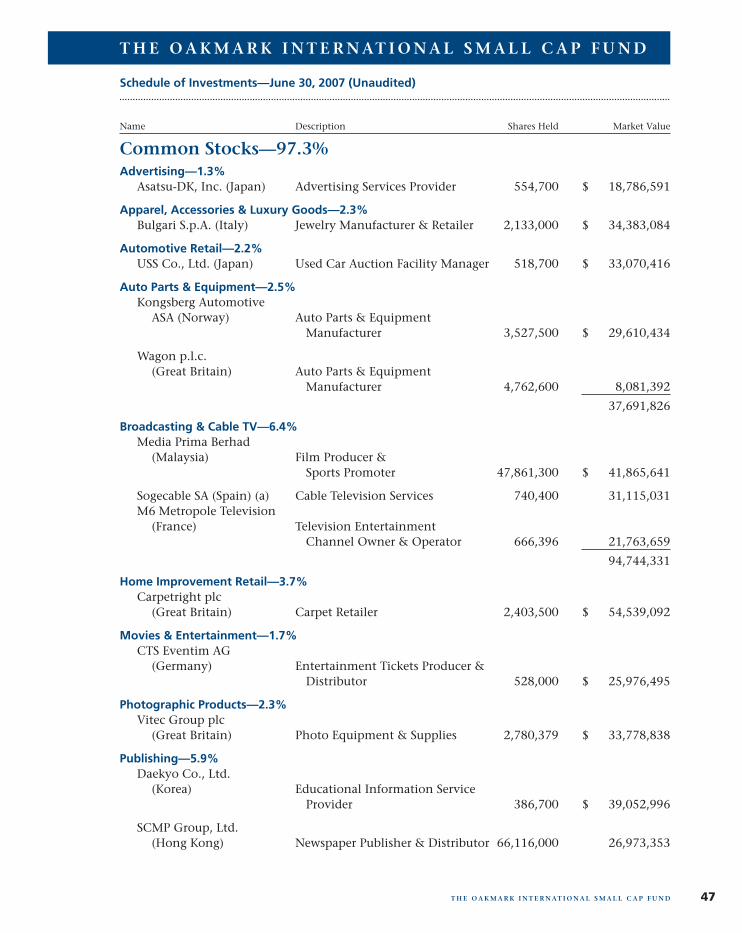
Common Stocks—97.3%
Schedule of Investments—June 30, 2007 (Unaudited)
Name Description Shares Held Market Value
T H E O A K M A R K I N T E R N AT I O N A L S M A L L C A P F U N D
T H E O A K M A R K I N T E R N AT I O N A L S M A L L C A P F U N D 47
Advertising—1.3%Asatsu-DK, Inc. (Japan) Advertising Services Provider 554,700 $ 18,786,591
Apparel, Accessories & Luxury Goods—2.3%Bulgari S.p.A. (Italy) Jewelry Manufacturer & Retailer 2,133,000 $ 34,383,084
Automotive Retail—2.2%USS Co., Ltd. (Japan) Used Car Auction Facility Manager 518,700 $ 33,070,416
Auto Parts & Equipment—2.5%Kongsberg Automotive
ASA (Norway) Auto Parts & EquipmentManufacturer 3,527,500 $ 29,610,434
Wagon p.l.c.(Great Britain) Auto Parts & Equipment
Manufacturer 4,762,600 8,081,392
37,691,826
Broadcasting & Cable TV—6.4%Media Prima Berhad
(Malaysia) Film Producer &Sports Promoter 47,861,300 $ 41,865,641
Sogecable SA (Spain) (a) Cable Television Services 740,400 31,115,031M6 Metropole Television
(France) Television EntertainmentChannel Owner & Operator 666,396 21,763,659
94,744,331
Home Improvement Retail—3.7%Carpetright plc
(Great Britain) Carpet Retailer 2,403,500 $ 54,539,092
Movies & Entertainment—1.7%CTS Eventim AG
(Germany) Entertainment Tickets Producer &Distributor 528,000 $ 25,976,495
Photographic Products—2.3%Vitec Group plc
(Great Britain) Photo Equipment & Supplies 2,780,379 $ 33,778,838
Publishing—5.9%Daekyo Co., Ltd.
(Korea) Educational Information ServiceProvider 386,700 $ 39,052,996
SCMP Group, Ltd.(Hong Kong) Newspaper Publisher & Distributor 66,116,000 26,973,353
Merrill Corp - Harris-Oakmark 3rd Quarterly Report [Funds] 07-31-2007 [AUX] | sgirard | 26-Jul-07 16:52 | 07-16988-2.hg | Sequence: 4CHKSUM Content: 60199 Layout: 35215 Graphics: No Graphics CLEAN
JOB: 07-16988-2 CYCLE#;BL#: 13; 0 TRIM: 7.75" x 9.75" AS: Merrill Chicago: 312-786-6300 COMPOSITECOLORS: Black, PANTONE 541 U, ~note-color 2 GRAPHICS: none V1.5
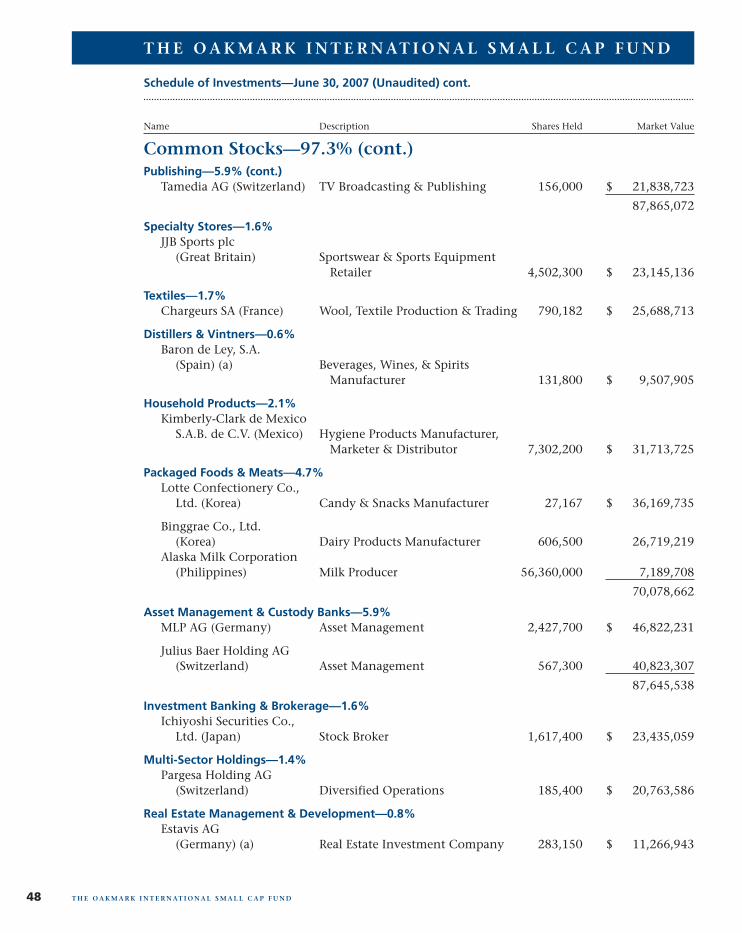
Common Stocks—97.3% (cont.)
Schedule of Investments—June 30, 2007 (Unaudited) cont.
Name Description Shares Held Market Value
T H E O A K M A R K I N T E R N AT I O N A L S M A L L C A P F U N D
T H E O A K M A R K I N T E R N AT I O N A L S M A L L C A P F U N D48
Publishing—5.9% (cont.)Tamedia AG (Switzerland) TV Broadcasting & Publishing 156,000 $ 21,838,723
87,865,072
Specialty Stores—1.6%JJB Sports plc
(Great Britain) Sportswear & Sports EquipmentRetailer 4,502,300 $ 23,145,136
Textiles—1.7%Chargeurs SA (France) Wool, Textile Production & Trading 790,182 $ 25,688,713
Distillers & Vintners—0.6%Baron de Ley, S.A.
(Spain) (a) Beverages, Wines, & SpiritsManufacturer 131,800 $ 9,507,905
Household Products—2.1%Kimberly-Clark de Mexico
S.A.B. de C.V. (Mexico) Hygiene Products Manufacturer,Marketer & Distributor 7,302,200 $ 31,713,725
Packaged Foods & Meats—4.7%Lotte Confectionery Co.,
Ltd. (Korea) Candy & Snacks Manufacturer 27,167 $ 36,169,735
Binggrae Co., Ltd.(Korea) Dairy Products Manufacturer 606,500 26,719,219
Alaska Milk Corporation(Philippines) Milk Producer 56,360,000 7,189,708
70,078,662
Asset Management & Custody Banks—5.9%MLP AG (Germany) Asset Management 2,427,700 $ 46,822,231
Julius Baer Holding AG(Switzerland) Asset Management 567,300 40,823,307
87,645,538
Investment Banking & Brokerage—1.6%Ichiyoshi Securities Co.,
Ltd. (Japan) Stock Broker 1,617,400 $ 23,435,059
Multi-Sector Holdings—1.4%Pargesa Holding AG
(Switzerland) Diversified Operations 185,400 $ 20,763,586
Real Estate Management & Development—0.8%Estavis AG
(Germany) (a) Real Estate Investment Company 283,150 $ 11,266,943
Merrill Corp - Harris-Oakmark 3rd Quarterly Report [Funds] 07-31-2007 [AUX] | sgirard | 26-Jul-07 16:52 | 07-16988-2.hg | Sequence: 5CHKSUM Content: 4712 Layout: 45762 Graphics: No Graphics CLEAN
JOB: 07-16988-2 CYCLE#;BL#: 13; 0 TRIM: 7.75" x 9.75" AS: Merrill Chicago: 312-786-6300 COMPOSITECOLORS: Black, PANTONE 541 U, ~note-color 2 GRAPHICS: none V1.5
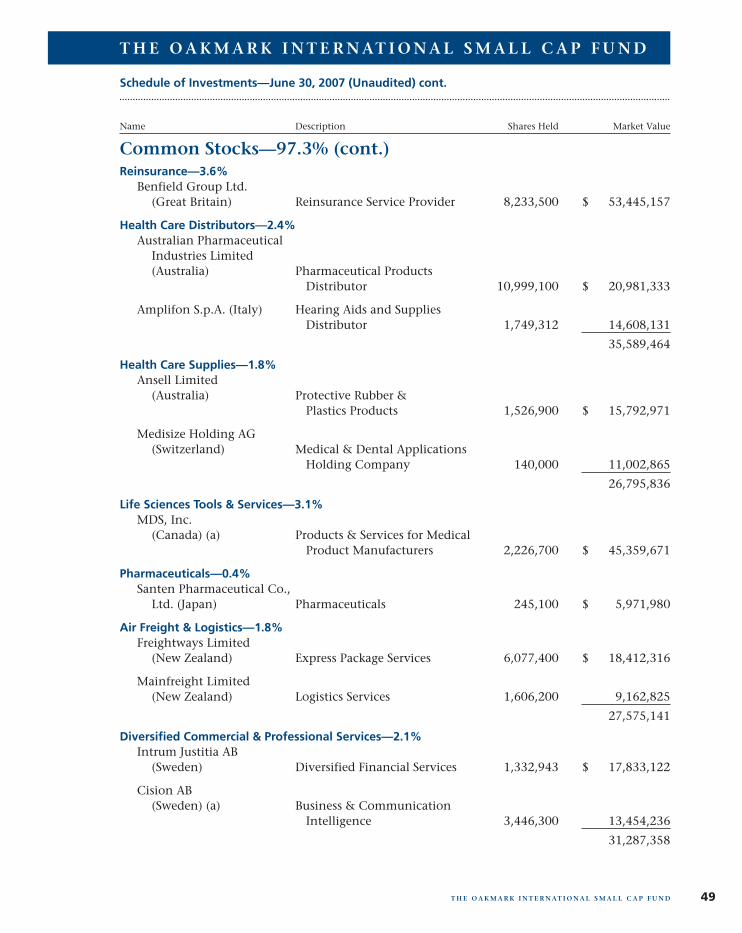
Common Stocks—97.3% (cont.)
Schedule of Investments—June 30, 2007 (Unaudited) cont.
Name Description Shares Held Market Value
T H E O A K M A R K I N T E R N AT I O N A L S M A L L C A P F U N D
T H E O A K M A R K I N T E R N AT I O N A L S M A L L C A P F U N D 49
Reinsurance—3.6%Benfield Group Ltd.
(Great Britain) Reinsurance Service Provider 8,233,500 $ 53,445,157
Health Care Distributors—2.4%Australian Pharmaceutical
Industries Limited(Australia) Pharmaceutical Products
Distributor 10,999,100 $ 20,981,333
Amplifon S.p.A. (Italy) Hearing Aids and SuppliesDistributor 1,749,312 14,608,131
35,589,464
Health Care Supplies—1.8%Ansell Limited
(Australia) Protective Rubber &Plastics Products 1,526,900 $ 15,792,971
Medisize Holding AG(Switzerland) Medical & Dental Applications
Holding Company 140,000 11,002,865
26,795,836
Life Sciences Tools & Services—3.1%MDS, Inc.
(Canada) (a) Products & Services for MedicalProduct Manufacturers 2,226,700 $ 45,359,671
Pharmaceuticals—0.4%Santen Pharmaceutical Co.,
Ltd. (Japan) Pharmaceuticals 245,100 $ 5,971,980
Air Freight & Logistics—1.8%Freightways Limited
(New Zealand) Express Package Services 6,077,400 $ 18,412,316
Mainfreight Limited(New Zealand) Logistics Services 1,606,200 9,162,825
27,575,141
Diversified Commercial & Professional Services—2.1%Intrum Justitia AB
(Sweden) Diversified Financial Services 1,332,943 $ 17,833,122
Cision AB(Sweden) (a) Business & Communication
Intelligence 3,446,300 13,454,236
31,287,358
Merrill Corp - Harris-Oakmark 3rd Quarterly Report [Funds] 07-31-2007 [AUX] | sgirard | 26-Jul-07 16:52 | 07-16988-2.hg | Sequence: 6CHKSUM Content: 44191 Layout: 35215 Graphics: No Graphics CLEAN
JOB: 07-16988-2 CYCLE#;BL#: 13; 0 TRIM: 7.75" x 9.75" AS: Merrill Chicago: 312-786-6300 COMPOSITECOLORS: Black, PANTONE 541 U, ~note-color 2 GRAPHICS: none V1.5
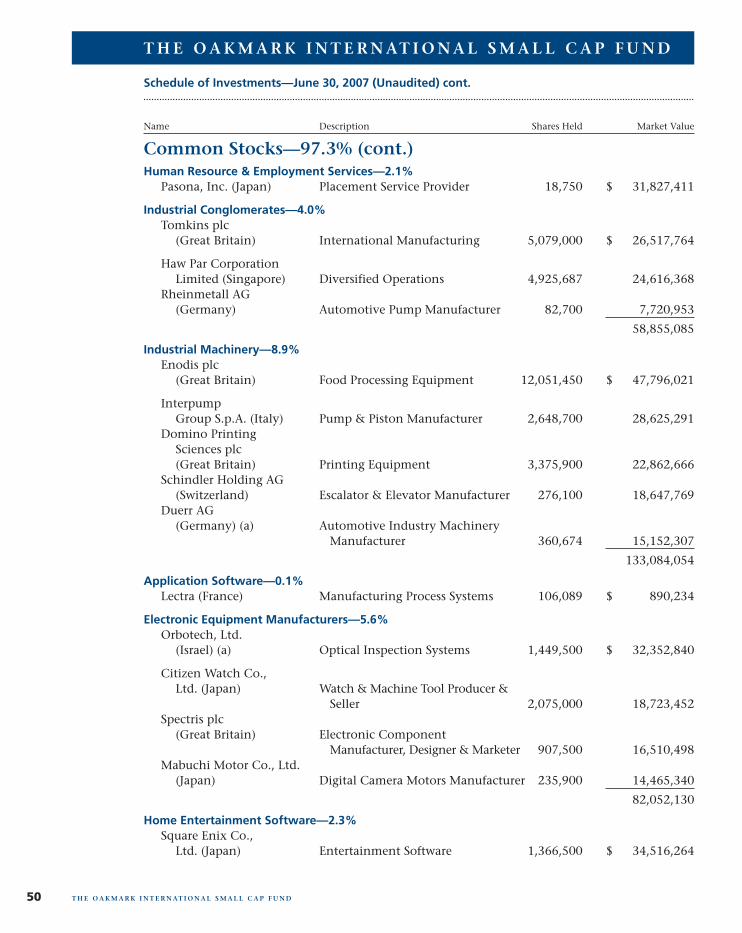
Common Stocks—97.3% (cont.)
Schedule of Investments—June 30, 2007 (Unaudited) cont.
Name Description Shares Held Market Value
T H E O A K M A R K I N T E R N AT I O N A L S M A L L C A P F U N D
T H E O A K M A R K I N T E R N AT I O N A L S M A L L C A P F U N D50
Human Resource & Employment Services—2.1%Pasona, Inc. (Japan) Placement Service Provider 18,750 $ 31,827,411
Industrial Conglomerates—4.0%Tomkins plc
(Great Britain) International Manufacturing 5,079,000 $ 26,517,764
Haw Par CorporationLimited (Singapore) Diversified Operations 4,925,687 24,616,368
Rheinmetall AG(Germany) Automotive Pump Manufacturer 82,700 7,720,953
58,855,085
Industrial Machinery—8.9%Enodis plc
(Great Britain) Food Processing Equipment 12,051,450 $ 47,796,021
InterpumpGroup S.p.A. (Italy) Pump & Piston Manufacturer 2,648,700 28,625,291
Domino PrintingSciences plc(Great Britain) Printing Equipment 3,375,900 22,862,666
Schindler Holding AG(Switzerland) Escalator & Elevator Manufacturer 276,100 18,647,769
Duerr AG(Germany) (a) Automotive Industry Machinery
Manufacturer 360,674 15,152,307
133,084,054
Application Software—0.1%Lectra (France) Manufacturing Process Systems 106,089 $ 890,234
Electronic Equipment Manufacturers—5.6%Orbotech, Ltd.
(Israel) (a) Optical Inspection Systems 1,449,500 $ 32,352,840
Citizen Watch Co.,Ltd. (Japan) Watch & Machine Tool Producer &
Seller 2,075,000 18,723,452Spectris plc
(Great Britain) Electronic ComponentManufacturer, Designer & Marketer 907,500 16,510,498
Mabuchi Motor Co., Ltd.(Japan) Digital Camera Motors Manufacturer 235,900 14,465,340
82,052,130
Home Entertainment Software—2.3%Square Enix Co.,
Ltd. (Japan) Entertainment Software 1,366,500 $ 34,516,264
Merrill Corp - Harris-Oakmark 3rd Quarterly Report [Funds] 07-31-2007 [AUX] | sgirard | 26-Jul-07 16:52 | 07-16988-2.hg | Sequence: 7CHKSUM Content: 53548 Layout: 45762 Graphics: No Graphics CLEAN
JOB: 07-16988-2 CYCLE#;BL#: 13; 0 TRIM: 7.75" x 9.75" AS: Merrill Chicago: 312-786-6300 COMPOSITECOLORS: Black, PANTONE 541 U, ~note-color 2 GRAPHICS: none V1.5
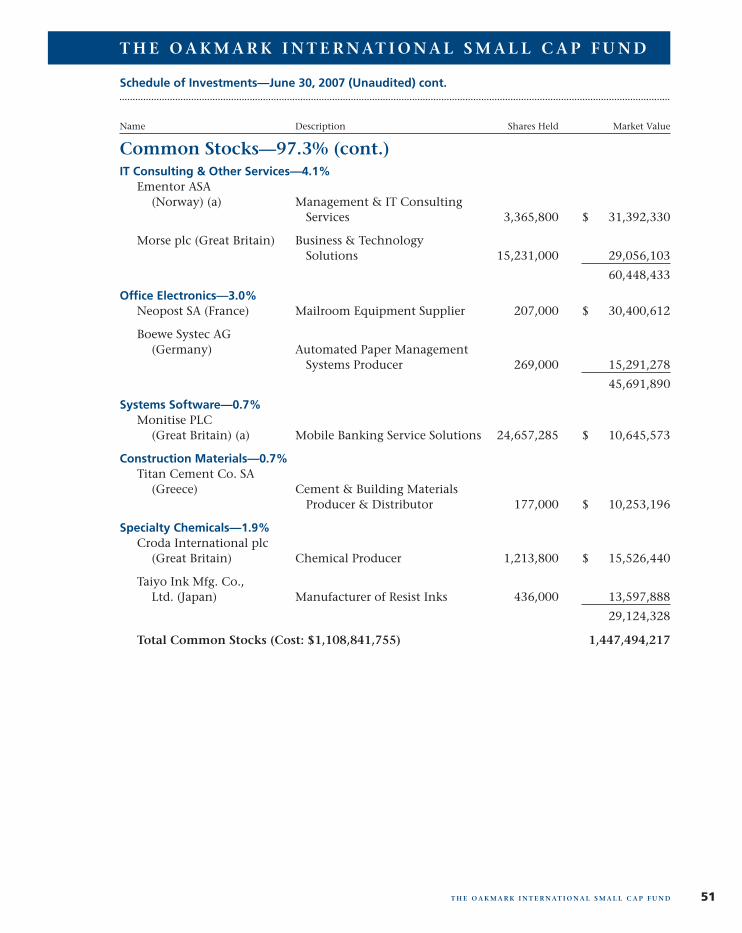
Common Stocks—97.3% (cont.)
Schedule of Investments—June 30, 2007 (Unaudited) cont.
Name Description Shares Held Market Value
T H E O A K M A R K I N T E R N AT I O N A L S M A L L C A P F U N D
T H E O A K M A R K I N T E R N AT I O N A L S M A L L C A P F U N D 51
IT Consulting & Other Services—4.1%Ementor ASA
(Norway) (a) Management & IT ConsultingServices 3,365,800 $ 31,392,330
Morse plc (Great Britain) Business & TechnologySolutions 15,231,000 29,056,103
60,448,433
Office Electronics—3.0%Neopost SA (France) Mailroom Equipment Supplier 207,000 $ 30,400,612
Boewe Systec AG(Germany) Automated Paper Management
Systems Producer 269,000 15,291,278
45,691,890
Systems Software—0.7%Monitise PLC
(Great Britain) (a) Mobile Banking Service Solutions 24,657,285 $ 10,645,573
Construction Materials—0.7%Titan Cement Co. SA
(Greece) Cement & Building MaterialsProducer & Distributor 177,000 $ 10,253,196
Specialty Chemicals—1.9%Croda International plc
(Great Britain) Chemical Producer 1,213,800 $ 15,526,440
Taiyo Ink Mfg. Co.,Ltd. (Japan) Manufacturer of Resist Inks 436,000 13,597,888
29,124,328
Total Common Stocks (Cost: $1,108,841,755) 1,447,494,217
Merrill Corp - Harris-Oakmark 3rd Quarterly Report [Funds] 07-31-2007 [AUX] | sgirard | 26-Jul-07 16:52 | 07-16988-2.hg | Sequence: 8CHKSUM Content: 52449 Layout: 35215 Graphics: No Graphics CLEAN
JOB: 07-16988-2 CYCLE#;BL#: 13; 0 TRIM: 7.75" x 9.75" AS: Merrill Chicago: 312-786-6300 COMPOSITECOLORS: Black, PANTONE 541 U, ~note-color 2 GRAPHICS: none V1.5
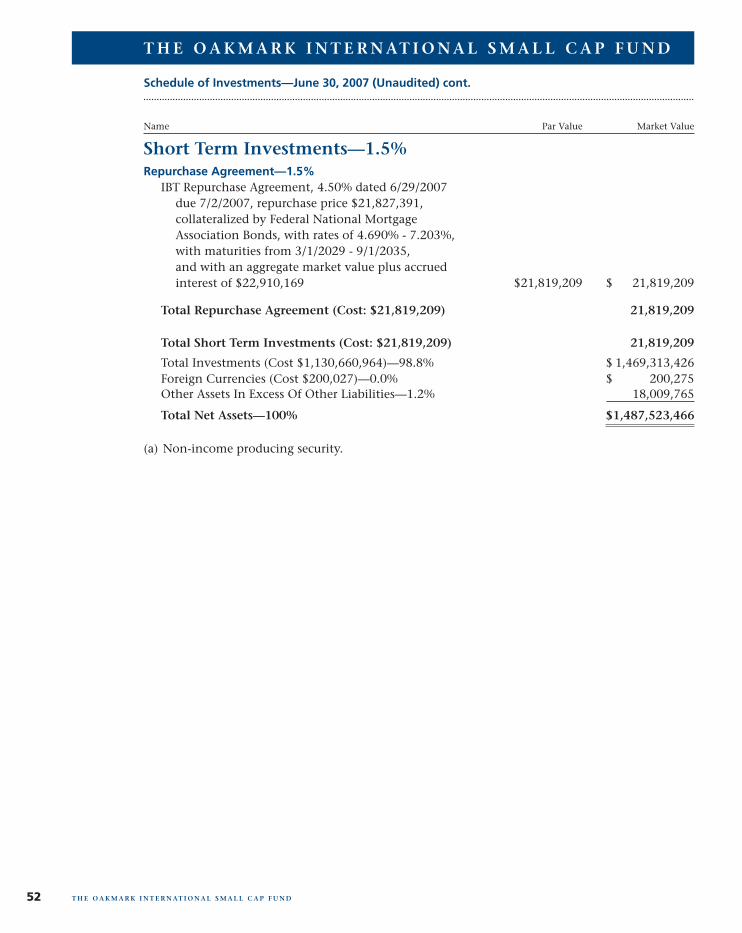
Short Term Investments—1.5%
Schedule of Investments—June 30, 2007 (Unaudited) cont.
Name Par Value Market Value
T H E O A K M A R K I N T E R N AT I O N A L S M A L L C A P F U N D
T H E O A K M A R K I N T E R N AT I O N A L S M A L L C A P F U N D52
Repurchase Agreement—1.5%IBT Repurchase Agreement, 4.50% dated 6/29/2007
due 7/2/2007, repurchase price $21,827,391,collateralized by Federal National MortgageAssociation Bonds, with rates of 4.690% - 7.203%,with maturities from 3/1/2029 - 9/1/2035,and with an aggregate market value plus accruedinterest of $22,910,169 $21,819,209 $ 21,819,209
Total Repurchase Agreement (Cost: $21,819,209) 21,819,209
Total Short Term Investments (Cost: $21,819,209) 21,819,209
Total Investments (Cost $1,130,660,964)—98.8% $ 1,469,313,426Foreign Currencies (Cost $200,027)—0.0% $ 200,275Other Assets In Excess Of Other Liabilities—1.2% 18,009,765
Total Net Assets—100% $1,487,523,466
(a) Non-income producing security.
Merrill Corp - Harris-Oakmark 3rd Quarterly Report [Funds] 07-31-2007 [AUX] | sgirard | 26-Jul-07 16:52 | 07-16988-2.hg | Sequence: 9CHKSUM Content: 60381 Layout: 45762 Graphics: No Graphics CLEAN
JOB: 07-16988-2 CYCLE#;BL#: 13; 0 TRIM: 7.75" x 9.75" AS: Merrill Chicago: 312-786-6300 COMPOSITECOLORS: Black, PANTONE 541 U, ~note-color 2 GRAPHICS: none V1.5
This material must be preceded or accompanied by a prospectus. To order a prospectus, which explains management feesand expenses and the special risks of investing in the Funds, visit oakmark.com or call 1-800-OAKMARK. Please read theprospectus carefully before investing.
The discussion the Funds’ investments and investment strategies (including current investment themes, the portfoliomanagers’ research and investment process, and portfolio characteristics) represents the Funds’ investments and the viewsof the portfolio managers and Harris Associates L.P., the Funds’ investment adviser, at the time of this report, and aresubject to change without notice.
The performance data quoted represents past performance. Past performance does not guarantee future results.The investment return and principal value will fluctuate so that an investor’s shares, when redeemed, may be worth moreor less than their original cost. Current performance may be lower or higher than the performance data quoted. Aver-age annual total return measures annualized change, while total return measures aggregate change. To obtain most recentmonth-end performance data visit oakmark.com.
The performance information for Class I shares of The Oakmark Fund, The Oakmark Select Fund, The Oakmark Equity &Income Fund, The Oakmark Global Fund, The Oakmark Global Select Fund, The Oakmark International Fund and TheOakmark International Small Cap Fund does not reflect the imposition of a 2% redemption fee on shares held by aninvestor for 90 days or less. The purpose of this redemption fee is to deter market timers.
Investing in value stocks presents the risk that value stocks may fall out of favor with investors andunderperform growth stocks during given periods.
Because The Oakmark Select Fund and The Oakmark Global Select Fund are non-diversified, the per-formance of each holding will have a greater impact on each Fund’s total return, and may make theFunds’ returns more volatile than a more diversified fund.
The Oakmark Equity and Income Fund closed to certain new investors as of 5/7/04.
The Oakmark Equity and Income Fund invests in medium- and lower-quality debt securities that havehigher yield potential but present greater investment and credit risk than higher-quality securities,which may result in greater share price volatility. An economic downturn could severely disrupt themarket in medium or lower grade debt securities and adversely affect the value of outstanding bondsand the ability of the issuers to repay principal and interest.
The Oakmark Global Fund and The Oakmark International Fund closed to certain new investors as of12/15/03.
The Oakmark International Small Cap Fund closed to new investors as of 5/10/02.
Investing in foreign securities represents risks which in some way may be greater than in U.S. invest-ments. Those risks include: currency fluctuation; different regulation, accounting standards, tradingpractices and levels of available information; generally higher transaction costs; and political risks.
The stocks of smaller companies often involve more risk than the stocks of larger companies. Stocksof small companies tend to be more volatile and have a smaller public market than stocks of larger com-panies. Small companies may have a shorter history of operations than larger companies, may not haveas great an ability to raise additional capital and may have a less diversified product line, making themmore susceptible to market pressure.
1. Total return includes change in share prices and in each case includes reinvestment of any dividends and capital gaindistributions.
2. Portfolio holdings are subject to change without notice and are not intended as recommendations of individualstocks.
3. The Price-Earnings Ratio (“P/E”) is the most common measure of the expensiveness of a stock.
4. The quoted passage is taken from CDW to go Private in $7.3 Billion deal, Madison Dearborn offers 16% Premiumfor Shares written by Mike Hughlett and Becky Yerak published by the Chicago Tribune, Online Edition on May 30,2007.
53T H E O A K M A R K F U N D S
Merrill Corp - Harris-Oakmark 3rd Quarterly Report [Funds] 07-31-2007 [AUX] | sgirard | 26-Jul-07 16:53 | 07-16988-2.la | Sequence: 1CHKSUM Content: 65116 Layout: 20993 Graphics: No Graphics CLEAN
JOB: 07-16988-2 CYCLE#;BL#: 13; 0 TRIM: 7.75" x 9.75" AS: Merrill Chicago: 312-786-6300 COMPOSITECOLORS: Black, PANTONE 364 U, ~note-color 2 GRAPHICS: none V1.5
5. The S&P 500 Index is a broad market-weighted average of U.S. blue-chip companies. This index is unmanaged andinvestors cannot actually make investments in this index.
6. The Dow Jones Industrial Average is an unmanaged index that includes only 30 big companies. This index isunmanaged and investors cannot invest directly in this index.
7. The Lipper Large Cap Value Fund Index is an equally weighted index of the largest 30 funds within the large capvalue funds investment objective as defined by Lipper Inc. The index is adjusted for the reinvestment of capital gainsand income dividends. This index is unmanaged and investors cannot invest directly in this index.
8. The Lipper Multi-Cap Value Funds Index tracks the results of the 30 largest mutual funds in the Lipper Multi-CapValue Funds category. This index is unmanaged and investors cannot invest directly in this index.
9. The Lipper Balanced Fund Index measures the performance of the 30 largest U.S. balanced funds tracked by Lipper.This index is unmanaged and investors cannot invest directly in this index.
10. Lehman Brothers Government/Corporate Bond Index is a benchmark index made up of the Lehman Brothers Gov-ernment and Corporate Bond indexes, including U.S. government Treasury and agency securities as well as corporateand Yankee bonds. This index is unmanaged and investors cannot invest directly in this index.
11. The quoted passage and figures are taken from The Big One written by Stephanie Pomboy published by MacroMavenson June 29, 2007.
12. The MSCI World Index is a free float-adjusted market capitalization index that is designed to measure global devel-oped market equity performance. As of June 2006 the MSCI World Index consisted of the following 23 developedmarket country indices: Australia, Austria, Belgium, Canada, Denmark, Finland, France, Germany, Greece, HongKong, Ireland, Italy, Japan, Netherlands, New Zealand, Norway, Portugal, Singapore, Spain, Sweden, Switzerland, theUnited Kingdom and the United States. This index is unmanaged and investors cannot invest directly in this index.
13. The Lipper Global Fund Index measures the performance of the 30 largest mutual funds that invest in securitiesthroughout the world. This index is unmanaged and investors cannot invest directly in this index.
14. The MSCI World Index ex U.S. is a free float-adjusted market capitalization index that is designed to measure globaldeveloped market equity performance. As of June 2006 the MSCI World Index consisted of the following 22 devel-oped market country indices: Australia, Austria, Belgium, Canada, Denmark, Finland, France, Germany, Greece, HongKong, Ireland, Italy, Japan, Netherlands, New Zealand, Norway, Portugal, Singapore, Spain, Sweden, Switzerland, andthe United Kingdom. This index is unmanaged and investors cannot invest directly in this index.
15. The MSCI EAFE Index (Europe, Australasia, Far East) is a free float-adjusted market capitalization index that isdesigned to measure developed market equity performance, excluding the US & Canada. As of June 2006 theMSCI EAFE Index consisted of the following 21 developed market country indices: Australia, Austria, Belgium, Den-mark, Finland, France, Germany, Greece, Hong Kong, Ireland, Italy, Japan, the Netherlands, New Zealand, Norway,Portugal, Singapore, Spain, Sweden, Switzerland and the United Kingdom. This index is unmanaged and investorscannot invest directly in this index.
16. The Lipper International Fund Index reflects the net asset value weighted total return of the 30 largest internationalequity funds. This index is unmanaged and investors cannot invest directly in this index.
17. The MSCI World ex U.S. Small Cap Index is the small cap component of the MSCI World ex U.S. Standard Index.Securities selected represent 40% of the small cap asset class in each developed market on a capitalization-weightedbasis. This index is unmanaged and investors cannot invest directly in this index.
18. The Lipper International Small Cap Funds Index measures the performance of the 10 largest international small-capfunds tracked by Lipper. This index is unmanaged and investors cannot invest directly in this index.
54 T H E O A K M A R K F U N D S
Merrill Corp - Harris-Oakmark 3rd Quarterly Report [Funds] 07-31-2007 [AUX] | sgirard | 26-Jul-07 16:53 | 07-16988-2.la | Sequence: 2CHKSUM Content: 21034 Layout: 31671 Graphics: No Graphics CLEAN
JOB: 07-16988-2 CYCLE#;BL#: 13; 0 TRIM: 7.75" x 9.75" AS: Merrill Chicago: 312-786-6300 COMPOSITECOLORS: Black, PANTONE 364 U, ~note-color 2 GRAPHICS: none V1.5
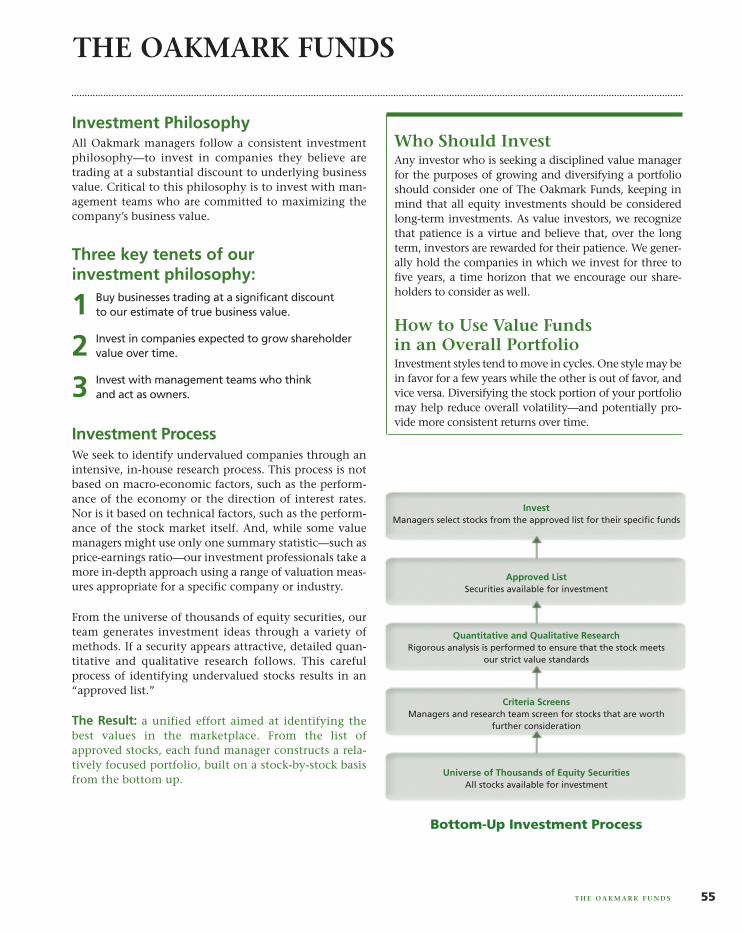
InvestManagers select stocks from the approved list for their specific funds
Approved ListSecurities available for investment
Quantitative and Qualitative ResearchRigorous analysis is performed to ensure that the stock meets
our strict value standards
Criteria ScreensManagers and research team screen for stocks that are worth
further consideration
Bottom-Up Investment Process
Universe of Thousands of Equity SecuritiesAll stocks available for investment
Who Should InvestAny investor who is seeking a disciplined value managerfor the purposes of growing and diversifying a portfolioshould consider one of The Oakmark Funds, keeping inmind that all equity investments should be consideredlong-term investments. As value investors, we recognizethat patience is a virtue and believe that, over the longterm, investors are rewarded for their patience. We gener-ally hold the companies in which we invest for three tofive years, a time horizon that we encourage our share-holders to consider as well.
How to Use Value Funds in an Overall PortfolioInvestment styles tend to move in cycles. One style may bein favor for a few years while the other is out of favor, andvice versa. Diversifying the stock portion of your portfoliomay help reduce overall volatility—and potentially pro-vide more consistent returns over time.
Investment PhilosophyAll Oakmark managers follow a consistent investmentphilosophy—to invest in companies they believe aretrading at a substantial discount to underlying businessvalue. Critical to this philosophy is to invest with man-agement teams who are committed to maximizing thecompany’s business value.
Three key tenets of our investment philosophy:
1 Buy businesses trading at a significant discount to our estimate of true business value.
2 Invest in companies expected to grow shareholdervalue over time.
3 Invest with management teams who think and act as owners.
Investment ProcessWe seek to identify undervalued companies through anintensive, in-house research process. This process is notbased on macro-economic factors, such as the perform-ance of the economy or the direction of interest rates.Nor is it based on technical factors, such as the perform-ance of the stock market itself. And, while some valuemanagers might use only one summary statistic—such asprice-earnings ratio—our investment professionals take amore in-depth approach using a range of valuation meas-ures appropriate for a specific company or industry.
From the universe of thousands of equity securities, ourteam generates investment ideas through a variety ofmethods. If a security appears attractive, detailed quan-titative and qualitative research follows. This carefulprocess of identifying undervalued stocks results in an“approved list.”
The Result: a unified effort aimed at identifying thebest values in the marketplace. From the list of approved stocks, each fund manager constructs a rela-tively focused portfolio, built on a stock-by-stock basisfrom the bottom up.
THE OAKMARK FUNDS
T H E O A K M A R K F U N D S 55
Merrill Corp - Harris-Oakmark 3rd Quarterly Report [Funds] 07-31-2007 [AUX] | sgirard | 26-Jul-07 16:53 | 07-16988-2.la | Sequence: 3CHKSUM Content: 10015 Layout: 12066 Graphics: 63918 CLEAN
JOB: 07-16988-2 CYCLE#;BL#: 13; 0 TRIM: 7.75" x 9.75" AS: Merrill Chicago: 312-786-6300 COMPOSITECOLORS: Black, PANTONE 364 U, ~note-color 2 GRAPHICS: Bot-Up Invst Pros.eps V1.5
Multiple – A ratio used to measure a stock’s valua-tion, usually greater than 1. Sometimes used to meanprice/earnings ratio.
P/B or Price-to-Book Ratio – A stock’s capitalizationdivided by its book value. The value is the same whetherthe calculation is done for the whole company or on aper-share basis.
P/E or Price-to-Earnings Ratio – The most commonmeasure of a stock’s valuation. It is equal to a stock’scapitalization divided by its after-tax earnings over a12-month period. The value is the same whether thecalculation is done for the whole company or on aper-share basis. Equivalently, the cost an investor ina given stock must pay per dollar of current annualearnings. Also called earnings multiple.
Share repurchase – Program through which a corpo-ration buys back its own shares in the open market,typically an indication that the corporation’s man-agement believes the stock price is undervalued.
Value investing – Investors who utilize valuationmeasures such as business value (including growthrate), price/earnings ratio, price/book ratio, and yieldto gauge the attractiveness of a company. Managerswho employ a value investment style believe that thetrue, underlying value of a company is not reflectedin its current share price, and, over time, the pricehas potential to increase as the market recognizes theoverall value of the business. Value stocks sell at rel-atively low prices in relation to their underlyingbusiness value, earnings, or book value.
Stocks become undervalued for a variety of rea-sons, including an overall market decline, or when aspecific industry falls into disfavor and investors viewall companies in that industry in the same light. Con-sequently, an individual company’s stock price mayfall, even though it may be only temporarily affectedby the industry’s problems and its underlying valuehas remained unchanged.
“x times earnings” (“12 times earnings”) – Another wayto express a stock’s price-to-earnings (P/E) ratio. Astock with a P/E ratio of 12 sells at 12 times earnings.
Book value – A company’s common stock equity as itappears on a balance sheet, equal to total assets minusliabilities, preferred stock, and intangible assets such asgoodwill. A company’s book value often differs sub-stantially from economic value, especially in industriessuch as media.
Business value/Intrinsic value – The perceived or esti-mated actual value of a security, as opposed to itscurrent market price or book value. Business valuecan be evaluated based on what a knowledgeablebuyer would pay for a business if the company weresold in its entirety.
Growth investing – Investors who look for companiesbased on whether the stock of a company is growingearnings and/or revenue faster than the industry as awhole or the overall market. Growth investors gen-erally expect high rates of growth to persist, and thestock, in turn, to deliver returns exceeding the mar-ket’s. A growth mutual fund is generally one thatemphasizes stocks believed to offer above-averagegrowth prospects, with little to no emphasis on thestock’s current price.
M & A (Mergers & Acquisitions) – Merger: the com-bining of two or more entities into one, through apurchase acquisition or a pooling of interests. Acqui-sition: can also be called a takeover, and is defined asacquiring control of a corporation, called a target, bystock purchase or exchange, either hostile or friendly.
Market capitalization (market cap or cap) – The mar-ket price of an entire company on any given day,calculated by multiplying the number of sharesoutstanding by the price per share.
Momentum investing – Approach to investing basedon the belief that stock price trends are likely to con-tinue. Momentum investors tend to buy stocks thathave been outperforming the market and to sell thosestocks when their relative performance deteriorates.Momentum investors do not consider a company’sunderlying value or fundamentals in their invest-ment decisions.
T H E O A K M A R K F U N D S
The Oakmark Glossary
56
Merrill Corp - Harris-Oakmark 3rd Quarterly Report [Funds] 07-31-2007 [AUX] | sgirard | 26-Jul-07 16:53 | 07-16988-2.la | Sequence: 4CHKSUM Content: 6983 Layout: 4821 Graphics: No Graphics CLEAN
JOB: 07-16988-2 CYCLE#;BL#: 13; 0 TRIM: 7.75" x 9.75" AS: Merrill Chicago: 312-786-6300 COMPOSITECOLORS: Black, PANTONE 364 U, ~note-color 2 GRAPHICS: none V1.5
THE OAKMARK FUNDSTrustees and Officers
TrusteesGary N. Wilner, M.D.—ChairmanMichael J. FridussThomas H. HaydenChristine M. MakiJohn R. RaittAllan J. ReichSteven S. RogersMarv R. RotterBurton W. RuderPeter S. Voss
OfficersJohn R. Raitt—PresidentRobert M. Levy—Executive Vice PresidentHenry R. Berghoef—Vice PresidentChad M. Clark—Vice PresidentRichard J. Gorman—Vice President and
Assistant SecretaryKevin G. Grant—Vice PresidentDavid G. Herro—Vice PresidentJohn J. Kane—TreasurerClyde S. McGregor—Vice PresidentWilliam C. Nygren—Vice PresidentVineeta D. Raketich—Vice PresidentJanet L. Reali—Vice President and SecretaryKristi L. Rowsell—Vice PresidentEdward A. Studzinski—Vice PresidentRobert A. Taylor—Vice PresidentChristopher P. Wright—Vice President
Other Information
Investment AdviserHarris Associates L.P.Two North LaSalle StreetChicago, Illinois 60602-3790
Transfer AgentBoston Financial Data Services, Inc.Quincy, Massachusetts
Legal CounselBell, Boyd & Lloyd LLPChicago, Illinois
Independent Registered PublicAccounting Firm
Deloitte & Touche LLPChicago, Illinois
For More InformationPlease call 1-800-OAKMARK(1-800-625-6275)or 617-483-3250
Websiteoakmark.com
To obtain a prospectus, an application or periodic reports, access our web site at oakmark.com, or call 1-800-OAKMARK (1-800-625-6275) or (617) 483-3250.
The Funds will file its complete schedule of portfolio holdings with the Securities and Exchange Commission(the “SEC”) for the first and third quarters of each fiscal year on Form N-Q. The Funds’ Forms N-Q are availableon the SEC’s website at www.sec.gov. The Funds’ Forms N-Q may be reviewed and copied at the SEC’s PublicReference Room in Washington, DC, and information on the operation of the Public Reference Room may beobtained by calling 1-800-SEC-0330.
A description of the policies and procedures the Funds use to determine how to vote proxies relating toportfolio securities is available without charge, upon request, by calling toll-free 1-800-625-6275; on the Funds’website at oakmark.com; and on the SEC’s website at www.sec.gov.
No later than August 31 of each year, information regarding how the Adviser, on behalf of the Funds, votedproxies relating to the Funds’ portfolio securities for the twelve months ended the preceding June 30 will beavailable through a link on the Funds’ website at oakmark.com and on the SEC’s website at www.sec.gov.
This report is submitted for the general information of the Funds’ shareholders. The report is not authorized fordistribution to prospective investors in the Funds unless it is accompanied or preceded by the Funds’ currentlyeffective prospectus.
No sales charge to the shareholder or to the new investor is made in offering the shares of the Funds, however, ashareholder may incur a 2% redemption fee on an exchange or redemption of Class I shares held for 90 days orless from any Fund.
Merrill Corp - Harris-Oakmark 3rd Quarterly Report [Funds] 07-31-2007 [AUX] | mmonson | 16-Jul-07 05:48 | 07-16988-2.za | Sequence: 1CHKSUM Content: 58976 Layout: 32207 Graphics: No Graphics CLEAN
JOB: 07-16988-2 CYCLE#;BL#: 1; 0 TRIM: 7.75" x 9.75" AS: Merrill Chicago: 312-786-6300 COMPOSITECOLORS: Black, PANTONE 364 U, PANTONE 541 U, ~note-color 2 GRAPHICS: none V1.5

1-8 0 0-OA K MA R Koakmark.com
The Oakmark Funds are distributed by HarrisAssociates Securities L.P., member NASD. Dateof first use: July 2007.
Merrill Corp - Harris-Oakmark 3rd Quarterly Report [Funds] 07-31-2007 [AUX] | mmonson | 16-Jul-07 05:48 | 07-16988-2.za | Sequence: 2CHKSUM Content: 36373 Layout: 40347 Graphics: 56325 CLEAN
JOB: 07-16988-2 CYCLE#;BL#: 1; 0 TRIM: 7.75" x 9.75" AS: Merrill Chicago: 312-786-6300 COMPOSITECOLORS: Black, Cyan, Magenta, PANTONE 541 cmyk, Yellow, Yellow 9%, ~note-color 2, ~note-color 3 GRAPHICS: oakmark_new_4c_logo.eps V1.5


![THIRD QUARTER REPORT€¦ · Advised by Harris Associates L.P. JUNE 30, 2012 THIRD QUARTER REPORT oakmark.com Merrill Corp - Harris-Oakmark 3RD Quarterly Report [Funds] 06-30-2012](https://img.pdfslide.net/doc/110x75/5f34c9abd84f1d45aa03a312/third-quarter-report-advised-by-harris-associates-lp-june-30-2012-third-quarter.jpg)