Embed Size (px)
DESCRIPTION
This slide should advance in 5 seconds. When the mp3 sound file begins to play, open the presentation in slideshow view and then click your mouse in the middle of the screen to begin the auto-advancing. The synched start time is listed on each slide. - PowerPoint PPT Presentation
Citation preview

This slide should advance in 5 seconds
When the mp3 sound file begins to play, open the presentation in slideshow view and then click your mouse in the middle of the screen to begin the auto-advancing. The synched start time is listed on each slide.
JOM 2008 Best Paper Session and Award CeremonyAcademy of Management 2009 Annual MeetingChicago, ILAugust 9, 2009
Kenneth Boyer, Ohio State UniversityMorgan Swink, Michigan State UniversityCo-Editors in Chief
0:05
2008 Best Reviewers Kevin Dooley, Arizona State University Linda Angell, American University of
Sharjah Christian Rossetti, North Carolina State
University Michael Gorman, University of Dayton
0:58
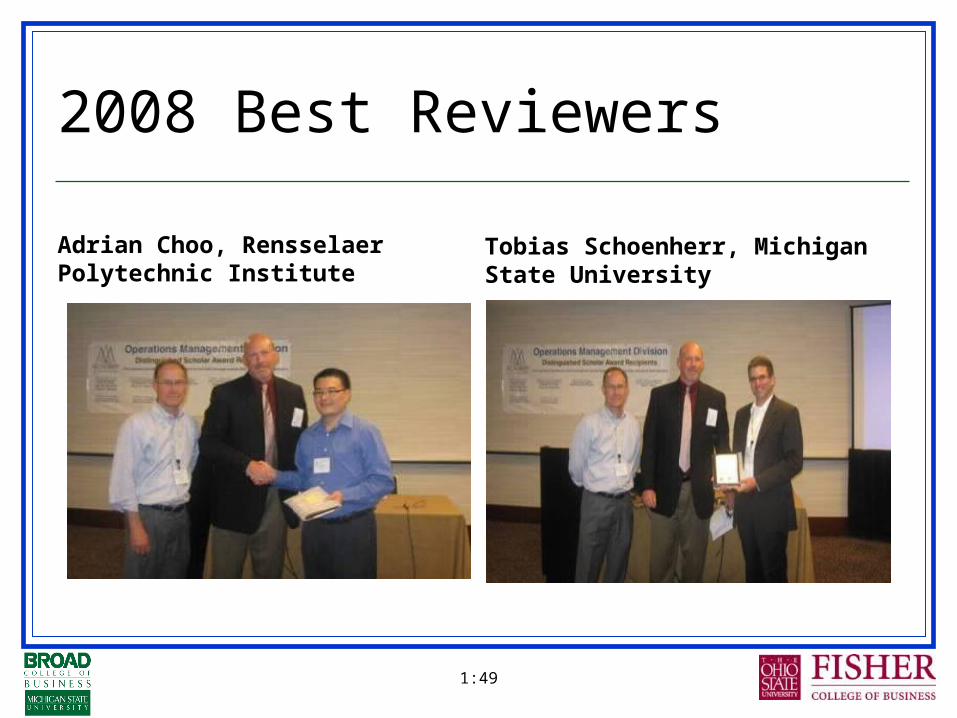
2008 Best Reviewers
Adrian Choo, Rensselaer Polytechnic Institute
Tobias Schoenherr, Michigan State University
1:49
2008 Best Associate Editor Xenophon Koufteros, Texas A & M
University
Congratulations!
2:54
2008 Best Paper Presentations
3:09

Understanding Behavioral Sources of Process Variation Following Enterprise
System Deployment
Elliot Bendoly – Emory UniversityMark Cotteleer – Marquette University
4:24
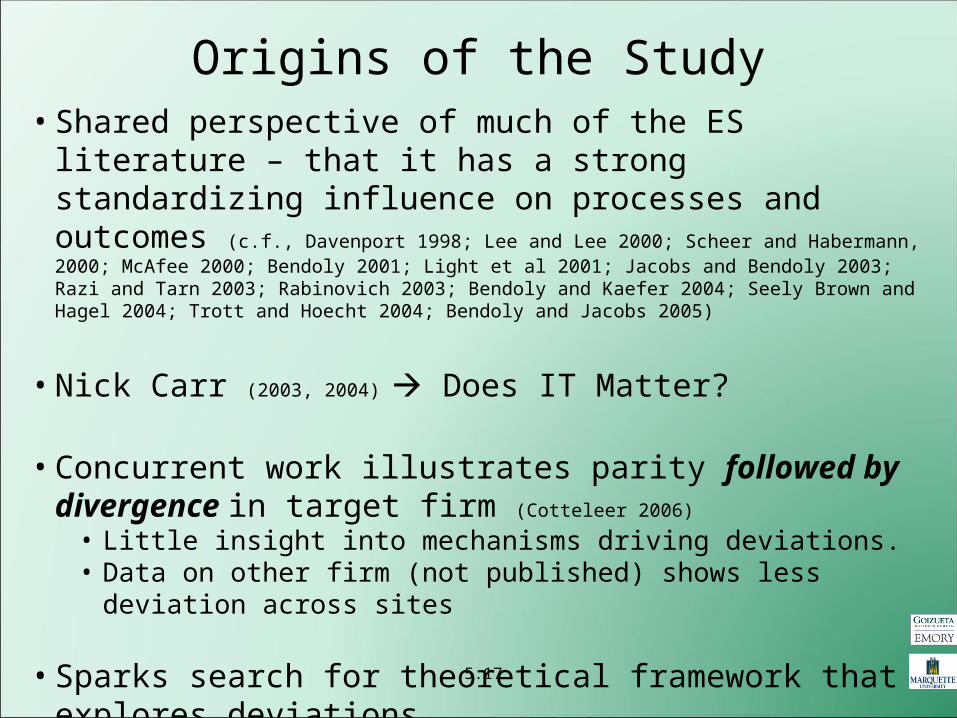
• Shared perspective of much of the ES literature – that it has a strong standardizing influence on processes and outcomes (c.f., Davenport 1998; Lee and Lee 2000; Scheer and Habermann, 2000; McAfee 2000; Bendoly 2001; Light et al 2001; Jacobs and Bendoly 2003; Razi and Tarn 2003; Rabinovich 2003; Bendoly and Kaefer 2004; Seely Brown and Hagel 2004; Trott and Hoecht 2004; Bendoly and Jacobs 2005)
• Nick Carr (2003, 2004) Does IT Matter?
• Concurrent work illustrates parity followed by divergence in target firm (Cotteleer 2006)
• Little insight into mechanisms driving deviations.• Data on other firm (not published) shows less deviation across sites
• Sparks search for theoretical framework that explores deviations.• Cases great for developing “hypotheses and propositions”. (Yin 1994)• But wide array of differences make such field studies difficult when attempting to
isolate specific factors.
Origins of the Study
5:17
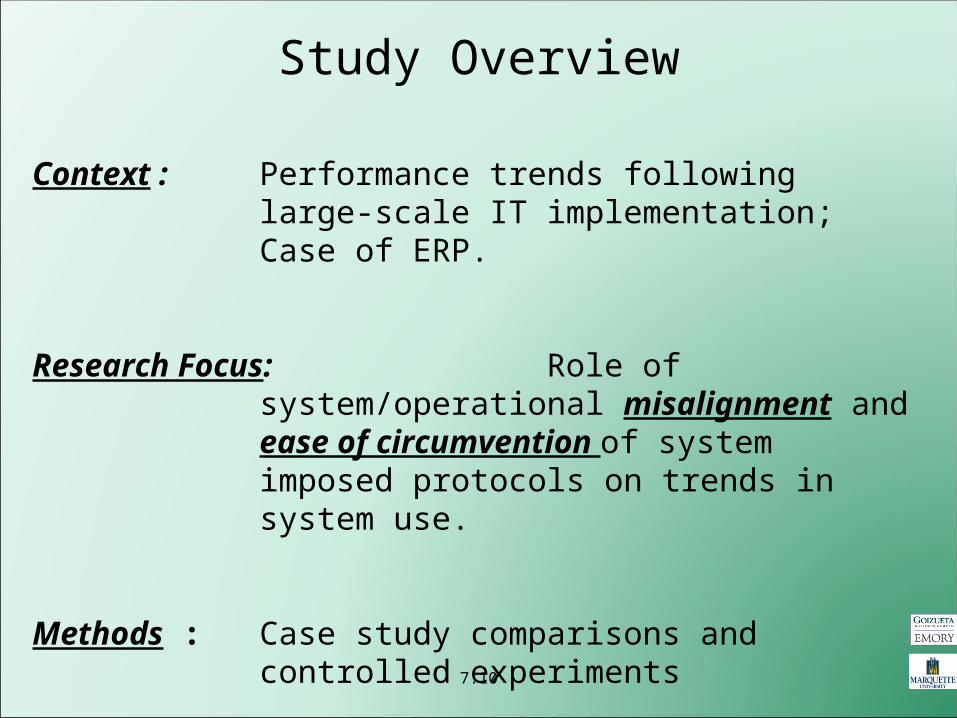
Context : Performance trends following large-scale IT implementation; Case of ERP.
Research Focus: Role of system/operational misalignment and ease of
circumvention of system imposed protocols on trends in system use.
Methods : Case study comparisons and controlled experiments
Study Overview
7:10
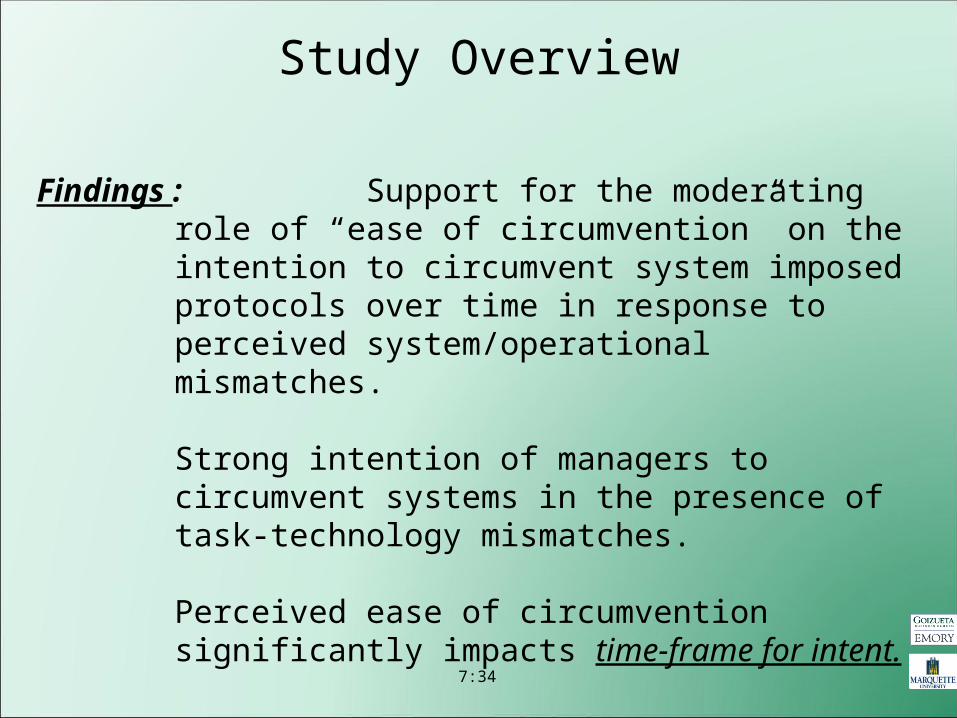
Findings : Support for the moderating role of “ease of circumvention” on the intention to circumvent system imposed protocols over time in response to perceived system/operational mismatches.
Strong intention of managers to circumvent systems in the
presence of task-technology mismatches.
Perceived ease of circumvention significantly impacts time-frame for intent.
Study Overview
7:34
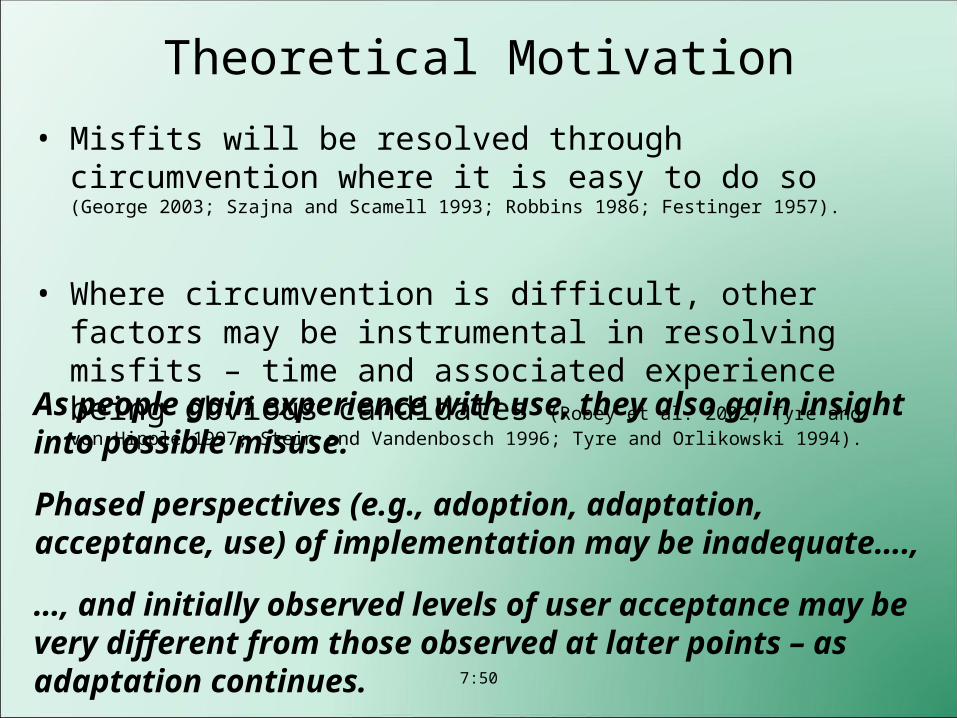
Theoretical Motivation• Misfits will be resolved through circumvention where it is easy to do so
(George 2003; Szajna and Scamell 1993; Robbins 1986; Festinger 1957).
• Where circumvention is difficult, other factors may be instrumental in resolving misfits – time and associated experience being obvious candidates (Robey et al. 2002; Tyre and von Hipple 1997; Stein and Vandenbosch 1996; Tyre and Orlikowski 1994).
As people gain experience with use, they also gain insight into possible misuse.
Phased perspectives (e.g., adoption, adaptation, acceptance, use) of implementation may be inadequate….,
…, and initially observed levels of user acceptance may be very different from those observed at later points – as adaptation continues.
7:50
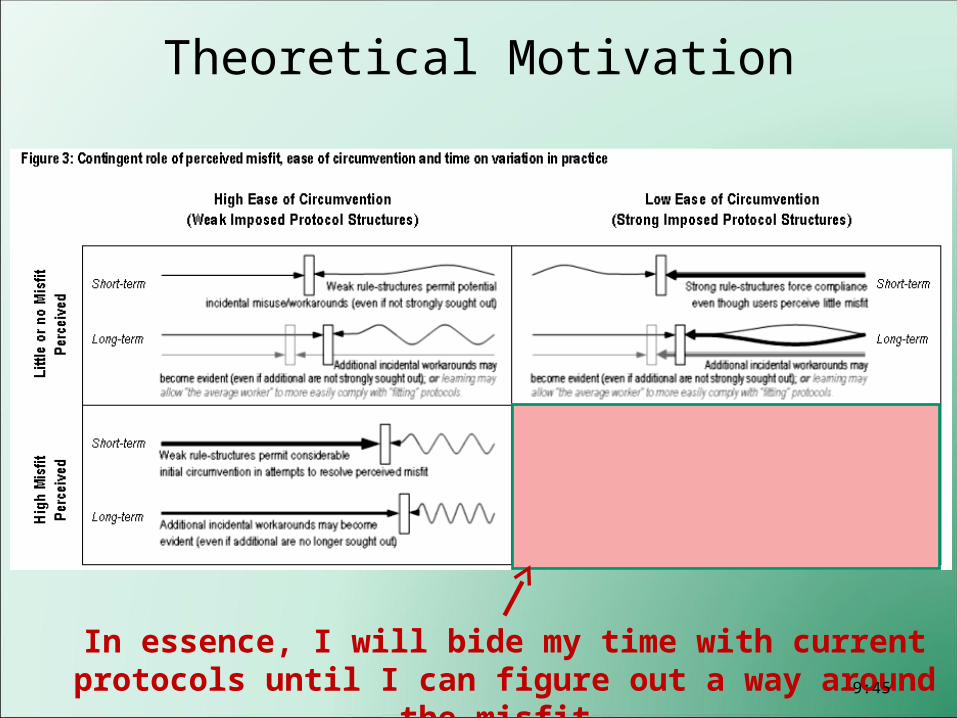
Theoretical Motivation
In essence, I will bide my time with current protocols until I can figure out a way around the misfit. 9:45
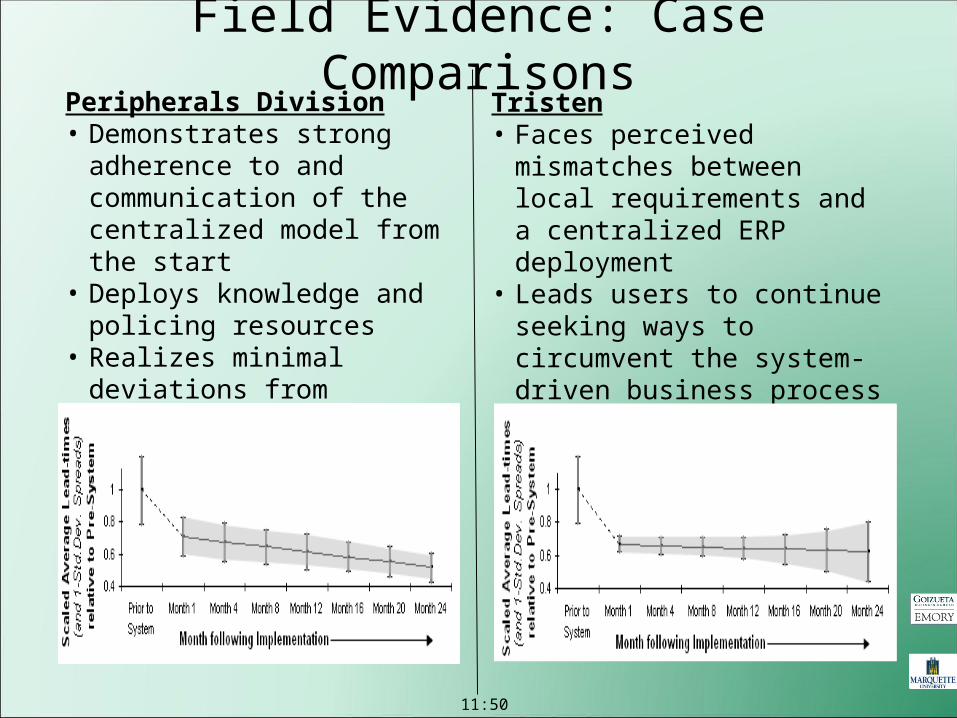
Peripherals Division • Demonstrates strong adherence to and
communication of the centralized model from the start
• Deploys knowledge and policing resources
• Realizes minimal deviations from anticipated long-term results
Tristen• Faces perceived mismatches between
local requirements and a centralized ERP deployment
• Leads users to continue seeking ways to circumvent the system-driven business process
• Management reports focus on unanticipated behavioral phenomena
Field Evidence: Case Comparisons
11:50
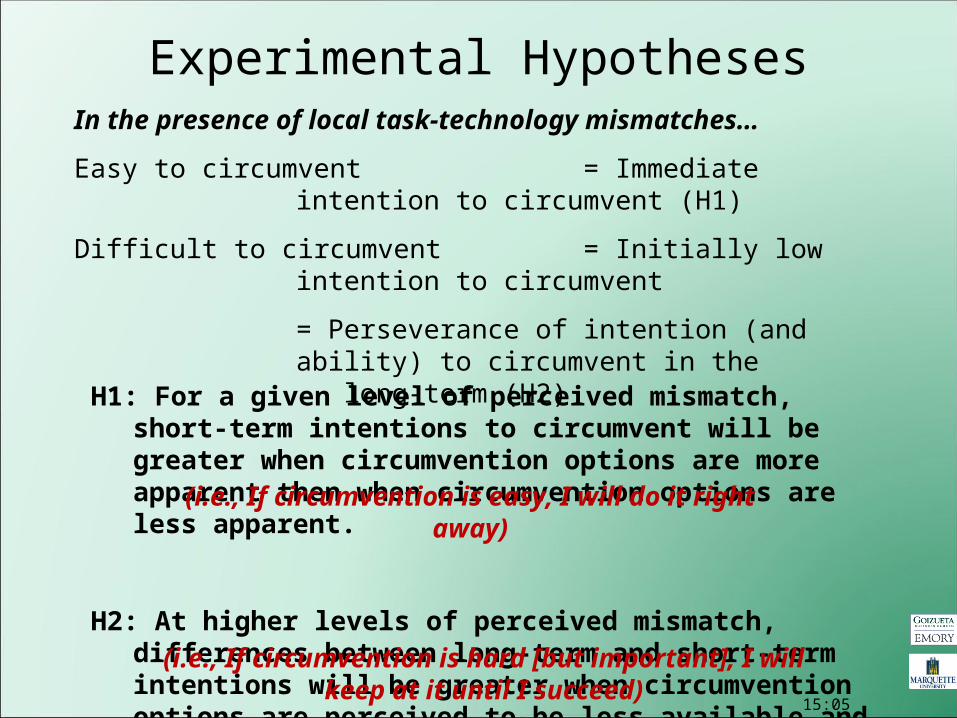
In the presence of local task-technology mismatches…
Easy to circumvent = Immediate intention to circumvent (H1)
Difficult to circumvent = Initially low intention to circumvent
= Perseverance of intention (and ability) to circumvent in the long-term (H2)
H1: For a given level of perceived mismatch, short-term intentions to circumvent will be greater when circumvention options are more apparent then when circumvention options are less apparent.
H2: At higher levels of perceived mismatch, differences between long-term and short-term intentions will be greater when circumvention options are perceived to be less available and obvious.
Experimental Hypotheses
(i.e., If circumvention is easy, I will do it right away)
(i.e., If circumvention is hard [but important], I will keep at it until I succeed)
15:05
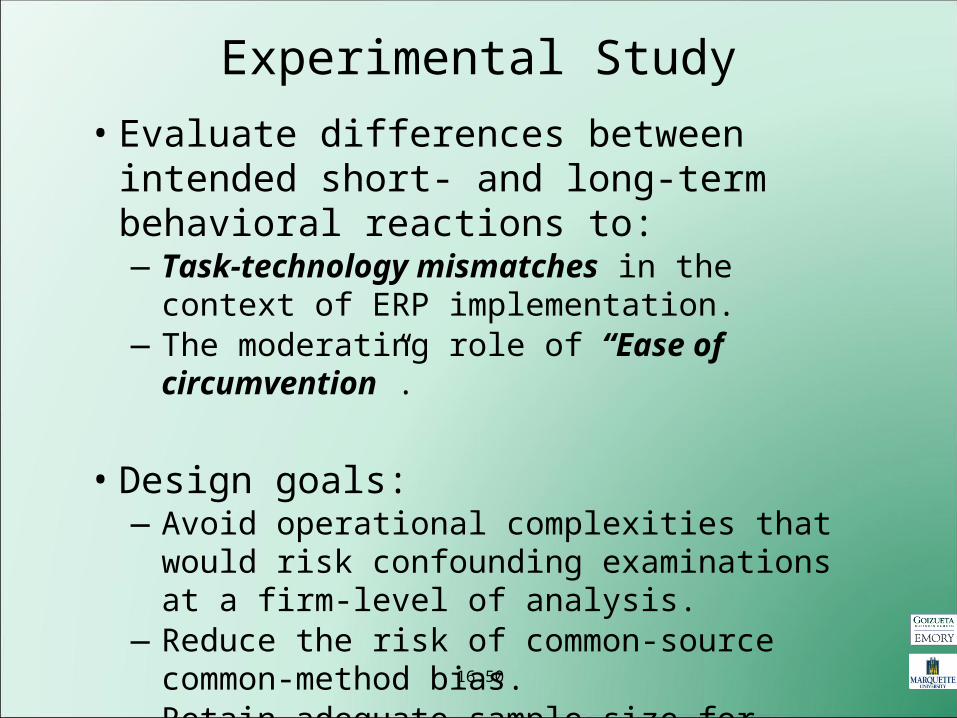
• Evaluate differences between intended short- and long-term behavioral reactions to: ― Task-technology mismatches in the context of ERP
implementation. ― The moderating role of “Ease of circumvention”.
• Design goals:― Avoid operational complexities that would risk confounding
examinations at a firm-level of analysis.― Reduce the risk of common-source common-method bias.― Retain adequate sample size for evaluation.
Experimental Study
16:50
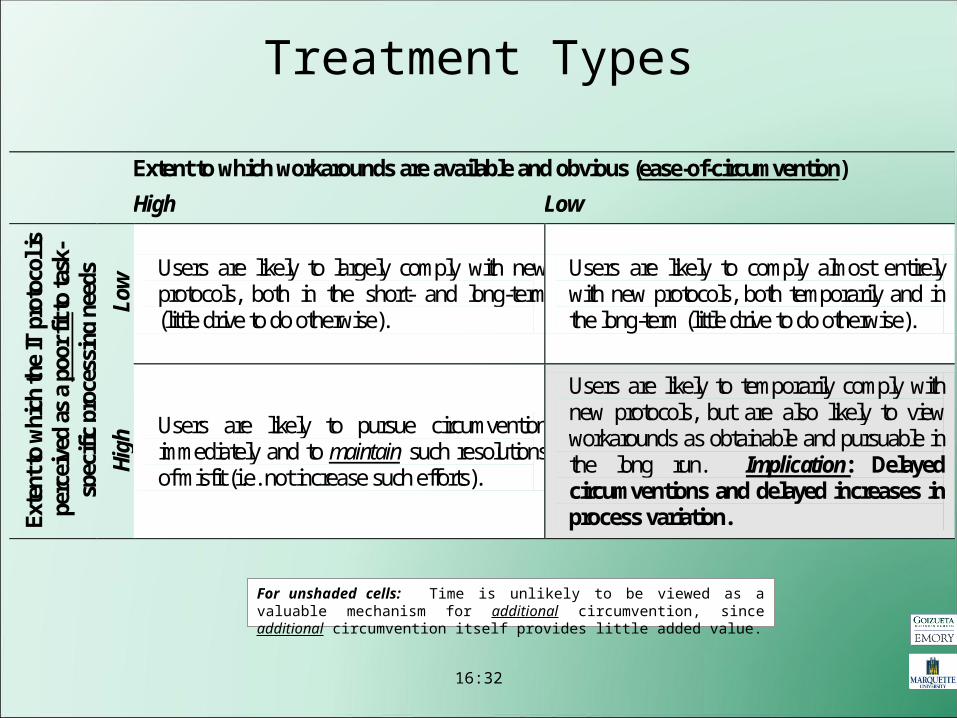
Extent to which workarounds are available and obvious (ease-of-circumvention)
High Low
Exte
nt to
whi
ch th
e IT
pro
toco
l is
perc
eive
d as
a p
oor f
it to
task
-sp
ecifi
c pr
oces
sing
nee
ds
Low
Users are likely to largely comply with new protocols, both in the short- and long-term (little drive to do otherwise).
Users are likely to comply almost entirely with new protocols, both temporarily and in the long-term (little drive to do otherwise).
Hig
h Users are likely to pursue circumvention immediately and to maintain such resolutions of misfit (i.e. not increase such efforts).
Users are likely to temporarily comply with new protocols, but are also likely to view workarounds as obtainable and pursuable in the long run. Implication: Delayed circumventions and delayed increases in process variation.
For unshaded cells: Time is unlikely to be viewed as a valuable mechanism for additional circumvention, since additional circumvention itself provides little added value.
Treatment Types
16:32
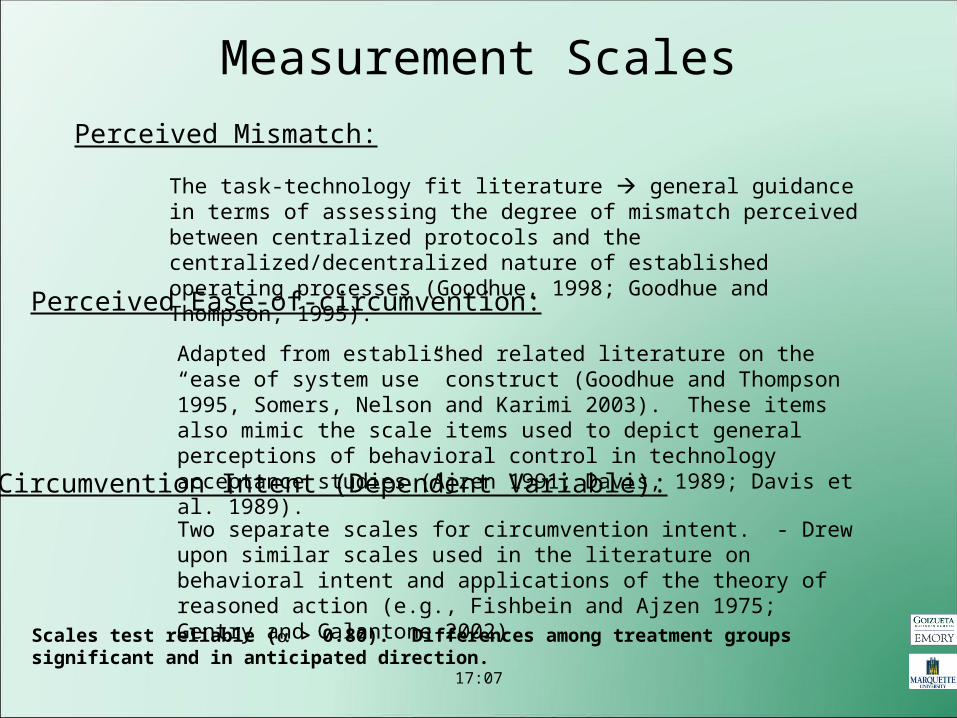
Two separate scales for circumvention intent. - Drew upon similar scales used in the literature on behavioral intent and applications of the theory of reasoned action (e.g., Fishbein and Ajzen 1975; Gentry and Calantone 2002).
Adapted from established related literature on the “ease of system use” construct (Goodhue and Thompson 1995, Somers, Nelson and Karimi 2003). These items also mimic the scale items used to depict general perceptions of behavioral control in technology acceptance studies (Ajzen 1991; Davis, 1989; Davis et al. 1989).
The task-technology fit literature general guidance in terms of assessing the degree of mismatch perceived between centralized protocols and the centralized/decentralized nature of established operating processes (Goodhue, 1998; Goodhue and Thompson, 1995).
Perceived Mismatch:
Perceived Ease-of-circumvention:
Circumvention Intent (Dependent Variable):
Measurement Scales
Scales test reliable ( > 0.80). Differences among treatment groups significant and in anticipated direction.
17:07
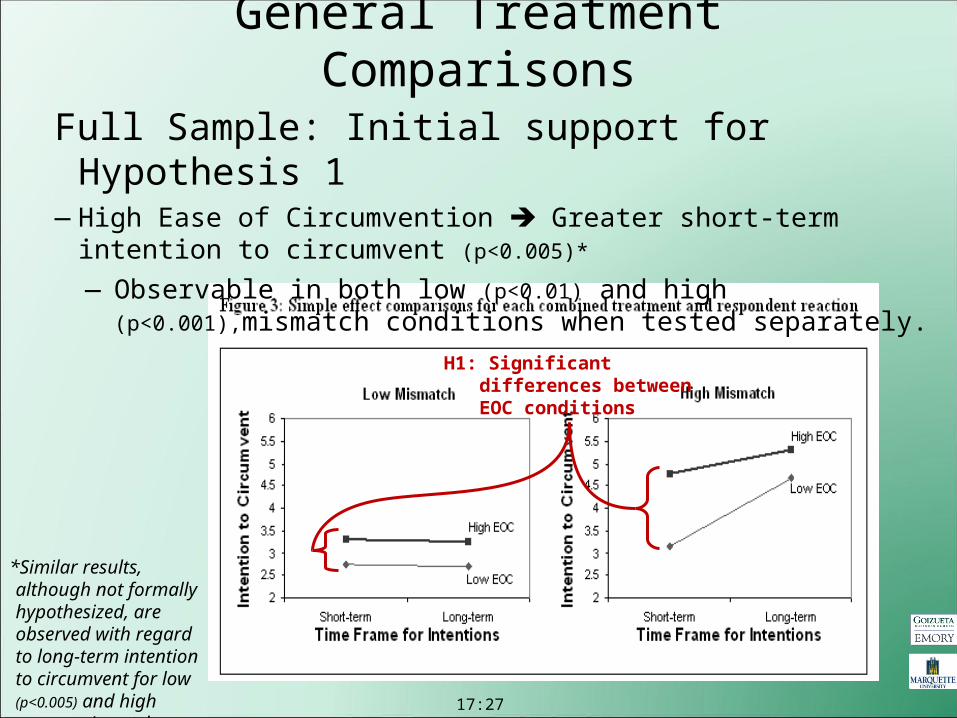
Full Sample: Initial support for Hypothesis 1―High Ease of Circumvention Greater short-term intention to circumvent (p<0.005)*
― Observable in both low (p<0.01) and high (p<0.001),mismatch conditions when tested separately.
General Treatment Comparisons
H1: Significant differences between EOC conditions
*Similar results, although not formally hypothesized, are observed with regard to long-term intention to circumvent for low (p<0.005) and high (p<0.05) mismatch treatments. 17:27
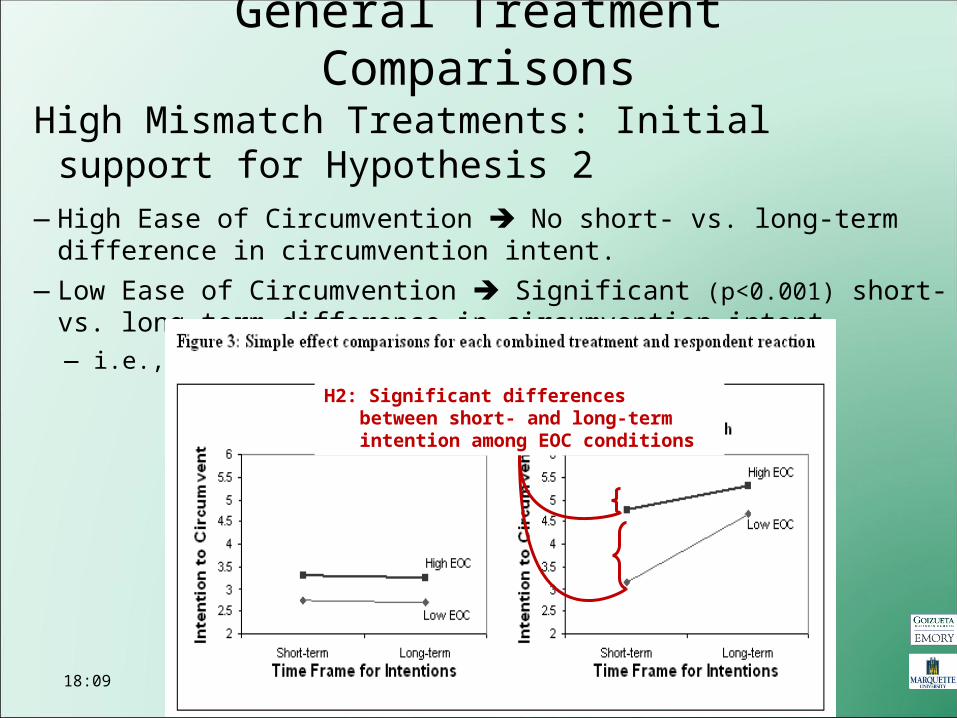
High Mismatch Treatments: Initial support for Hypothesis 2 ―High Ease of Circumvention No short- vs. long-term difference in circumvention intent. ―Low Ease of Circumvention Significant (p<0.001) short- vs. long-term difference in
circumvention intent.― i.e., adopt early but circumvent in the long-term.
General Treatment Comparisons
H2: Significant differences between short- and long-term intention among EOC conditions
18:09
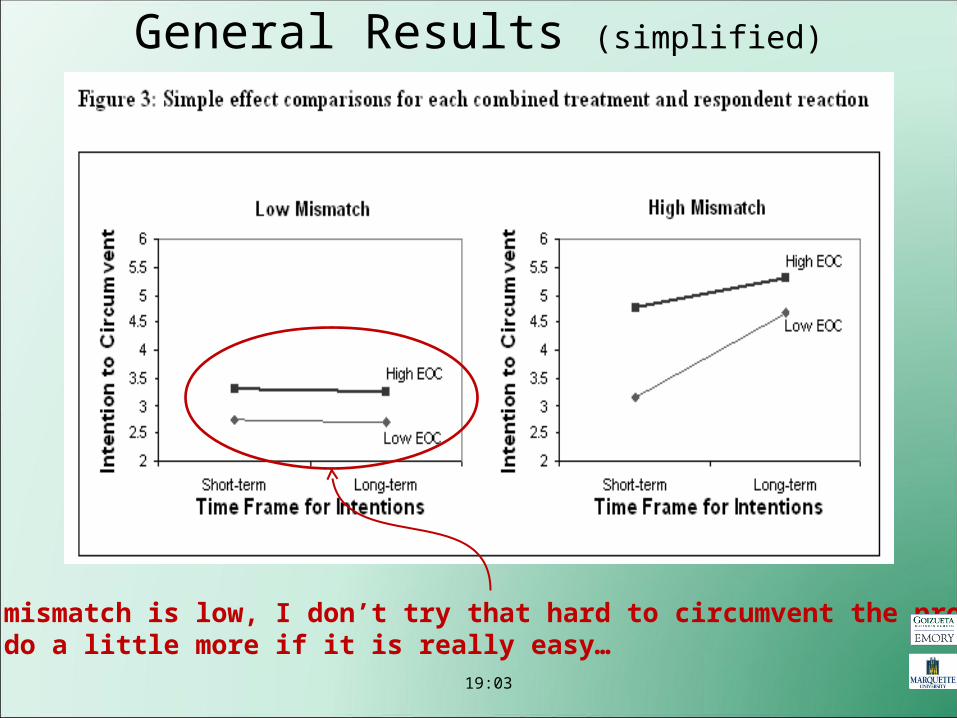
If mismatch is low, I don’t try that hard to circumvent the process•I do a little more if it is really easy…
General Results (simplified)
19:03
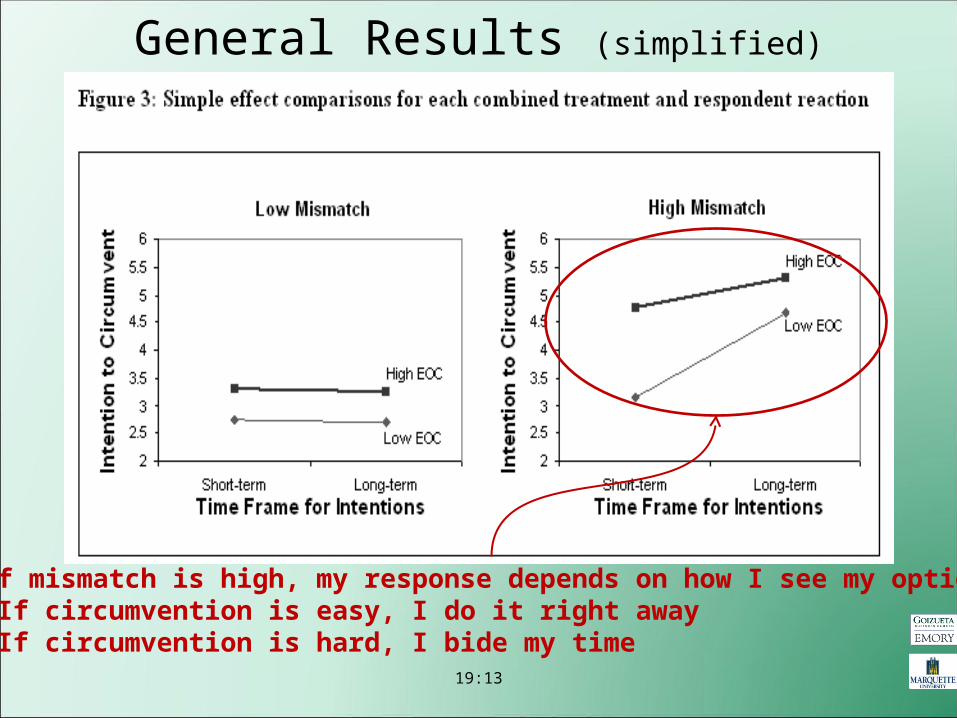
If mismatch is high, my response depends on how I see my options•If circumvention is easy, I do it right away•If circumvention is hard, I bide my time
General Results (simplified)
19:13
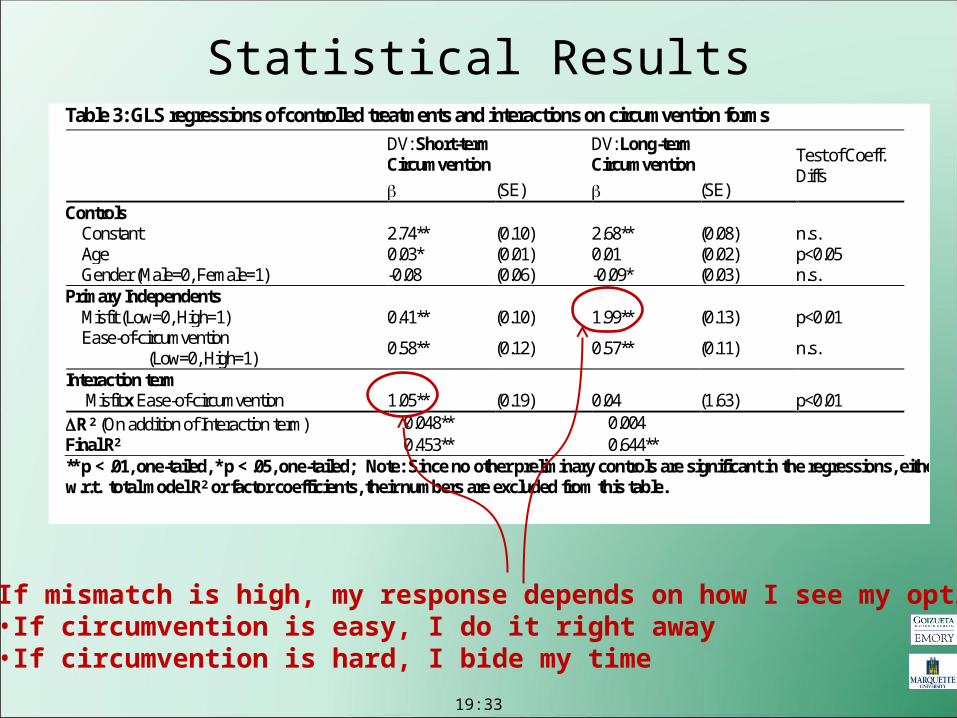
Statistical ResultsTable 3: GLS regressions of controlled treatments and interactions on circumvention forms
** p < .01, one-tailed, * p < .05, one-tailed; Note: Since no other preliminary controls are significant in the regressions, either w.r.t. total model R2 or factor coefficients, their numbers are excluded from this table.
DV: Short-term Circumvention
DV: Long-term Circumvention Test of Coeff.
Diffs (SE) (SE) Controls Constant 2.74** (0.10) 2.68** (0.08) n.s. Age 0.03* (0.01) 0.01 (0.02) p<0.05 Gender (Male=0, Female=1) -0.08 (0.06) -0.09* (0.03) n.s. Primary Independents Misfit (Low=0, High=1) 0.41** (0.10) 1.99** (0.13) p<0.01 Ease-of-circumvention (Low=0, High=1) 0.58** (0.12) 0.57** (0.11) n.s.
Interaction term Misfit x Ease-of-circumvention 1.05** (0.19) 0.04 (1.63) p<0.01 R 2 (On addition of Interaction term) 0.048** 0.004 Final R2 0.453** 0.644**
If mismatch is high, my response depends on how I see my options•If circumvention is easy, I do it right away•If circumvention is hard, I bide my time
19:33
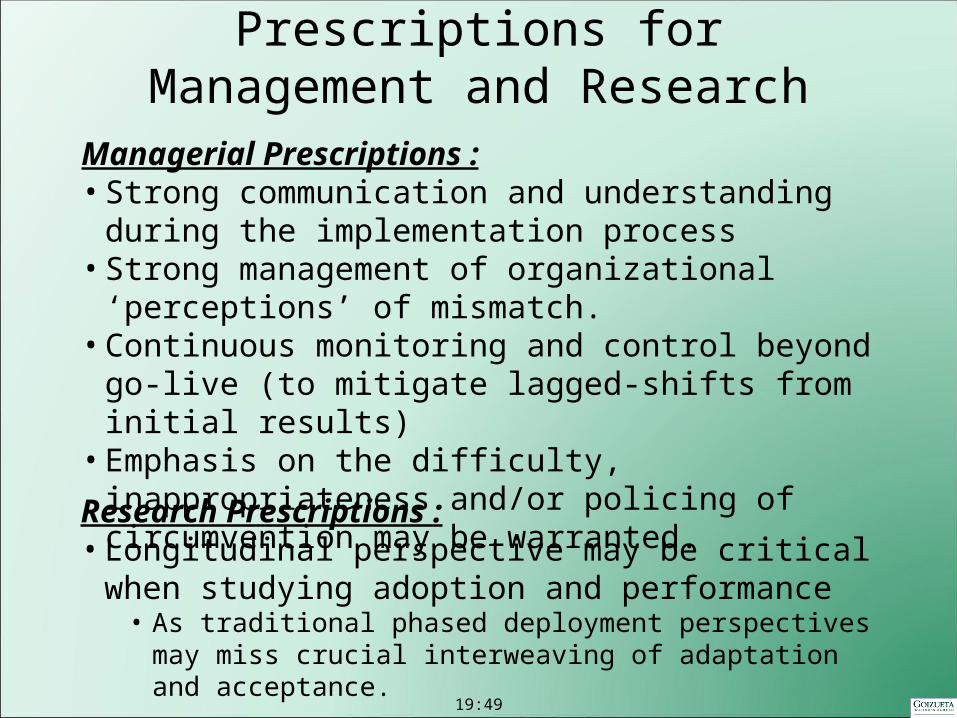
Managerial Prescriptions :• Strong communication and understanding during the
implementation process • Strong management of organizational ‘perceptions’ of mismatch.• Continuous monitoring and control beyond go-live (to mitigate
lagged-shifts from initial results)• Emphasis on the difficulty, inappropriateness and/or policing of
circumvention may be warranted.
Research Prescriptions :• Longitudinal perspective may be critical when studying adoption
and performance• As traditional phased deployment perspectives may miss crucial
interweaving of adaptation and acceptance.
Prescriptions for Management and Research
19:49

Thank you.
Discussion
21:20
AoM 2009Sunday, August 9, 2009
ISO 9000 Practices and Financial Performance: A Technology Coherence Perspective
FRANCISCO VELOSOCarnegie Mellon University andUniversidade Católica Portuguesa
MARY BENNERWharton School of Management
University of Pennsylvania
25:36
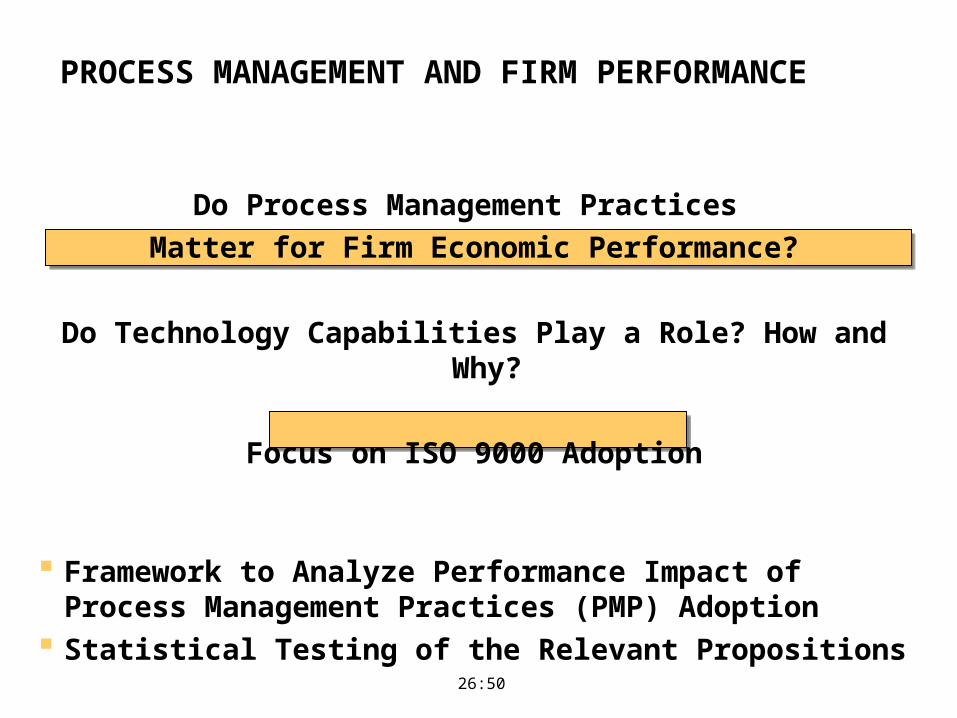
PROCESS MANAGEMENT AND FIRM PERFORMANCE
Do Process Management Practices
Matter for Firm Economic Performance?
Do Technology Capabilities Play a Role? How and Why?
Focus on ISO 9000 Adoption
Framework to Analyze Performance Impact of Process Management Practices (PMP) Adoption
Statistical Testing of the Relevant Propositions
26:50
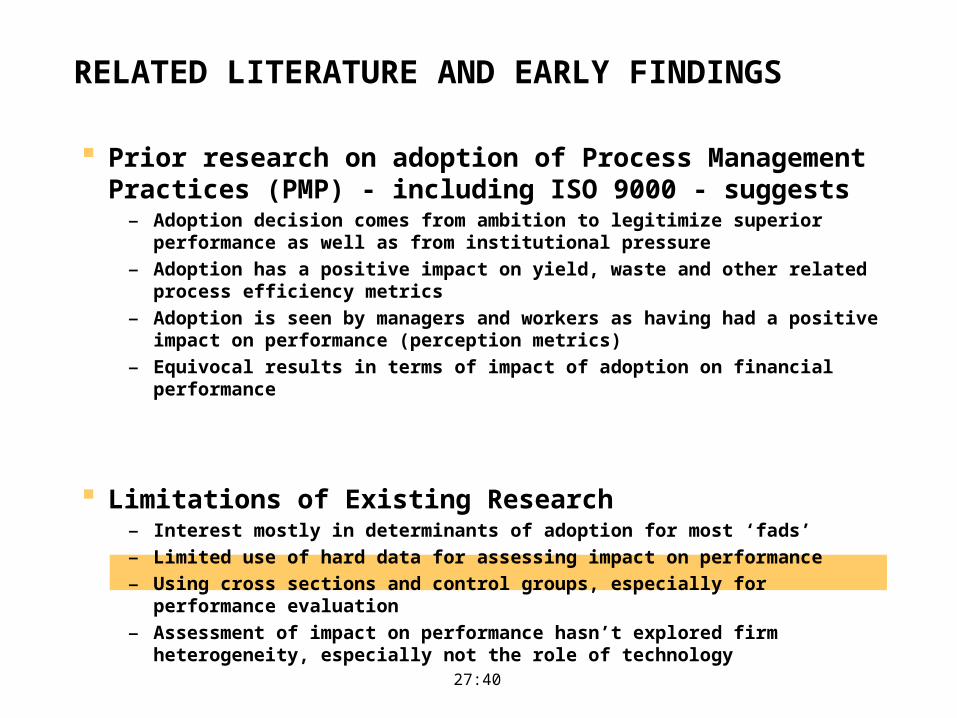
RELATED LITERATURE AND EARLY FINDINGS
Prior research on adoption of Process Management Practices (PMP) - including ISO 9000 - suggests
– Adoption decision comes from ambition to legitimize superior performance as well as from institutional pressure
– Adoption has a positive impact on yield, waste and other related process efficiency metrics
– Adoption is seen by managers and workers as having had a positive impact on performance (perception metrics)
– Equivocal results in terms of impact of adoption on financial performance
Limitations of Existing Research – Interest mostly in determinants of adoption for most ‘fads’
– Limited use of hard data for assessing impact on performance
– Using cross sections and control groups, especially for performance evaluation
– Assessment of impact on performance hasn’t explored firm heterogeneity, especially not the role of technology
27:40
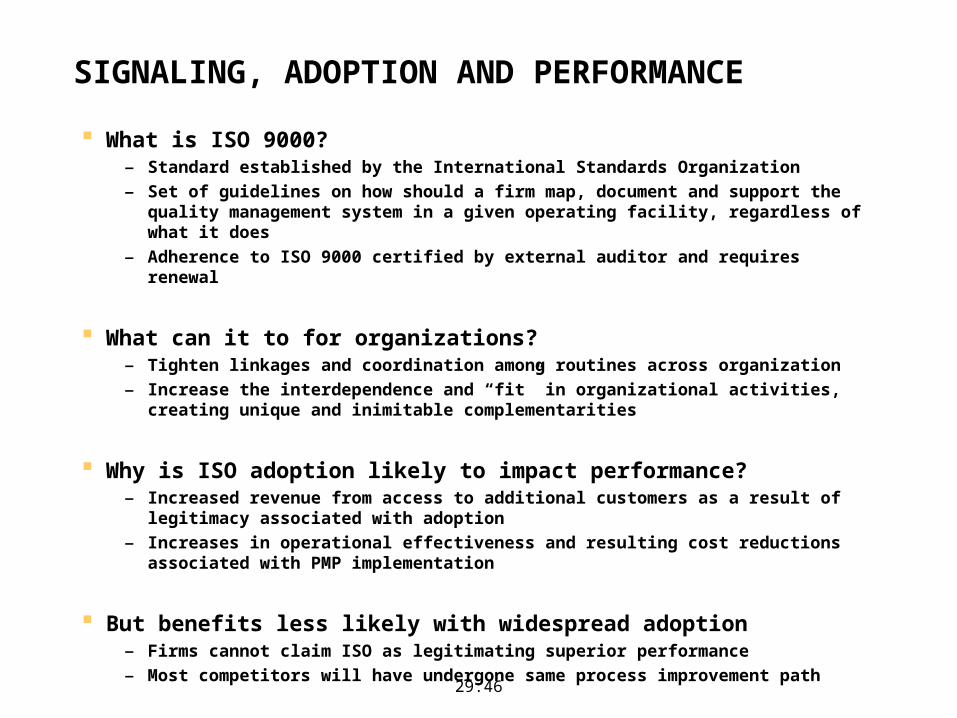
SIGNALING, ADOPTION AND PERFORMANCE
What is ISO 9000?– Standard established by the International Standards Organization
– Set of guidelines on how should a firm map, document and support the quality management system in a given operating facility, regardless of what it does
– Adherence to ISO 9000 certified by external auditor and requires renewal
What can it to for organizations?– Tighten linkages and coordination among routines across organization
– Increase the interdependence and “fit” in organizational activities, creating unique and inimitable complementarities
Why is ISO adoption likely to impact performance?– Increased revenue from access to additional customers as a result of legitimacy
associated with adoption
– Increases in operational effectiveness and resulting cost reductions associated with PMP implementation
But benefits less likely with widespread adoption– Firms cannot claim ISO as legitimating superior performance
– Most competitors will have undergone same process improvement path29:46
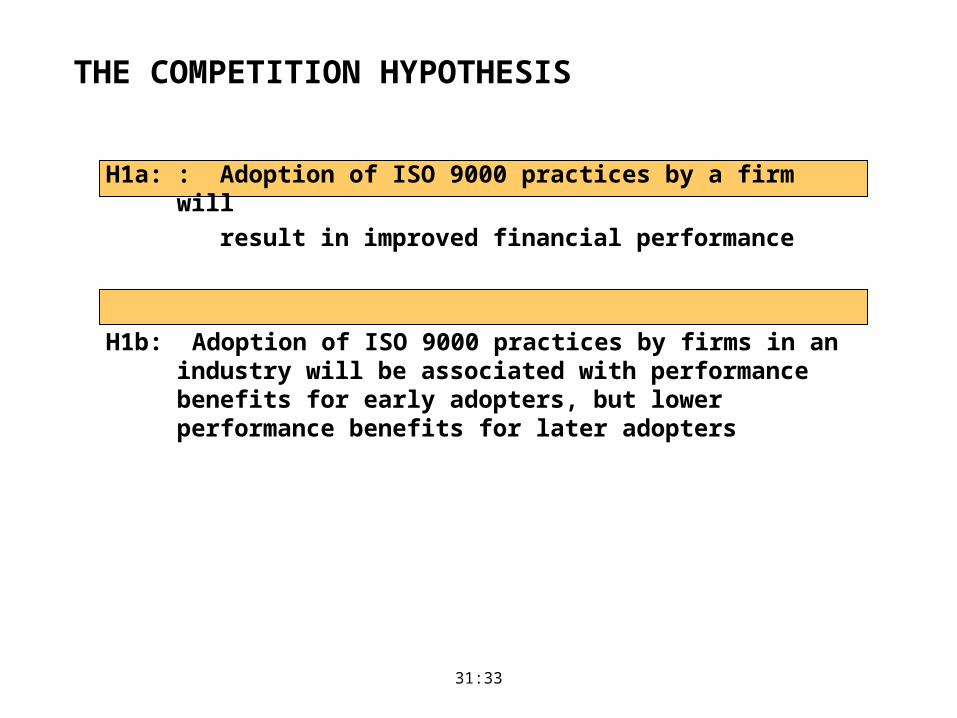
THE COMPETITION HYPOTHESIS
H1a: : Adoption of ISO 9000 practices by a firm will
result in improved financial performance
H1b: Adoption of ISO 9000 practices by firms in an industry will be associated with performance benefits for early adopters, but lower performance benefits for later adopters
31:33
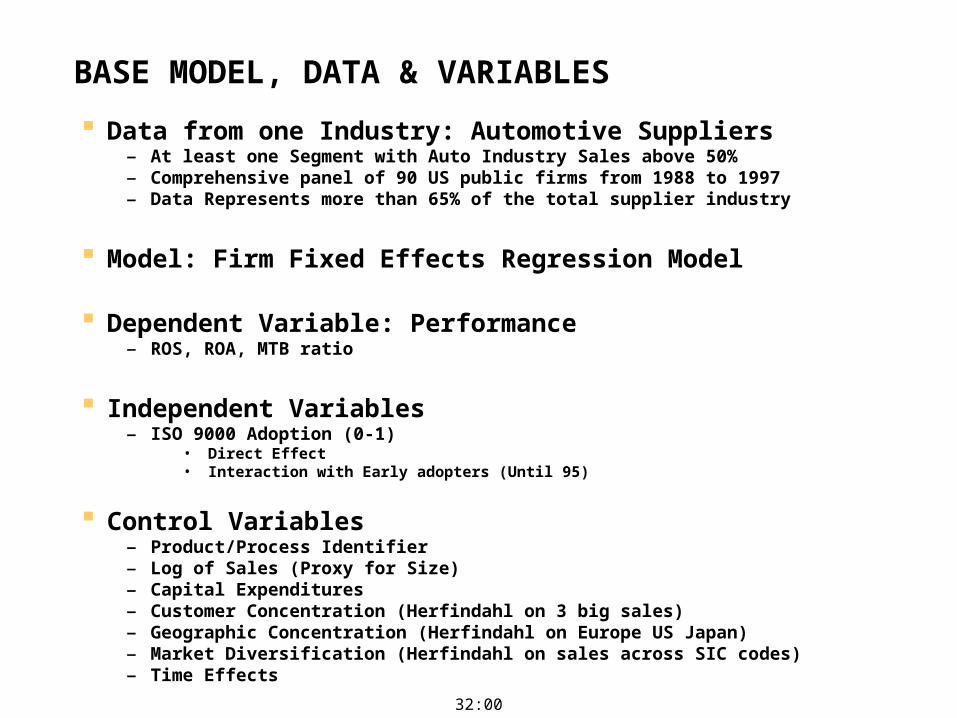
BASE MODEL, DATA & VARIABLES
Data from one Industry: Automotive Suppliers– At least one Segment with Auto Industry Sales above 50%– Comprehensive panel of 90 US public firms from 1988 to 1997– Data Represents more than 65% of the total supplier industry
Model: Firm Fixed Effects Regression Model
Dependent Variable: Performance– ROS, ROA, MTB ratio
Independent Variables– ISO 9000 Adoption (0-1)
• Direct Effect• Interaction with Early adopters (Until 95)
Control Variables– Product/Process Identifier – Log of Sales (Proxy for Size)– Capital Expenditures– Customer Concentration (Herfindahl on 3 big sales)– Geographic Concentration (Herfindahl on Europe US Japan)– Market Diversification (Herfindahl on sales across SIC codes)– Time Effects
32:00
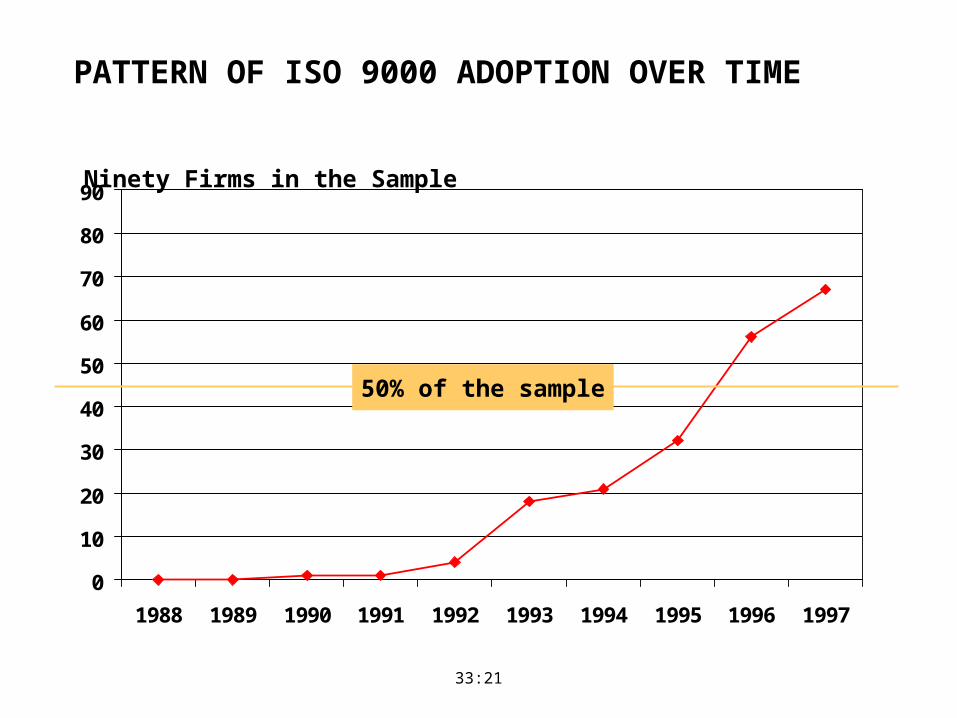
PATTERN OF ISO 9000 ADOPTION OVER TIME
0
10
20
30
40
50
60
70
80
90
1988 1989 1990 1991 1992 1993 1994 1995 1996 1997
Ninety Firms in the Sample
50% of the sample
33:21
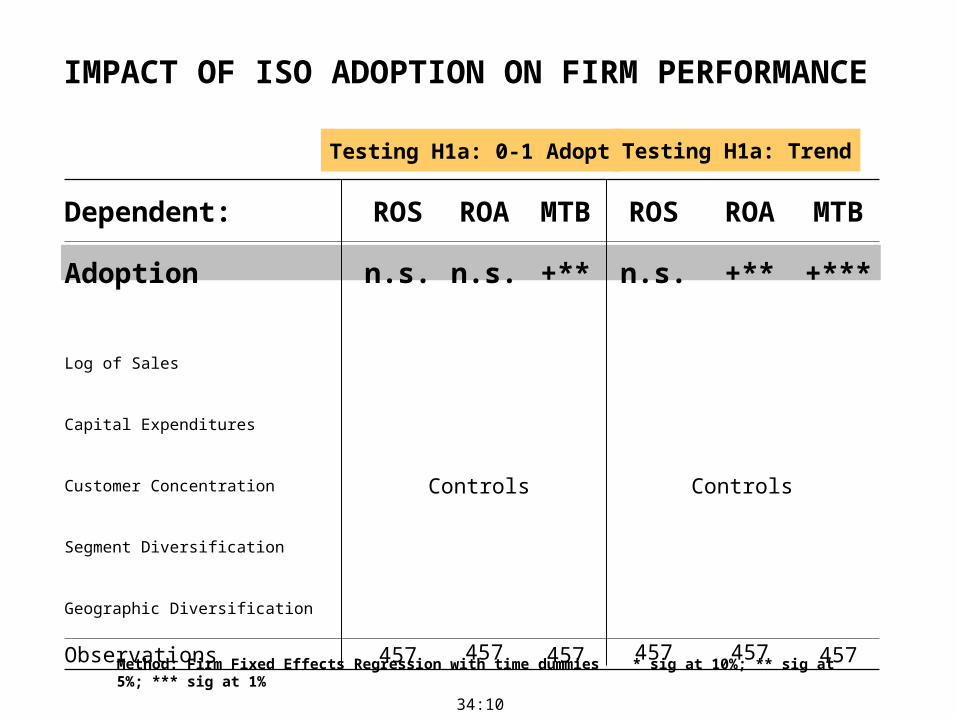
IMPACT OF ISO ADOPTION ON FIRM PERFORMANCE
Dependent: ROS ROA MTB ROS ROA MTB
Adoption n.s. n.s. +** n.s. +** +***
Log of Sales
Capital Expenditures
Customer Concentration Controls Controls
Segment Diversification
Geographic Diversification
Observations 457 457 457 457 457 457Method: Firm Fixed Effects Regression with time dummies * sig at 10%; ** sig at 5%; *** sig at 1%
Testing H1a: 0-1 Adopt Testing H1a: Trend
34:10
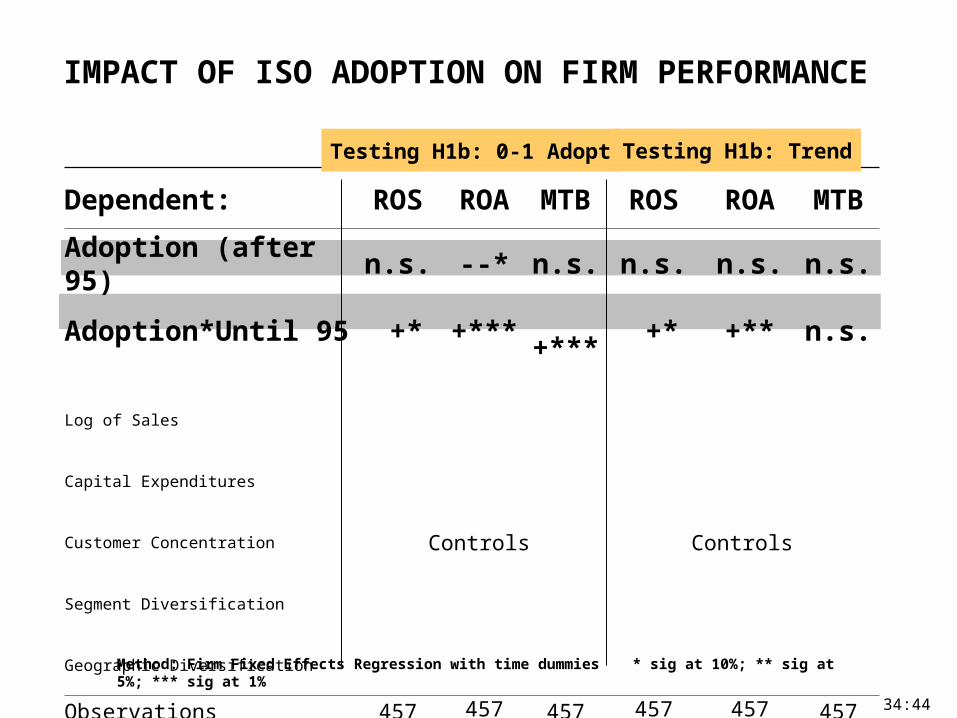
IMPACT OF ISO ADOPTION ON FIRM PERFORMANCE
Dependent: ROS ROA MTB ROS ROA MTB
Adoption (after 95) n.s. --* n.s. n.s. n.s. n.s.
Adoption*Until 95 +* +*** +*** +* +** n.s.
Log of Sales
Capital Expenditures
Customer Concentration Controls Controls
Segment Diversification
Geographic Diversification
Observations 457 457 457 457 457 457Method: Firm Fixed Effects Regression with time dummies * sig at 10%; ** sig at 5%; *** sig at 1%
Testing H1b: 0-1 Adopt Testing H1b: Trend
34:44
EXPLORING TECHNOLOGY HETEROGENEITY
Idea that all firms benefit from adopting PMP at odds with existing literature on operations and strategy
– Research emphasizes role of unique capabilites!
Can we find what firms can gain sustainable competitive advantage from the adoption of PMP?
– Recognize that PMP are customized by individual firms
– Find contexts where PMP create firm-specific complementarities
Look at the complexity and focus of the technology base
35:30
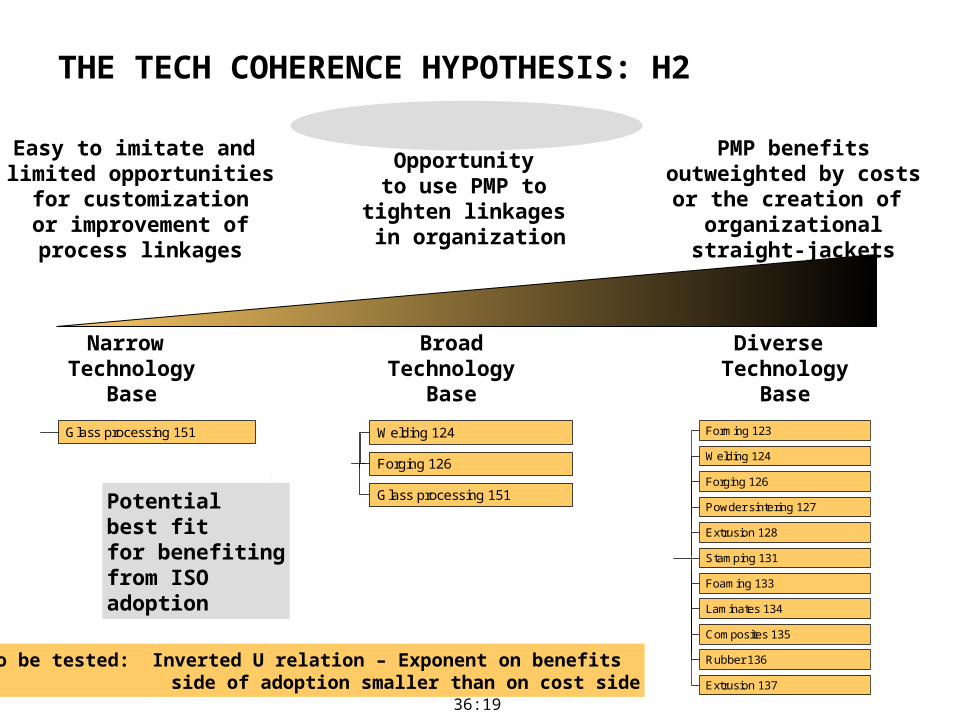
Potential best fit for benefitingfrom ISO adoption
THE TECH COHERENCE HYPOTHESIS: H2
Glass processing 151
Narrow Technology
Base
Welding 124
Forging 126
Glass processing 151
BroadTechnology
Base
Diverse Technology
Base
Forming 123
Welding 124
Stamping 131
Foaming 133
Laminates 134
Composites 135
Rubber 136
Extrusion 137
Forging 126
Powder sintering 127
Extrusion 128
Easy to imitate and limited opportunities
for customizationor improvement ofprocess linkages
PMP benefitsoutweighted by costs
or the creation of organizational
straight-jackets
Opportunity to use PMP to
tighten linkages in organization
H2 to be tested: Inverted U relation – Exponent on benefits side of adoption smaller than on cost side
36:19

MEASURING PRODUCT & PROCESS RELATEDNESS
Coherence expresses the relatedness of technological capabilities
– A relational classification scheme developed based on criteria of technological relatedness of processes
• Science & technology• Process Engineering• Properties of materials
– Gathered by analysis of annual reports and SEC filings of the companies
Concentration Measure– Herfindahl Index
• ni – Number of technologies in area i
• NT – Total Technologies
• Varies from zero to 1
Pro
cess
es
1
Metal processing 12
Machining 122
Casting 121
Forming 123
Welding 124
Stamping 125
Stamping 131
Molding 132
Foaming 133
Laminates 134
Composites 135
Rubber 136
Extrusion 137
Textile processing 171
Chemical processing 181
Electronic component mfg 191
Plastics processing 13
Textile processing 17
Chemical processing 18
Electronic component mfg 19
Ceramics 161Ceramics 16
Glass processing 151Glass processing 15
Coating 142
Painting 141Surface treatment 14
Forging 126
Powder sintering 127
Extrusion 128
Assembly 11 Assembly 111
Example of Classification
Scheme for Processes
2 levels
HCI niNT
2
i
38:10
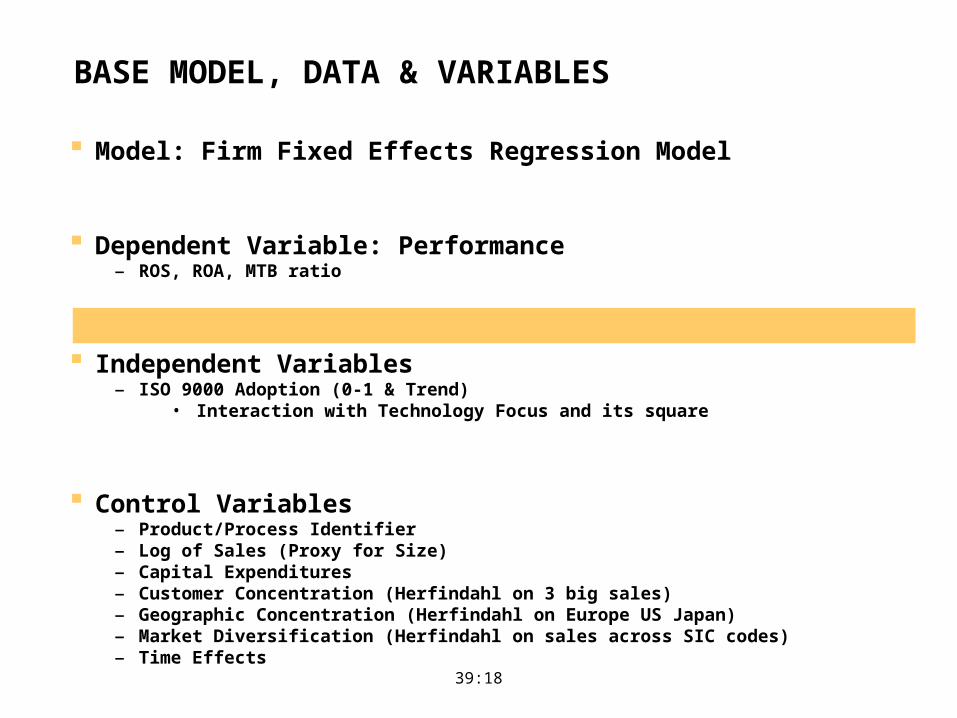
BASE MODEL, DATA & VARIABLES
Model: Firm Fixed Effects Regression Model
Dependent Variable: Performance– ROS, ROA, MTB ratio
Independent Variables– ISO 9000 Adoption (0-1 & Trend)
• Interaction with Technology Focus and its square
Control Variables– Product/Process Identifier – Log of Sales (Proxy for Size)– Capital Expenditures– Customer Concentration (Herfindahl on 3 big sales)– Geographic Concentration (Herfindahl on Europe US Japan)– Market Diversification (Herfindahl on sales across SIC codes)– Time Effects
39:18

IMPACT OF ISO ADOPTION ON FIRM PERFORMANCE
Adoption 0-1 Adoption Trend
Dependent Var: ROS ROA MTB ROS ROA MTB
Adoption --*** --*** n.s. --*** --** +*
Adopt * TechCoh +*** +*** n.s. +*** +*** n.s.
Adopt * TechCoh2 --*** --*** n.s. --*** --*** n.s.
Log of Sales
Capital Expenses
Customer Concen. Controls Controls
Segment Diversif.
Geographic Diversif.
Observations 403 403 403 403 403 403
Method: Firm Fixed Effects Regression with time dummies * sig at 10%; ** sig at 5%; *** sig at 1%
39:28

CONCLUSIONS AND IMPLICATIONS
The average firm does not seem to gain from ISO adoption
Earlier adopters gain, but benefits competed with entry– Later adopters have less opportunity to gain from adoption
Ability to gain from PMP adoption contingent on firm nature– The technical complexity of the firm matters!– Benefits accrue when some (but not too much) process streamlining happens
Policy Implication: Be careful when jumping the bandwagon!– PMP are not a silver bullet, they can benefit as much as they can hurt– Strategy and Capability fit condition opportunity for improvement– Widespread adoption transforms improvement and signaling tool in entry
condition, with questionable results…
40:17

AoM 2009Sunday, August 9, 2009
ISO 9000 Practices and Financial Performance: A Technology Coherence Perspective
FRANCISCO VELOSOCarnegie Mellon University andUniversidade Católica Portuguesa
MARY BENNERWharton School of Management
University of Pennsylvania
41:30
Creating Consumer Durable Retailer Creating Consumer Durable Retailer Customer Loyalty through Order Customer Loyalty through Order Fulfillment Service OperationsFulfillment Service Operations
Beth Davis-Sramek,
John T. Mentzer,
&
Theodore P. Stank
47:35
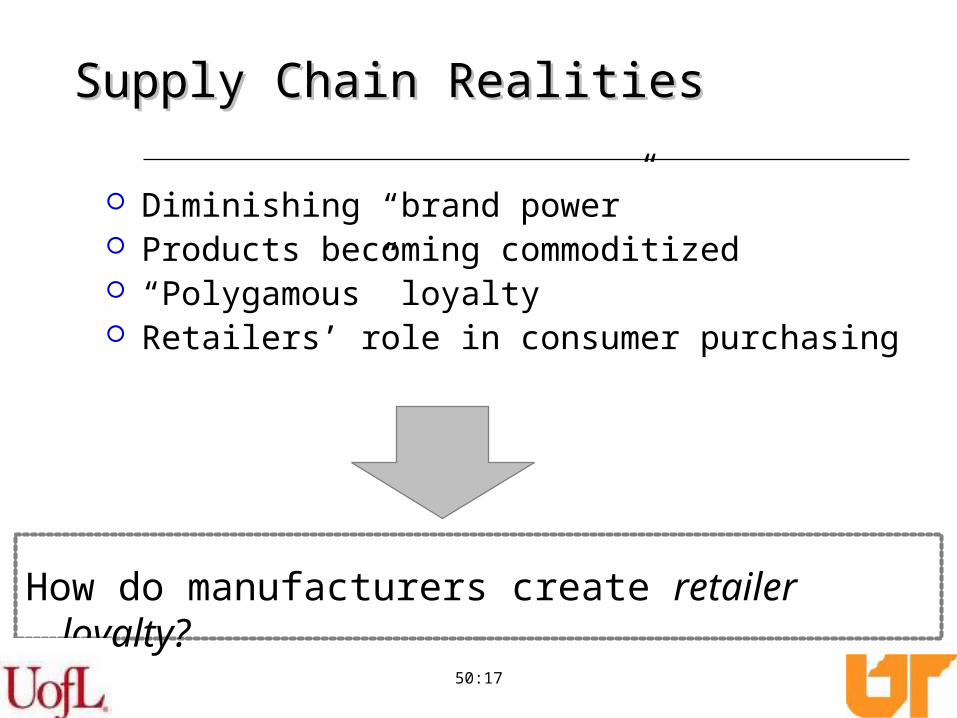
Supply Chain RealitiesSupply Chain Realities
Diminishing “brand power” Products becoming commoditized “Polygamous” loyalty Retailers’ role in consumer purchasing
How do manufacturers create retailer loyalty?
50:17
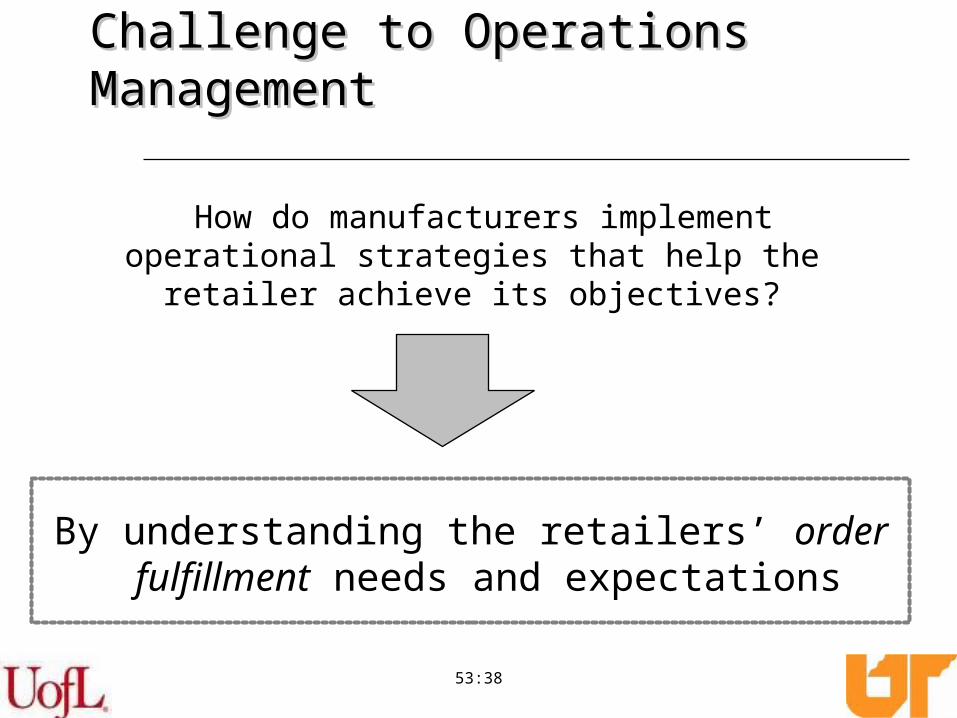
Challenge to Operations ManagementChallenge to Operations Management
How do manufacturers implement operational strategies that help the
retailer achieve its objectives?
By understanding the retailers’ order fulfillment needs and expectations
53:38
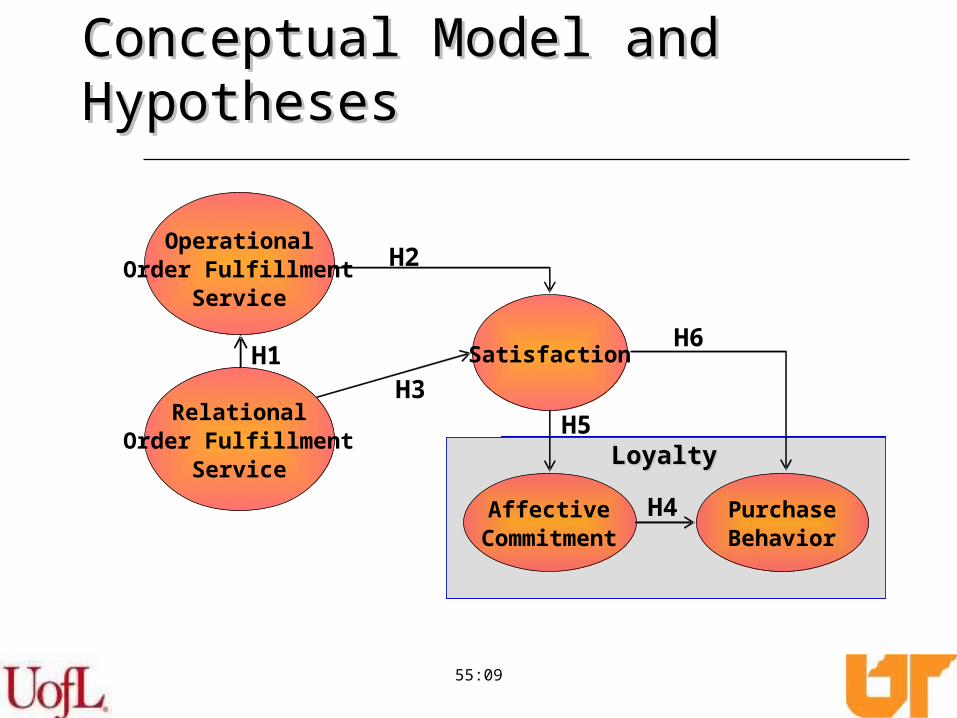
Conceptual Model and HypothesesConceptual Model and Hypotheses
Satisfaction
AffectiveCommitment
PurchaseBehavior
LoyaltyLoyalty
OperationalOrder Fulfillment
Service
H1
H2
H3
H4
H6
H5RelationalOrder Fulfillment
Service
55:09

ImplicationsImplications
Manufacturers need to build customer focused operations capabilities
Moves operations from efficiency focus (“doing things right”) to effectiveness focus (“doing the right things”) (Stank et al. 1999)
Operations management strategies should also focus on the “soft” side of service
Loyalty is not just behavior – building bonds with customers is key to retention
58:30

Limitations and Further ResearchLimitations and Further Research
Sample limited to one company in one industry “Big box” retailers Industries relying on more self-service Objective measures of order fulfillment
performance Inter-disciplinary focus that examines
linkages between OM strategy and other firm functions/processes
62:18
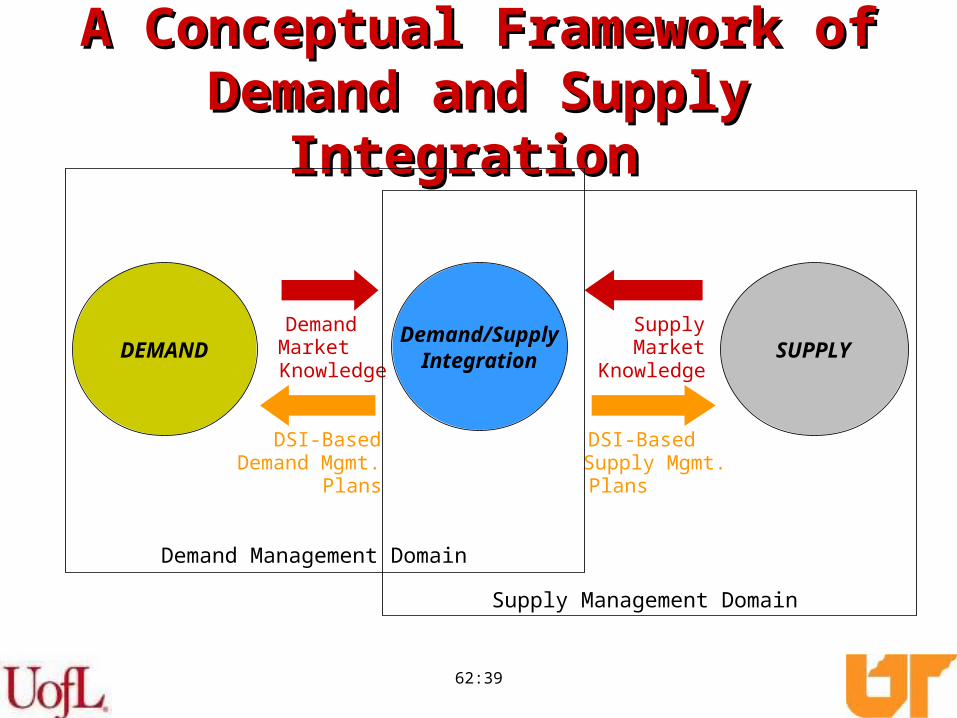
A Conceptual Framework of A Conceptual Framework of Demand and Supply IntegrationDemand and Supply Integration
Demand/SupplyIntegration SUPPLYDEMAND
SupplyMarket
Knowledge
DemandMarketKnowledge
DSI-BasedSupply Mgmt.Plans
DSI-BasedDemand Mgmt.
Plans
Demand Management Domain
Supply Management Domain
62:39

Conceptual Model and HypothesesConceptual Model and Hypotheses
Satisfaction
AffectiveCommitment
PurchaseBehavior
LoyaltyLoyalty
OperationalOrder Fulfillment
Service
H1
H2
H3
H4
H6
H5RelationalOrder Fulfillment
Service
64:54

THANK YOU!THANK YOU!
Questions?Questions?
65:20
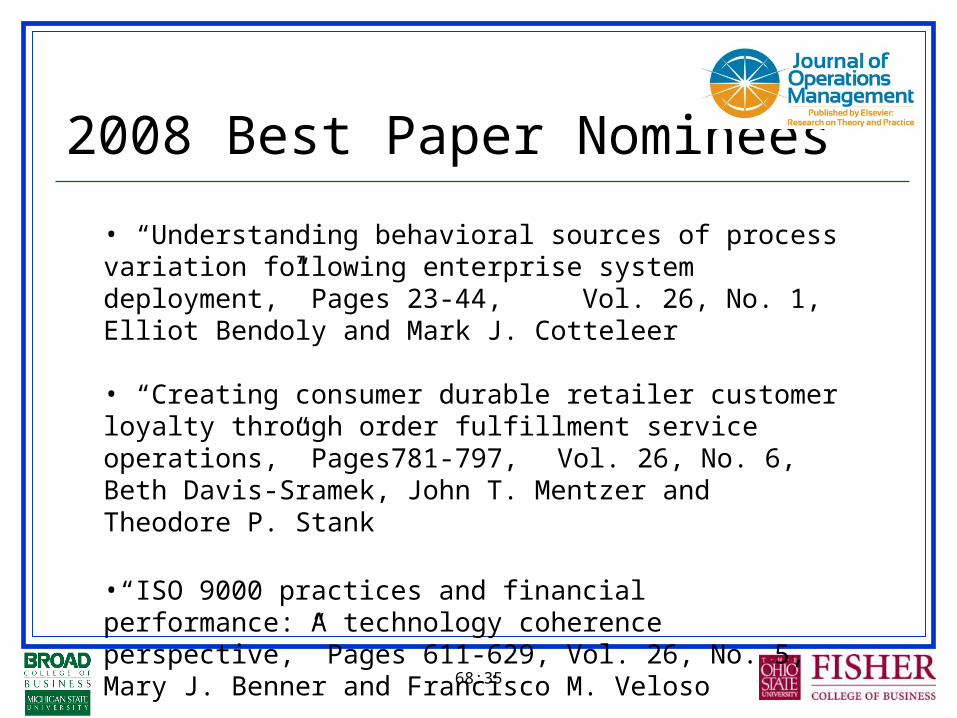
2008 Best Paper Nominees
• “Understanding behavioral sources of process variation following enterprise system deployment,” Pages 23-44, Vol. 26, No. 1, Elliot Bendoly and Mark J. Cotteleer
• “Creating consumer durable retailer customer loyalty through order fulfillment service operations,” Pages781-797, Vol. 26, No. 6, Beth Davis-Sramek, John T. Mentzer and Theodore P. Stank
•“ISO 9000 practices and financial performance: A technology coherence perspective,” Pages 611-629, Vol. 26, No. 5, Mary J. Benner and Francisco M. Veloso
68:35
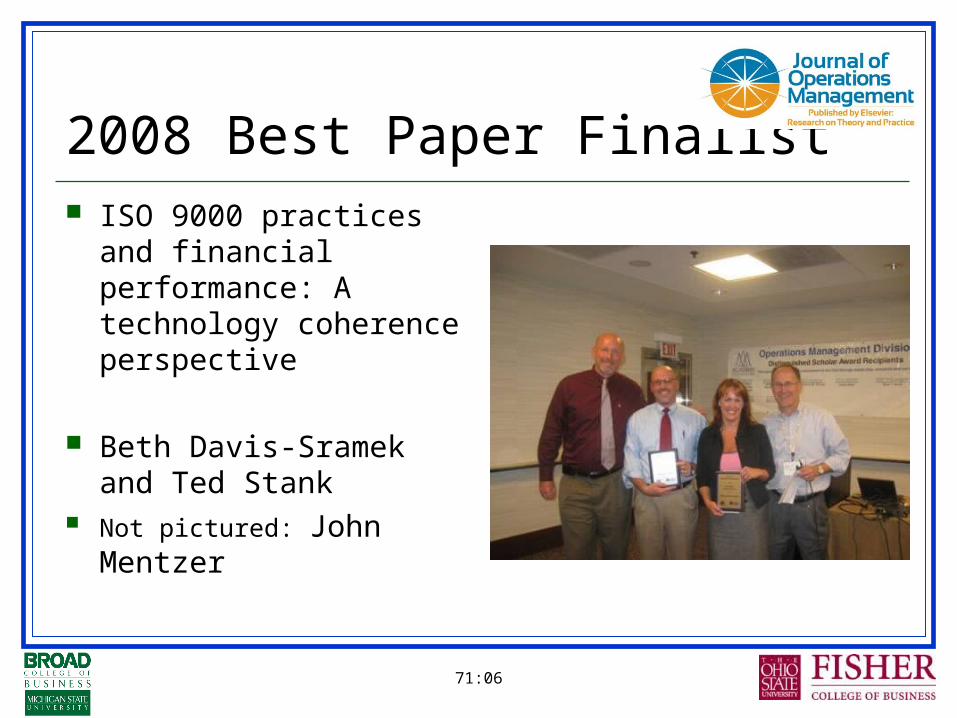
2008 Best Paper Finalist ISO 9000 practices and
financial performance: A technology coherence perspective
Beth Davis-Sramek and Ted Stank
Not pictured: John Mentzer
71:06
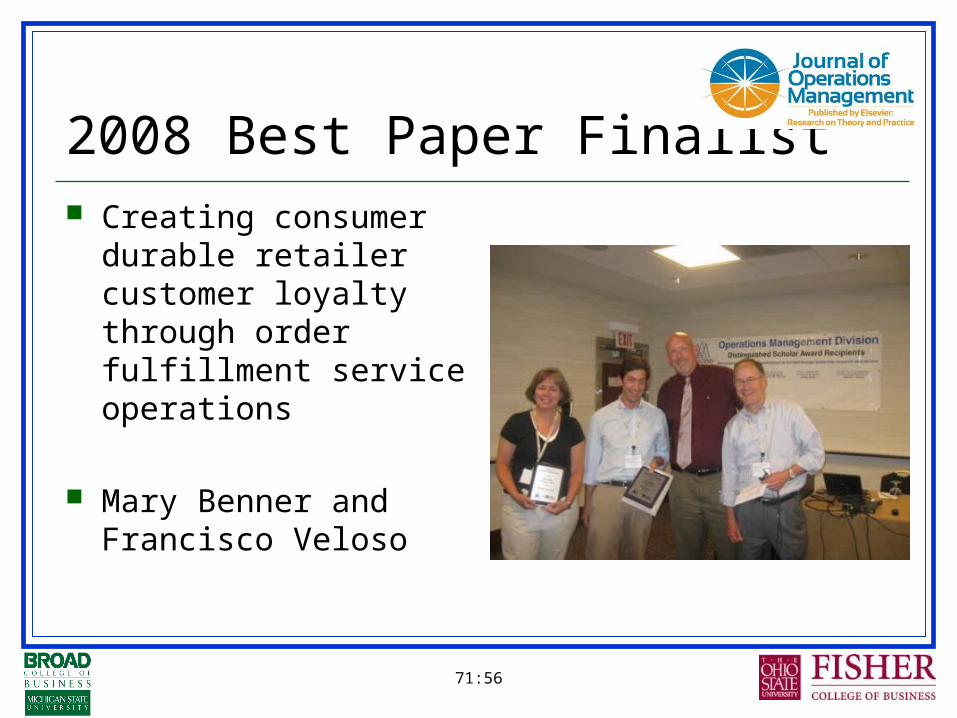
2008 Best Paper Finalist Creating consumer
durable retailer customer loyalty through order fulfillment service operations
Mary Benner and Francisco Veloso
71:56

2008 Best Paper Understanding behavioral
sources of process variation following enterprise system deployment
Mark Cotteleer and Elliot Bendoly
0:00
Thank you and congratulations!
72:37