Embed Size (px)
DESCRIPTION
THOSE HALCYON DAYS Of YORE How Teaching and Learning Have Persevered at Jefferson Community College Through Thick and Thin (1987 – 2001) PD Workshop by Chris Graney, Physics Professor and One-Time Number Cruncher. November 7, 2002. 1987 Ron Horvath is President - PowerPoint PPT Presentation
Citation preview
THOSE HALCYON DAYS Of YORE
How Teaching and Learning Have Persevered at Jefferson Community College Through Thick and Thin (1987 – 2001)
PD Workshop by Chris Graney, Physics Professor and One-Time Number Cruncher.
November 7, 2002
1987
•Ron Horvath is President
•JCC Named #2 Community College in the US after Miami-Dade
•Enrollment is Booming
2001
•By December, NO ONE is President!
•JCC Has 50+ Recommendations from SACS
•Enrollment is Flat
•Budgets are Busted
1987-2001 •Ron Horvath I
•Ron Horvath II
•Richard Green I
•Richard Green II
•Post-Green
•Many Deans, DC’s, mid-managers, etc.

0
2000
4000
6000
8000
10000
12000
14000F
all 1
987
Fal
l 198
8
Fal
l 198
9
Fal
l 199
0
Fal
l 199
1
Fal
l 199
2
Fal
l 199
3
Fal
l 199
4
Fal
l 199
5
Fal
l 199
6
Fal
l 199
7
Fal
l 199
8
Fal
l 199
9
Fal
l 200
0
Fal
l 200
1
Enrollment7778 Fall 1987 9100 Fall 2001
Numbers Based on GradesThey are in the transcripts! No ghosts with grades! They’ve been tested, too.

0.0%
10.0%
20.0%
30.0%
40.0%
50.0%
60.0%
70.0%
FALL
198
7
FALL
198
8
FALL
198
9
FALL
199
0
FALL
199
1
FALL
199
2
FALL
199
3
FALL
199
4
FALL
199
5
FALL
199
6
FALL
199
7
FALL
199
8
FALL
199
9
FALL
200
0
FALL
200
1
Gender59% Female Fall 1987 61% Female Fall 2001
Ethnicity/Race21% Minority Fall 198733% Minority Fall 2001
0.0%
10.0%
20.0%
30.0%
40.0%
50.0%
60.0%
70.0%
80.0%
90.0%
100.0%
FALL
198
7
FALL
198
8
FALL
198
9
FALL
199
0
FALL
199
1
FALL
199
2
FALL
199
3
FALL
199
4
FALL
199
5
FALL
199
6
FALL
199
7
FALL
199
8
FALL
199
9
FALL
200
0
FALL
200
1
Graph shows non-minority numbers.

0
5
10
15
20
25
30F
all 1
987
Fal
l 198
8
Fal
l 198
9
Fal
l 199
0
Fal
l 199
1
Fal
l 199
2
Fal
l 199
3
Fal
l 199
4
Fal
l 199
5
Fal
l 199
6
Fal
l 199
7
Fal
l 199
8
Fal
l 199
9
Fal
l 200
0
Fal
l 200
1
These are average ages of all students age 16 - 60 for whom age data is available.
Age26 Years Old

0.0
1.0
2.0
3.0
4.0
5.0
6.0
7.0
8.0
9.0
Fal
l 198
7
Fal
l 198
8
Fal
l 198
9
Fal
l 199
0
Fal
l 199
1
Fal
l 199
2
Fal
l 199
3
Fal
l 199
4
Fal
l 199
5
Fal
l 199
6
Fal
l 199
7
Fal
l 199
8
Fal
l 199
9
Fal
l 200
0
Fal
l 200
1
Student Credit Hour Load8 Credit Hours
0.0%
5.0%
10.0%
15.0%
20.0%
25.0%
30.0%
35.0%
40.0%
Fall1987
Fall1988
Fall1989
Fall1990
Fall1991
Fall1992
Fall1993
Fall1994
Fall1995
Fall1996
Fall1997
Fall1998
Fall1999
Fall2000
Fall2001
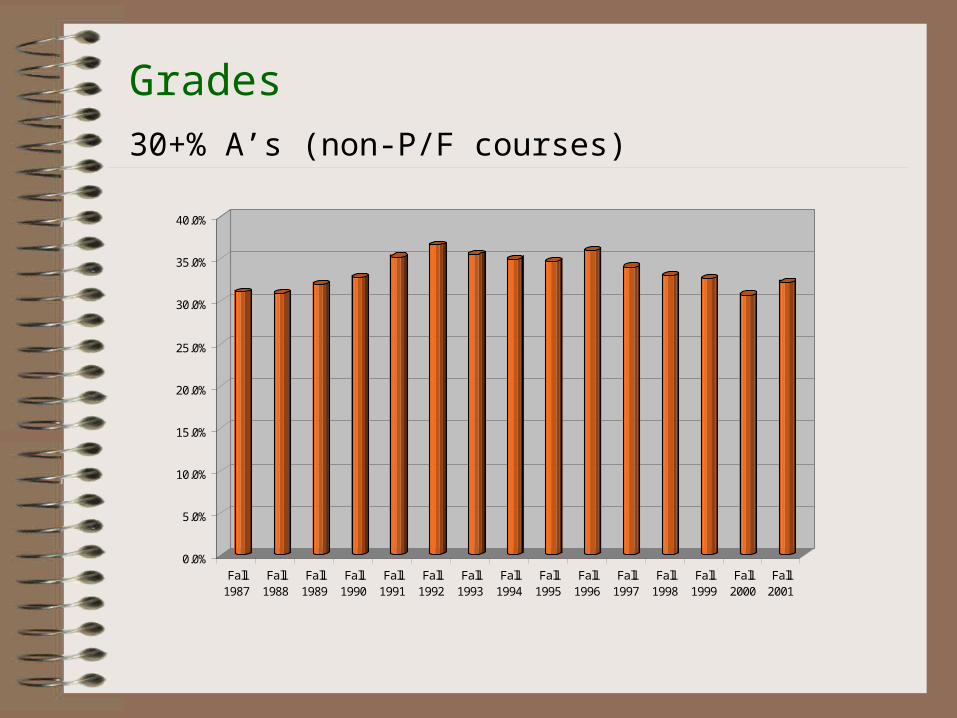
Grades30+% A’s (non-P/F courses)

0.0%
10.0%
20.0%
30.0%
40.0%
50.0%
60.0%
70.0%
80.0%
Fal
l 198
7
Fal
l 198
8
Fal
l 198
9
Fal
l 199
0
Fal
l 199
1
Fal
l 199
2
Fal
l 199
3
Fal
l 199
4
Fal
l 199
5
Fal
l 199
6
Fal
l 199
7
Fal
l 199
8
Fal
l 199
9
Fal
l 200
0
Fal
l 200
1
Pass rate -- defined as the percentage of all grades given that are A, B, C, D, or “P grades” (P, PA, etc).
Pass RatesDeclining Slightly

0.0%
10.0%
20.0%
30.0%
40.0%
50.0%
60.0%
70.0%
80.0%F
all 1
987
Fal
l 198
8
Fal
l 198
9
Fal
l 199
0
Fal
l 199
1
Fal
l 199
2
Fal
l 199
3
Fal
l 199
4
Fal
l 199
5
Fal
l 199
6
Fal
l 199
7
Fal
l 199
8
Fal
l 199
9
Fal
l 200
0
Fal
l 200
1
000-Level (Remedial)
100-Level (Frosh)
200-Level (Soph)
Course Levels
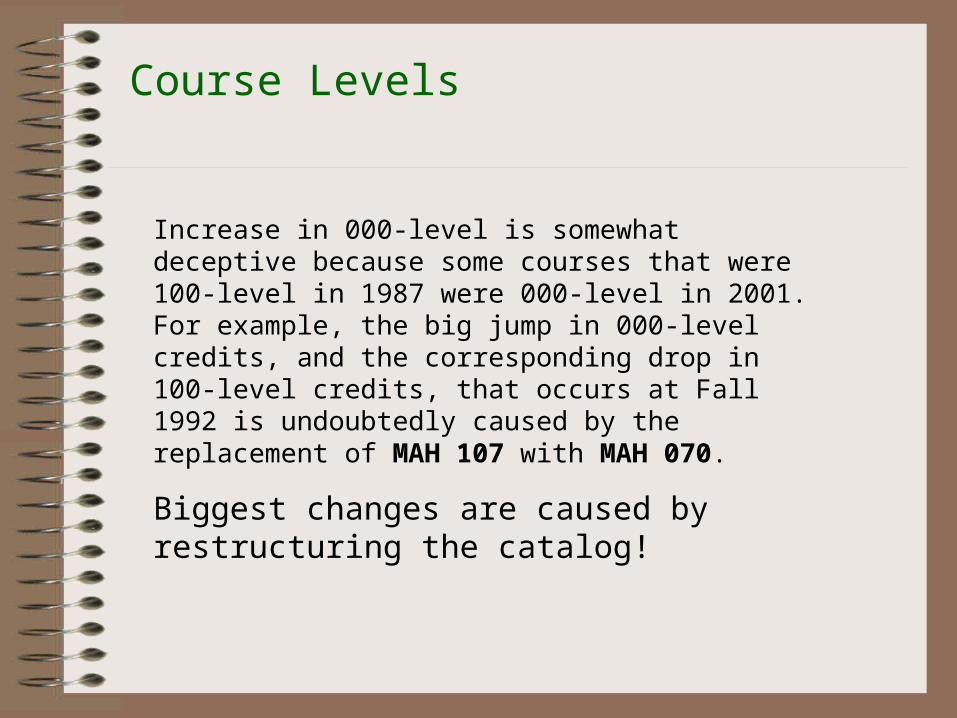
Course Levels
Increase in 000-level is somewhat deceptive because some courses that were 100-level in 1987 were 000-level in 2001. For example, the big jump in 000-level credits, and the corresponding drop in 100-level credits, that occurs at Fall 1992 is undoubtedly caused by the replacement of MAH 107 with MAH 070.
Biggest changes are caused by restructuring the catalog!

0.0%
5.0%
10.0%
15.0%
20.0%
25.0%
30.0%F
all
19
87
Fa
ll 1
98
8
Fa
ll 1
98
9
Fa
ll 1
99
0
Fa
ll 1
99
1
Fa
ll 1
99
2
Fa
ll 1
99
3
Fa
ll 1
99
4
Fa
ll 1
99
5
Fa
ll 1
99
6
Fa
ll 1
99
7
Fa
ll 1
99
8
Fa
ll 1
99
9
Fa
ll 2
00
0
Fa
ll 2
00
1
Total of "Big 6"
ENG101
ENG102
MA 108
MA/MT 109
PY 110
SOC101
Historically speaking, JCC’s “Big 6” of courses are ENG 101, ENG 102, SOC 101, PY 110, MA 108 (now MAH 083), and MA 109. These six courses consistently account for 20% to 25% of the credit hours generated at JCC. The chart shows the percentage of the total credit hours generated at JCC that are generated by the “Big 6” -- as well as the percentage for each individually.
Course OfferingsThe BIG SIX

0.0%
10.0%
20.0%
30.0%
40.0%
50.0%
60.0%F
AL
L 1
98
7
FA
LL
19
88
FA
LL
19
89
FA
LL
19
90
FA
LL
19
91
FA
LL
19
92
FA
LL
19
93
FA
LL
19
94
FA
LL
19
95
FA
LL
19
96
FA
LL
19
97
FA
LL
19
98
FA
LL
19
99
FA
LL
20
00
FA
LL
20
01
RetentionBetter Than Some, Worse Than Others

0.0%
10.0%
20.0%
30.0%
40.0%
50.0%
60.0%
70.0%FA
LL 1
987
FALL
198
8
FALL
198
9
FALL
199
0
FALL
199
1
FALL
199
2
FALL
199
3
FALL
199
4
FALL
199
5
FALL
199
6
FALL
199
7
FALL
199
8
FALL
199
9
FALL
200
0
Recruiting

0.00%
10.00%
20.00%
30.00%
40.00%
50.00%
60.00%
70.00%
80.00%
87-88
88-89
89-90
90-91
91-92
92-93
93-94
94-95
95-96
96-97
97-98
98-99
99-00
00-01
01-02
AAS
AA/AS
CERT
GraduatesThe Myth of “Becoming a Tech School”

0
100
200
300
400
500
600
700
87-88 88-89 89-90 90-91 91-92 92-93 93-94 94-95 95-96 96-97 97-98 98-99 99-00 00-01 01-02
Numbers of GraduatesMore, then Less
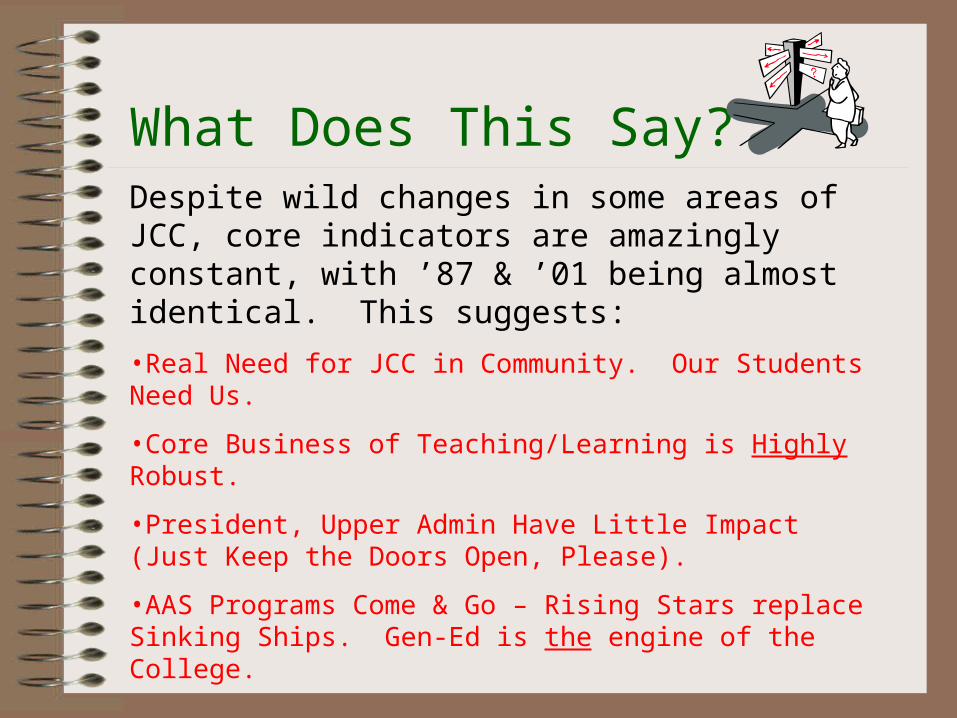
What Does This Say? Despite wild changes in some areas of JCC, core indicators are amazingly constant, with ’87 & ’01 being almost identical. This suggests:
•Real Need for JCC in Community. Our Students Need Us.
•Core Business of Teaching/Learning is Highly Robust.
•President, Upper Admin Have Little Impact (Just Keep the Doors Open, Please).
•AAS Programs Come & Go – Rising Stars replace Sinking Ships. Gen-Ed is the engine of the College.
Pursue What We Are! We are, at the core, that which our community needs us to be. If the past 15 years have not changed us, new initiatives, programs, etc. are unlikely to change us.
Advise, be open to students, grade tough, help students succeed, hold their hand, kick their a__ , develop new ideas, hone the tried and true, do the best job you can do at being what you are. Worry less about the running of the college. We won’t be turning into either a pumpkin or a Ferrari anytime soon.
THE END
Questions?