Embed Size (px)
Citation preview
HAL Id: hal-03033519https://hal.archives-ouvertes.fr/hal-03033519
Submitted on 1 Dec 2020
HAL is a multi-disciplinary open accessarchive for the deposit and dissemination of sci-entific research documents, whether they are pub-lished or not. The documents may come fromteaching and research institutions in France orabroad, or from public or private research centers.
L’archive ouverte pluridisciplinaire HAL, estdestinée au dépôt et à la diffusion de documentsscientifiques de niveau recherche, publiés ou non,émanant des établissements d’enseignement et derecherche français ou étrangers, des laboratoirespublics ou privés.
Threats to marine biodiversity in European protectedareas
Antonios Mazaris, Athanasios Kallimanis, Elena Gissi, Carlo Pipitone,Roberto Danovaro, Joachim Claudet, Gil Rilov, Fabio Badalamenti, Vanessa
Stelzenmüller, Lauric Thiault, et al.
To cite this version:Antonios Mazaris, Athanasios Kallimanis, Elena Gissi, Carlo Pipitone, Roberto Danovaro, et al..Threats to marine biodiversity in European protected areas. Science of the Total Environment, Else-vier, 2019, 677, pp.418-426. �10.1016/j.scitotenv.2019.04.333�. �hal-03033519�

Title: Threats to marine biodiversity in the protected European Seas 1
Threats to marine biodiversity in the European Seas protected system 2
Threats to marine biodiversity in the European Seas marine protected areas 3
4
Short Title: Threats to marine biodiversity 5
6
Authors: 7
Antonios, D. Mazaris1,*, Athanasios Kallimanis
1, Elena Gissi
2, Roberto Danovaro
3,4, Carlo 8
Pipitone5, Joachim Claudet
6,7+++++++++ Vanessa Stelzenmüller
8,Stelios Katsanevakis
88888 & 9
Simonetta Fraschetti9999
10
1 Department of Ecology, School of Biology, Aristotle University of Thessaloniki, 54636, 11
Greece 12
2 Department of Design and Planning in Complex Environments, University Iuav of Venice, 13
Tolentini 191, 30135, Venice, Italy 14
3 Department of Life and Environmental Sciences, Polytechnic University of Marche, 15
Ancona, 60131, Ancona, 16
4 Stazione Zoologica Anton Dohrn, 80131, Naples, Italy 17
5 CNR-IAMC, via Giovanni da Verrazzano 17, 91014 Castellammare del Golfo, Italy 18
6 National Center for Scientific Research, PSL Université Paris, CRIOBE, USR 3278 CNRS-19
EPHE-UPVD, Maison des Océans, 195 rue Saint-Jacques 75005 Paris, France 20
7 Laboratoire d’Excellence CORAIL, Moorea, French Polynesia 21
+++++ 22
8 Thünen Institute of Sea Fisheries, Herwigstrasse 31, 27572 Bremerhaven, Germany 23
88888 Department of Marine Sciences, University of the Aegean, University Hill, 81100 24
Mytilene, Greece 25 99999
Dipartimento di Scienze e Tecnologie Biologiche ed Ambientali, Università del Salento, 26
73100 Lecce, Stazione Zoologica Anton Dohrn, 80121 Napoli, CoNISMa, Piazzale Flaminio 27
9, 00196 Roma, Italy. 28
29
30
Abstract: 31
Marine protected areas (MPAs) represent the main tool towards halting the loss of marine 32
biodiversity. However, there is increasing evidence on their limited capacity to eliminate or 33
even reduce some threats even within their boundaries. Here, we analyzed a European wide 34
database comprising 31579 threats recorded in 2230 MPAs . Focusing explicitly on threats 35
related to marine species and habitats, we found that fishing and outdoor activities were the 36
most widespread within MPA boundaries, although some spatial heterogeneity in the threats 37
distribution was evidenced. Our results clearly demonstrate the need to reconsider current 38
management plans, and measures within and beyond MPAs, while any such planning should 39
avoid a centralized decision processes, and thus properly account for the heterogeneity that is 40
inherent in conservation networks. 41
42
INTRODUCTION 43
Marine protected areas (MPAs) represent a core strategy for conservation of marine 44
biodiversity, and, when properly planned and well managed, they reduce habitat loss and are 45
effective in maintaining species populations (Claudet et al. 2008; Fenberg et al. 2012 ). 46
Nevertheless, global studies highlight that many existing MPAs lack efficiency, failing to 47
both achieve their conservation objectives (Leverington et al. 2010; Edgar et al. 2014; Gill 48
et al. 2017). and secure the flow of ecosystem services (Allison et al., 1998; Agardy et al., 49
2011). Systematic spatial prioritization of conservation needs together with effective 50
management and mitigation actions both within and beyond MPAs is required to overcome 51
shortcomings and maximize conservation efficiency (Margules and Pressey, 2000).This 52
however requires a sound database on spatial-temporal patterns of biodiversity measures and 53
risks in relation to current and future threats (Halpern et al. 2008; Levin et al. 2014). Still, 54
scarcity of information about the presence, extent and magnitude of the threats that 55
biodiversity faces may lead to biased and ineffective management decisions (Coll et al., 56
2012; Schulze et al., 2018). 57
Acknowledging the need to develop comprehensive risk assessments for the marine 58
environment, a common practice is to assemble various layers of information on the most 59
acknowledged threats (Micheli et al. 2013). Such data are often accumulated through remote 60
sensing, satellite imaging or extensive field surveys (Depellegrin et al., 2017; Ouellette and 61
Getinet, 2016). These approaches are often guided by the application of future conservation 62
priorities at broad spatial areas, which bears the risk of failing to track threats either operating 63
at finer scales (e.g. recreational fishing) or being difficult to extrapolate to broad spatial maps 64
(e.g. contamination). As an alternative of improving our understating on the actual threats that 65
are present in the marine realm, questionnaire surveys and expert contributions have also been 66
placed in the front line of research (Halpern et al., 2006; Donlan et al. 2010). Such methods 67
could offer critical insights on the identification of basic threats and their ranking based on the 68
vulnerability of marine biodiversity, and thus could be used for directing conservation 69
investments (Ban and Klein, 2009;Klein et al. 2017) and for recognizing the scales at which 70
management actions should be taken (Stelzenmüller et al., 2013). Still, biases due to 71
background (i.e. education, scientific, professional, regional) and actual interest of responders 72
(e.g. expertise and interest in a given ecosystem type or species) could affect the generated 73
outputs (Spruijt et al., 2014; Rudd, 2015; Gissi et al. 2017). 74
Site-specific data on threats might exist for some MPAs, often used towards directing 75
management actions and understanding conservation conflicts and local threats for 76
biodiversity (Zupan et al. 2018a). At the same time, key management directives, are often 77
centralized, with decisions being taken at higher administrative levels largely ignoring local 78
knowledge, conditions and needs (Helvey, 2004; Christie and White, 2007). Under this 79
context, the identification of main threats and the assessment of patterns in their spatial 80
distribution could inform more effective management by directing fewer, focused, and 81
realistic measures (Knight et al., 2013). 82
Here, we focus on three key issues related to the diversity and distribution of threats within 83
MPAs: (1) We provide an overview of threats identified in 2230 MPAs located in the 84
European Seas, (2) investigate regional patterns among the reported threats, and (3) identify 85
groups of threats appealing the most for immediate management actions. 86
87
METHODS 88
Datasets for the European conservation network 89
The Natura2000 conservation network of the European Union (EU) represents the largest 90
network of protected areas in the world, which was established on the basis of two EU 91
legislative instruments, the Habitats and Birds Directives. The network currently consists of 92
more than 27,700 sites. These sites have been selected according to the occurrence of habitat 93
types and species of community interest for the EU (Annexes I and II of Habitats and Annex I 94
of Birds Directives). 95
For the purpose of this study, data on the spatial distribution of the sites of the Natura2000 96
network were derived from the database compiled and made available by the European 97
Environment Agency (EEA; http://www.eea.europa.eu/data-and-maps). As no a priori 98
distinction is made between marine, coastal or terrestrial Natura2000 sites, we selected sites 99
that host at least one marine habitat listed in the Habitats Directive. Following this process, 100
we selected a total of 2230 sites of the Natura2000 network. 101
To support and direct conservation and management initiatives, each EU Member State has 102
the obligation to compile related data for each Natura2000 site. These data are gathered by 103
experts following standardized protocols (EU 2011), and submitted within Standard Data 104
Forms, that actually represent the official documentation for justifying the importance of each 105
site. Once validated, this information becomes publicly available through the ‘Natura2000 106
Database’ (EEA; http://www.eea.europa.eu/data-and-maps). A key piece of information 107
archived in this database refers to a list of processes that could directly or indirectly affect 108
biodiversity. These records are listed under a section of the database named ‘activities, threats 109
and pressures’, which offers a classification scheme according to a predetermined list of 397 110
different categories (Supplementary Table 1). No distinction is made between natural or 111
anthropogenic processes. For each record of any process, the experts have to report its 112
perceived impact (i.e. positive or negative) on the conservation and management of the site 113
(EU 2011). Here, we maintained only the records that were assigned as having negative 114
impacts; we hereafter collectively refer to these records as threats. 115
116
Threats classification 117
In the Natura 2000 database the classification of threats follows a hierarchical structure with 118
four levels of information, starting from a broad description of 11 types (e.g. pollution). At 119
the second hierarchical level, each group is divided into more informative categories (e.g. 120
pollution to surface waters). Some of these threats are further divided into an additional level 121
providing a more detailed description of the reported activity (e.g. pollution to surface waters 122
by industrial plants). For a few of these sub-categories, a further lower hierarchal level exists. 123
With a few exceptions (e.g. marine water pollution, fishing and harvesting aquatic resources), 124
the majority of threat types found in the Natura2000 database refer to processes originating in 125
the terrestrial environment. At a site level, no reference is made if a reported threat is having a 126
potential effect on the marine or terrestrial part of the site. Therefore, in order to focus our 127
analyses on those threats that are likely to cause harm to marine species or habitats, we 128
selected only those types that impact marine biodiversity. This was achieved by analyzing 129
information from national reports on the conservation status of protected marine habitats and 130
species. These reports are compiled by each Member State every six years, as an obligation to 131
the Article 17 of the Habitats directive, and include aggregated information on threats for 132
each of the protected species and habitats at a national level (Tsiripidis et al., 2018). After 133
filtering out non-marine threats, we ended up with a list of 5094 reported threats for marine 134
biodiversity (see Supplementary Methods). These reported threats were classified into 71 135
different threats types belonging to the second hierarchical level of the threat classification. 136
To exclude threat types that explicitly reflected only extreme and rare conditions (e.g. 137
restructuring agricultural land holding was reported in only one case), we removed rare 138
threats that accounted for less than 1% of the records. This resulted in a selection of 25 threat 139
types of the second hierarchical level (Fig. 1). 140
At a next step, we analyzed the site-specific Standard Data Forms of the 2230 Natura2000 141
protected areas that included a marine component, extracting all records of the 25 identified 142
threats. A total of 31579 site-specific records at the finest hierarchical level were identified. 143
Here, we performed our analyses on threats at the second hierarchical level, since experts 144
recorded more than 50% of the records at this level. By aggregating records of lowest levels 145
to the second hierarchical level, we ended up to 8861 distinct site-specific records of threats. 146
For a number of Natura2000 sites with a marine component, no record on marine related 147
threats, or even of any type of threat, were available. In an effort to investigate for the 148
potential factors that might have driven this gap on recording, we employed a Kruskal Wallis 149
test. We examined whether any difference among sites occurred in respect to a) their surface, 150
b) the relative percentage of marine surface covered. To estimate the percentage of marine 151
surface covered, we overlaid the spatial data on the Natura2000 sites against the digital 152
terrestrial terrain of Europe; both spatial datasets were derived by EEA 153
(https://www.eea.europa.eu/data-and-maps/). 154
Spatial patterns of threats 155
To explore the spatial patterns of the diversity of threats across European waters we assigned 156
each site to one of four marine regions (i.e. the Baltic Sea, the north-eastern Atlantic Ocean, 157
the Mediterranean Sea and the Black Sea) and used the Spearman rank coefficient to detect 158
any pairwise difference in the rank of the 25 marine related threats. 159
Analysis of similarities (ANOSIM; Clarke 1993) was used to compare threat composition 160
within and among regions. The level of similarity regarding reported threats was calculated 161
by using the Bray-Curtis similarity index. The degree of discrimination was determined based 162
on a test statistic (i.e. global R) which varies between -1 and 1, and is higher when records 163
within groups of sites (i.e. marine regions) are more similar than those from different groups. 164
In cases with many records, R could be significantly different from zero but attaining very 165
small values (Clarke and Warwick, 2001); the level of significance was determined after 166
999 permutations. To further delineate the contribution of individual threats to overall 167
dissimilarity of the four marine regions, we applied SIMPER analyses (Clarke 1993). 168
Analyses were conducted using the vegan package in R (Oksanen et al., 2011). 169
170
RESULTS 171
Threats in MPAs of the European Union 172
For about one fourth (24%, n =538) of the 2230 European Natura2000 sites that host marine 173
habitats, no record on threats related to marine biodiversity was reported (Fig. 2). Actually, 174
for 17% (n = 383) of the total sites, no record of any type of threat was reported, while for 7% 175
of these sites (n = 155) there were records only for threats to terrestrial biodiversity. The total 176
surface and the relative marine surface covered did not statistically differ between the sites for 177
which records on threats were or were not available (in both cases p>0.05). 178
The most frequently recorded threat was ‘outdoor sports and leisure activities, recreational 179
activities’, reported at 57% of the sites (n = 970) for which marine threats were reported. The 180
second and third most frequent threats were ‘fishing and harvesting aquatic resources’ and 181
‘human induced changes in hydraulic conditions’ reported in 55% (n = 924) and 40% (n = 182
679) respectively of the sites for which marine threats were reported. 183
Spatial patterns of threats 184
Correlation analyses demonstrated significant positive associations between the ranking of the 185
different threats in the four marine regions (rs ranged from 0.752 to 0.875, in all cases 186
P<0.01). Some threats (e.g. fishing, outdoor activities, urbanization) were highly ranked in all 187
regions but their relative importance varied (Fig. 1, 2). Threats listed under the category of 188
‘fishing and harvesting of aquatic resources’ were most frequently reported in the marine 189
Natura2000 sites located in Atlantic and the Black Sea, while this group was ranked second in 190
Mediterranean sites and third in Baltic Sea sites. Similarly, ‘outdoor sports and leisure 191
activities, recreational activities’ was the most frequent threat in the Mediterranean and the 192
Baltic Sea, but ranked second in Atlantic sites and third in Black Sea sites. The group 193
enclosing threats related to ‘discharges’ was the second and fourth more frequently reported 194
in the Black Sea and Mediterranean MPAs respectively, but it was ranked 14th and 15th in 195
the Atlantic and Baltic Sea respectively. 196
Pollution-related threats, i.e. threats listed as ‘pollution to surface waters’ and ‘marine water 197
pollution’ were recorded relatively often (ranked 4th and 5th respectively) in the Baltic Sea 198
but none of them was listed within the 7 more frequently reported groups of threats in the 199
other regions. The threat of ‘biological invasions’ was frequently reported in the Atlantic 200
(41% of sites with records on marine threats) but in only 28%, 26% and 21% of the sites in 201
the Mediterranean, Black, and Baltic Sea, respectively. Threats that are related to climate 202
change, and have been reported to have a potential impact upon biotic conditions, were only 203
listed within the last 4 reported threats at all regions. Similarly, ‘climate change driven 204
alteration of abiotic conditions’ was the least reported threat in the Baltic Sea, while also 205
ranked very low in the other regions. These examples are indicative of the significant 206
differences detected among the four marine regions (ANOSIM R=0.08; p<0.001), despite that 207
the overall pattern in the frequency of threats was similar among regions for most of the 208
threats (Figs 1 & 2). 209
‘Discharges’ was recognized as the main driver of differences between the Black Sea and the 210
other three marine regions (contributing from 8.0% to 10.5%). The distribution of ‘outdoor 211
recreational activities’ contributed the most to group similarity between Mediterranean and 212
the Atlantic or the Baltic Sea (8.0% and 9.3% respectively), while ‘fishing and harvesting of 213
aquatic resources’ was the threat that mainly reflected differences between the Atlantic and 214
Baltic Sea. Other threats that were recognized to contribute the most to regional differences 215
were ‘urbanization, human intrusions and disturbances’, ‘pollution to surface waters’, and 216
‘marine infrastructure (i.e. shipping lanes, ports)’. 217
218
DISCUSSION 219
The network of Natura2000 marine sites in European seas is subjected to a suit of diverse 220
threats. Importantly, the most common threats can be directly controlled through targeted 221
management actions at the scale of the protected areas, i.e. in their management plans, 222
because they mainly concern human activities of local impact (e.g. fishing, recreational 223
activities, intrusions and disturbances) (but see Zupan et al. 2018a). 224
Although the assessment, reporting and prioritization of threats are key steps for the 225
establishment of efficient conservation measures, we show that many sites of the European 226
conservation network lack records on any marine related threats. Recently, concerns on 227
irregular and insufficient reporting were raised for the Mediterranean sites of the Natura2000 228
network, regarding the threat of biological invasions (Mazaris and Katsanevakis, 2018). 229
Such information gaps accompany the limited number of Natura2000 sites with an 230
implemented management plan (Mazaris et al., 2017), but also the lack of systematic 231
procedures for the network site selection (Giakoumi et al., 2012). Even though there is now 232
a scientific consensus that fully protected areas could maximize conservation outputs 233
(Fraschetti et al., 2018), Natura2000 sites are not meant to be exclusively fully protected 234
areas but rather areas where human activities are regulated and biological resources are used 235
sustainably, using the range partially protected area classes (Horta e Costa et al. 2016). 236
However, care should be given when assigning protection levels in the system of Natura2000 237
sites as not all classes of partially protected areas can confer ecological benefits and some 238
moderately protected areas, where some fishing activities are still allowed can be effective 239
only when adjacent to a fully protected area (Zupan et al. 2018b) 240
Targeted management actions for threat mitigation should be prioritized regionally (Pascual 241
et al., 2016; Gissi et al. 2018). For example, while fishing remains the largest threat and a 242
huge conservation challenge, the fishing types threatening marine biodiversity vary between 243
regions and the respective socio-cultural context. When looking at the more detailed 244

classification of threats in the Natura2000 dataset, professional active fishing (i.e. benthic, 245
demersal or pelagic trawling, demersal and purse seining, benthic dredging) is identified as 246
the most common fishing-related threat in the Atlantic MPAs, while leisure fishing (e.g. bait 247
digging, pole and spear fishing) dominates in MPAs in the other three regions. Although it is 248
well recognized that the design and establishment of conservation networks should consider a 249
coarser scale to ensure representativity, connectivity and replication of ecological conditions 250
(Rees et al. 2018), the importance of a given threat, its perceived and actual impact and the 251
potential solutions vary across spatial and administrative scales (Stelzenmüller et al. 2010). 252
Through multiple ecosystem services delivery, MPAs can attract tourism and recreation (e.g. 253
Rodriguez et al. 2017), but if not appropriately managed conceal a risk of impairing 254
conservation efficiency (Zupan et al. 2018b). Outdoor activities inside MPAs are often 255
proposed to raise awareness of citizens to conservation issues. Still, in partially protected 256
areas such activities may lead to unexpected impacts (Refs). If we further consider that MPAs 257
often attract masses of tourists (Dimitriadis et al., 2018; Ref), the pressures from such 258
activities is often higher in such partially protected areas compared to unprotected areas 259
(Zupan et al. 2018a). At the same time, given that outdoor and leisure activities often lead to 260
high economic benefits, restrictions upon such activities could raise obstacles in the 261
expansion, management, and acceptance of MPAs (Ruiz-Frau et al. 2013, Refs). Our results 262
showed for the first time that outdoor activities are among the most extensive threats in 263
European Natura2000 MPAs offering priorities for setting key management directions for this 264
highly heterogeneous European conservation network. However, the large range of potential 265
impacts of these threats is often difficult to assess (Refs), and therefore their consideration in 266
systematic spatial planning and risk assessment remains challenging.. Acknowledging that 267
outdoor and recreation activities could also embed many benefits for conservation, with 268
regional agreements setting a pillar for sustainable development (e.g. the European Stategy 269
for the Adriatic and Ionian region), the tradeoffs between benefits and threats should be made 270
clear along the management process. 271
Climate change is often cited as a major threat for marine protected areas (Bruno et al., 2018) 272
but seems rather underestimated in the European conservation network. Plausible 273
explanations could be a gap between scientific evidence on climate change and the perception 274
at local scale, a gap already detected in MPAs outside EU (e.g. Cvitanovic et al., 2014; 275
Hopkins et al. 2016). For example, there is ample evidence that the Mediterranean Sea is 276
very sensitive to climate change, with mounting evidence on adverse effects reported 277
throughout the region (e.g., Sara et al. 2014; Rilov 2016; Almpanidou et al., 2018). 278
However, most scientific advice spans over less than a decade, thus a short time lag for 279
reporting on the Natura2000 threats. Also a possible explanation may refer to the lack of 280
available information on physical and biochemical data at temporal and spatial scales relevant 281
to organisms’ biology and behavior, which could serve as a main obstacle in our 282
understanding on how ocean variability could affect biodiversity (Bates et al., 2018). Even in 283
the context of global changes such as increase in sea water temperature or ocean acidification, 284
management of local threats is a key for effective conservation. Global threats interact with 285
local threats and conditions, thus leading to cumulative effects on marine ecosystem 286
components (Stelzenmüller et al., 2018; Coll et al. 2008). Mitigating local threats is often 287
the only feasible course of action to reduce negative synergies with global threats. Still, 288
further efforts are needed to comprehensively monitor threats on marine biodiversity and 289
manage human impacts (Mazaris and Katsanevakis, 2018; Refs). With the need to attain 290
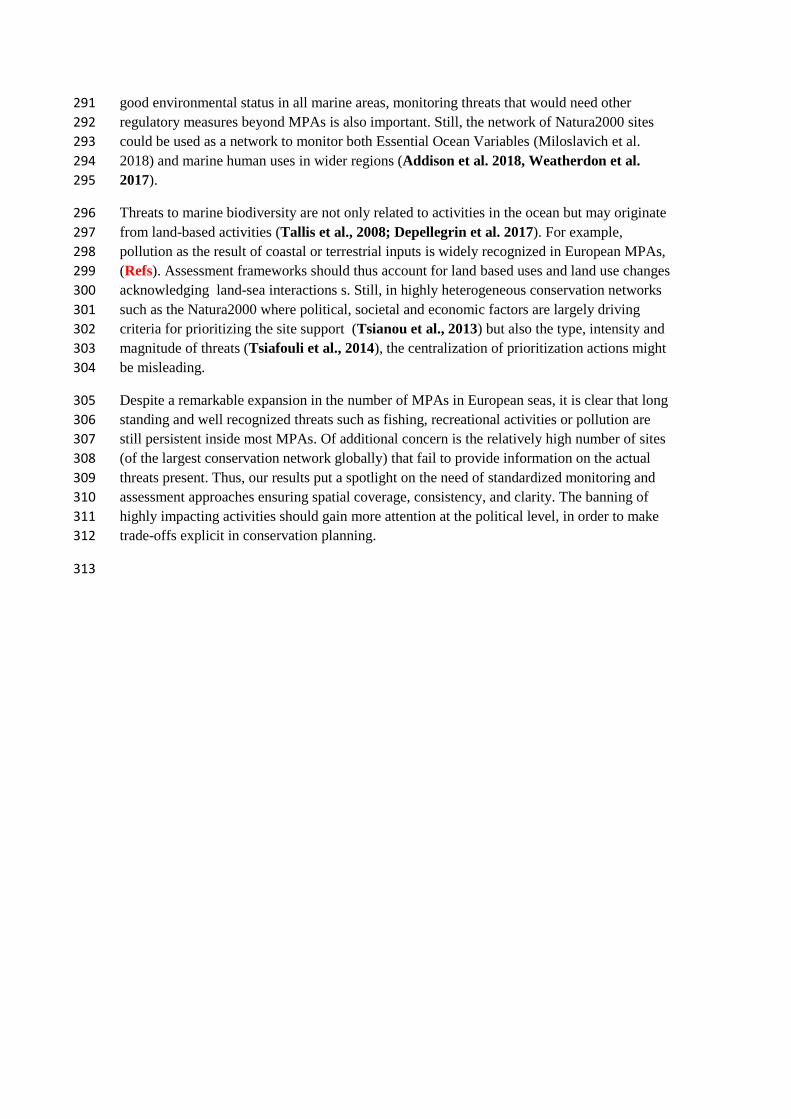
good environmental status in all marine areas, monitoring threats that would need other 291
regulatory measures beyond MPAs is also important. Still, the network of Natura2000 sites 292
could be used as a network to monitor both Essential Ocean Variables (Miloslavich et al. 293
2018) and marine human uses in wider regions (Addison et al. 2018, Weatherdon et al. 294
2017). 295
Threats to marine biodiversity are not only related to activities in the ocean but may originate 296
from land-based activities (Tallis et al., 2008; Depellegrin et al. 2017). For example, 297
pollution as the result of coastal or terrestrial inputs is widely recognized in European MPAs, 298
(Refs). Assessment frameworks should thus account for land based uses and land use changes 299
acknowledging land-sea interactions s. Still, in highly heterogeneous conservation networks 300
such as the Natura2000 where political, societal and economic factors are largely driving 301
criteria for prioritizing the site support (Tsianou et al., 2013) but also the type, intensity and 302
magnitude of threats (Tsiafouli et al., 2014), the centralization of prioritization actions might 303
be misleading. 304
Despite a remarkable expansion in the number of MPAs in European seas, it is clear that long 305
standing and well recognized threats such as fishing, recreational activities or pollution are 306
still persistent inside most MPAs. Of additional concern is the relatively high number of sites 307
(of the largest conservation network globally) that fail to provide information on the actual 308
threats present. Thus, our results put a spotlight on the need of standardized monitoring and 309
assessment approaches ensuring spatial coverage, consistency, and clarity. The banning of 310
highly impacting activities should gain more attention at the political level, in order to make 311
trade-offs explicit in conservation planning. 312
313
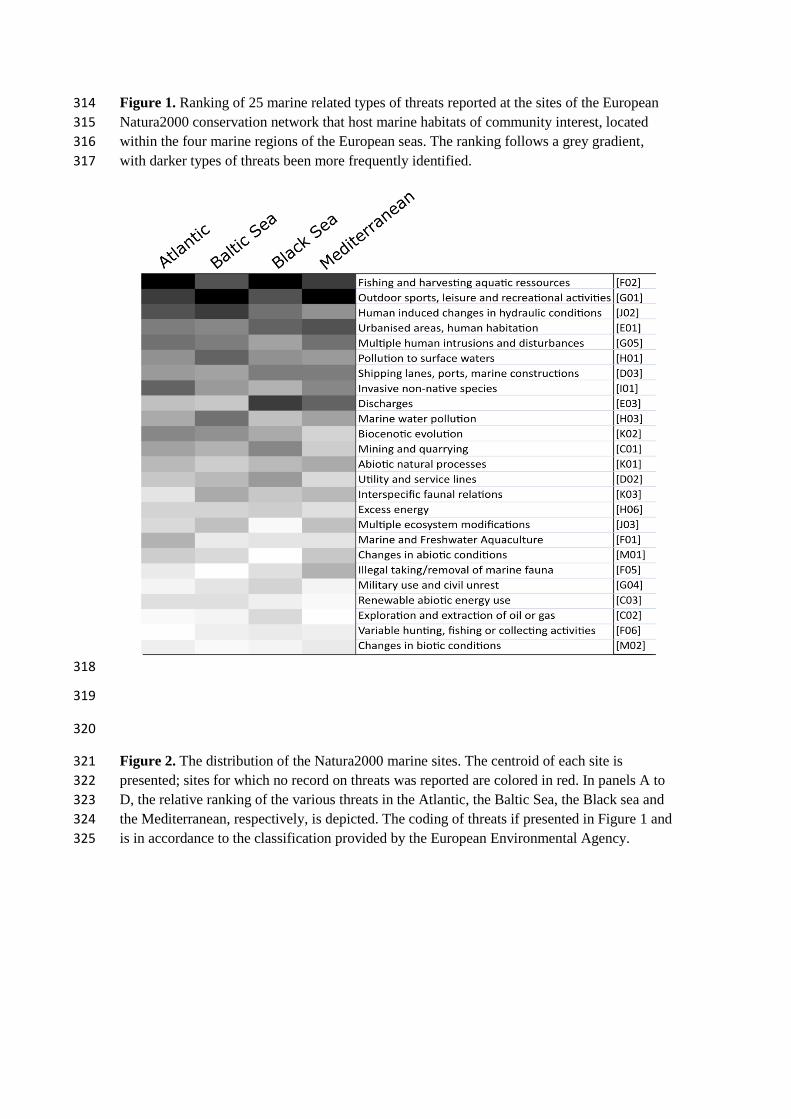
Figure 1. Ranking of 25 marine related types of threats reported at the sites of the European 314
Natura2000 conservation network that host marine habitats of community interest, located 315
within the four marine regions of the European seas. The ranking follows a grey gradient, 316
with darker types of threats been more frequently identified. 317
318
319
320
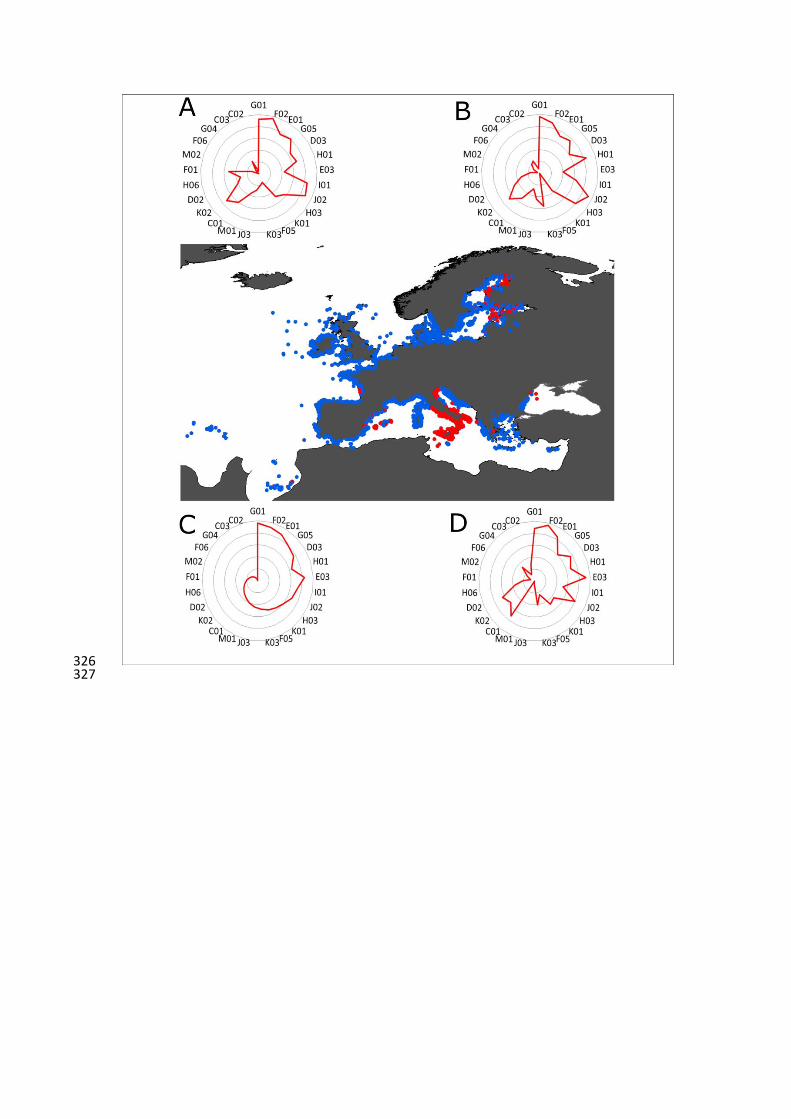
Figure 2. The distribution of the Natura2000 marine sites. The centroid of each site is 321
presented; sites for which no record on threats was reported are colored in red. In panels A to 322
D, the relative ranking of the various threats in the Atlantic, the Baltic Sea, the Black sea and 323
the Mediterranean, respectively, is depicted. The coding of threats if presented in Figure 1 and 324
is in accordance to the classification provided by the European Environmental Agency. 325
326 327

328
329
330
331
332