Embed Size (px)
Citation preview
www.danareksa.com See important disclosure on the back of this report
Danareksa research reports are alsoavailable at Reuters Multex and First CallDirect and Bloomberg.
CEMENT SECTOR/INITIATING COVERAGEThursday, 18 February 2016
Last Price, Rp 321No. of shares (mn) 5,931
Market Cap, Rp bn 1,904
(US$ mn) 1433M T/O, US$mn 0.1
HOLDTarget Price, Rp 350Upside 9.0%
SMBR IJ/SMBR.JK
SMBR relative to JCI Index
Market Recommendation
Antonia F. Hartono(62-21) 2955 5777 ext. [email protected]
Stefanus Darmagiri(62-21) 2955 5777 ext. [email protected]
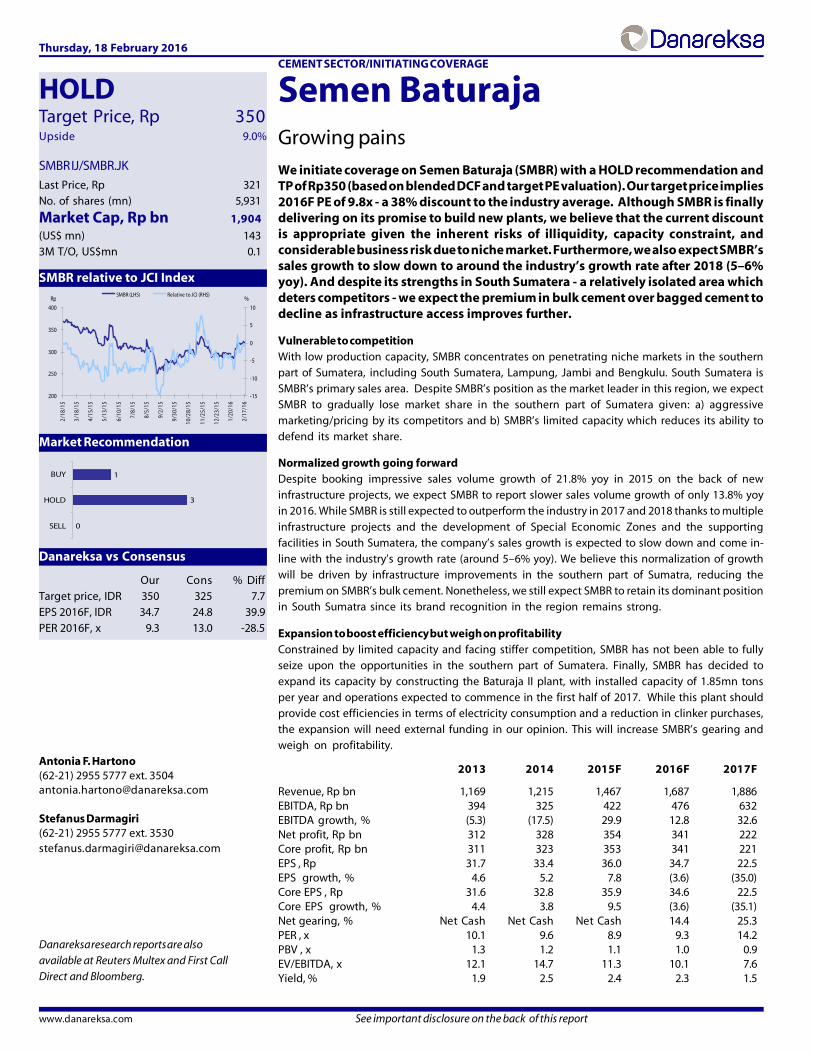
2013 2014 2015F 2016F 2017F
Revenue, Rp bn 1,169 1,215 1,467 1,687 1,886EBITDA, Rp bn 394 325 422 476 632EBITDA growth, % (5.3) (17.5) 29.9 12.8 32.6Net profit, Rp bn 312 328 354 341 222Core profit, Rp bn 311 323 353 341 221EPS , Rp 31.7 33.4 36.0 34.7 22.5EPS growth, % 4.6 5.2 7.8 (3.6) (35.0)Core EPS , Rp 31.6 32.8 35.9 34.6 22.5Core EPS growth, % 4.4 3.8 9.5 (3.6) (35.1)Net gearing, % Net Cash Net Cash Net Cash 14.4 25.3PER , x 10.1 9.6 8.9 9.3 14.2PBV , x 1.3 1.2 1.1 1.0 0.9EV/EBITDA, x 12.1 14.7 11.3 10.1 7.6Yield, % 1.9 2.5 2.4 2.3 1.5
Semen BaturajaGrowing pains
We initiate coverage on Semen Baturaja (SMBR) with a HOLD recommendation andTP of Rp350 (based on blended DCF and target PE valuation). Our target price implies2016F PE of 9.8x - a 38% discount to the industry average. Although SMBR is finallydelivering on its promise to build new plants, we believe that the current discountis appropriate given the inherent risks of illiquidity, capacity constraint, andconsiderable business risk due to niche market. Furthermore, we also expect SMBR’ssales growth to slow down to around the industry’s growth rate after 2018 (5–6%yoy). And despite its strengths in South Sumatera - a relatively isolated area whichdeters competitors - we expect the premium in bulk cement over bagged cement todecline as infrastructure access improves further.
Vulnerable to competitionWith low production capacity, SMBR concentrates on penetrating niche markets in the southernpart of Sumatera, including South Sumatera, Lampung, Jambi and Bengkulu. South Sumatera isSMBR’s primary sales area. Despite SMBR’s position as the market leader in this region, we expectSMBR to gradually lose market share in the southern part of Sumatera given: a) aggressivemarketing/pricing by its competitors and b) SMBR’s limited capacity which reduces its ability todefend its market share.
Normalized growth going forwardDespite booking impressive sales volume growth of 21.8% yoy in 2015 on the back of newinfrastructure projects, we expect SMBR to report slower sales volume growth of only 13.8% yoyin 2016. While SMBR is still expected to outperform the industry in 2017 and 2018 thanks to multiple
infrastructure projects and the development of Special Economic Zones and the supportingfacilities in South Sumatera, the company’s sales growth is expected to slow down and come in-line with the industry’s growth rate (around 5–6% yoy). We believe this normalization of growthwill be driven by infrastructure improvements in the southern part of Sumatra, reducing thepremium on SMBR’s bulk cement. Nonetheless, we still expect SMBR to retain its dominant positionin South Sumatra since its brand recognition in the region remains strong.
Expansion to boost efficiency but weigh on profitabilityConstrained by limited capacity and facing stiffer competition, SMBR has not been able to fullyseize upon the opportunities in the southern part of Sumatera. Finally, SMBR has decided toexpand its capacity by constructing the Baturaja II plant, with installed capacity of 1.85mn tonsper year and operations expected to commence in the first half of 2017. While this plant shouldprovide cost efficiencies in terms of electricity consumption and a reduction in clinker purchases,the expansion will need external funding in our opinion. This will increase SMBR’s gearing andweigh on profitability.
Our Cons % DiffTarget price, IDR 350 325 7.7EPS 2016F, IDR 34.7 24.8 39.9PER 2016F, x 9.3 13.0 -28.5
Danareksa vs Consensus
200
250
300
350
400
2/18
/15
3/18
/15
4/15
/15
5/13
/15
6/10
/15
7/8/
15
8/5/
15
9/2/
15
9/30
/15
10/2
8/15
11/2
5/15
12/2
3/15
1/20
/16
2/17
/16
-15
-10
-5
0
5
10
SMBR (LHS) Relative to JCI (RHS)%Rp
0
3
1
SELL
HOLD
BUY
2
18 February 2016 Semen Baturaja
SMBR was established in 1974 as a joint venture between Semen Gresik (45%) and Semen
Padang (55%). In 1979, SMBR changed its status to Limited Liability Corporation with an 88%stake held by the Indonesian Government, 7% by Semen Padang, and 5% by Semen Gresikbefore being fully acquired by the government in 1991. Its operations began in 1981underpinned by 500,000 tons of installed capacity, which has since increased threefold to2,000,000 tons with production facilities spread across South Sumatera and Lampung.
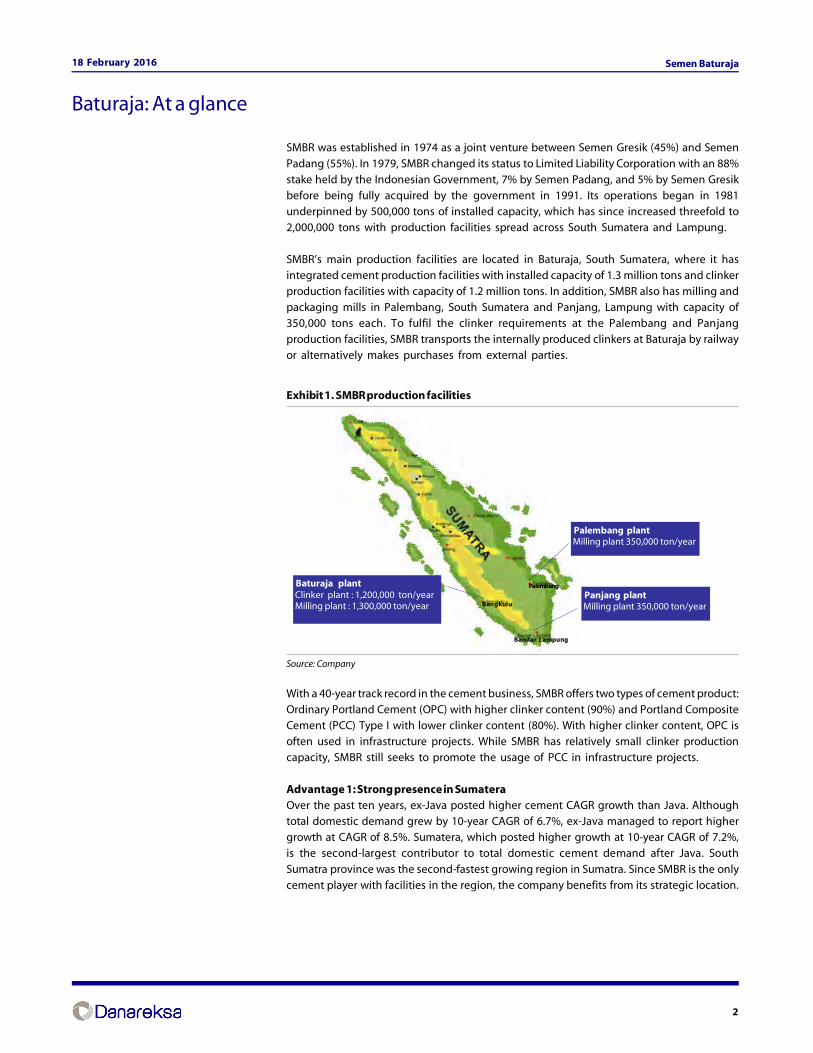
SMBR’s main production facilities are located in Baturaja, South Sumatera, where it hasintegrated cement production facilities with installed capacity of 1.3 million tons and clinkerproduction facilities with capacity of 1.2 million tons. In addition, SMBR also has milling andpackaging mills in Palembang, South Sumatera and Panjang, Lampung with capacity of350,000 tons each. To fulfil the clinker requirements at the Palembang and Panjangproduction facilities, SMBR transports the internally produced clinkers at Baturaja by railwayor alternatively makes purchases from external parties.
Exhibit 1. SMBR production facilities
Source: Company
With a 40-year track record in the cement business, SMBR offers two types of cement product:Ordinary Portland Cement (OPC) with higher clinker content (90%) and Portland CompositeCement (PCC) Type I with lower clinker content (80%). With higher clinker content, OPC isoften used in infrastructure projects. While SMBR has relatively small clinker productioncapacity, SMBR still seeks to promote the usage of PCC in infrastructure projects.
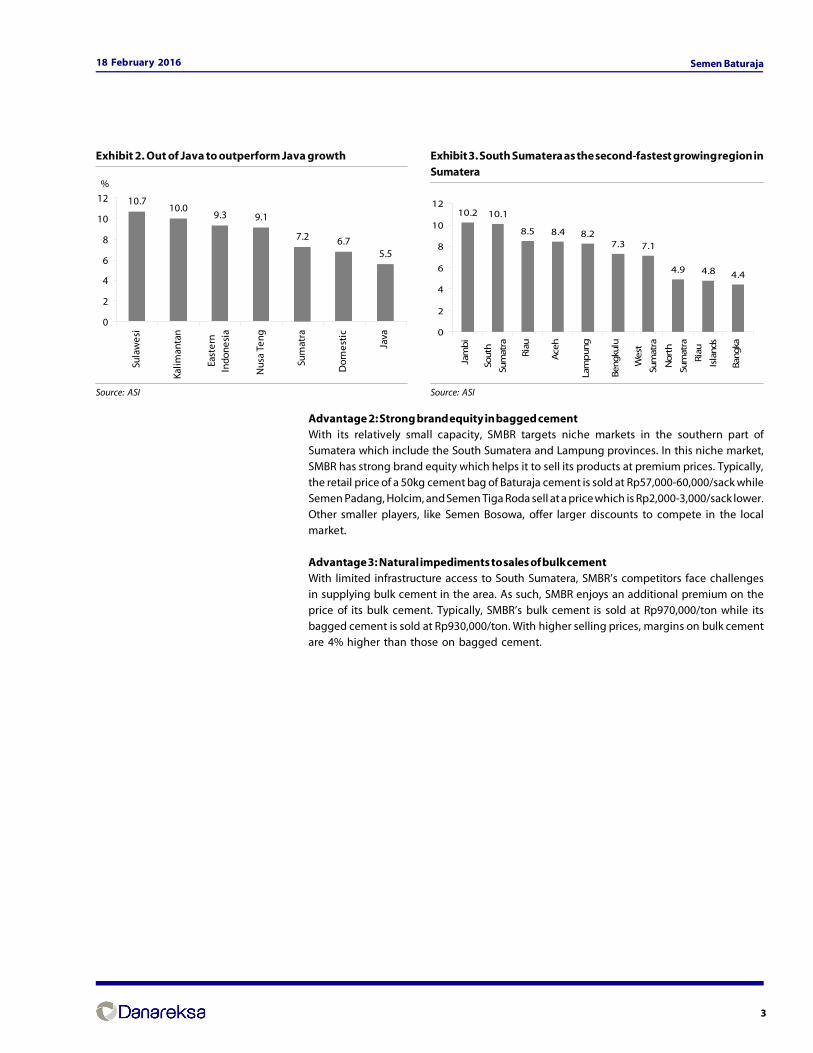
Advantage 1: Strong presence in SumateraOver the past ten years, ex-Java posted higher cement CAGR growth than Java. Althoughtotal domestic demand grew by 10-year CAGR of 6.7%, ex-Java managed to report highergrowth at CAGR of 8.5%. Sumatera, which posted higher growth at 10-year CAGR of 7.2%,is the second-largest contributor to total domestic cement demand after Java. South
Sumatra province was the second-fastest growing region in Sumatra. Since SMBR is the onlycement player with facilities in the region, the company benefits from its strategic location.
Baturaja: At a glance
Bengkulu
Palembang
Bandar Lampung
Palembang plant Milling plant 350,000 ton/year
Panjang plant Milling plant 350,000 ton/year
Baturaja plant Clinker plant : 1,200,000 ton/year Milling plant : 1,300,000 ton/year
3
18 February 2016 Semen Baturaja
Advantage 2: Strong brand equity in bagged cementWith its relatively small capacity, SMBR targets niche markets in the southern part ofSumatera which include the South Sumatera and Lampung provinces. In this niche market,SMBR has strong brand equity which helps it to sell its products at premium prices. Typically,the retail price of a 50kg cement bag of Baturaja cement is sold at Rp57,000-60,000/sack whileSemen Padang, Holcim, and Semen Tiga Roda sell at a price which is Rp2,000-3,000/sack lower.
Other smaller players, like Semen Bosowa, offer larger discounts to compete in the localmarket.
Advantage 3: Natural impediments to sales of bulk cementWith limited infrastructure access to South Sumatera, SMBR’s competitors face challengesin supplying bulk cement in the area. As such, SMBR enjoys an additional premium on theprice of its bulk cement. Typically, SMBR’s bulk cement is sold at Rp970,000/ton while itsbagged cement is sold at Rp930,000/ton. With higher selling prices, margins on bulk cementare 4% higher than those on bagged cement.
Exhibit 2. Out of Java to outperform Java growth
Source: ASI
Exhibit 3. South Sumatera as the second-fastest growing region inSumatera
Source: ASI
10.710.0
9.3 9.1
7.2 6.75.5
0
2
4
6
8
10
12
Sula
wes
i
Kalim
anta
n
East
ern
Indo
nesi
a
Nus
a Te
ng
Sum
atra
Dom
esti
c
Java
%
10.2 10.1
8.5 8.4 8.27.3 7.1
4.9 4.8 4.4
0
2
4
6
8
10
12
Jam
bi
Sou
th
Sum
atra
Ria
u
Ace
h
Lam
pun
g
Beng
kulu
We
st
Sum
atra
Nor
th
Sum
atra
Riau
Isla
nds
Ban
gka

4
18 February 2016 Semen Baturaja
Sales contribution by regionWith relatively small production capacity, SMBR focuses on niche markets in the southernpart of Sumatera, including South Sumatera, Lampung, Jambi and Bengkulu. SouthSumatera is SMBR’s primary sales area providing a 65% contribution in 1M16 (down from74% in 2015 with limited development of multiple infrastructure projects in the beginningof the year). Lampung province is the second largest market for SMBR with a 32%contribution to total sales in 1M16. Going forward, we expect South Sumatra’s contributionto increase even further as more infrastructure projects get underway.
Exhibit 4. SMBR sales contribution
Source: ASI
Tighter competition in regional marketsDespite SMBR’s leading position regionally, we foresee that SMBR has gradually loosen itsmarket share in the southern part of Sumatera given: a) aggressive marketing/pricing byits competitors and b) SMBR’s limited capacity which reduces its ability to defend its marketshare. Among its competitors, we note that Holcim Indonesia (SMCB) is the most determinedto gain market share in the southern part of Sumatera. As a result, the market share of SMCBhas surged over the past ten years to 26.6% in 1M16 from 5.5% in 2006.
Exhibit 5. SMBR’s market share in the southern part of Sumatera
Source: ASI
Vulnerable to competition
61% 59% 64% 66% 58% 58% 59% 61%70% 74%
65%
28% 31%33% 29%
32% 36% 37% 33%29% 24%
32%
0%
20%
40%
60%
80%
100%
2006 2007 2008 2009 2010 2011 2012 2013 2014 2015 1M16
South Sumatera Lampung Bangka Bengkulu Jambi Riau
38% 37% 36% 34% 34% 31% 28% 29% 26% 31% 25%
5.5% 8.2% 12.0% 14.3% 15.4%19.4% 21.8% 22.4% 23.5% 24.0% 26.6%
0%
20%
40%
60%
80%
100%
2006 2007 2008 2009 2010 2011 2012 2013 2014 2015 1M16
SMBR Padang SMCB INTP Bosowa Cemindo Gemilang
5
18 February 2016 Semen Baturaja
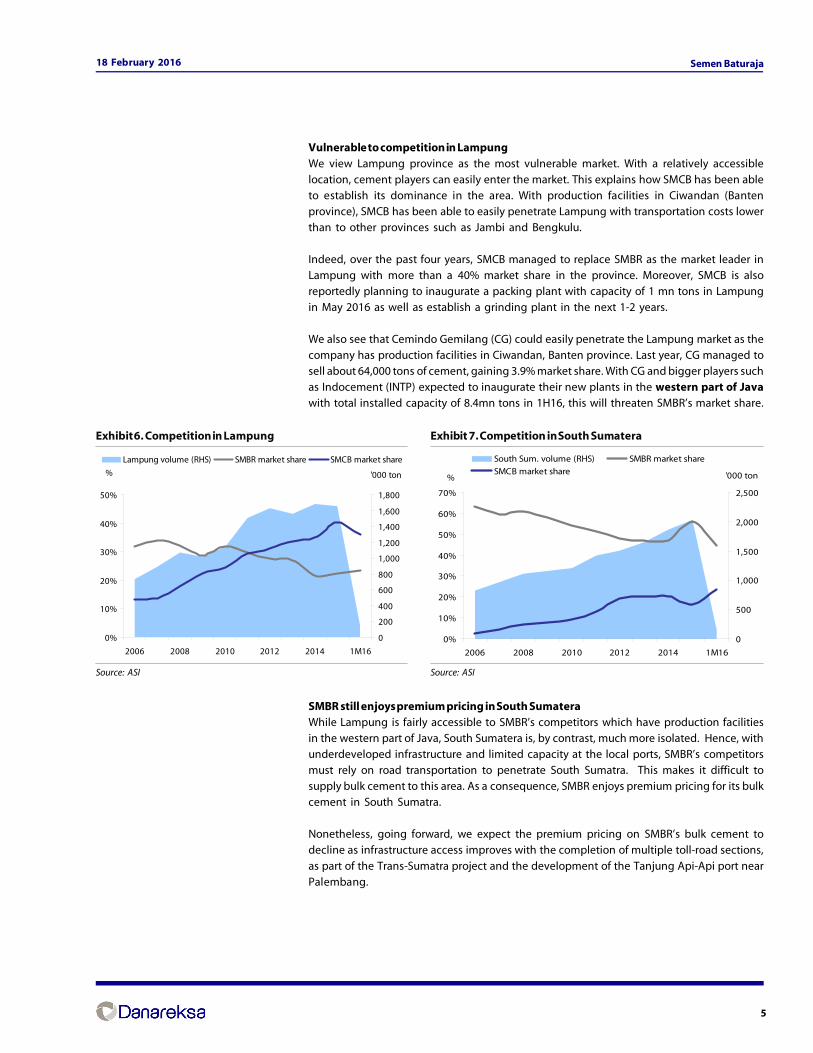
Vulnerable to competition in LampungWe view Lampung province as the most vulnerable market. With a relatively accessiblelocation, cement players can easily enter the market. This explains how SMCB has been ableto establish its dominance in the area. With production facilities in Ciwandan (Bantenprovince), SMCB has been able to easily penetrate Lampung with transportation costs lowerthan to other provinces such as Jambi and Bengkulu.
Indeed, over the past four years, SMCB managed to replace SMBR as the market leader inLampung with more than a 40% market share in the province. Moreover, SMCB is alsoreportedly planning to inaugurate a packing plant with capacity of 1 mn tons in Lampungin May 2016 as well as establish a grinding plant in the next 1-2 years.
We also see that Cemindo Gemilang (CG) could easily penetrate the Lampung market as thecompany has production facilities in Ciwandan, Banten province. Last year, CG managed tosell about 64,000 tons of cement, gaining 3.9% market share. With CG and bigger players suchas Indocement (INTP) expected to inaugurate their new plants in the western part of Javawith total installed capacity of 8.4mn tons in 1H16, this will threaten SMBR’s market share.
SMBR still enjoys premium pricing in South SumateraWhile Lampung is fairly accessible to SMBR’s competitors which have production facilitiesin the western part of Java, South Sumatera is, by contrast, much more isolated. Hence, withunderdeveloped infrastructure and limited capacity at the local ports, SMBR’s competitorsmust rely on road transportation to penetrate South Sumatra. This makes it difficult tosupply bulk cement to this area. As a consequence, SMBR enjoys premium pricing for its bulkcement in South Sumatra.
Nonetheless, going forward, we expect the premium pricing on SMBR’s bulk cement todecline as infrastructure access improves with the completion of multiple toll-road sections,
as part of the Trans-Sumatra project and the development of the Tanjung Api-Api port nearPalembang.
Exhibit 6. Competition in Lampung
Source: ASI
Exhibit 7. Competition in South Sumatera
Source: ASI
0%
10%
20%
30%
40%
50%
60%
70%
2006 2008 2010 2012 2014 1M16
%
0
500
1,000
1,500
2,000
2,500
'000 ton
South Sum. volume (RHS) SMBR market share
SMCB market share
0%
10%
20%
30%
40%
50%
2006 2008 2010 2012 2014 1M16
%
0
200
400
600
800
1,000
1,200
1,400
1,600
1,800
'000 ton
Lampung volume (RHS) SMBR market share SMCB market share
6
18 February 2016 Semen Baturaja
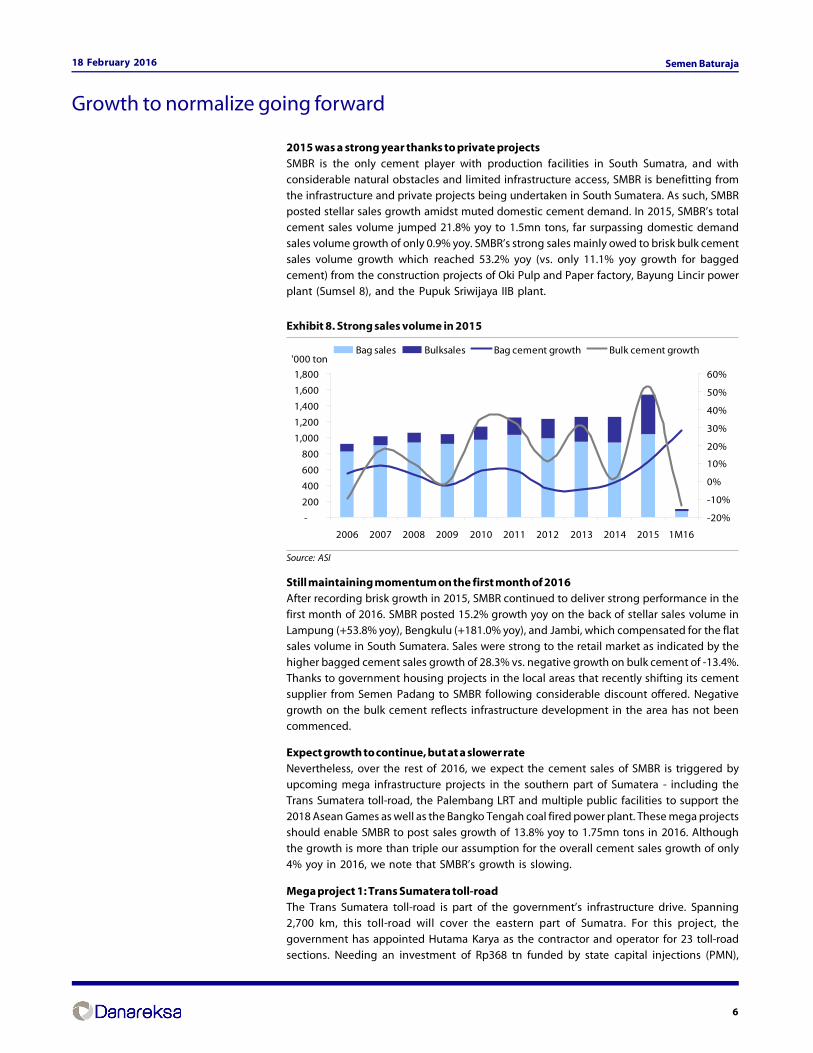
2015 was a strong year thanks to private projectsSMBR is the only cement player with production facilities in South Sumatra, and withconsiderable natural obstacles and limited infrastructure access, SMBR is benefitting fromthe infrastructure and private projects being undertaken in South Sumatera. As such, SMBRposted stellar sales growth amidst muted domestic cement demand. In 2015, SMBR’s totalcement sales volume jumped 21.8% yoy to 1.5mn tons, far surpassing domestic demandsales volume growth of only 0.9% yoy. SMBR’s strong sales mainly owed to brisk bulk cementsales volume growth which reached 53.2% yoy (vs. only 11.1% yoy growth for baggedcement) from the construction projects of Oki Pulp and Paper factory, Bayung Lincir powerplant (Sumsel 8), and the Pupuk Sriwijaya IIB plant.
Exhibit 8. Strong sales volume in 2015
Source: ASI
Still maintaining momentum on the first month of 2016After recording brisk growth in 2015, SMBR continued to deliver strong performance in thefirst month of 2016. SMBR posted 15.2% growth yoy on the back of stellar sales volume inLampung (+53.8% yoy), Bengkulu (+181.0% yoy), and Jambi, which compensated for the flatsales volume in South Sumatera. Sales were strong to the retail market as indicated by thehigher bagged cement sales growth of 28.3% vs. negative growth on bulk cement of -13.4%.Thanks to government housing projects in the local areas that recently shifting its cementsupplier from Semen Padang to SMBR following considerable discount offered. Negativegrowth on the bulk cement reflects infrastructure development in the area has not beencommenced.
Expect growth to continue, but at a slower rateNevertheless, over the rest of 2016, we expect the cement sales of SMBR is triggered byupcoming mega infrastructure projects in the southern part of Sumatera - including theTrans Sumatera toll-road, the Palembang LRT and multiple public facilities to support the2018 Asean Games as well as the Bangko Tengah coal fired power plant. These mega projectsshould enable SMBR to post sales growth of 13.8% yoy to 1.75mn tons in 2016. Althoughthe growth is more than triple our assumption for the overall cement sales growth of only
4% yoy in 2016, we note that SMBR’s growth is slowing.
Mega project 1: Trans Sumatera toll-roadThe Trans Sumatera toll-road is part of the government’s infrastructure drive. Spanning2,700 km, this toll-road will cover the eastern part of Sumatra. For this project, thegovernment has appointed Hutama Karya as the contractor and operator for 23 toll-roadsections. Needing an investment of Rp368 tn funded by state capital injections (PMN),
Growth to normalize going forward
-
200
400
600
800
1,000
1,200
1,400
1,600
1,800
2006 2007 2008 2009 2010 2011 2012 2013 2014 2015 1M16
'000 ton
-20%
-10%
0%
10%
20%
30%
40%
50%
60%
Bag sales Bulksales Bag cement growth Bulk cement growth
7
18 February 2016 Semen Baturaja
government loans, bilateral loans and bond issuances, this project started construction in
April 2015. In the first phase, Hutama Karya will develop 8 toll-sections covering a total lengthof 650 km with completion expected around 2017 – 2019.
To accelerate the construction progress in the first phase of the Trans Sumatera toll-roadproject, Presidential Decree No. 3/2016 has been issued by President Joko Widodo. Thisregulation stipulates that the licensing process for national strategic projects, such as thistoll road, should be shortened. First, the principal license needs to be issued within a oneday period, vs. 6 working days for normal projects. Second, recommendation from theminister, governor or regional government is needed to be issued within 5 days vs. twoweeks. For land acquisition - which is considered as the project’s main obstacle - the
government will provide support through (i) priority for land provision, and (ii) utilizationof the central and regional government area. The issuance of this regulation demonstratesthe government’s full commitment to accelerate strategic infrastructure projects and reducethe risk of delays in project realization.
With 4 sections of the first phase of the Trans Sumatera toll-road development located inSouth Sumatera; SMBR will benefit the most from this project. With average cementconsumption of 2,000 tons for the construction of each km of toll road, we estimate that thosetoll road sections will require about 694,000 tons of cement over the next 3 years.
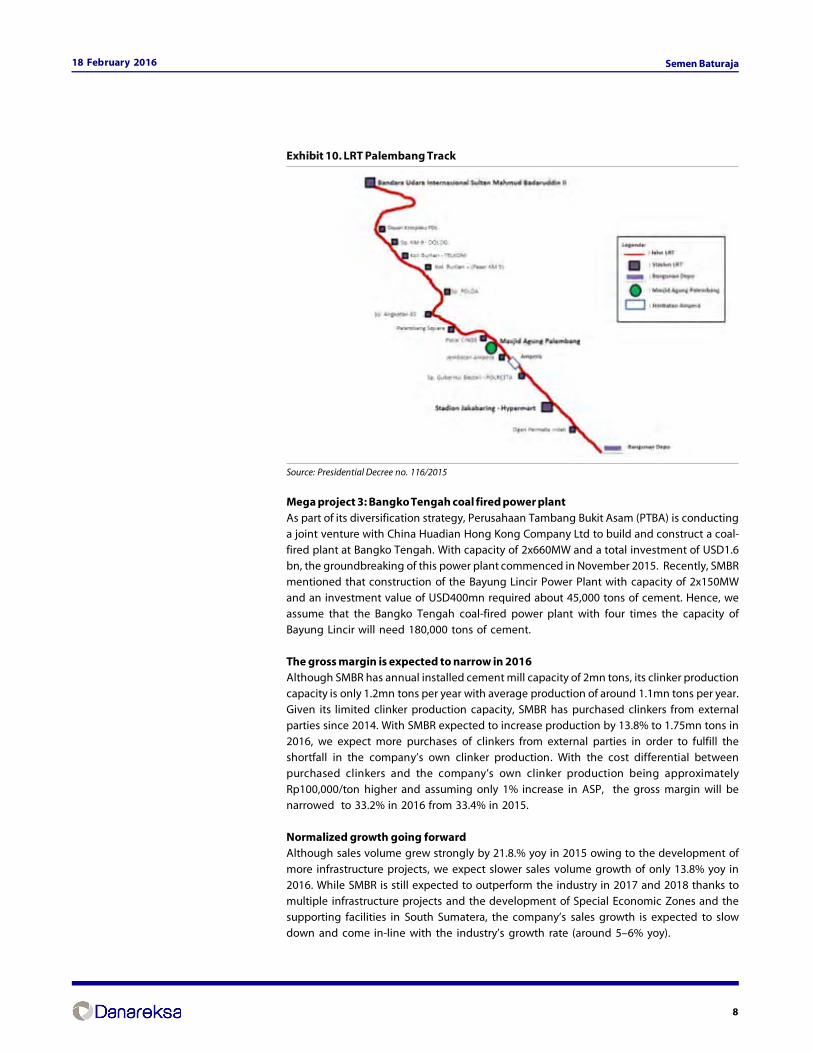
Mega project 2: LRT Palembang and multiple public facilities to support the 2018 AsianGamesThe Light Rail Transit (LRT) project in Palembang is one of several public facilities that willbe constructed to prepare Palembang for the Asian Games that will be carried out in the thirdquarter of 2018. With total length of 22km, the LRT track will connect Sultan MahmudBadaruddin II airport, Palembang city center and the Jakabaring sports complex. For thisproject, the government has appointed Waskita Karya (WKST) to undertake the construction.The physical construction started in December 2015 and it is expected to be completed by1H18 at the latest.
At the moment, SMBR is on the tender process to supply cement for the LRT project inPalembang, South Sumatra. As the winner for the tender is expected to be announced inthe near future, we believe that SMBR will likely to win this tender given SMBR is the only
player with production plant in South Sumatra. The management estimates that the LRT willrequire for about 260,000 tons of cement in the next three years with this year requirementis estimated about 150,000 tons.
Other infrastructure projects to support the 2018 Asian Games will be: a) the Sultan MahmudBadaruddin II flyover (total length of 455m), b) the Keramasan flyover (650m), c) the Musi IVbridge (635m), d) the Musi VI bridge and e) 16 towers at the athletes’ village with capacityto accommodate 7,000 people.
Exhibit 9. Progress of the first phase of the Trans Sumatera project
Length Investment Progress Completion targetKm Rp bn
Medan-Binjai 17 2,295 Construction progress 2.0%Land acquisition progress to reach 69.7% 2018Palembang-Simpang Indralaya 22 2,313 Construction progress 3.0%Land acqusition progress to reach 60.5% 2017Pekanbaru-Dumai 126 15,000 Land acquisition progress reached 21.5km 2018Bakauheni-Terbanggi Besar 140 17,389 Construction progress 0.5%Land acquisition progress to reach 16.4% and
expected to be completed by May 2016 2019Terbanggi Besar-Pematang Panggang 100 11,646 Construction is expected to be started in March 2016Started land acqusition
progress, expected to be completed by December 2016 2019Pematang Panggang-Kayu Agung 85 9,256 On feasibility study, expected to be completed by February 2016 2019Palembang-Tanjung Api-Api 100 On feasibility study, expected to be completed by February 2016 2019Kisaran-Tebing Tinggi 60 8,686 On feasibility study, expected to be completed by February 2016 2019
Source: Various publications
8
18 February 2016 Semen Baturaja
Exhibit 10. LRT Palembang Track
Source: Presidential Decree no. 116/2015
Mega project 3: Bangko Tengah coal fired power plantAs part of its diversification strategy, Perusahaan Tambang Bukit Asam (PTBA) is conductinga joint venture with China Huadian Hong Kong Company Ltd to build and construct a coal-fired plant at Bangko Tengah. With capacity of 2x660MW and a total investment of USD1.6bn, the groundbreaking of this power plant commenced in November 2015. Recently, SMBRmentioned that construction of the Bayung Lincir Power Plant with capacity of 2x150MWand an investment value of USD400mn required about 45,000 tons of cement. Hence, weassume that the Bangko Tengah coal-fired power plant with four times the capacity ofBayung Lincir will need 180,000 tons of cement.
The gross margin is expected to narrow in 2016Although SMBR has annual installed cement mill capacity of 2mn tons, its clinker productioncapacity is only 1.2mn tons per year with average production of around 1.1mn tons per year.Given its limited clinker production capacity, SMBR has purchased clinkers from externalparties since 2014. With SMBR expected to increase production by 13.8% to 1.75mn tons in2016, we expect more purchases of clinkers from external parties in order to fulfill theshortfall in the company’s own clinker production. With the cost differential betweenpurchased clinkers and the company’s own clinker production being approximatelyRp100,000/ton higher and assuming only 1% increase in ASP, the gross margin will benarrowed to 33.2% in 2016 from 33.4% in 2015.
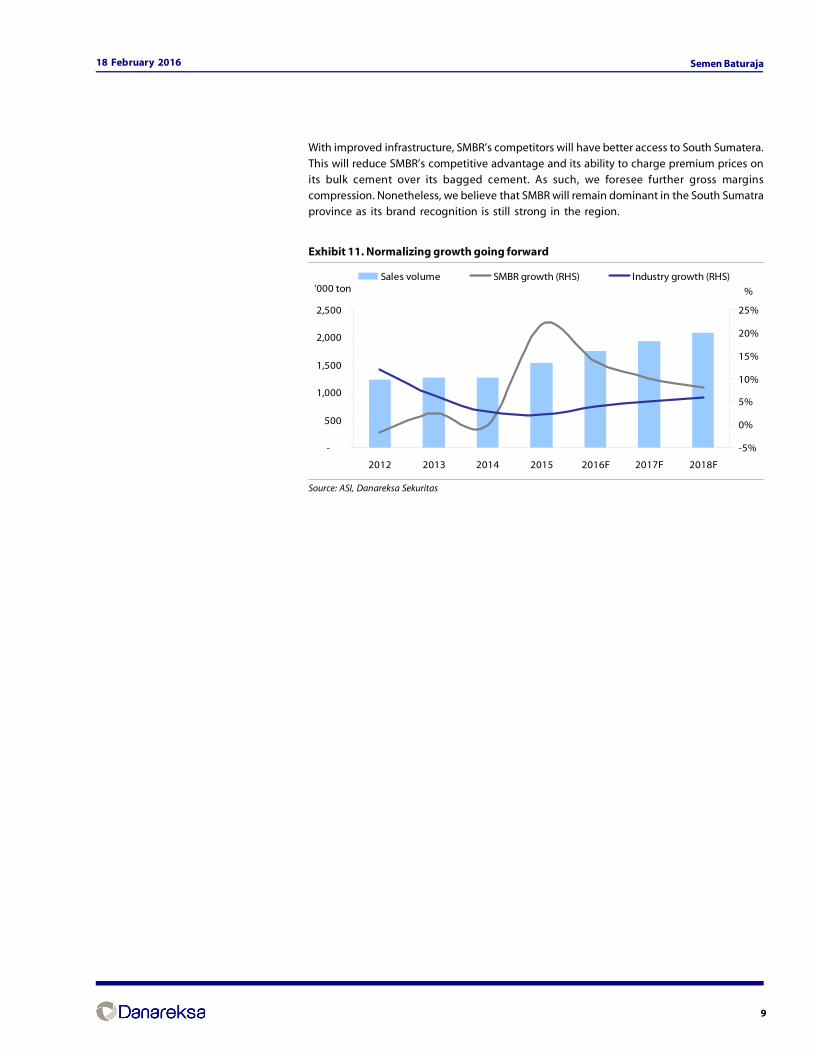
Normalized growth going forwardAlthough sales volume grew strongly by 21.8.% yoy in 2015 owing to the development of
more infrastructure projects, we expect slower sales volume growth of only 13.8% yoy in2016. While SMBR is still expected to outperform the industry in 2017 and 2018 thanks tomultiple infrastructure projects and the development of Special Economic Zones and thesupporting facilities in South Sumatera, the company’s sales growth is expected to slowdown and come in-line with the industry’s growth rate (around 5–6% yoy).
9
18 February 2016 Semen Baturaja
With improved infrastructure, SMBR’s competitors will have better access to South Sumatera.
This will reduce SMBR’s competitive advantage and its ability to charge premium prices onits bulk cement over its bagged cement. As such, we foresee further gross marginscompression. Nonetheless, we believe that SMBR will remain dominant in the South Sumatraprovince as its brand recognition is still strong in the region.
Exhibit 11. Normalizing growth going forward
Source: ASI, Danareksa Sekuritas
-
500
1,000
1,500
2,000
2,500
2012 2013 2014 2015 2016F 2017F 2018F
'000 ton
-5%
0%
5%
10%
15%
20%
25%
%
Sales volume SMBR growth (RHS) Industry growth (RHS)
10
18 February 2016 Semen Baturaja
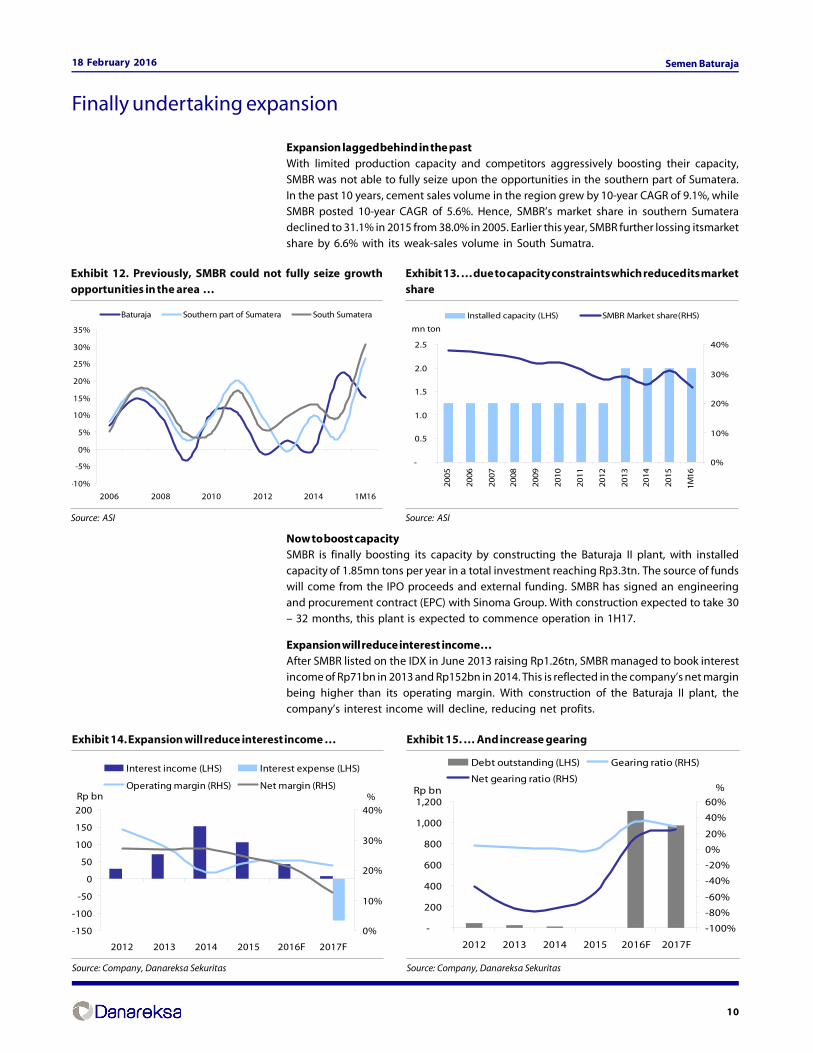
Expansion lagged behind in the pastWith limited production capacity and competitors aggressively boosting their capacity,SMBR was not able to fully seize upon the opportunities in the southern part of Sumatera.In the past 10 years, cement sales volume in the region grew by 10-year CAGR of 9.1%, whileSMBR posted 10-year CAGR of 5.6%. Hence, SMBR’s market share in southern Sumateradeclined to 31.1% in 2015 from 38.0% in 2005. Earlier this year, SMBR further lossing itsmarketshare by 6.6% with its weak-sales volume in South Sumatra.
Now to boost capacitySMBR is finally boosting its capacity by constructing the Baturaja II plant, with installedcapacity of 1.85mn tons per year in a total investment reaching Rp3.3tn. The source of fundswill come from the IPO proceeds and external funding. SMBR has signed an engineeringand procurement contract (EPC) with Sinoma Group. With construction expected to take 30– 32 months, this plant is expected to commence operation in 1H17.
Expansion will reduce interest income…After SMBR listed on the IDX in June 2013 raising Rp1.26tn, SMBR managed to book interestincome of Rp71bn in 2013 and Rp152bn in 2014. This is reflected in the company’s net marginbeing higher than its operating margin. With construction of the Baturaja II plant, thecompany’s interest income will decline, reducing net profits.
Finally undertaking expansion
Exhibit 14. Expansion will reduce interest income …
Source: Company, Danareksa Sekuritas
Exhibit 15. … And increase gearing
Source: Company, Danareksa Sekuritas
Exhibit 12. Previously, SMBR could not fully seize growthopportunities in the area …
Source: ASI
Exhibit 13. … due to capacity constraints which reduced its marketshare
Source: ASI
-10%
-5%
0%
5%
10%
15%
20%
25%
30%
35%
2006 2008 2010 2012 2014 1M16
Baturaja Southern part of Sumatera South Sumatera
-
0.5
1.0
1.5
2.0
2.5
2005
2006
2007
2008
2009
2010
2011
2012
2013
2014
2015
1M16
mn ton
0%
10%
20%
30%
40%
Installed capacity (LHS) SMBR Market share(RHS)
-150
-100
-50
0
50
100
150
200
2012 2013 2014 2015 2016F 2017F
Rp bn
0%
10%
20%
30%
40%%
Interest income (LHS) Interest expense (LHS)
Operating margin (RHS) Net margin (RHS)
-
200
400
600
800
1,000
1,200
2012 2013 2014 2015 2016F 2017F
Rp bn
-100%
-80%
-60%
-40%
-20%
0%
20%
40%
60%
%
Debt outstanding (LHS) Gearing ratio (RHS)
Net gearing ratio (RHS)
11
18 February 2016 Semen Baturaja
10%
0%6%61%
2% 0%
0%
21%
0%
71%
0%
8%
0%0%2%
0%
19%
0%
SMBR Bosowa Cemindo GemilangGresik SMCB INTPJui Shin Indonesia Kupang Padang
15%
0%
54%
2%
0%
26%
0%0%3%
84%
0%
2%0%
5%1% 0% 8%
0%
SMBR Bosowa Cemindo GemilangGresik SMCB INTPJui Shin Indonesia Kupang Padang
3%
0%
0%
85%
0%
10%0%
0%2%
2%
0%
0%
84%
2%3% 0%
9%
0%
…and push up gearingAs the expansion will require external funding of Rp1 – 1.5tn, we estimate that SMBR’s netgearing will increase to 14.0% and 24.6% in 2016 and 2017, respectively, from a net cash anddebt free position. While the balance sheet is expected to remain strong, the use of loanswill lower the earnings of SMBR in the future. Currently, the management is in the processof negotiating the loan-terms with several banks, and thus the term of financing has notyet been determined.
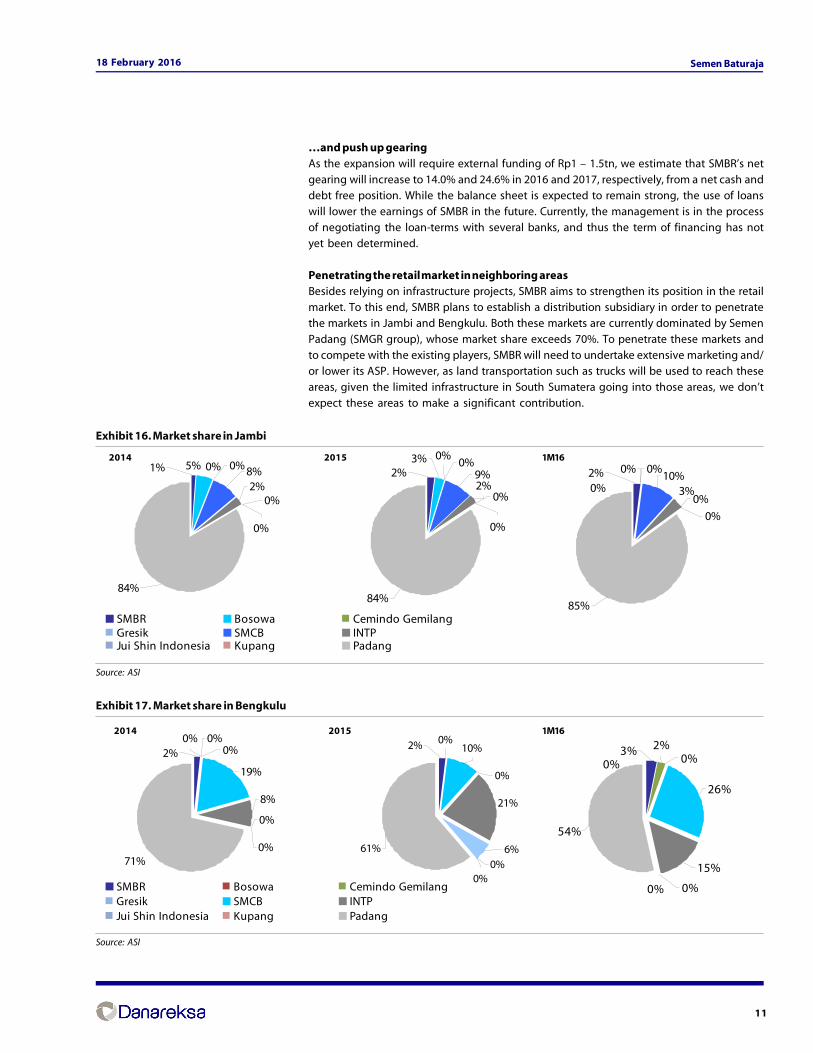
Penetrating the retail market in neighboring areasBesides relying on infrastructure projects, SMBR aims to strengthen its position in the retailmarket. To this end, SMBR plans to establish a distribution subsidiary in order to penetratethe markets in Jambi and Bengkulu. Both these markets are currently dominated by SemenPadang (SMGR group), whose market share exceeds 70%. To penetrate these markets andto compete with the existing players, SMBR will need to undertake extensive marketing and/or lower its ASP. However, as land transportation such as trucks will be used to reach theseareas, given the limited infrastructure in South Sumatera going into those areas, we don’texpect these areas to make a significant contribution.
Exhibit 16. Market share in Jambi
Source: ASI
Exhibit 17. Market share in Bengkulu
Source: ASI
2014 2015 1M16
1M1620152014
12
18 February 2016 Semen Baturaja
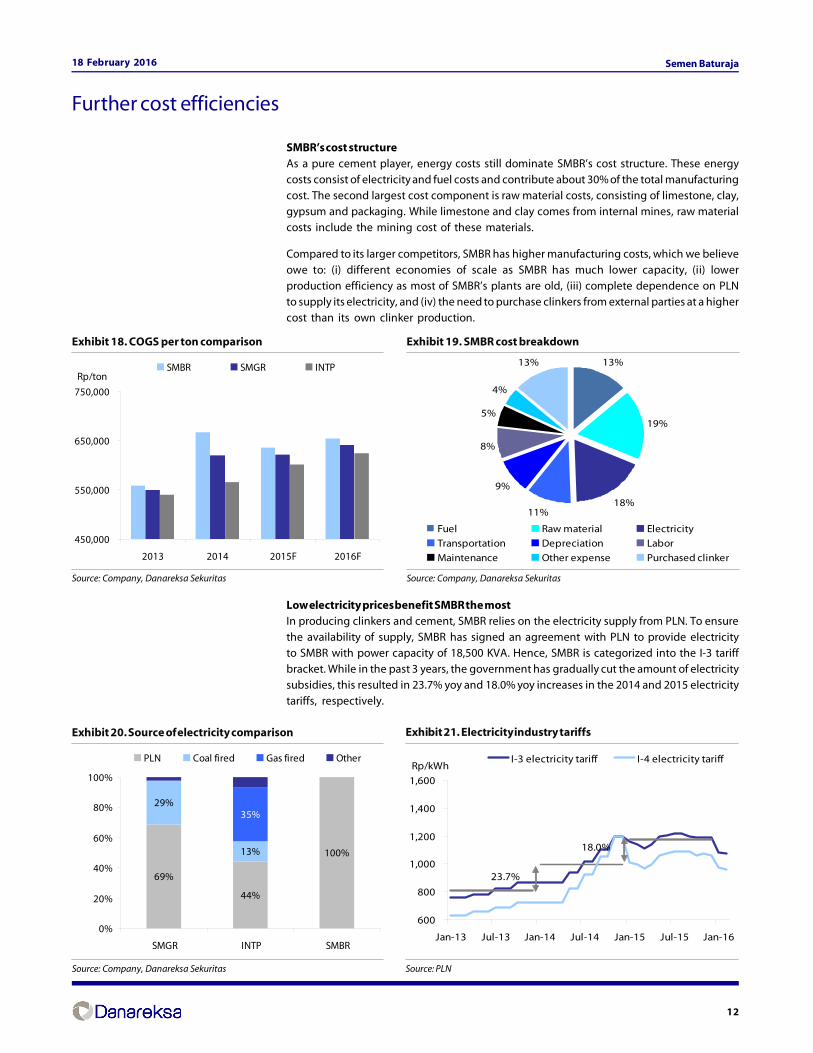
SMBR’s cost structureAs a pure cement player, energy costs still dominate SMBR’s cost structure. These energycosts consist of electricity and fuel costs and contribute about 30% of the total manufacturingcost. The second largest cost component is raw material costs, consisting of limestone, clay,gypsum and packaging. While limestone and clay comes from internal mines, raw materialcosts include the mining cost of these materials.
Compared to its larger competitors, SMBR has higher manufacturing costs, which we believeowe to: (i) different economies of scale as SMBR has much lower capacity, (ii) lowerproduction efficiency as most of SMBR’s plants are old, (iii) complete dependence on PLNto supply its electricity, and (iv) the need to purchase clinkers from external parties at a highercost than its own clinker production.
Low electricity prices benefit SMBR the mostIn producing clinkers and cement, SMBR relies on the electricity supply from PLN. To ensurethe availability of supply, SMBR has signed an agreement with PLN to provide electricityto SMBR with power capacity of 18,500 KVA. Hence, SMBR is categorized into the I-3 tariffbracket. While in the past 3 years, the government has gradually cut the amount of electricitysubsidies, this resulted in 23.7% yoy and 18.0% yoy increases in the 2014 and 2015 electricitytariffs, respectively.
Further cost efficiencies
Exhibit 18. COGS per ton comparison
Source: Company, Danareksa Sekuritas
Exhibit 19. SMBR cost breakdown
Source: Company, Danareksa Sekuritas
450,000
550,000
650,000
750,000
2013 2014 2015F 2016F
Rp/tonSMBR SMGR INTP 13%
19%
18%11%
9%
8%
5%
4%
13%
Fuel Raw material Electricity
Transportation Depreciation Labor
Maintenance Other expense Purchased clinker
Exhibit 20. Source of electricity comparison
Source: Company, Danareksa Sekuritas
Exhibit 21. Electricity industry tariffs
Source: PLN
69%
44%
100%
29%
13%
35%
0%
20%
40%
60%
80%
100%
SMGR INTP SMBR
PLN Coal fired Gas fired Other
600
800
1,000
1,200
1,400
1,600
Jan-13 Jul-13 Jan-14 Jul-14 Jan-15 Jul-15 Jan-16
Rp/kWhI-3 electricity tariff I-4 electricity tariff
18.0%
23.7%
13
18 February 2016 Semen Baturaja
On 1 May 2014, the government introduced a new formula to adjust monthly electricity tariffs
to be effective in the beginning of 2015. This formula takes into account the foreignexchange rate, inflation and the Indonesia Crude Price (ICP). On the back of lower ICP, theI-3 tariff in February 2016 was reduced by 9.1% to Rp1,071/kWh from an average electricitytariff in 2015 of Rp1,177/kWh. With the currently beleaguered global oil prices, and thereforelow electricity tariffs, we believe that SMBR stands to benefit the most given that it fully relieson PLN for its electricity.
Under the third economic package released in October 2015, PLN provides a 30% tariffreduction for usage between 11pm to 8am. This will benefit SMBR and other cement playersthat use electricity. To enjoy the incentive, however, cement players need to enter into furtherdiscussions with PLN so that an agreement report can be issued. SMBR and other cementplayers have obtained this incentive since the beginning of the year. As the electricity tariffrepresents 18% of SMBR’s total manufacturing costs, the incentive is expected to result ina 1 – 2% reduction in SMBR’s production cost per ton.
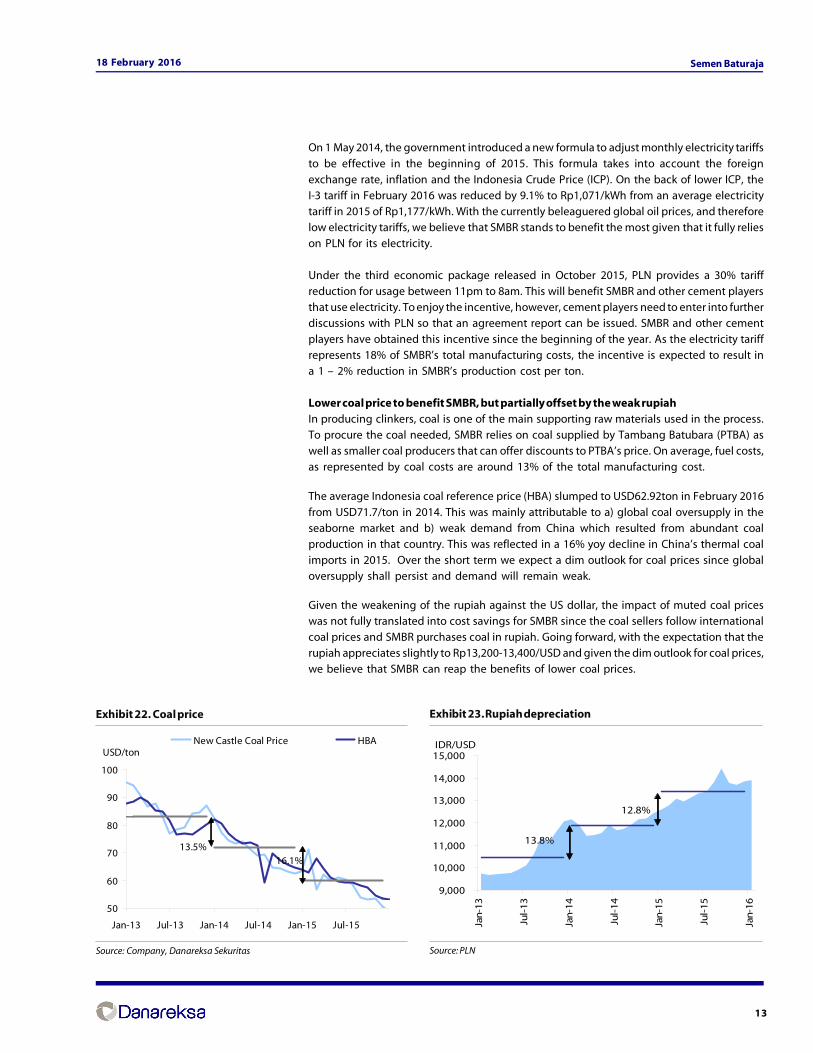
Lower coal price to benefit SMBR, but partially offset by the weak rupiahIn producing clinkers, coal is one of the main supporting raw materials used in the process.To procure the coal needed, SMBR relies on coal supplied by Tambang Batubara (PTBA) aswell as smaller coal producers that can offer discounts to PTBA’s price. On average, fuel costs,as represented by coal costs are around 13% of the total manufacturing cost.
The average Indonesia coal reference price (HBA) slumped to USD62.92ton in February 2016
from USD71.7/ton in 2014. This was mainly attributable to a) global coal oversupply in theseaborne market and b) weak demand from China which resulted from abundant coalproduction in that country. This was reflected in a 16% yoy decline in China’s thermal coalimports in 2015. Over the short term we expect a dim outlook for coal prices since globaloversupply shall persist and demand will remain weak.
Given the weakening of the rupiah against the US dollar, the impact of muted coal priceswas not fully translated into cost savings for SMBR since the coal sellers follow internationalcoal prices and SMBR purchases coal in rupiah. Going forward, with the expectation that therupiah appreciates slightly to Rp13,200-13,400/USD and given the dim outlook for coal prices,we believe that SMBR can reap the benefits of lower coal prices.
Exhibit 22. Coal price
Source: Company, Danareksa Sekuritas
Exhibit 23. Rupiah depreciation
Source: PLN
50
60
70
80
90
100
Jan-13 Jul-13 Jan-14 Jul-14 Jan-15 Jul-15
USD/tonNew Castle Coal Price HBA
16.1%13.5%
9,000
10,000
11,000
12,000
13,000
14,000
15,000
Jan-
13
Jul-
13
Jan-
14
Jul-
14
Jan-
15
Jul-
15
Jan-
16IDR/USD
13.8%
12.8%
14
18 February 2016 Semen Baturaja
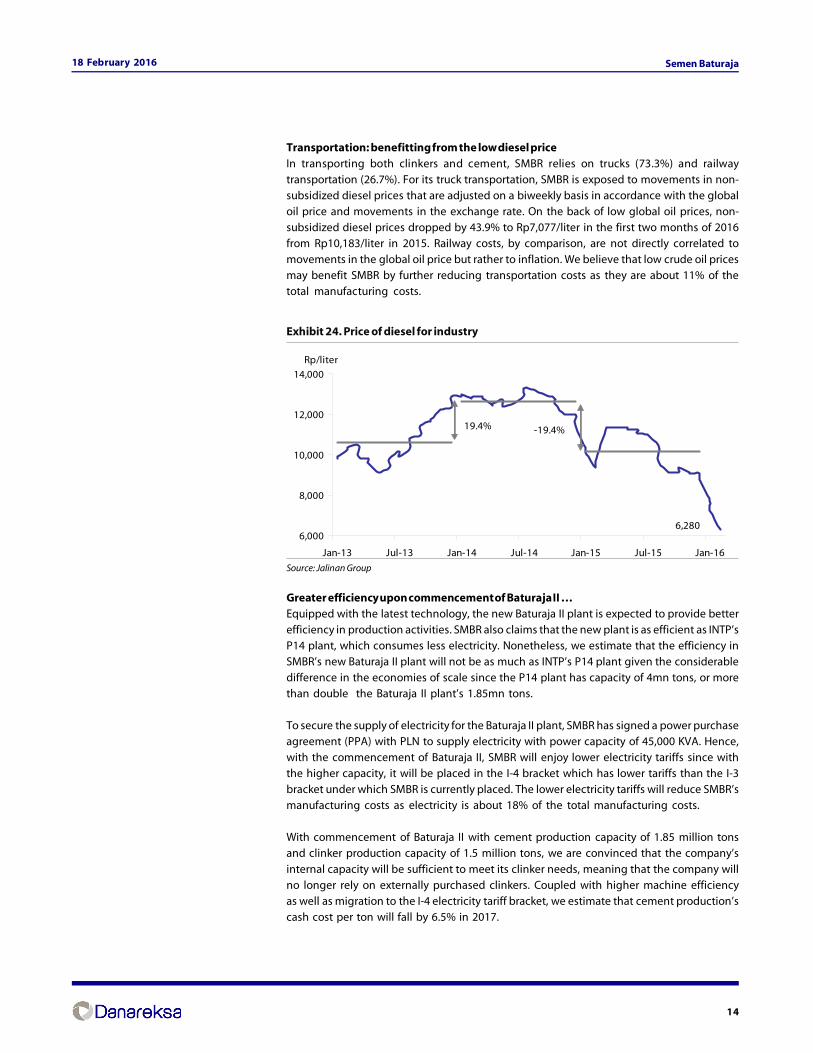
Transportation: benefitting from the low diesel priceIn transporting both clinkers and cement, SMBR relies on trucks (73.3%) and railwaytransportation (26.7%). For its truck transportation, SMBR is exposed to movements in non-subsidized diesel prices that are adjusted on a biweekly basis in accordance with the globaloil price and movements in the exchange rate. On the back of low global oil prices, non-subsidized diesel prices dropped by 43.9% to Rp7,077/liter in the first two months of 2016from Rp10,183/liter in 2015. Railway costs, by comparison, are not directly correlated tomovements in the global oil price but rather to inflation. We believe that low crude oil pricesmay benefit SMBR by further reducing transportation costs as they are about 11% of thetotal manufacturing costs.
Exhibit 24. Price of diesel for industry
Source: Jalinan Group
Greater efficiency upon commencement of Baturaja II …Equipped with the latest technology, the new Baturaja II plant is expected to provide betterefficiency in production activities. SMBR also claims that the new plant is as efficient as INTP’sP14 plant, which consumes less electricity. Nonetheless, we estimate that the efficiency inSMBR’s new Baturaja II plant will not be as much as INTP’s P14 plant given the considerabledifference in the economies of scale since the P14 plant has capacity of 4mn tons, or morethan double the Baturaja II plant’s 1.85mn tons.
To secure the supply of electricity for the Baturaja II plant, SMBR has signed a power purchaseagreement (PPA) with PLN to supply electricity with power capacity of 45,000 KVA. Hence,with the commencement of Baturaja II, SMBR will enjoy lower electricity tariffs since withthe higher capacity, it will be placed in the I-4 bracket which has lower tariffs than the I-3bracket under which SMBR is currently placed. The lower electricity tariffs will reduce SMBR’smanufacturing costs as electricity is about 18% of the total manufacturing costs.
With commencement of Baturaja II with cement production capacity of 1.85 million tonsand clinker production capacity of 1.5 million tons, we are convinced that the company’s
internal capacity will be sufficient to meet its clinker needs, meaning that the company willno longer rely on externally purchased clinkers. Coupled with higher machine efficiencyas well as migration to the I-4 electricity tariff bracket, we estimate that cement production’scash cost per ton will fall by 6.5% in 2017.
6,2806,000
8,000
10,000
12,000
14,000
Jan-13 Jul-13 Jan-14 Jul-14 Jan-15 Jul-15 Jan-16
Rp/liter
19.4% -19.4%
15
18 February 2016 Semen Baturaja
Exhibit 25. SMBR cash cost, production cost and gross profit margin
Source: Company, Danareksa Sekuritas
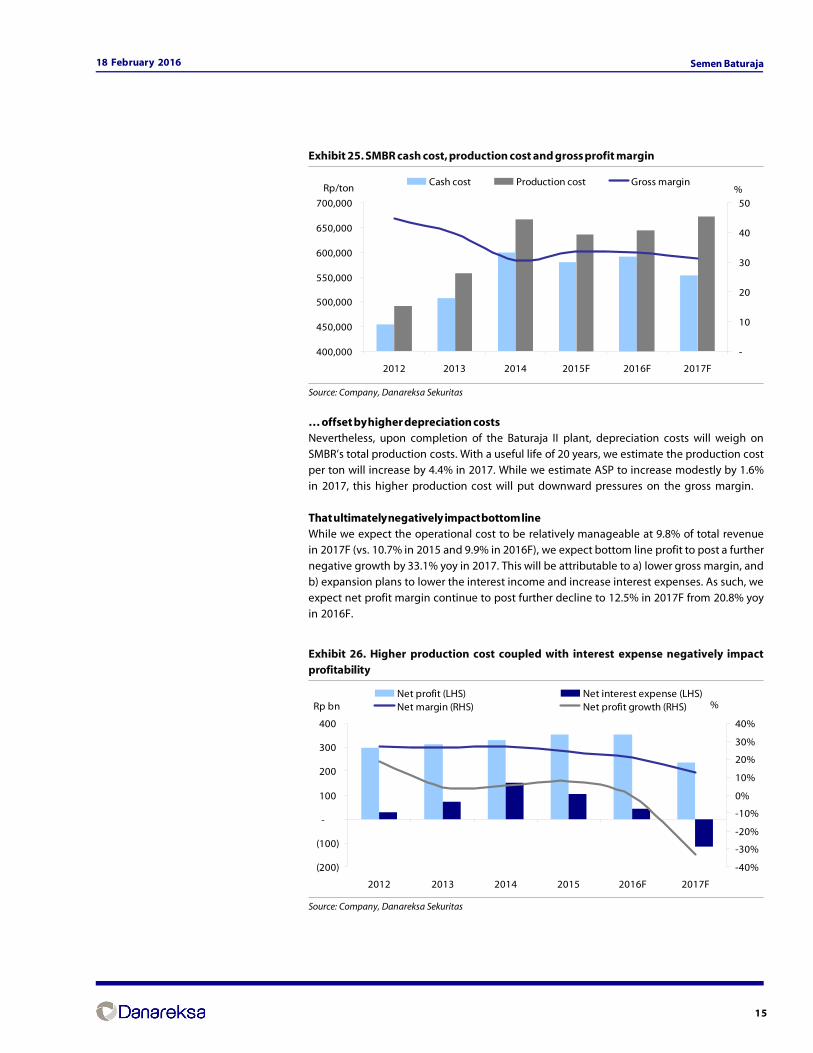
… offset by higher depreciation costsNevertheless, upon completion of the Baturaja II plant, depreciation costs will weigh onSMBR’s total production costs. With a useful life of 20 years, we estimate the production costper ton will increase by 4.4% in 2017. While we estimate ASP to increase modestly by 1.6%in 2017, this higher production cost will put downward pressures on the gross margin.
That ultimately negatively impact bottom lineWhile we expect the operational cost to be relatively manageable at 9.8% of total revenuein 2017F (vs. 10.7% in 2015 and 9.9% in 2016F), we expect bottom line profit to post a furthernegative growth by 33.1% yoy in 2017. This will be attributable to a) lower gross margin, andb) expansion plans to lower the interest income and increase interest expenses. As such, weexpect net profit margin continue to post further decline to 12.5% in 2017F from 20.8% yoyin 2016F.
Exhibit 26. Higher production cost coupled with interest expense negatively impactprofitability
Source: Company, Danareksa Sekuritas
400,000
450,000
500,000
550,000
600,000
650,000
700,000
2012 2013 2014 2015F 2016F 2017F
Rp/ton
-
10
20
30
40
50%
Cash cost Production cost Gross margin
(200)
(100)
-
100
200
300
400
2012 2013 2014 2015 2016F 2017F
Rp bn
-40%
-30%
-20%
-10%
0%
10%
20%
30%
40%
%Net profit (LHS) Net interest expense (LHS)Net margin (RHS) Net profit growth (RHS)
16
18 February 2016 Semen Baturaja
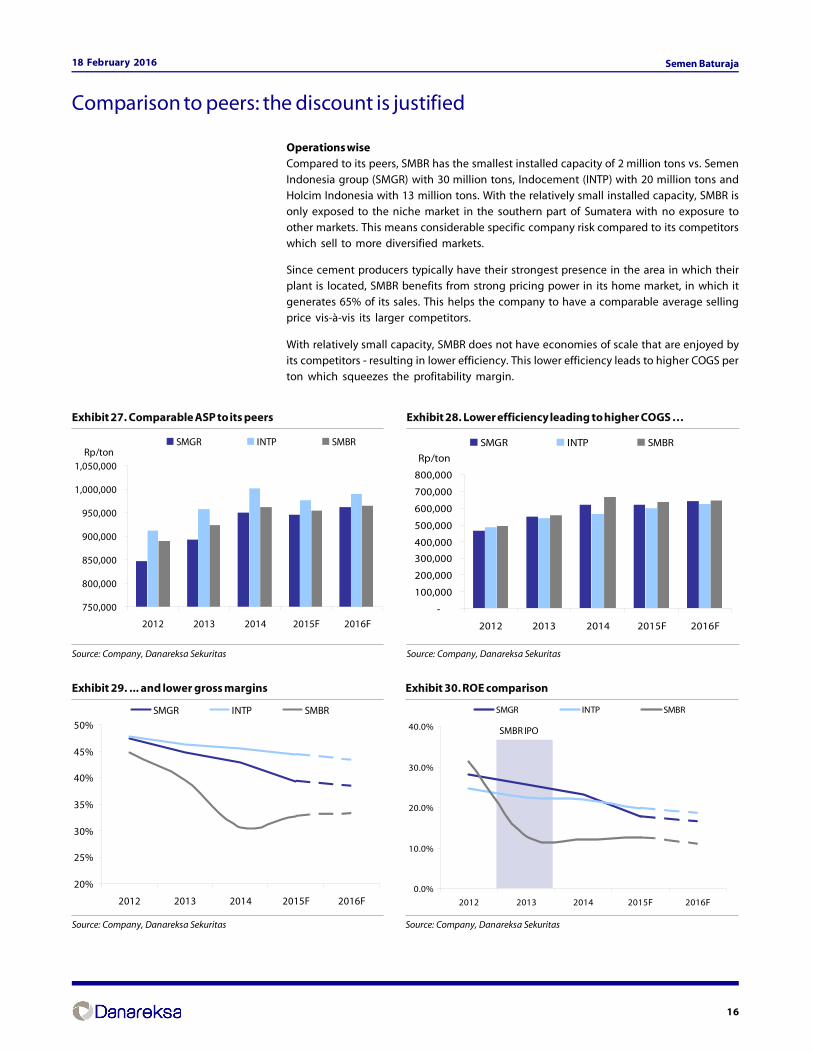
Operations wiseCompared to its peers, SMBR has the smallest installed capacity of 2 million tons vs. SemenIndonesia group (SMGR) with 30 million tons, Indocement (INTP) with 20 million tons andHolcim Indonesia with 13 million tons. With the relatively small installed capacity, SMBR isonly exposed to the niche market in the southern part of Sumatera with no exposure toother markets. This means considerable specific company risk compared to its competitorswhich sell to more diversified markets.
Since cement producers typically have their strongest presence in the area in which theirplant is located, SMBR benefits from strong pricing power in its home market, in which itgenerates 65% of its sales. This helps the company to have a comparable average sellingprice vis-à-vis its larger competitors.
With relatively small capacity, SMBR does not have economies of scale that are enjoyed byits competitors - resulting in lower efficiency. This lower efficiency leads to higher COGS perton which squeezes the profitability margin.
Comparison to peers: the discount is justified
Exhibit 27. Comparable ASP to its peers
Source: Company, Danareksa Sekuritas
Exhibit 28. Lower efficiency leading to higher COGS …
Source: Company, Danareksa Sekuritas
Exhibit 29. ... and lower gross margins
Source: Company, Danareksa Sekuritas
Exhibit 30. ROE comparison
Source: Company, Danareksa Sekuritas
750,000
800,000
850,000
900,000
950,000
1,000,000
1,050,000
2012 2013 2014 2015F 2016F
Rp/tonSMGR INTP SMBR
SMBR IPO
-
100,000
200,000
300,000
400,000
500,000
600,000
700,000
800,000
2012 2013 2014 2015F 2016F
Rp/ton
SMGR INTP SMBR
0.0%
10.0%
20.0%
30.0%
40.0%
2012 2013 2014 2015F 2016F
SMGR INTP SMBR
20%
25%
30%
35%
40%
45%
50%
2012 2013 2014 2015F 2016F
SMGR INTP SMBR
17
18 February 2016 Semen Baturaja
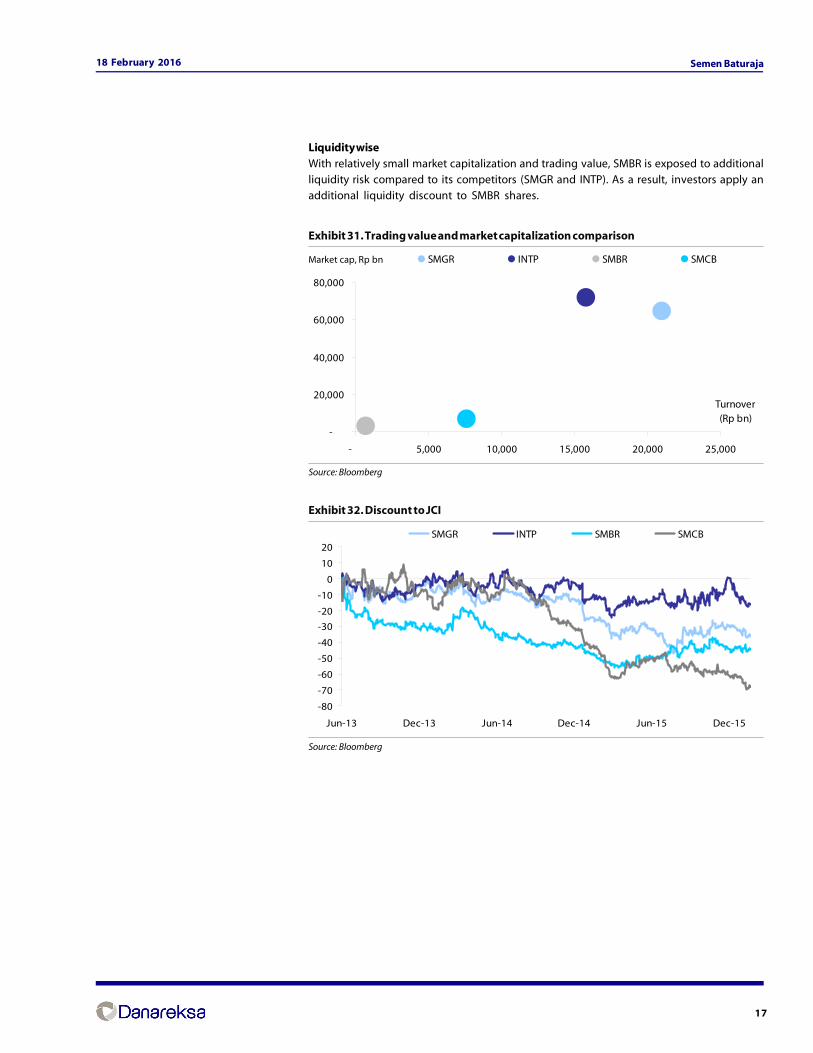
Liquidity wiseWith relatively small market capitalization and trading value, SMBR is exposed to additionalliquidity risk compared to its competitors (SMGR and INTP). As a result, investors apply anadditional liquidity discount to SMBR shares.
Exhibit 31. Trading value and market capitalization comparison
Source: Bloomberg
Exhibit 32. Discount to JCI
Source: Bloomberg
-
20,000
40,000
60,000
80,000
- 5,000 10,000 15,000 20,000 25,000
Turnover(Rp bn)
Market cap , Rpbn SMGR INTP SMBR SMCB
-80
-70
-60
-50
-40
-30
-20
-10
0
10
20
Jun-13 Dec-13 Jun-14 Dec-14 Jun-15 Dec-15
SMGR INTP SMBR SMCB
Market cap, Rp bn
18
18 February 2016 Semen Baturaja
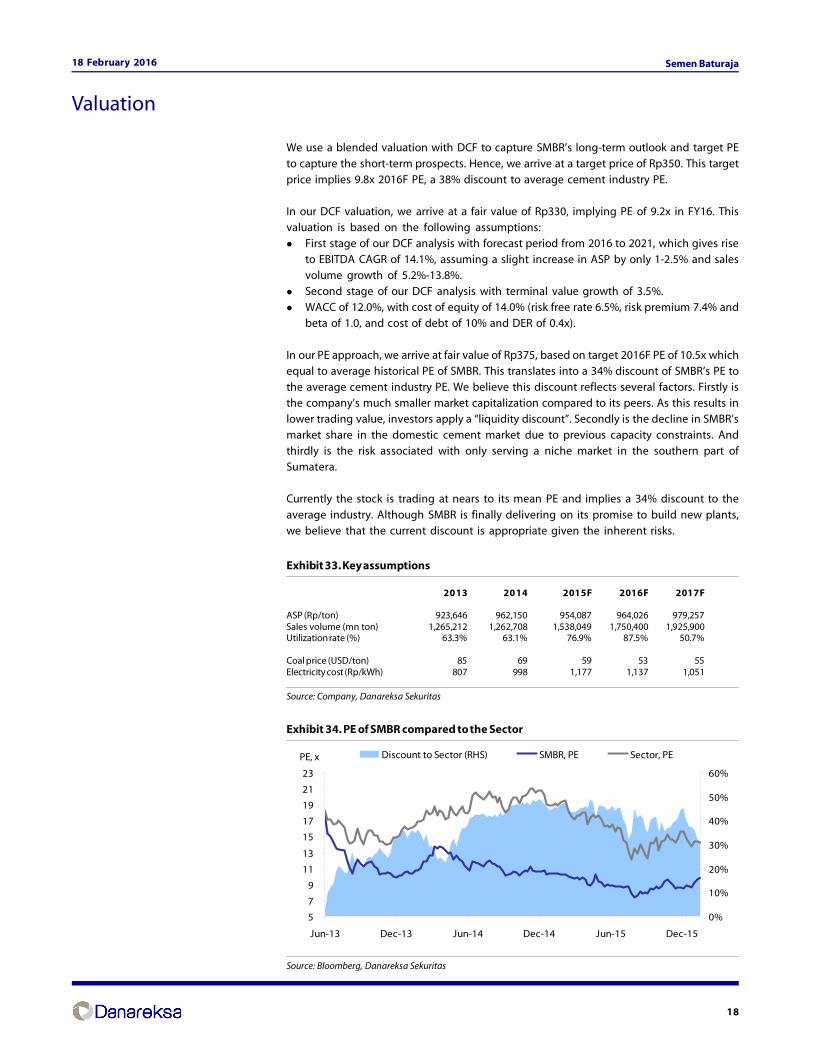
We use a blended valuation with DCF to capture SMBR’s long-term outlook and target PE
to capture the short-term prospects. Hence, we arrive at a target price of Rp350. This targetprice implies 9.8x 2016F PE, a 38% discount to average cement industry PE.
In our DCF valuation, we arrive at a fair value of Rp330, implying PE of 9.2x in FY16. Thisvaluation is based on the following assumptions:
First stage of our DCF analysis with forecast period from 2016 to 2021, which gives riseto EBITDA CAGR of 14.1%, assuming a slight increase in ASP by only 1-2.5% and salesvolume growth of 5.2%-13.8%.Second stage of our DCF analysis with terminal value growth of 3.5%.WACC of 12.0%, with cost of equity of 14.0% (risk free rate 6.5%, risk premium 7.4% andbeta of 1.0, and cost of debt of 10% and DER of 0.4x).
In our PE approach, we arrive at fair value of Rp375, based on target 2016F PE of 10.5x whichequal to average historical PE of SMBR. This translates into a 34% discount of SMBR’s PE tothe average cement industry PE. We believe this discount reflects several factors. Firstly isthe company’s much smaller market capitalization compared to its peers. As this results inlower trading value, investors apply a “liquidity discount”. Secondly is the decline in SMBR’smarket share in the domestic cement market due to previous capacity constraints. Andthirdly is the risk associated with only serving a niche market in the southern part ofSumatera.
Currently the stock is trading at nears to its mean PE and implies a 34% discount to the
average industry. Although SMBR is finally delivering on its promise to build new plants,we believe that the current discount is appropriate given the inherent risks.
Exhibit 33. Key assumptions
2013 2014 2015F 2016F 2017F
ASP (Rp/ton) 923,646 962,150 954,087 964,026 979,257Sales volume (mn ton) 1,265,212 1,262,708 1,538,049 1,750,400 1,925,900Utilization rate (%) 63.3% 63.1% 76.9% 87.5% 50.7%
Coal price (USD/ton) 85 69 59 53 55Electricity cost (Rp/kWh) 807 998 1,177 1,137 1,051
Source: Company, Danareksa Sekuritas
Exhibit 34. PE of SMBR compared to the Sector
Source: Bloomberg, Danareksa Sekuritas
Valuation
5
7
9
11
13
15
17
19
21
23
Jun-13 Dec-13 Jun-14 Dec-14 Jun-15 Dec-15
PE, x
0%
10%
20%
30%
40%
50%
60%
Discount to Sector (RHS) SMBR, PE Sector, PE
19
18 February 2016 Semen Baturaja
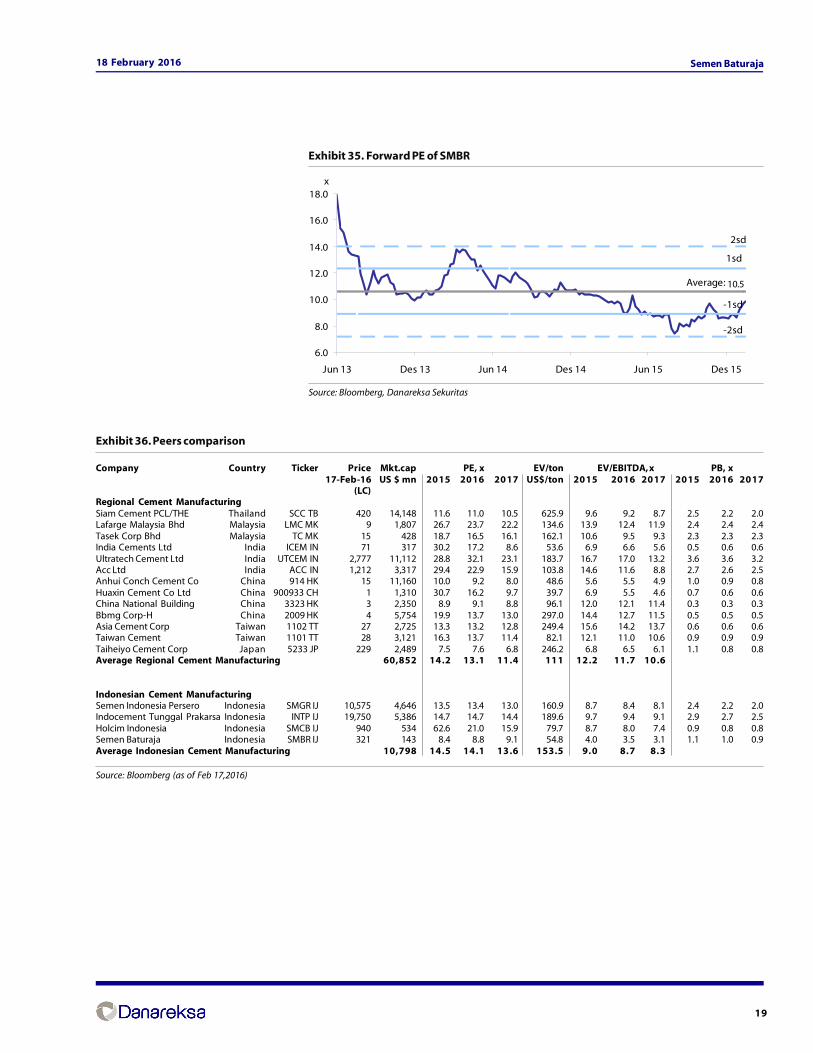
Exhibit 35. Forward PE of SMBR
Source: Bloomberg, Danareksa Sekuritas
-1sd
Average: 10.6
1sd
2sd
-2sd
6.0
8.0
10.0
12.0
14.0
16.0
18.0
Jun 13 Des 13 Jun 14 Des 14 Jun 15 Des 15
x
10.5
Exhibit 36. Peers comparison
Company Country Ticker Price Mkt.cap PE, x EV/ton EV/EBITDA, x PB, x17-Feb-16 US $ mn 2015 2016 2017 US$/ton 2015 2016 2017 2015 2016 2017
(LC)Regional Cement ManufacturingSiam Cement PCL/THE Thailand SCC TB 420 14,148 11.6 11.0 10.5 625.9 9.6 9.2 8.7 2.5 2.2 2.0Lafarge Malaysia Bhd Malaysia LMC MK 9 1,807 26.7 23.7 22.2 134.6 13.9 12.4 11.9 2.4 2.4 2.4Tasek Corp Bhd Malaysia TC MK 15 428 18.7 16.5 16.1 162.1 10.6 9.5 9.3 2.3 2.3 2.3India Cements Ltd India ICEM IN 71 317 30.2 17.2 8.6 53.6 6.9 6.6 5.6 0.5 0.6 0.6Ultratech Cement Ltd India UTCEM IN 2,777 11,112 28.8 32.1 23.1 183.7 16.7 17.0 13.2 3.6 3.6 3.2Acc Ltd India ACC IN 1,212 3,317 29.4 22.9 15.9 103.8 14.6 11.6 8.8 2.7 2.6 2.5Anhui Conch Cement Co China 914 HK 15 11,160 10.0 9.2 8.0 48.6 5.6 5.5 4.9 1.0 0.9 0.8Huaxin Cement Co Ltd China 900933 CH 1 1,310 30.7 16.2 9.7 39.7 6.9 5.5 4.6 0.7 0.6 0.6China National Building China 3323 HK 3 2,350 8.9 9.1 8.8 96.1 12.0 12.1 11.4 0.3 0.3 0.3Bbmg Corp-H China 2009 HK 4 5,754 19.9 13.7 13.0 297.0 14.4 12.7 11.5 0.5 0.5 0.5Asia Cement Corp Taiwan 1102 TT 27 2,725 13.3 13.2 12.8 249.4 15.6 14.2 13.7 0.6 0.6 0.6Taiwan Cement Taiwan 1101 TT 28 3,121 16.3 13.7 11.4 82.1 12.1 11.0 10.6 0.9 0.9 0.9Taiheiyo Cement Corp Japan 5233 JP 229 2,489 7.5 7.6 6.8 246.2 6.8 6.5 6.1 1.1 0.8 0.8Average Regional Cement Manufacturing 60,852 14.2 13.1 11.4 111 12.2 11.7 10.6
Indonesian Cement ManufacturingSemen Indonesia Persero Indonesia SMGR IJ 10,575 4,646 13.5 13.4 13.0 160.9 8.7 8.4 8.1 2.4 2.2 2.0Indocement Tunggal Prakarsa Indonesia INTP IJ 19,750 5,386 14.7 14.7 14.4 189.6 9.7 9.4 9.1 2.9 2.7 2.5Holcim Indonesia Indonesia SMCB IJ 940 534 62.6 21.0 15.9 79.7 8.7 8.0 7.4 0.9 0.8 0.8Semen Baturaja Indonesia SMBR IJ 321 143 8.4 8.8 9.1 54.8 4.0 3.5 3.1 1.1 1.0 0.9Average Indonesian Cement Manufacturing 10,798 14.5 14.1 13.6 153.5 9.0 8.7 8.3
Source: Bloomberg (as of Feb 17,2016)
20
18 February 2016 Semen Baturaja
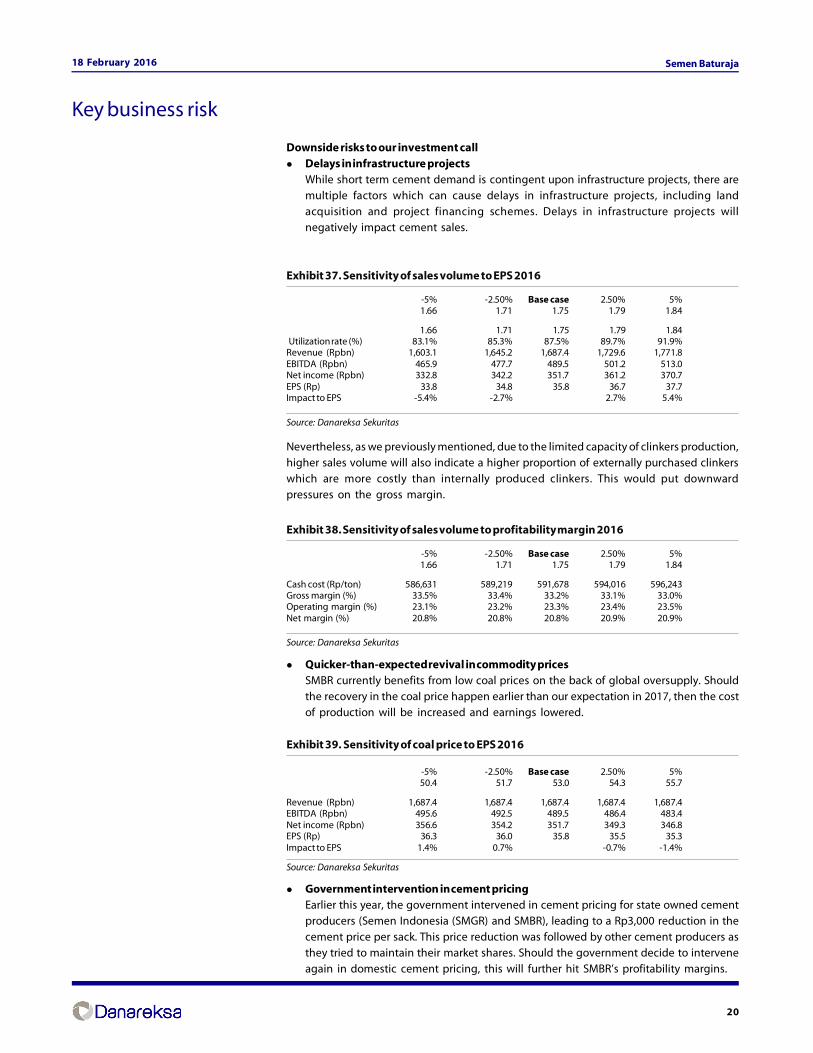
Downside risks to our investment callDelays in infrastructure projectsWhile short term cement demand is contingent upon infrastructure projects, there aremultiple factors which can cause delays in infrastructure projects, including landacquisition and project financing schemes. Delays in infrastructure projects willnegatively impact cement sales.
Exhibit 37. Sensitivity of sales volume to EPS 2016
-5% -2.50% Base case 2.50% 5% 1.66 1.71 1.75 1.79 1.84
1.66 1.71 1.75 1.79 1.84 Utilization rate (%) 83.1% 85.3% 87.5% 89.7% 91.9%Revenue (Rpbn) 1,603.1 1,645.2 1,687.4 1,729.6 1,771.8EBITDA (Rpbn) 465.9 477.7 489.5 501.2 513.0Net income (Rpbn) 332.8 342.2 351.7 361.2 370.7EPS (Rp) 33.8 34.8 35.8 36.7 37.7Impact to EPS -5.4% -2.7% 2.7% 5.4%
Source: Danareksa Sekuritas
Nevertheless, as we previously mentioned, due to the limited capacity of clinkers production,higher sales volume will also indicate a higher proportion of externally purchased clinkerswhich are more costly than internally produced clinkers. This would put downwardpressures on the gross margin.
Exhibit 38. Sensitivity of sales volume to profitability margin 2016
-5% -2.50% Base case 2.50% 5% 1.66 1.71 1.75 1.79 1.84
Cash cost (Rp/ton) 586,631 589,219 591,678 594,016 596,243Gross margin (%) 33.5% 33.4% 33.2% 33.1% 33.0%Operating margin (%) 23.1% 23.2% 23.3% 23.4% 23.5%Net margin (%) 20.8% 20.8% 20.8% 20.9% 20.9%
Source: Danareksa Sekuritas
Quicker-than-expected revival in commodity pricesSMBR currently benefits from low coal prices on the back of global oversupply. Shouldthe recovery in the coal price happen earlier than our expectation in 2017, then the costof production will be increased and earnings lowered.
Exhibit 39. Sensitivity of coal price to EPS 2016
-5% -2.50% Base case 2.50% 5% 50.4 51.7 53.0 54.3 55.7
Revenue (Rpbn) 1,687.4 1,687.4 1,687.4 1,687.4 1,687.4EBITDA (Rpbn) 495.6 492.5 489.5 486.4 483.4Net income (Rpbn) 356.6 354.2 351.7 349.3 346.8EPS (Rp) 36.3 36.0 35.8 35.5 35.3Impact to EPS 1.4% 0.7% -0.7% -1.4%
Source: Danareksa Sekuritas
Government intervention in cement pricingEarlier this year, the government intervened in cement pricing for state owned cementproducers (Semen Indonesia (SMGR) and SMBR), leading to a Rp3,000 reduction in thecement price per sack. This price reduction was followed by other cement producers asthey tried to maintain their market shares. Should the government decide to interveneagain in domestic cement pricing, this will further hit SMBR’s profitability margins.
Key business risk
21
18 February 2016 Semen Baturaja
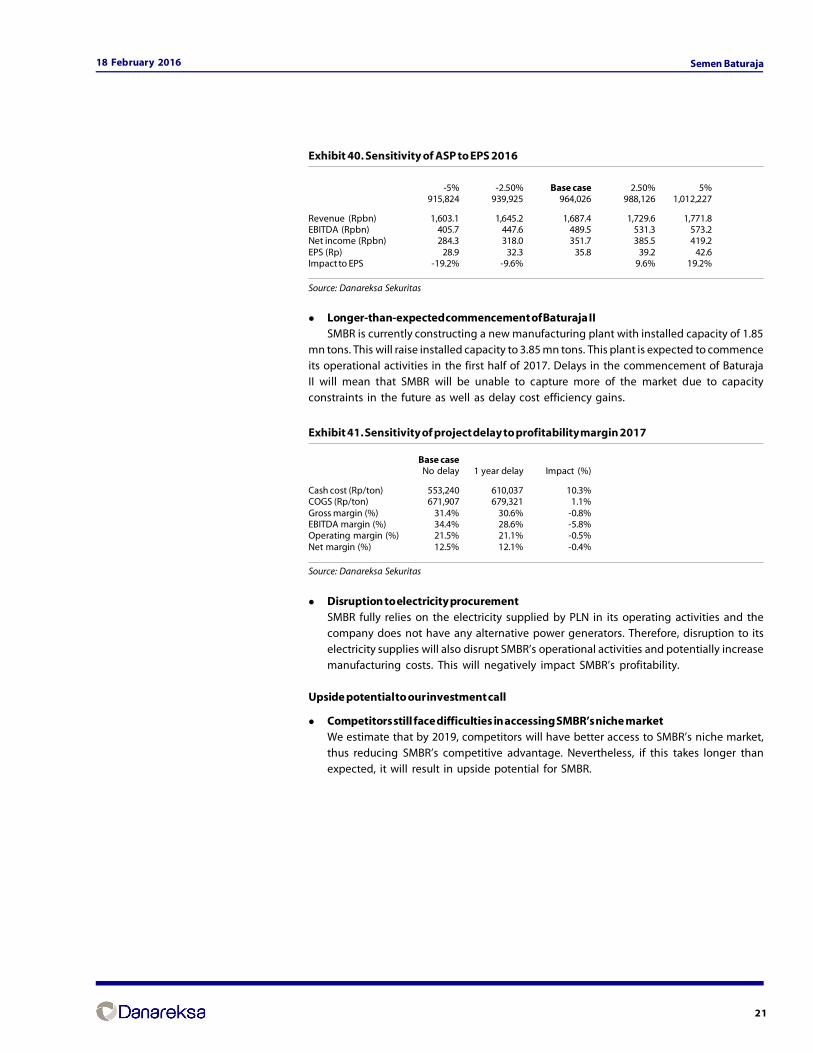
Exhibit 40. Sensitivity of ASP to EPS 2016
-5% -2.50% Base case 2.50% 5%
915,824 939,925 964,026 988,126 1,012,227
Revenue (Rpbn) 1,603.1 1,645.2 1,687.4 1,729.6 1,771.8EBITDA (Rpbn) 405.7 447.6 489.5 531.3 573.2Net income (Rpbn) 284.3 318.0 351.7 385.5 419.2EPS (Rp) 28.9 32.3 35.8 39.2 42.6Impact to EPS -19.2% -9.6% 9.6% 19.2%
Source: Danareksa Sekuritas
Longer-than-expected commencement of Baturaja IISMBR is currently constructing a new manufacturing plant with installed capacity of 1.85
mn tons. This will raise installed capacity to 3.85 mn tons. This plant is expected to commenceits operational activities in the first half of 2017. Delays in the commencement of BaturajaII will mean that SMBR will be unable to capture more of the market due to capacityconstraints in the future as well as delay cost efficiency gains.
Exhibit 41. Sensitivity of project delay to profitability margin 2017
Base case No delay 1 year delay Impact (%)
Cash cost (Rp/ton) 553,240 610,037 10.3%COGS (Rp/ton) 671,907 679,321 1.1%Gross margin (%) 31.4% 30.6% -0.8%EBITDA margin (%) 34.4% 28.6% -5.8%Operating margin (%) 21.5% 21.1% -0.5%Net margin (%) 12.5% 12.1% -0.4%
Source: Danareksa Sekuritas
Disruption to electricity procurementSMBR fully relies on the electricity supplied by PLN in its operating activities and thecompany does not have any alternative power generators. Therefore, disruption to itselectricity supplies will also disrupt SMBR’s operational activities and potentially increasemanufacturing costs. This will negatively impact SMBR’s profitability.
Upside potential to our investment call
Competitors still face difficulties in accessing SMBR’s niche marketWe estimate that by 2019, competitors will have better access to SMBR’s niche market,thus reducing SMBR’s competitive advantage. Nevertheless, if this takes longer thanexpected, it will result in upside potential for SMBR.
22
18 February 2016 Semen Baturaja
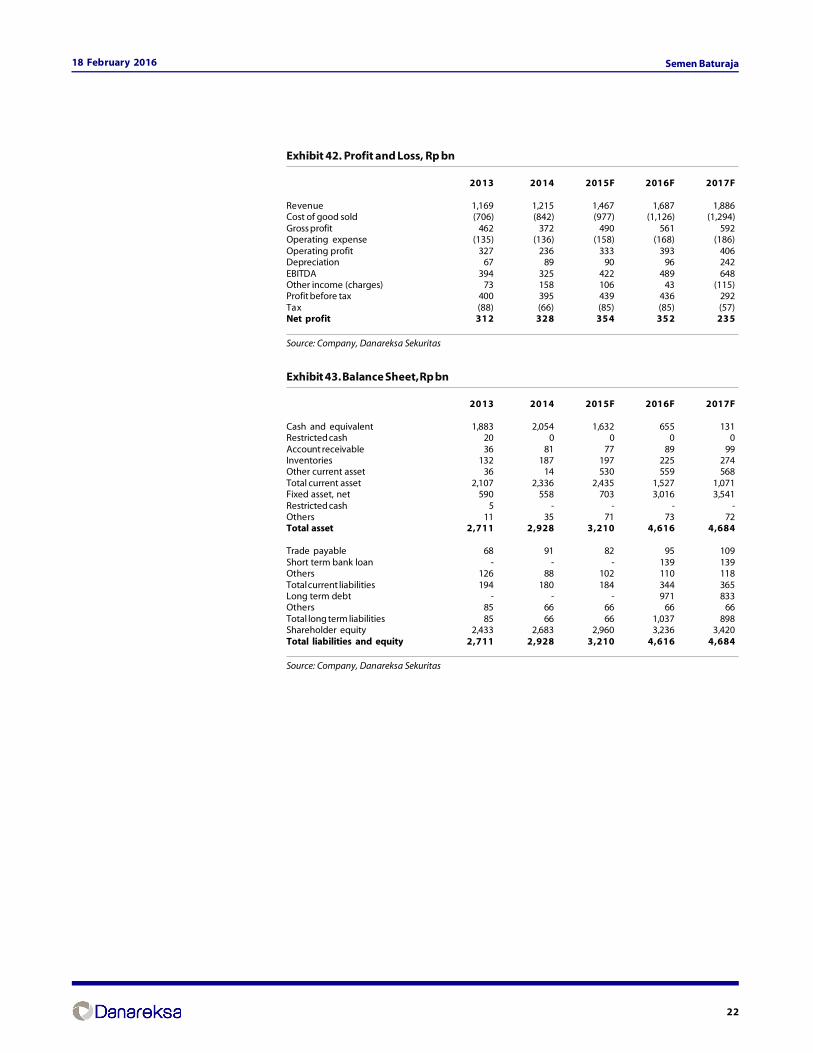
Exhibit 42. Profit and Loss, Rp bn
2013 2014 2015F 2016F 2017F
Revenue 1,169 1,215 1,467 1,687 1,886Cost of good sold (706) (842) (977) (1,126) (1,294)Gross profit 462 372 490 561 592Operating expense (135) (136) (158) (168) (186)Operating profit 327 236 333 393 406Depreciation 67 89 90 96 242EBITDA 394 325 422 489 648Other income (charges) 73 158 106 43 (115)Profit before tax 400 395 439 436 292Tax (88) (66) (85) (85) (57)Net profit 312 328 354 352 235
Source: Company, Danareksa Sekuritas
Exhibit 43. Balance Sheet, Rp bn
2013 2014 2015F 2016F 2017F
Cash and equivalent 1,883 2,054 1,632 655 131Restricted cash 20 0 0 0 0Account receivable 36 81 77 89 99Inventories 132 187 197 225 274Other current asset 36 14 530 559 568Total current asset 2,107 2,336 2,435 1,527 1,071Fixed asset, net 590 558 703 3,016 3,541Restricted cash 5 - - - -Others 11 35 71 73 72Total asset 2,711 2,928 3,210 4,616 4,684
Trade payable 68 91 82 95 109Short term bank loan - - - 139 139Others 126 88 102 110 118Total current liabilities 194 180 184 344 365Long term debt - - - 971 833Others 85 66 66 66 66Total long term liabilities 85 66 66 1,037 898Shareholder equity 2,433 2,683 2,960 3,236 3,420Total liabilities and equity 2,711 2,928 3,210 4,616 4,684
Source: Company, Danareksa Sekuritas
23
18 February 2016 Semen Baturaja
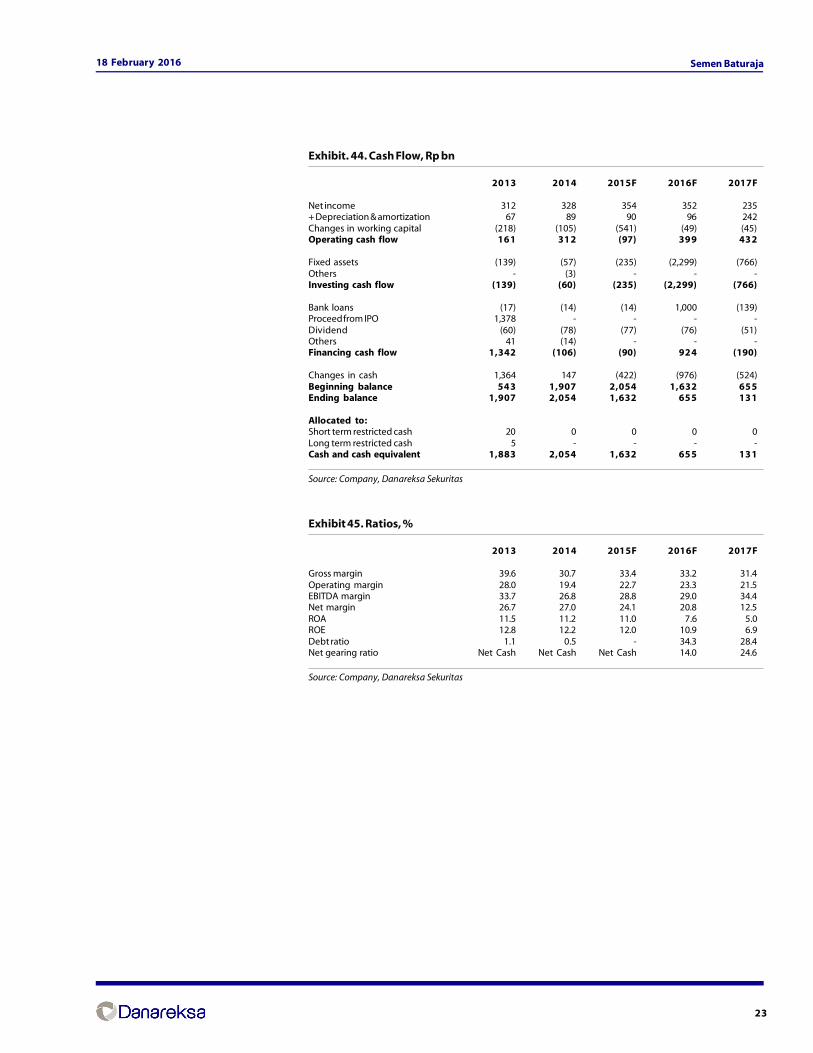
Exhibit. 44. Cash Flow, Rp bn
2013 2014 2015F 2016F 2017F
Net income 312 328 354 352 235+ Depreciation & amortization 67 89 90 96 242Changes in working capital (218) (105) (541) (49) (45)Operating cash flow 161 312 (97) 399 432
Fixed assets (139) (57) (235) (2,299) (766)Others - (3) - - -Investing cash flow (139) (60) (235) (2,299) (766)
Bank loans (17) (14) (14) 1,000 (139)Proceed from IPO 1,378 - - - -Dividend (60) (78) (77) (76) (51)Others 41 (14) - - -Financing cash flow 1,342 (106) (90) 924 (190)
Changes in cash 1,364 147 (422) (976) (524)Beginning balance 543 1,907 2,054 1,632 655Ending balance 1,907 2,054 1,632 655 131
Allocated to:Short term restricted cash 20 0 0 0 0Long term restricted cash 5 - - - -Cash and cash equivalent 1,883 2,054 1,632 655 131
Source: Company, Danareksa Sekuritas
Exhibit 45. Ratios, %
2013 2014 2015F 2016F 2017F
Gross margin 39.6 30.7 33.4 33.2 31.4Operating margin 28.0 19.4 22.7 23.3 21.5EBITDA margin 33.7 26.8 28.8 29.0 34.4Net margin 26.7 27.0 24.1 20.8 12.5ROA 11.5 11.2 11.0 7.6 5.0ROE 12.8 12.2 12.0 10.9 6.9Debt ratio 1.1 0.5 - 34.3 28.4Net gearing ratio Net Cash Net Cash Net Cash 14.0 24.6
Source: Company, Danareksa Sekuritas
24
18 February 2016 Semen Baturaja
DISCLAIMERThe information contained in this report has been taken from sources which we deem reliable. However, none of P.T. Danareksa Sekuritas and/or its affiliated companies and/ortheir respective employees and/or agents makes any representation or warranty (express or implied) or accepts any responsibility or liability as to, or in relation to, the accuracy orcompleteness of the information and opinions contained in this report or as to any information contained in this report or any other such information or opinions remainingunchanged after the issue thereof.We expressly disclaim any responsibility or liability (express or implied) of P.T. Danareksa Sekuritas, its affiliated companies and their respective employees and agents whatsoeverand howsoever arising (including, without limitation for any claims, proceedings, action , suits, losses, expenses, damages or costs) which may be brought against or suffered byany person as a results of acting in reliance upon the whole or any part of the contents of this report and neither P.T. Danareksa Sekuritas, its affiliated companies or their respectiveemployees or agents accepts liability for any errors, omissions or mis-statements, negligent or otherwise, in the report and any liability in respect of the report or any inaccuracytherein or omission therefrom which might otherwise arise is hereby expresses disclaimed.The information contained in this report is not be taken as any recommendation made by P.T. Danareksa Sekuritas or any other person to enter into any agreement with regard toany investment mentioned in this document. This report is prepared for general circulation. It does not have regards to the specific person who may receive this report. Inconsidering any investments you should make your own independent assessment and seek your own professional financial and legal advice.