Embed Size (px)
Citation preview
1
January 2016
By Barry Lipton, Dan Corro, and John Robertson
Time From Injury to Treatment in Workers Compensation: Setting a Baseline to Monitor the Affordable Care Act
There continues to be uncertainty regarding the impact of the Affordable Care Act (ACA) on the workers compensation system. One question that is regularly asked is whether or not the ACA will overwhelm the healthcare delivery system and make it more difficult for workers compensation (WC) claimants to obtain needed medical care. If the ACA, or other changes to US healthcare delivery, makes access to care more difficult, time from injury to first medical treatment may grow from the time the major provisions of the ACA took effect on January 1, 2014. This initial report looks at the “baseline” time to treatment for WC cases before January 1, 2014. Subsequent studies will allow a review of claims after January 1, 2014, for changes in time to first medical treatment and associated drivers.
Scope
This study presents some observations on the time difference between the occurrence of an injury and the date the injured worker first receives medical services of various types. We look at both types of providers and types of services. We also look at jurisdiction, diagnosis, age, gender, seasonality, weekday, provider networks, and attorney involvement. This may provide insight into medical care as currently accessed in WC cases and, as data becomes available, may also help to identify changes in time to treatment under the ACA and other innovations in the delivery of medical care, such as telemedicine.
Delivery of Healthcare Is Changing
A notable change in the healthcare arena is the trend toward mergers and acquisitions, which could potentially reduce the number of major group health insurers to just three. At the same time, on a more local scale, hospitals have been consolidating with one another and buying physician practices to form affordable care organizations (ACOs). Because WC medical costs are about 1.5% of total US healthcare costs,
1 WC has not played—and likely never will play—any role in
directing this consolidation process, except perhaps as a potentially lucrative niche afterthought. But that does not make WC immune from the process.
ACA Impact Is Uncertain
Prospectively, the ACA’s near term impact on how WC cases access medical care remains uncertain:
As WC is regulated by state, that impact will likely vary by state
Will increasing the insured population drive up demand without a corresponding increase in the supply of doctors and other professionals?
Despite more workers with medical coverage, will higher deductibles and copayments make it more attractive to file a WC claim?
Will medical care to injured workers be subject to the ACA’s federal Independent Payment Advisory Board? And if so, how will that be reconciled with state WC treatment guidelines?
Longer term, what are the implications of (near) universal coverage, combined with uniform standards of care, for WC medical coverage? For example, will this influence the effort to nationalize the regulation of WC insurance?
1 Centers for Medicare & Medicaid Services estimates total US healthcare expenditures in 2013 at $2,919.1 billion, with $44.2 billion going to WC,
in “National Health Expenditures by Type of Service and Source of Funds, CY 1960-2013,” downloaded on 11-11-2015 from
www.cms.gov/Research-Statistics-Data-and-Systems/Statistics-Trends-and-Reports/NationalHealthExpendData/Downloads/NHE2013.zip.
2
Purpose
Determining the distribution of waiting times to receive various types of medical services, or to be treated by various types of medical professionals, may help policymakers better understand how changes in the healthcare system impact WC claimants’ access to care. Moreover, that information may prove helpful as a baseline to distinguish changes due to the ACA from changes due to preexisting trends. And even if the ACA impact cannot be isolated from other changes, a baseline is useful to monitor WC access to care in a changing healthcare environment.
KEY FINDINGS
Some key findings are:
There are significant differences by state in the time to receive initial treatment
A high share of WC cases receive treatment on the date of injury
Claimant demographics impact how medical care is accessed
Time to treatment patterns differ by the type of service, type of provider, and the nature of the injury
For the three states reviewed in this study (Alabama, Illinois, and Oklahoma), there is little evidence of a difference between urban versus rural providers
These findings highlight the sorts of differences observed in the time to treatment. Given all the influences that interact and affect the time to treatment, it will be difficult—if even possible—to isolate the impact of the ACA.
DATA AND METHODOLOGY
The study uses NCCI’s Medical Data Call (MDC). The MDC captures transaction-level detail on medical bills processed on or after July 1, 2010, including dates of service, charges, payments, procedure codes, and diagnoses codes. NCCI has the Call for the 35 jurisdictions where NCCI provides ratemaking services and for a number of additional states.
2
We look at injuries occurring between July 1, 2010, and December 31, 2012, that had at least one medical treatment within 360 days of the date of injury. Both medical-only and lost-time claims are included.
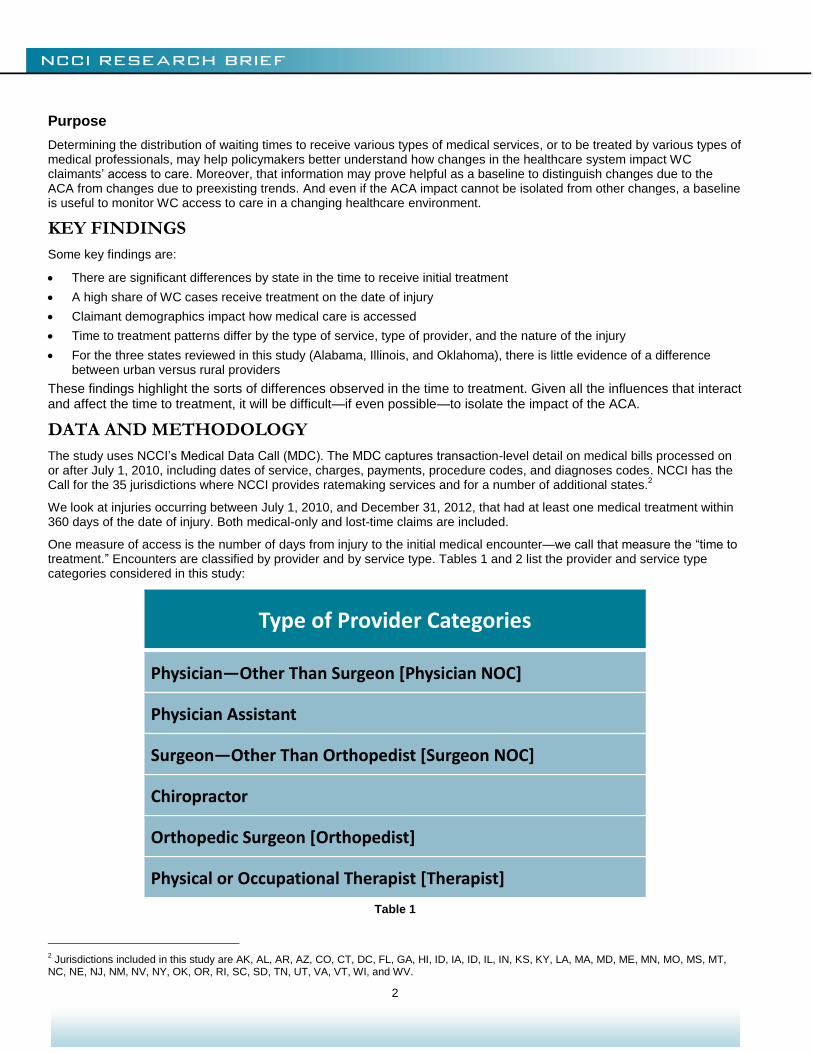
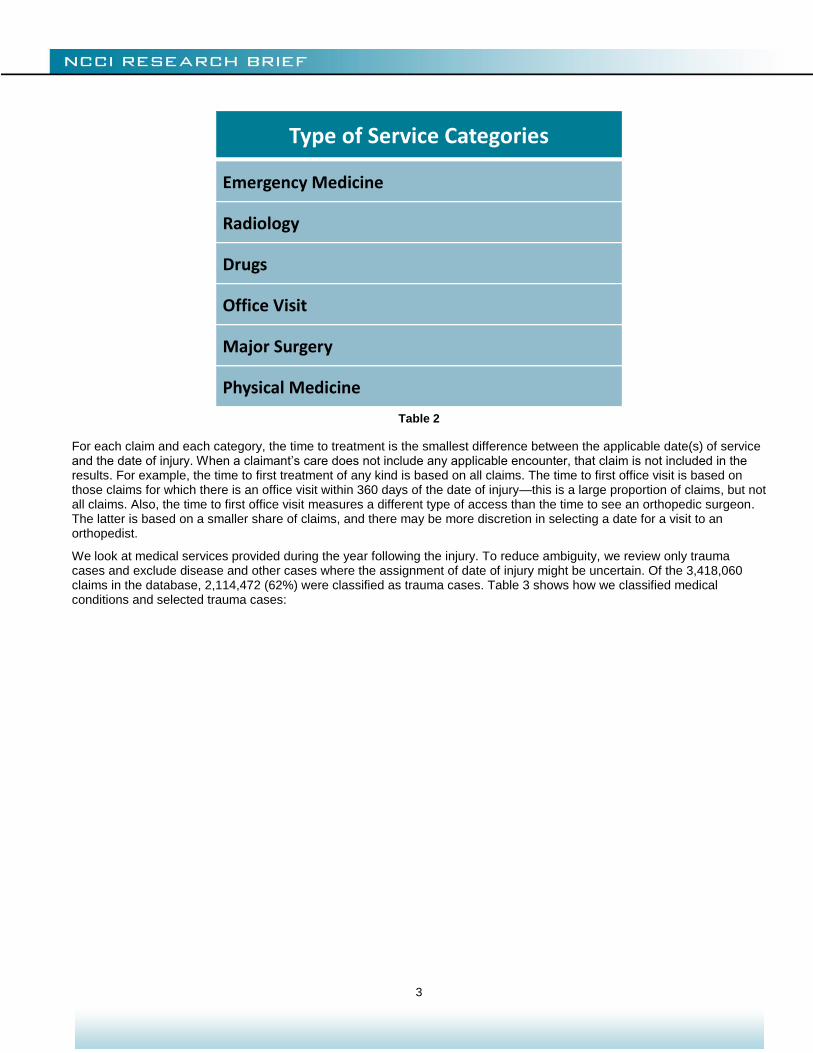
One measure of access is the number of days from injury to the initial medical encounter—we call that measure the “time to treatment.” Encounters are classified by provider and by service type. Tables 1 and 2 list the provider and service type categories considered in this study:
Type of Provider Categories
Physician—Other Than Surgeon [Physician NOC]
Physician Assistant
Surgeon—Other Than Orthopedist [Surgeon NOC]
Chiropractor
Orthopedic Surgeon [Orthopedist]
Physical or Occupational Therapist [Therapist]
Table 1
2 Jurisdictions included in this study are AK, AL, AR, AZ, CO, CT, DC, FL, GA, HI, ID, IA, ID, IL, IN, KS, KY, LA, MA, MD, ME, MN, MO, MS, MT,
NC, NE, NJ, NM, NV, NY, OK, OR, RI, SC, SD, TN, UT, VA, VT, WI, and WV.
3
Type of Service Categories
Emergency Medicine
Radiology
Drugs
Office Visit
Major Surgery
Physical Medicine
Table 2
For each claim and each category, the time to treatment is the smallest difference between the applicable date(s) of service and the date of injury. When a claimant’s care does not include any applicable encounter, that claim is not included in the results. For example, the time to first treatment of any kind is based on all claims. The time to first office visit is based on those claims for which there is an office visit within 360 days of the date of injury—this is a large proportion of claims, but not all claims. Also, the time to first office visit measures a different type of access than the time to see an orthopedic surgeon. The latter is based on a smaller share of claims, and there may be more discretion in selecting a date for a visit to an orthopedist.
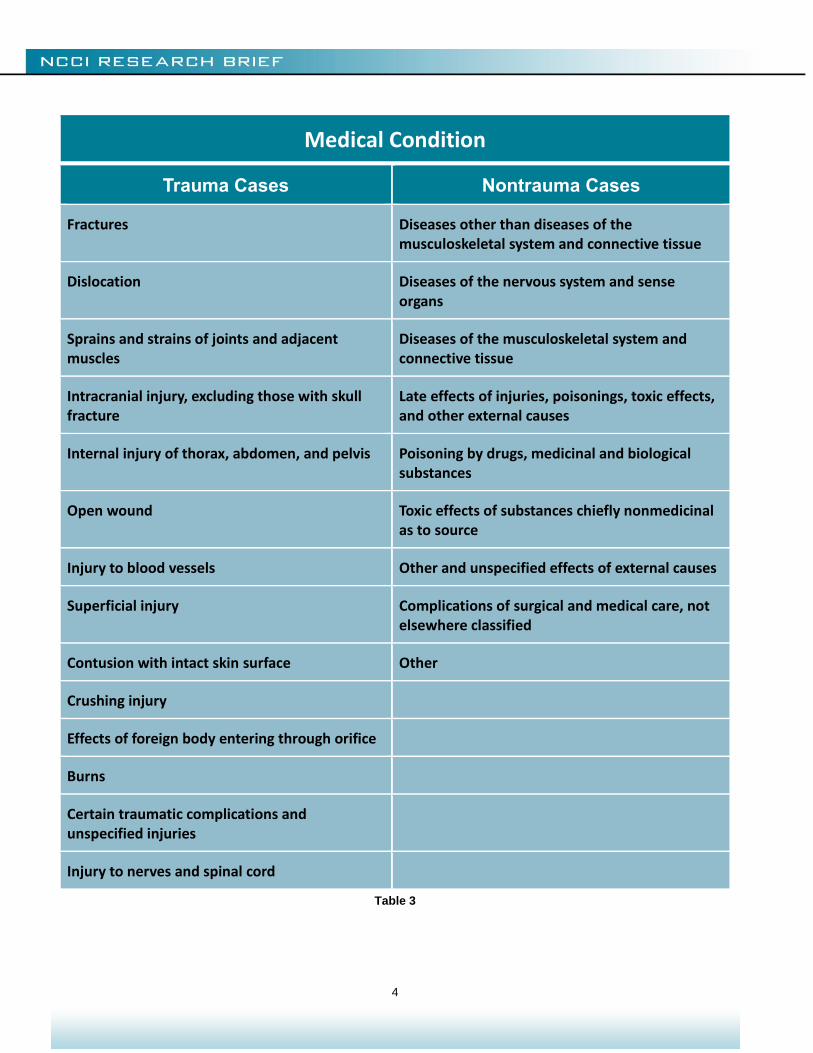
We look at medical services provided during the year following the injury. To reduce ambiguity, we review only trauma cases and exclude disease and other cases where the assignment of date of injury might be uncertain. Of the 3,418,060 claims in the database, 2,114,472 (62%) were classified as trauma cases. Table 3 shows how we classified medical conditions and selected trauma cases:
4
Medical Condition
Trauma Cases Nontrauma Cases
Fractures Diseases other than diseases of the musculoskeletal system and connective tissue
Dislocation Diseases of the nervous system and sense organs
Sprains and strains of joints and adjacent muscles
Diseases of the musculoskeletal system and connective tissue
Intracranial injury, excluding those with skull fracture
Late effects of injuries, poisonings, toxic effects, and other external causes
Internal injury of thorax, abdomen, and pelvis Poisoning by drugs, medicinal and biological substances
Open wound Toxic effects of substances chiefly nonmedicinal as to source
Injury to blood vessels Other and unspecified effects of external causes
Superficial injury Complications of surgical and medical care, not elsewhere classified
Contusion with intact skin surface Other
Crushing injury
Effects of foreign body entering through orifice
Burns
Certain traumatic complications and unspecified injuries
Injury to nerves and spinal cord
Table 3

5
We cannot measure the time from when care was initially sought to when it was first provided. Of course, for many claims, care is sought immediately upon the injury occurring. But for some injuries, the claimant might not decide that medical care is warranted until some time after the injury occurred. For example, for some kinds of back pain, the claimant might wait a few days to see if the pain goes away without medical treatment. As such, the time from injury to first treatment might be greater than the time from a decision to seek medical care and first treatment.
This paper provides illustrations, together with some commentary, on the baseline experience, i.e., times to first service before the main provisions of the ACA took effect on January 1, 2014. Accordingly, the discussion is purely descriptive and not based on any statistical analysis. We depict the distribution of time to initial treatment by plotting the growing share of cases that have received care as days go by after the date of injury; i.e., we look at graphs of empirical cumulative distribution functions. Future research might apply statistical analyses to determine differences, if any, between pre- and post-ACA times to first service.
The following section highlights differences we observed in the time to treatment from a multistate perspective. The sections after that look more specifically at provider networks and state differences.
6
DIFFERENCES IN THE TIME TO TREAT
First Encounter
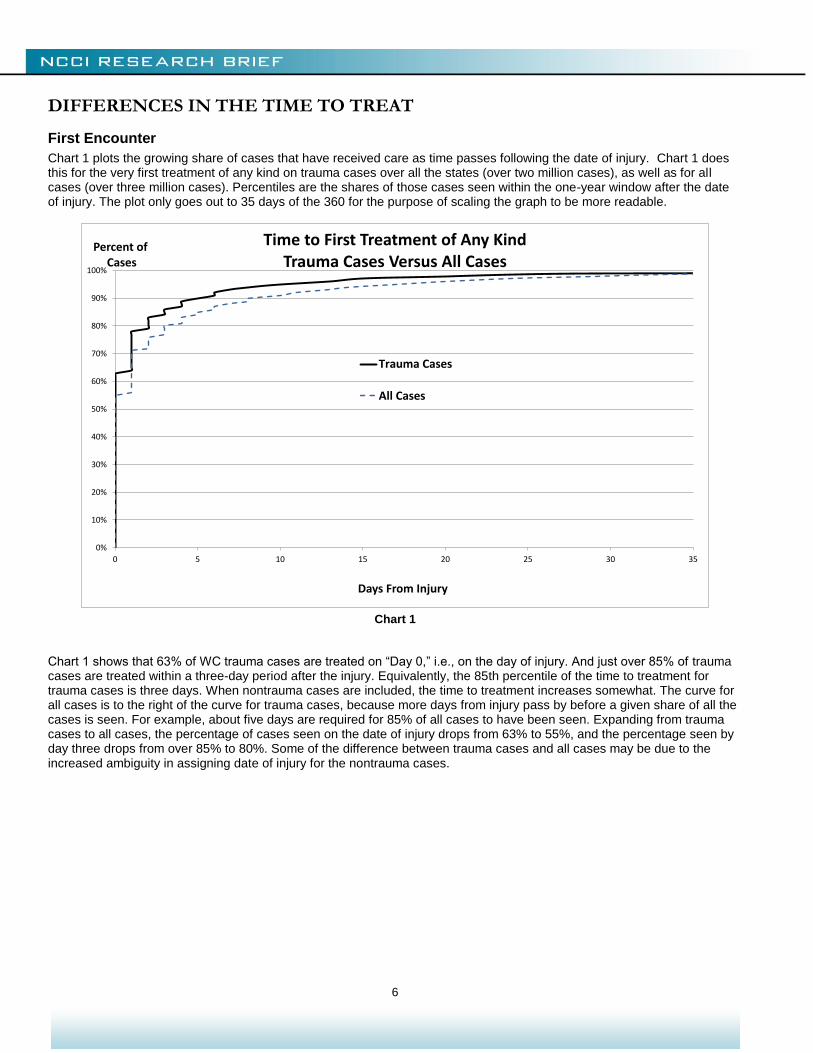
Chart 1 plots the growing share of cases that have received care as time passes following the date of injury. Chart 1 does this for the very first treatment of any kind on trauma cases over all the states (over two million cases), as well as for all cases (over three million cases). Percentiles are the shares of those cases seen within the one-year window after the date of injury. The plot only goes out to 35 days of the 360 for the purpose of scaling the graph to be more readable.
Chart 1
Chart 1 shows that 63% of WC trauma cases are treated on “Day 0,” i.e., on the day of injury. And just over 85% of trauma cases are treated within a three-day period after the injury. Equivalently, the 85th percentile of the time to treatment for trauma cases is three days. When nontrauma cases are included, the time to treatment increases somewhat. The curve for all cases is to the right of the curve for trauma cases, because more days from injury pass by before a given share of all the cases is seen. For example, about five days are required for 85% of all cases to have been seen. Expanding from trauma cases to all cases, the percentage of cases seen on the date of injury drops from 63% to 55%, and the percentage seen by day three drops from over 85% to 80%. Some of the difference between trauma cases and all cases may be due to the increased ambiguity in assigning date of injury for the nontrauma cases.
0%
10%
20%
30%
40%
50%
60%
70%
80%
90%
100%
0 5 10 15 20 25 30 35
Percent ofCases
Days From Injury
Time to First Treatment of Any KindTrauma Cases Versus All Cases
Trauma Cases
All Cases
7
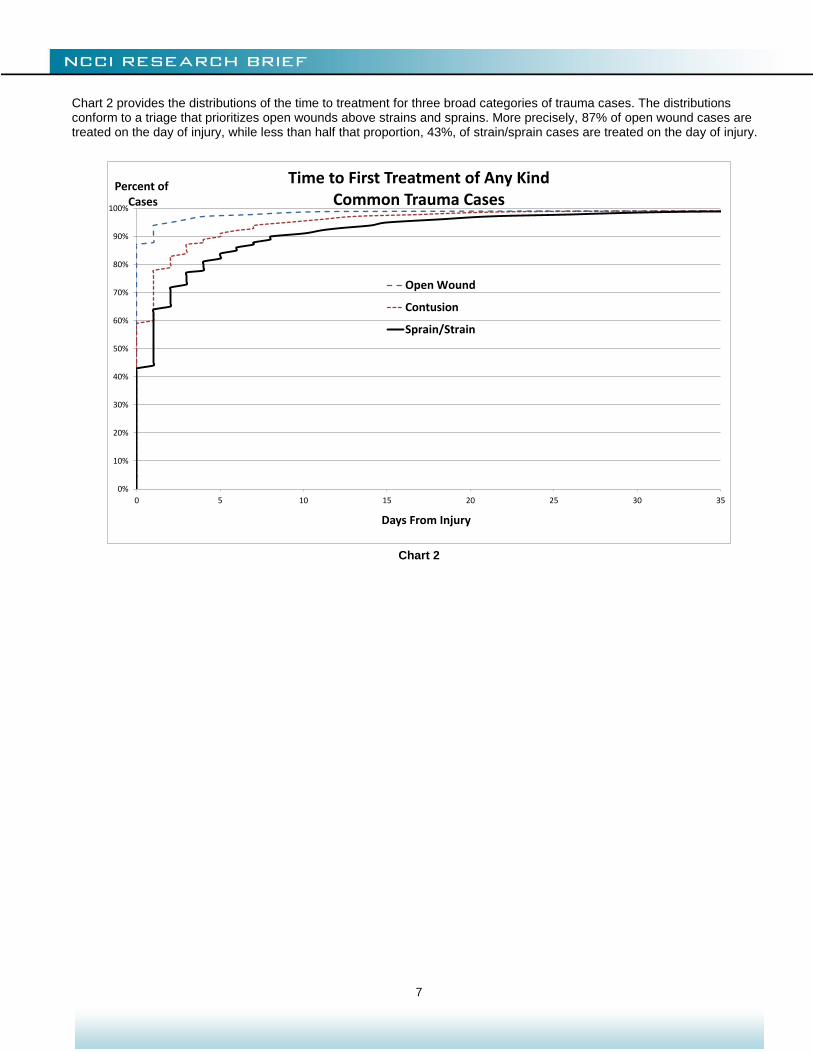
Chart 2 provides the distributions of the time to treatment for three broad categories of trauma cases. The distributions conform to a triage that prioritizes open wounds above strains and sprains. More precisely, 87% of open wound cases are treated on the day of injury, while less than half that proportion, 43%, of strain/sprain cases are treated on the day of injury.
Chart 2
0%
10%
20%
30%
40%
50%
60%
70%
80%
90%
100%
0 5 10 15 20 25 30 35
Percent ofCases
Days From Injury
Time to First Treatment of Any KindCommon Trauma Cases
Open Wound
Contusion
Sprain/Strain
8
Type of Provider
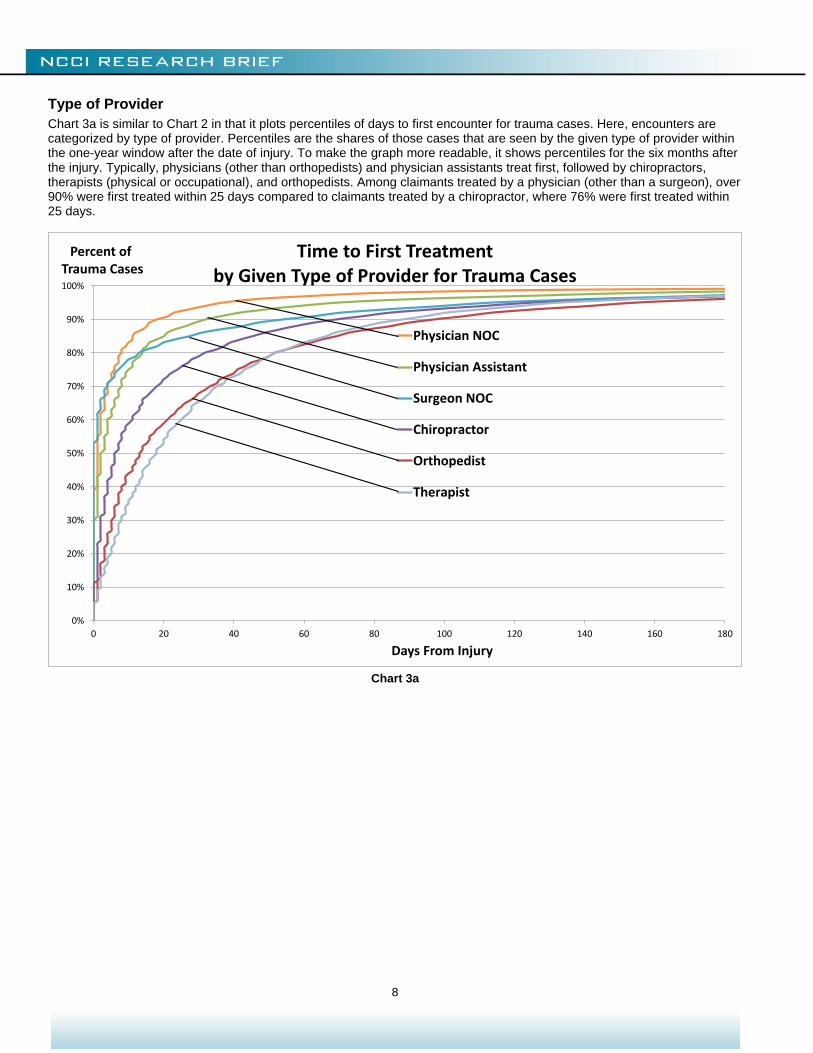
Chart 3a is similar to Chart 2 in that it plots percentiles of days to first encounter for trauma cases. Here, encounters are categorized by type of provider. Percentiles are the shares of those cases that are seen by the given type of provider within the one-year window after the date of injury. To make the graph more readable, it shows percentiles for the six months after the injury. Typically, physicians (other than orthopedists) and physician assistants treat first, followed by chiropractors, therapists (physical or occupational), and orthopedists. Among claimants treated by a physician (other than a surgeon), over 90% were first treated within 25 days compared to claimants treated by a chiropractor, where 76% were first treated within 25 days.
Chart 3a
0%
10%
20%
30%
40%
50%
60%
70%
80%
90%
100%
0 20 40 60 80 100 120 140 160 180
Percent ofTrauma Cases
Days From Injury
Time to First Treatment by Given Type of Provider for Trauma Cases
Physician NOC
Physician Assistant
Surgeon NOC
Chiropractor
Orthopedist
Therapist
9
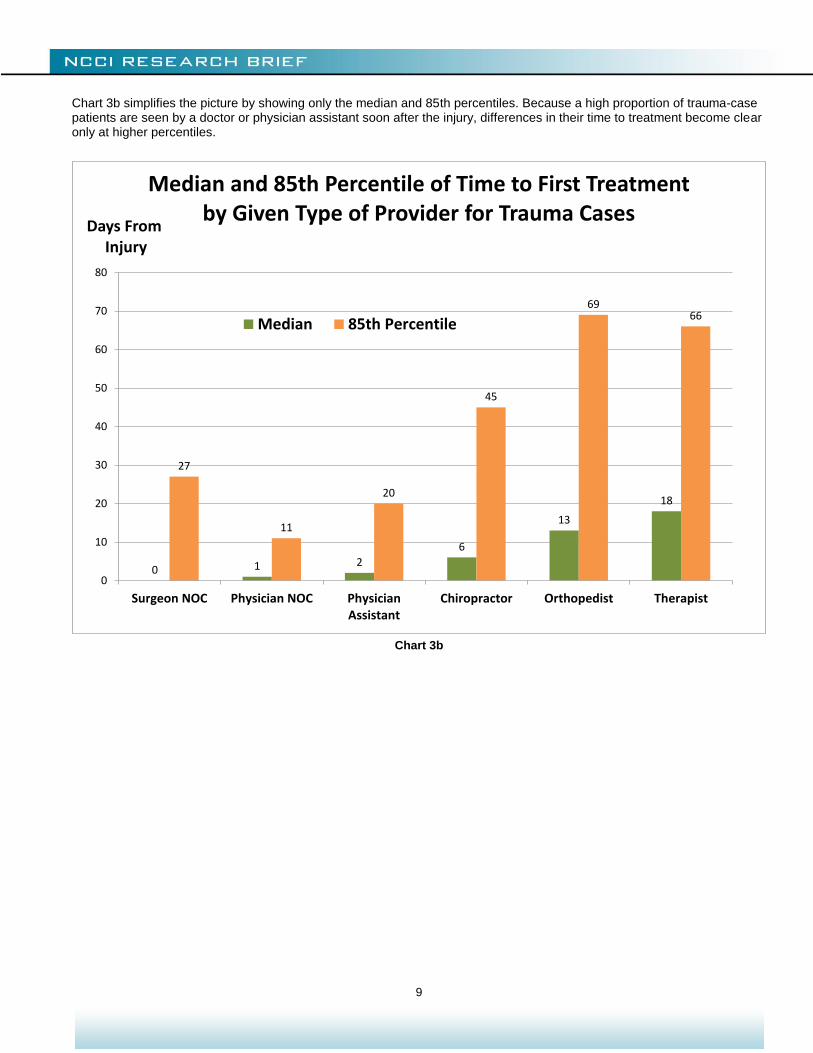
Chart 3b simplifies the picture by showing only the median and 85th percentiles. Because a high proportion of trauma-case patients are seen by a doctor or physician assistant soon after the injury, differences in their time to treatment become clear only at higher percentiles.
Chart 3b
0 1 2
6
13
18
27
11
20
45
6966
0
10
20
30
40
50
60
70
80
Surgeon NOC Physician NOC PhysicianAssistant
Chiropractor Orthopedist Therapist
Days FromInjury
Median and 85th Percentile of Time to First Treatment by Given Type of Provider for Trauma Cases
Median 85th Percentile
10
Type of Service
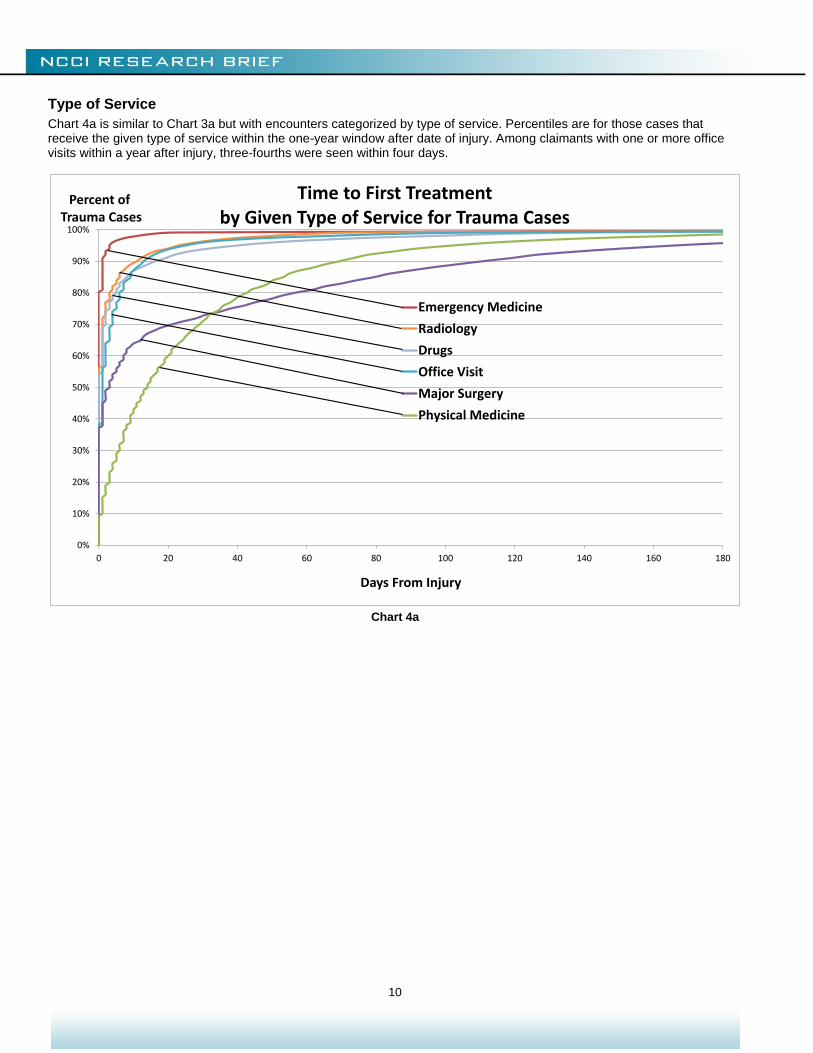
Chart 4a is similar to Chart 3a but with encounters categorized by type of service. Percentiles are for those cases that receive the given type of service within the one-year window after date of injury. Among claimants with one or more office visits within a year after injury, three-fourths were seen within four days.
Chart 4a
0%
10%
20%
30%
40%
50%
60%
70%
80%
90%
100%
0 20 40 60 80 100 120 140 160 180
Percent ofTrauma Cases
Days From Injury
Time to First Treatment by Given Type of Service for Trauma Cases
Emergency Medicine
Radiology
Drugs
Office Visit
Major Surgery
Physical Medicine
11
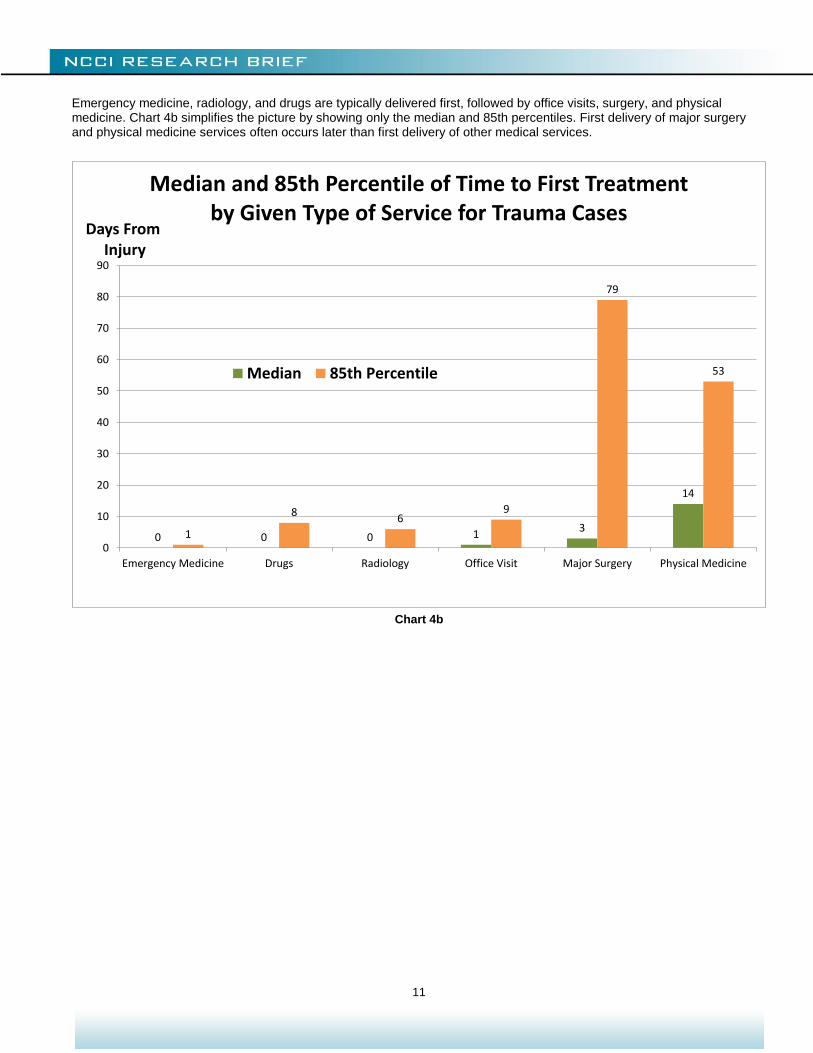
Emergency medicine, radiology, and drugs are typically delivered first, followed by office visits, surgery, and physical medicine. Chart 4b simplifies the picture by showing only the median and 85th percentiles. First delivery of major surgery and physical medicine services often occurs later than first delivery of other medical services.
Chart 4b
0 0 0 13
14
1
86
9
79
53
0
10
20
30
40
50
60
70
80
90
Emergency Medicine Drugs Radiology Office Visit Major Surgery Physical Medicine
Days FromInjury
Median and 85th Percentile of Time to First Treatment by Given Type of Service for Trauma Cases
Median 85th Percentile
12
Claimant Gender
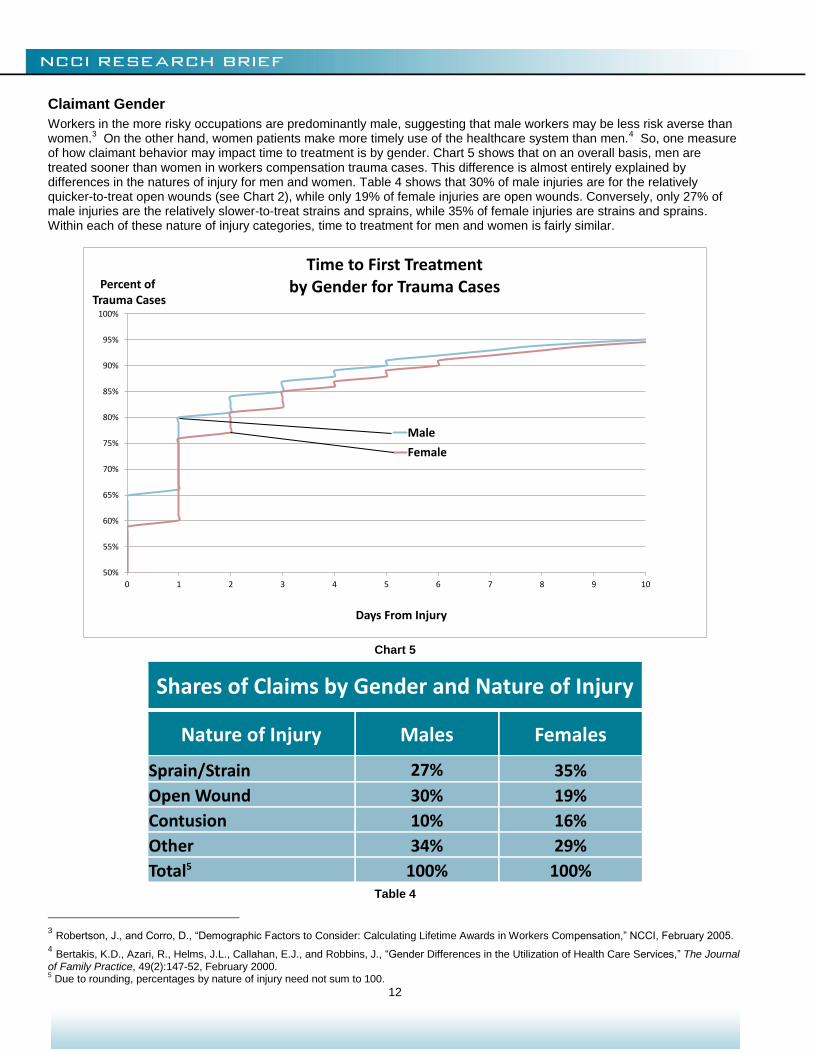
Workers in the more risky occupations are predominantly male, suggesting that male workers may be less risk averse than women.
3 On the other hand, women patients make more timely use of the healthcare system than men.
4 So, one measure
of how claimant behavior may impact time to treatment is by gender. Chart 5 shows that on an overall basis, men are treated sooner than women in workers compensation trauma cases. This difference is almost entirely explained by differences in the natures of injury for men and women. Table 4 shows that 30% of male injuries are for the relatively quicker-to-treat open wounds (see Chart 2), while only 19% of female injuries are open wounds. Conversely, only 27% of male injuries are the relatively slower-to-treat strains and sprains, while 35% of female injuries are strains and sprains. Within each of these nature of injury categories, time to treatment for men and women is fairly similar.
Chart 5
Shares of Claims by Gender and Nature of Injury
Nature of Injury Males Females
Sprain/Strain 27% 35%
Open Wound 30% 19%
Contusion 10% 16%
Other 34% 29%
Total5 100% 100% Table 4
3 Robertson, J., and Corro, D., “Demographic Factors to Consider: Calculating Lifetime Awards in Workers Compensation,” NCCI, February 2005.
4 Bertakis, K.D., Azari, R., Helms, J.L., Callahan, E.J., and Robbins, J., “Gender Differences in the Utilization of Health Care Services,” The Journal
of Family Practice, 49(2):147-52, February 2000. 5 Due to rounding, percentages by nature of injury need not sum to 100.
50%
55%
60%
65%
70%
75%
80%
85%
90%
95%
100%
0 1 2 3 4 5 6 7 8 9 10
Percent ofTrauma Cases
Days From Injury
Time to First Treatment by Gender for Trauma Cases
Male
Female
13
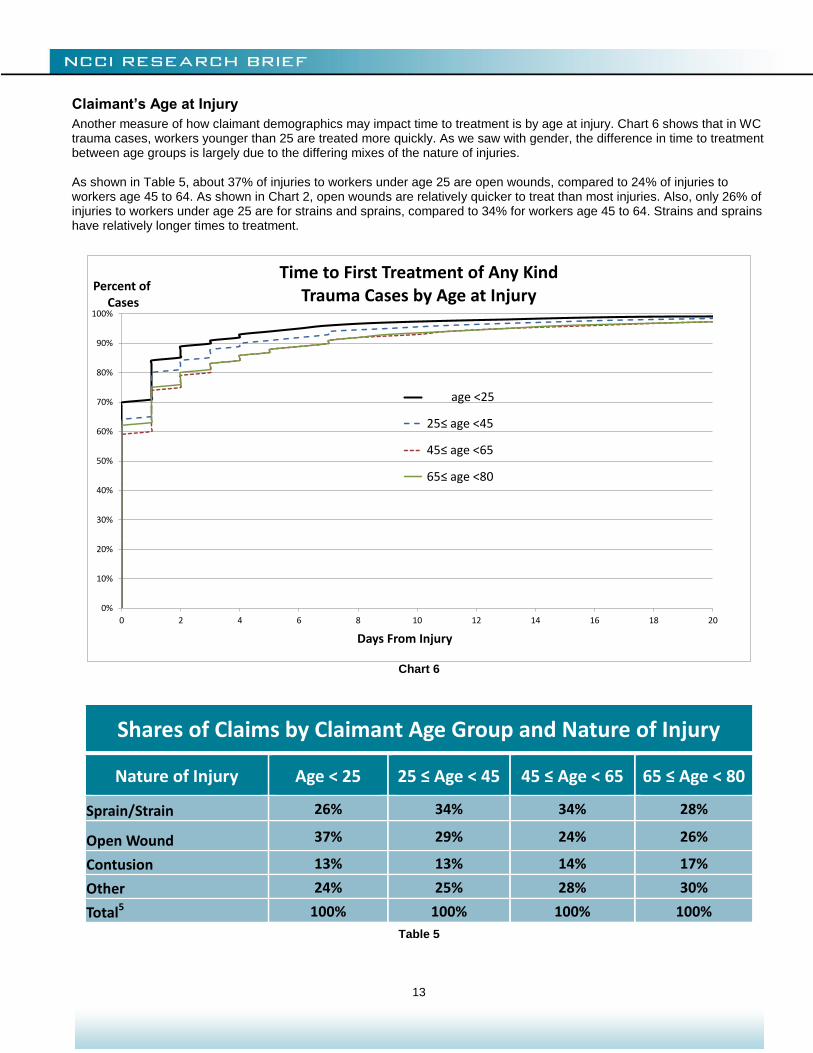
Claimant’s Age at Injury
Another measure of how claimant demographics may impact time to treatment is by age at injury. Chart 6 shows that in WC trauma cases, workers younger than 25 are treated more quickly. As we saw with gender, the difference in time to treatment between age groups is largely due to the differing mixes of the nature of injuries. As shown in Table 5, about 37% of injuries to workers under age 25 are open wounds, compared to 24% of injuries to workers age 45 to 64. As shown in Chart 2, open wounds are relatively quicker to treat than most injuries. Also, only 26% of injuries to workers under age 25 are for strains and sprains, compared to 34% for workers age 45 to 64. Strains and sprains have relatively longer times to treatment.
Chart 6
Shares of Claims by Claimant Age Group and Nature of Injury
Nature of Injury Age < 25 25 ≤ Age < 45 45 ≤ Age < 65 65 ≤ Age < 80
Sprain/Strain 26% 34% 34% 28%
Open Wound 37% 29% 24% 26%
Contusion 13% 13% 14% 17%
Other 24% 25% 28% 30%
Total5 100% 100% 100% 100%
Table 5
0%
10%
20%
30%
40%
50%
60%
70%
80%
90%
100%
0 2 4 6 8 10 12 14 16 18 20
Percent ofCases
Days From Injury
Time to First Treatment of Any KindTrauma Cases by Age at Injury
age <25
25≤ age <45
45≤ age <65
65≤ age <80
14
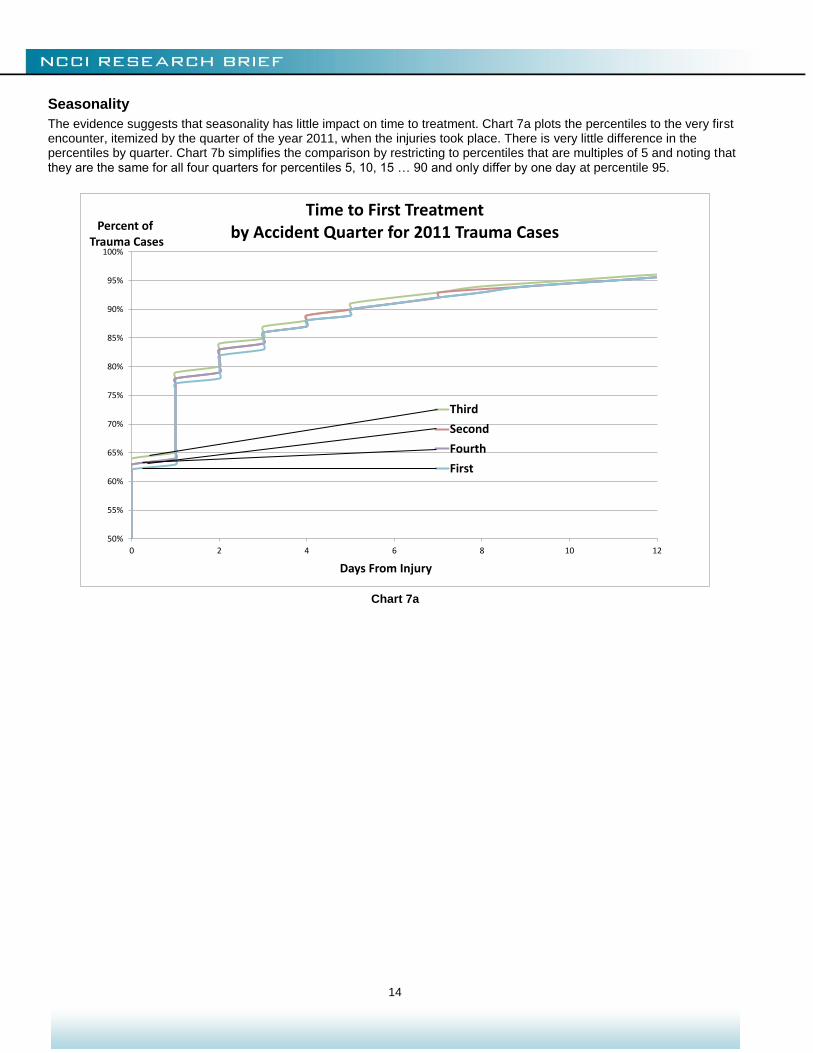
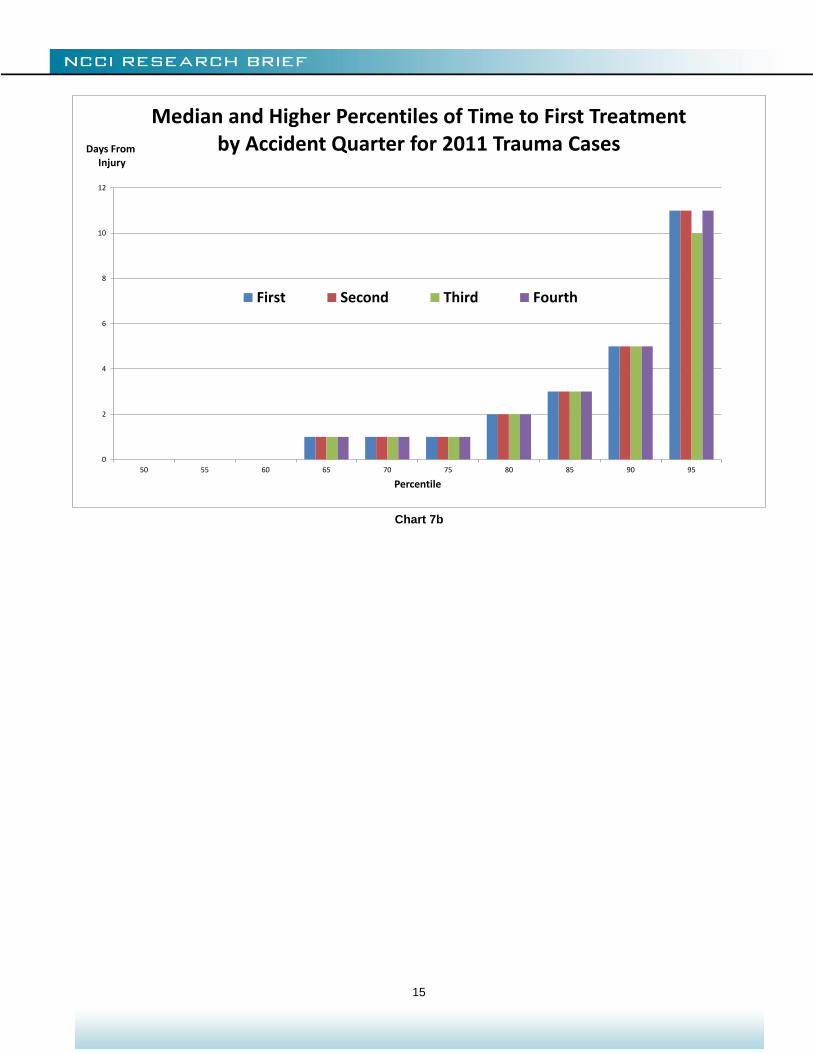
Seasonality
The evidence suggests that seasonality has little impact on time to treatment. Chart 7a plots the percentiles to the very first encounter, itemized by the quarter of the year 2011, when the injuries took place. There is very little difference in the percentiles by quarter. Chart 7b simplifies the comparison by restricting to percentiles that are multiples of 5 and noting that they are the same for all four quarters for percentiles 5, 10, 15 … 90 and only differ by one day at percentile 95.
Chart 7a
50%
55%
60%
65%
70%
75%
80%
85%
90%
95%
100%
0 2 4 6 8 10 12
Percent ofTrauma Cases
Days From Injury
Time to First Treatment by Accident Quarter for 2011 Trauma Cases
Third
Second
Fourth
First
15
Chart 7b
0
2
4
6
8
10
12
50 55 60 65 70 75 80 85 90 95
Days FromInjury
Percentile
Median and Higher Percentiles of Time to First Treatment by Accident Quarter for 2011 Trauma Cases
First Second Third Fourth
16
Day of the Week
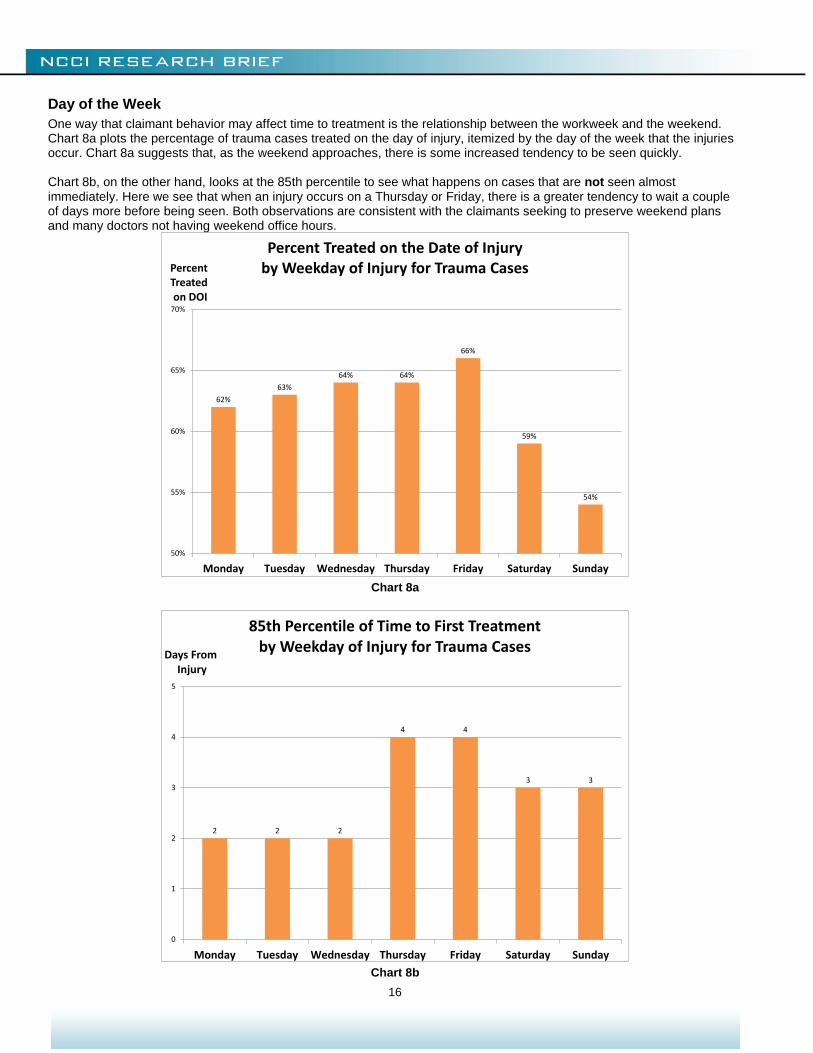
One way that claimant behavior may affect time to treatment is the relationship between the workweek and the weekend. Chart 8a plots the percentage of trauma cases treated on the day of injury, itemized by the day of the week that the injuries occur. Chart 8a suggests that, as the weekend approaches, there is some increased tendency to be seen quickly. Chart 8b, on the other hand, looks at the 85th percentile to see what happens on cases that are not seen almost immediately. Here we see that when an injury occurs on a Thursday or Friday, there is a greater tendency to wait a couple of days more before being seen. Both observations are consistent with the claimants seeking to preserve weekend plans and many doctors not having weekend office hours.
Chart 8a
Chart 8b
62%
63%
64% 64%
66%
59%
54%
50%
55%
60%
65%
70%
Monday Tuesday Wednesday Thursday Friday Saturday Sunday
Percent Treatedon DOI
Percent Treated on the Date of Injury by Weekday of Injury for Trauma Cases
2 2 2
4 4
3 3
0
1
2
3
4
5
Monday Tuesday Wednesday Thursday Friday Saturday Sunday
Days FromInjury
85th Percentile of Time to First Treatment by Weekday of Injury for Trauma Cases
17
Use of an Attorney
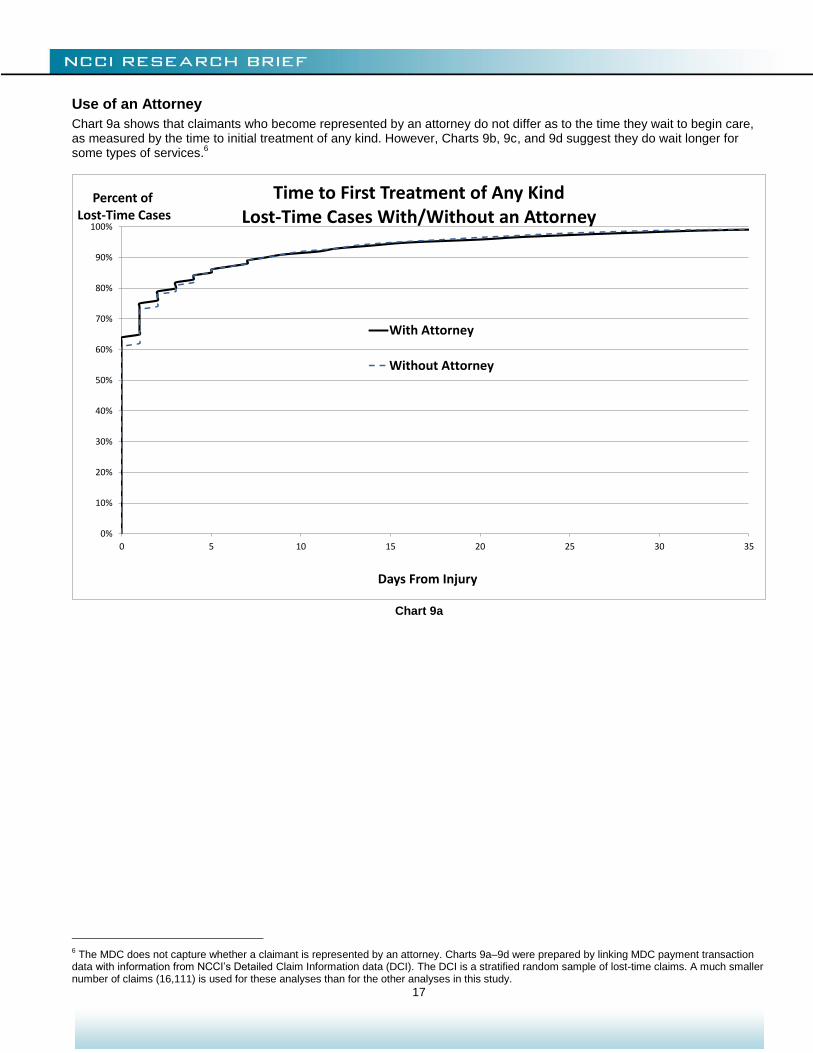
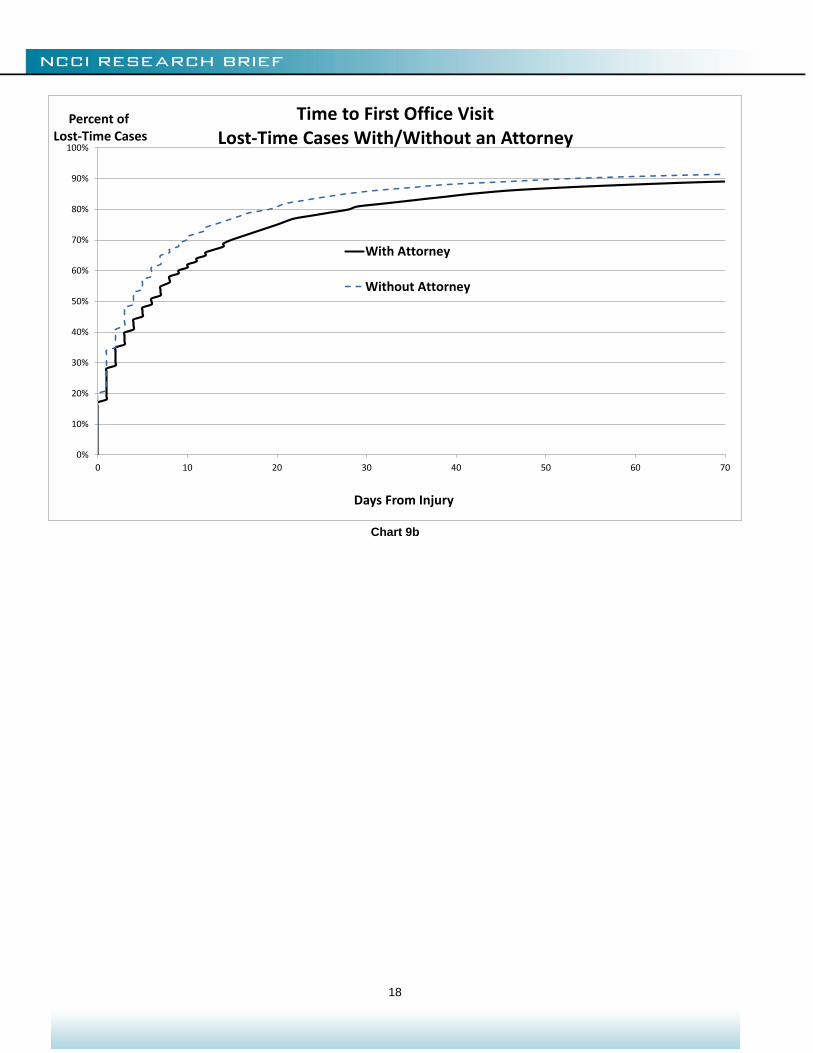
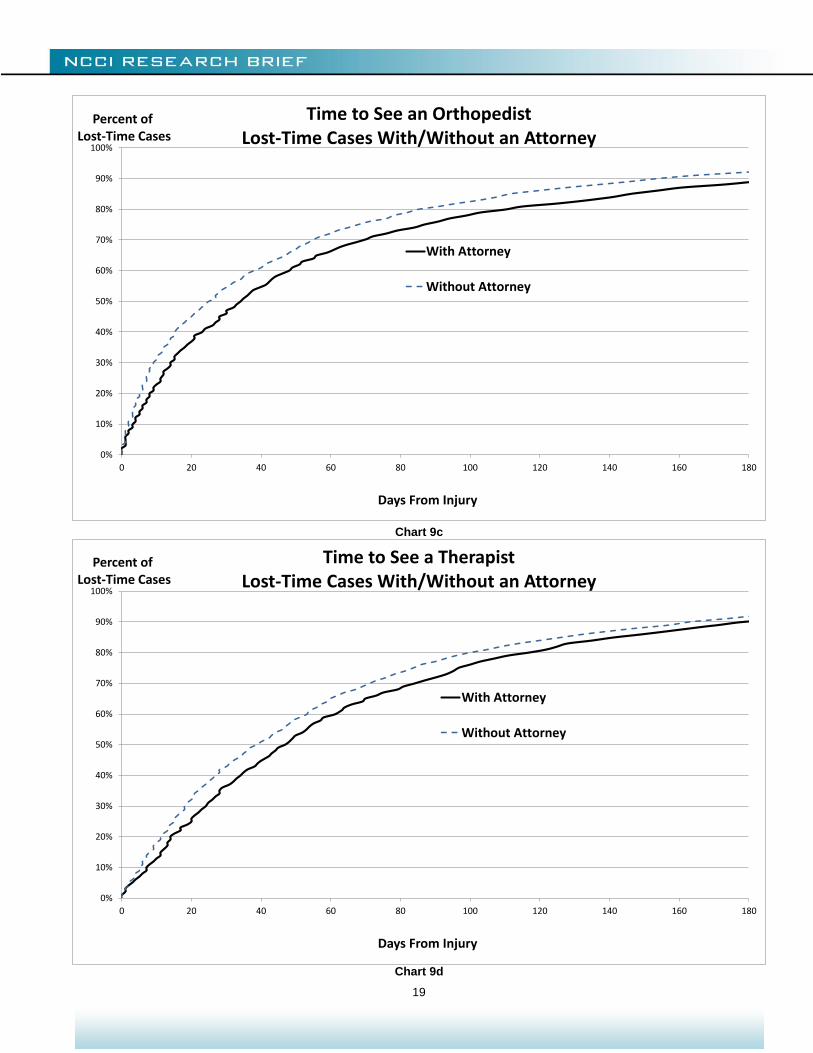
Chart 9a shows that claimants who become represented by an attorney do not differ as to the time they wait to begin care, as measured by the time to initial treatment of any kind. However, Charts 9b, 9c, and 9d suggest they do wait longer for some types of services.
6
Chart 9a
6 The MDC does not capture whether a claimant is represented by an attorney. Charts 9a–9d were prepared by linking MDC payment transaction
data with information from NCCI’s Detailed Claim Information data (DCI). The DCI is a stratified random sample of lost-time claims. A much smaller number of claims (16,111) is used for these analyses than for the other analyses in this study.
0%
10%
20%
30%
40%
50%
60%
70%
80%
90%
100%
0 5 10 15 20 25 30 35
Percent ofLost-Time Cases
Days From Injury
Time to First Treatment of Any KindLost-Time Cases With/Without an Attorney
With Attorney
Without Attorney
18
Chart 9b
0%
10%
20%
30%
40%
50%
60%
70%
80%
90%
100%
0 10 20 30 40 50 60 70
Percent ofLost-Time Cases
Days From Injury
Time to First Office VisitLost-Time Cases With/Without an Attorney
With Attorney
Without Attorney
19
Chart 9c
Chart 9d
0%
10%
20%
30%
40%
50%
60%
70%
80%
90%
100%
0 20 40 60 80 100 120 140 160 180
Percent ofLost-Time Cases
Days From Injury
Time to See an OrthopedistLost-Time Cases With/Without an Attorney
With Attorney
Without Attorney
0%
10%
20%
30%
40%
50%
60%
70%
80%
90%
100%
0 20 40 60 80 100 120 140 160 180
Percent ofLost-Time Cases
Days From Injury
Time to See a TherapistLost-Time Cases With/Without an Attorney
With Attorney
Without Attorney

20
Differences by weekday and attorney involvement show that claimant behavior may affect access to care and the time to treatment. For future studies, this suggests looking at how the Affordable Care Act may change claimant behavior. For example, does having group health insurance (or having a higher deductible in group health after the implementation of the ACA than before) influence filing a WC claim as opposed to a group health claim? While a challenge to isolate and quantify, behavioral responses may influence the way care is accessed.
21
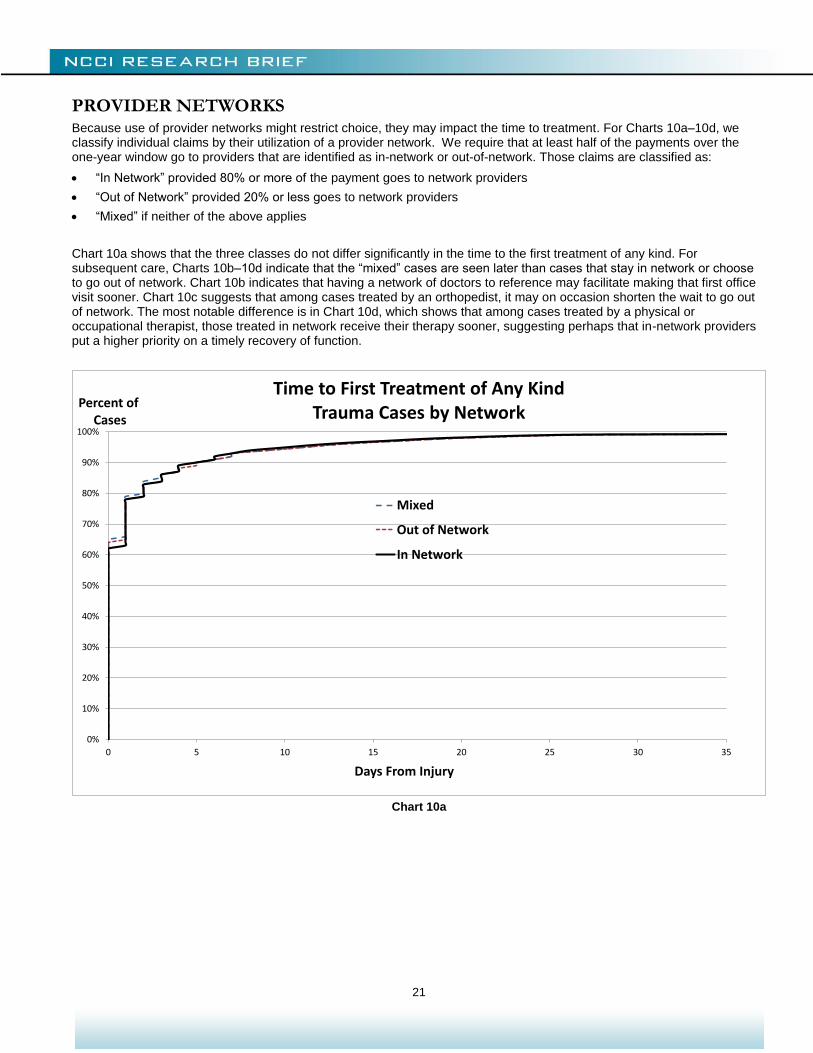
PROVIDER NETWORKS Because use of provider networks might restrict choice, they may impact the time to treatment. For Charts 10a–10d, we classify individual claims by their utilization of a provider network. We require that at least half of the payments over the one-year window go to providers that are identified as in-network or out-of-network. Those claims are classified as:
“In Network” provided 80% or more of the payment goes to network providers
“Out of Network” provided 20% or less goes to network providers
“Mixed” if neither of the above applies
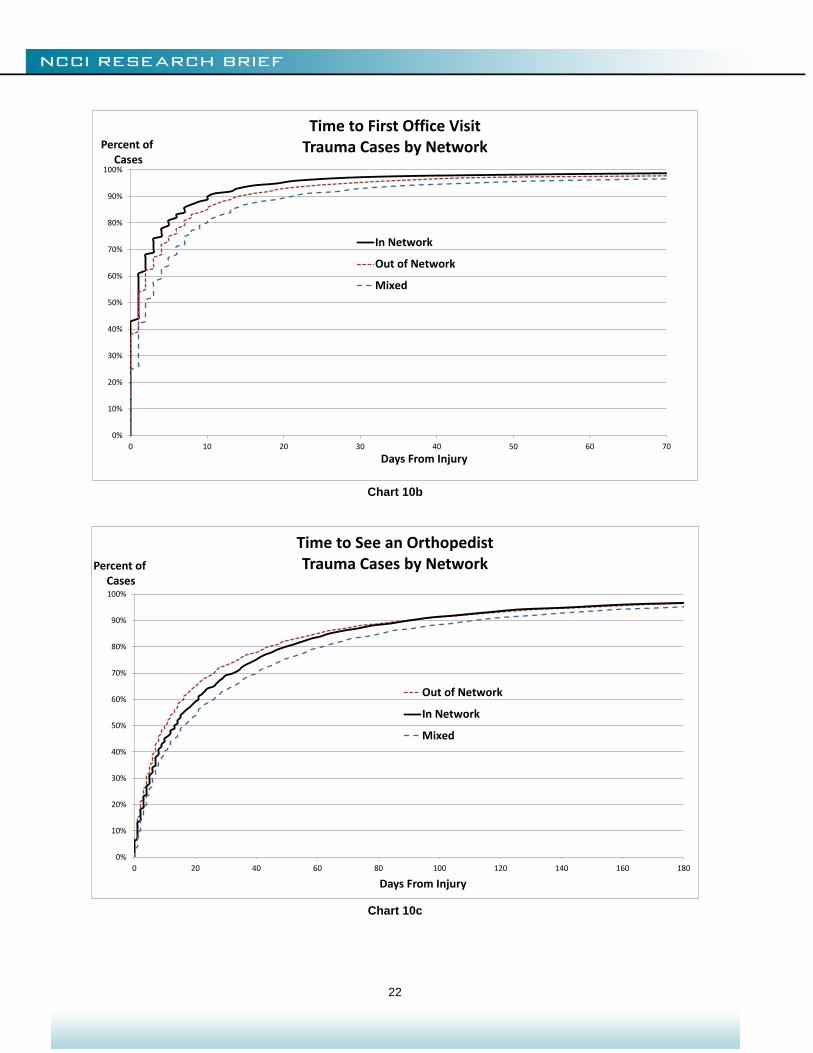
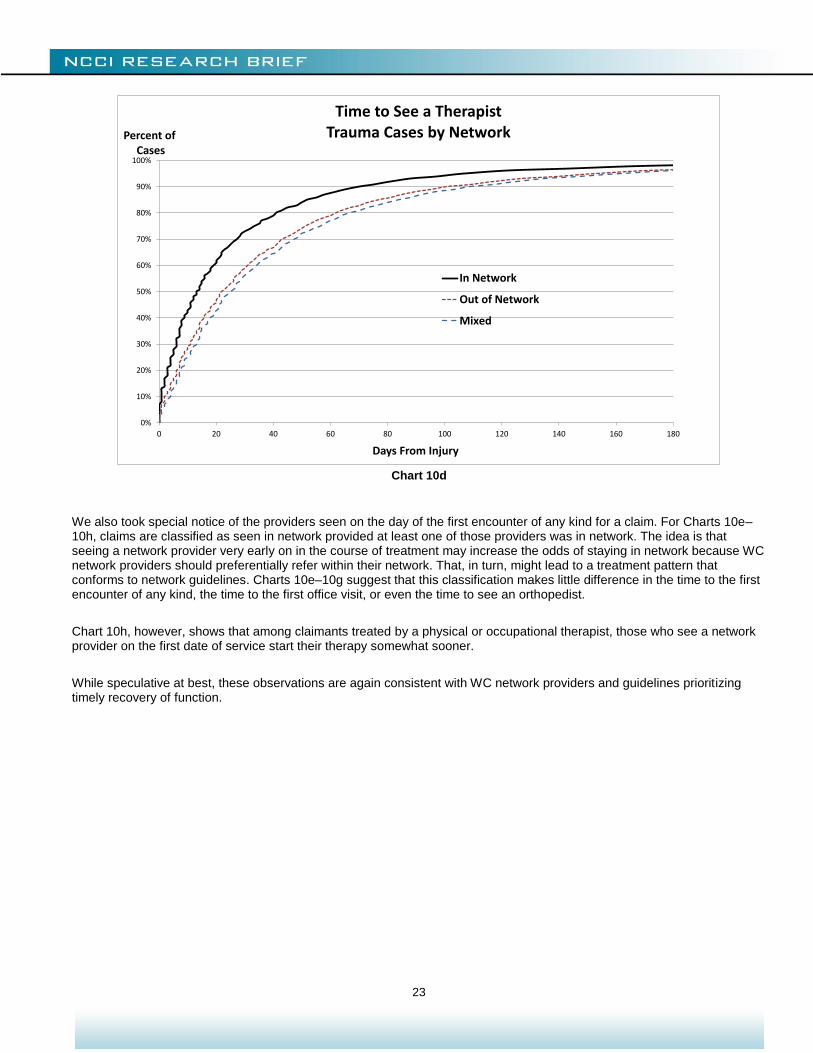
Chart 10a shows that the three classes do not differ significantly in the time to the first treatment of any kind. For subsequent care, Charts 10b–10d indicate that the “mixed” cases are seen later than cases that stay in network or choose to go out of network. Chart 10b indicates that having a network of doctors to reference may facilitate making that first office visit sooner. Chart 10c suggests that among cases treated by an orthopedist, it may on occasion shorten the wait to go out of network. The most notable difference is in Chart 10d, which shows that among cases treated by a physical or occupational therapist, those treated in network receive their therapy sooner, suggesting perhaps that in-network providers put a higher priority on a timely recovery of function.
Chart 10a
0%
10%
20%
30%
40%
50%
60%
70%
80%
90%
100%
0 5 10 15 20 25 30 35
Percent ofCases
Days From Injury
Time to First Treatment of Any KindTrauma Cases by Network
Mixed
Out of Network
In Network
22
Chart 10b
Chart 10c
0%
10%
20%
30%
40%
50%
60%
70%
80%
90%
100%
0 10 20 30 40 50 60 70
Percent ofCases
Days From Injury
Time to First Office VisitTrauma Cases by Network
In Network
Out of Network
Mixed
0%
10%
20%
30%
40%
50%
60%
70%
80%
90%
100%
0 20 40 60 80 100 120 140 160 180
Percent ofCases
Days From Injury
Time to See an OrthopedistTrauma Cases by Network
Out of Network
In Network
Mixed
23
Chart 10d
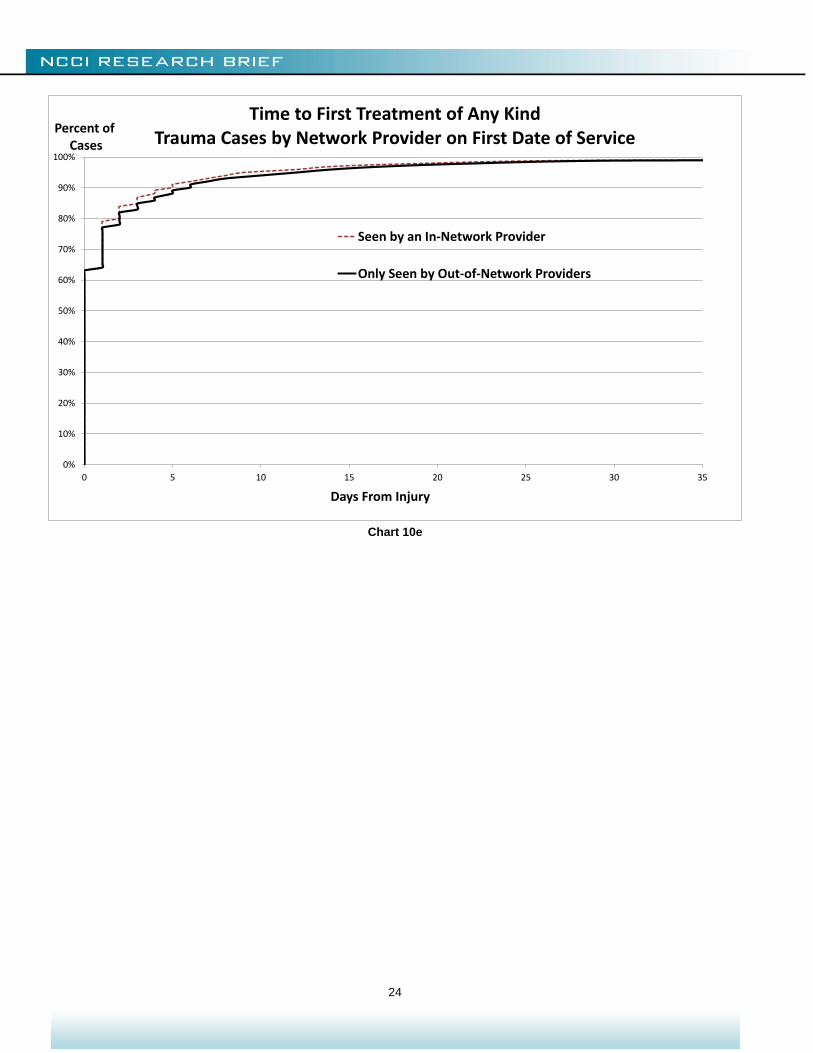
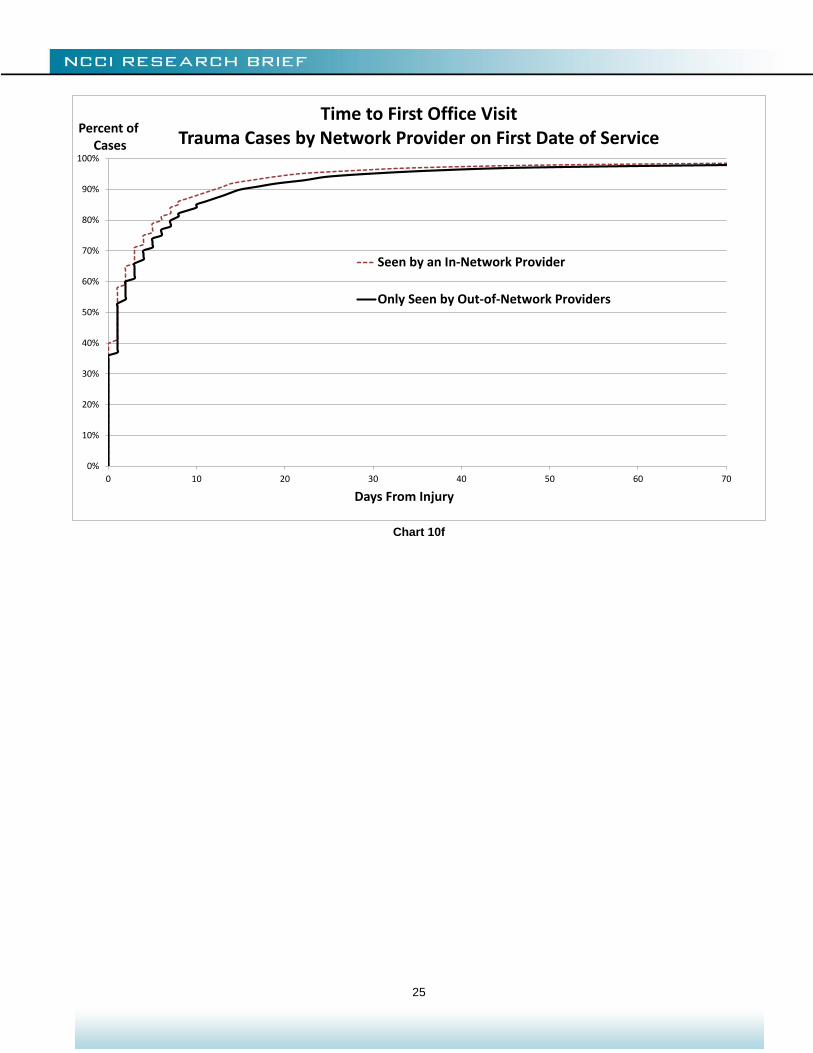
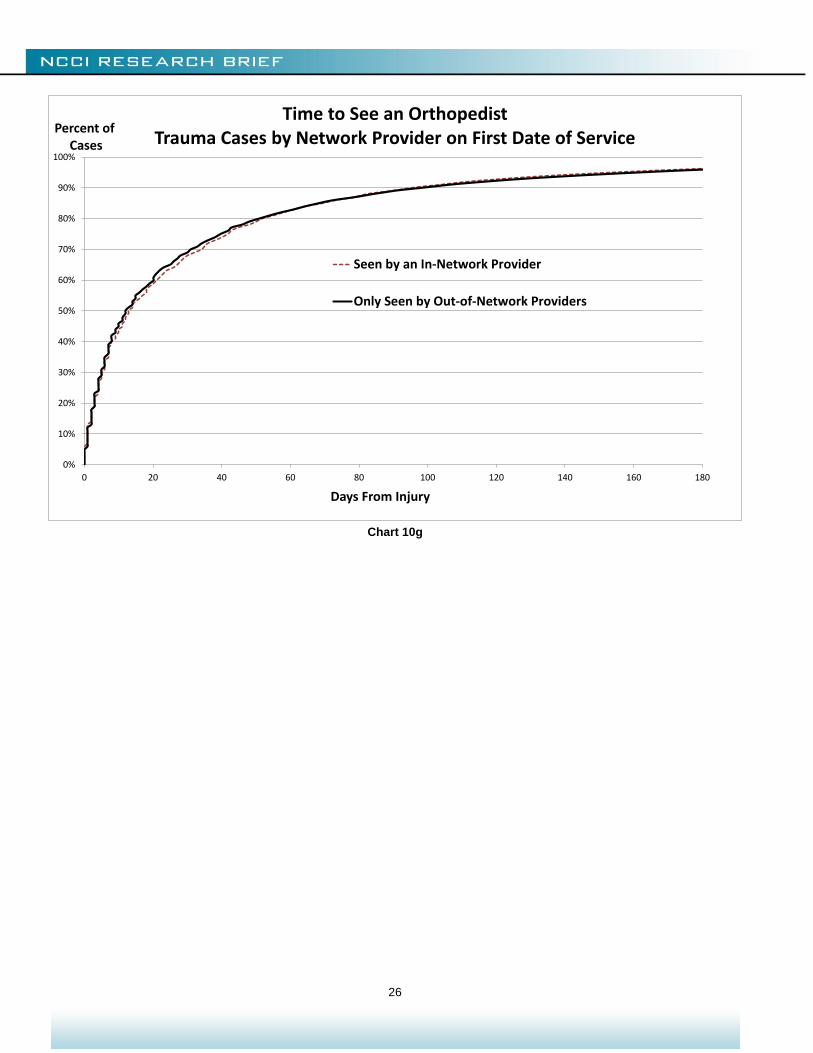
We also took special notice of the providers seen on the day of the first encounter of any kind for a claim. For Charts 10e–10h, claims are classified as seen in network provided at least one of those providers was in network. The idea is that seeing a network provider very early on in the course of treatment may increase the odds of staying in network because WC network providers should preferentially refer within their network. That, in turn, might lead to a treatment pattern that conforms to network guidelines. Charts 10e–10g suggest that this classification makes little difference in the time to the first encounter of any kind, the time to the first office visit, or even the time to see an orthopedist.
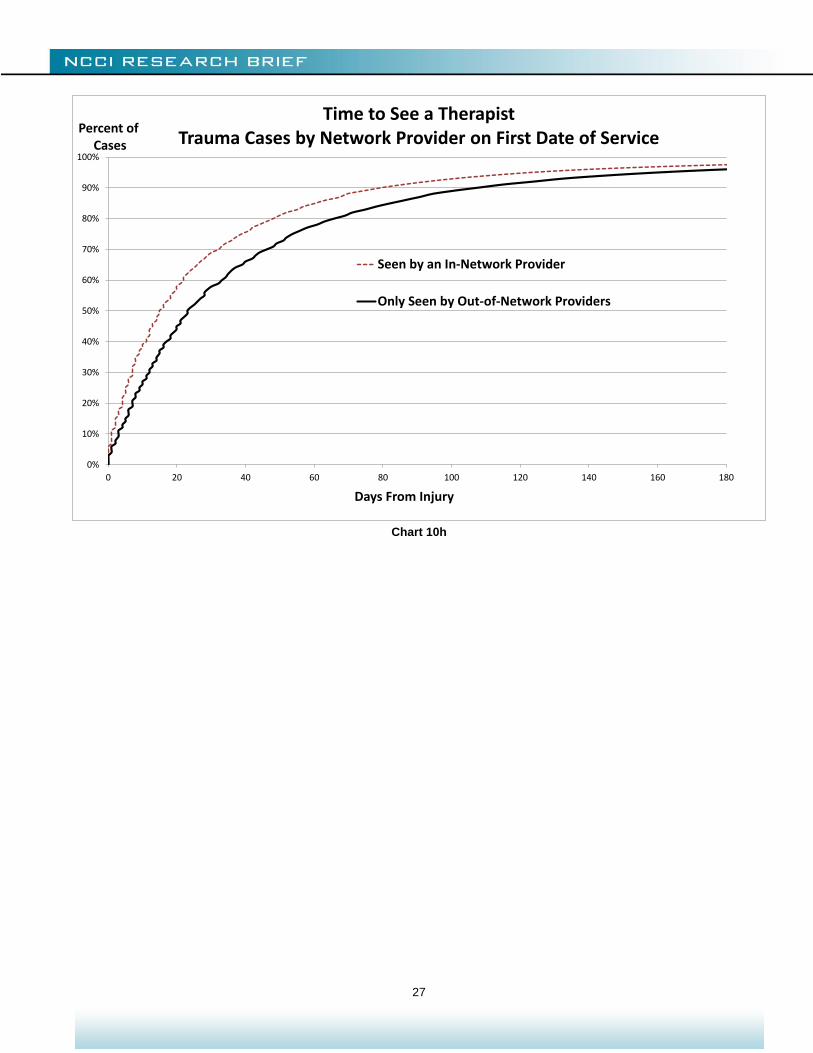
Chart 10h, however, shows that among claimants treated by a physical or occupational therapist, those who see a network provider on the first date of service start their therapy somewhat sooner.
While speculative at best, these observations are again consistent with WC network providers and guidelines prioritizing timely recovery of function.
0%
10%
20%
30%
40%
50%
60%
70%
80%
90%
100%
0 20 40 60 80 100 120 140 160 180
Percent ofCases
Days From Injury
Time to See a TherapistTrauma Cases by Network
In Network
Out of Network
Mixed
24
Chart 10e
0%
10%
20%
30%
40%
50%
60%
70%
80%
90%
100%
0 5 10 15 20 25 30 35
Percent ofCases
Days From Injury
Time to First Treatment of Any KindTrauma Cases by Network Provider on First Date of Service
Seen by an In-Network Provider
Only Seen by Out-of-Network Providers
25
Chart 10f
0%
10%
20%
30%
40%
50%
60%
70%
80%
90%
100%
0 10 20 30 40 50 60 70
Percent ofCases
Days From Injury
Time to First Office VisitTrauma Cases by Network Provider on First Date of Service
Seen by an In-Network Provider
Only Seen by Out-of-Network Providers
26
Chart 10g
0%
10%
20%
30%
40%
50%
60%
70%
80%
90%
100%
0 20 40 60 80 100 120 140 160 180
Percent ofCases
Days From Injury
Time to See an OrthopedistTrauma Cases by Network Provider on First Date of Service
Seen by an In-Network Provider
Only Seen by Out-of-Network Providers
27
Chart 10h
0%
10%
20%
30%
40%
50%
60%
70%
80%
90%
100%
0 20 40 60 80 100 120 140 160 180
Percent ofCases
Days From Injury
Time to See a TherapistTrauma Cases by Network Provider on First Date of Service
Seen by an In-Network Provider
Only Seen by Out-of-Network Providers
28
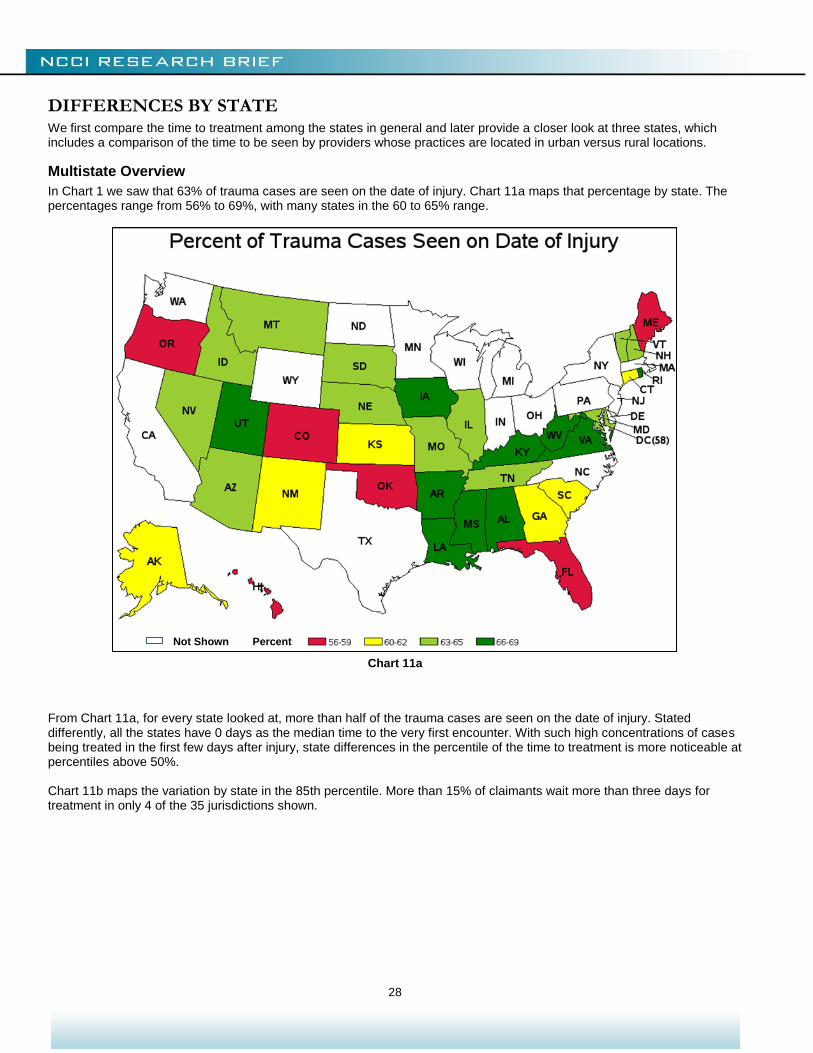
DIFFERENCES BY STATE We first compare the time to treatment among the states in general and later provide a closer look at three states, which includes a comparison of the time to be seen by providers whose practices are located in urban versus rural locations.
Multistate Overview
In Chart 1 we saw that 63% of trauma cases are seen on the date of injury. Chart 11a maps that percentage by state. The percentages range from 56% to 69%, with many states in the 60 to 65% range.
Chart 11a
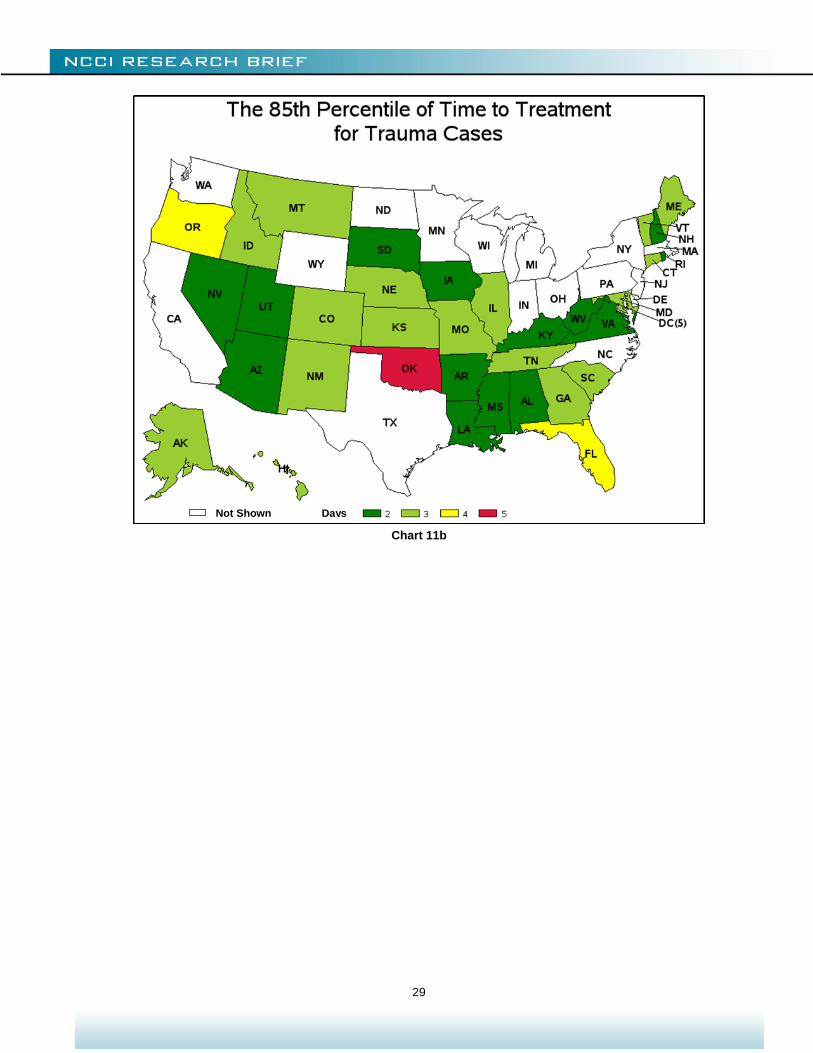
From Chart 11a, for every state looked at, more than half of the trauma cases are seen on the date of injury. Stated differently, all the states have 0 days as the median time to the very first encounter. With such high concentrations of cases being treated in the first few days after injury, state differences in the percentile of the time to treatment is more noticeable at percentiles above 50%. Chart 11b maps the variation by state in the 85th percentile. More than 15% of claimants wait more than three days for treatment in only 4 of the 35 jurisdictions shown.
Not Shown Percent
29
Chart 11b
Not Shown Days
30
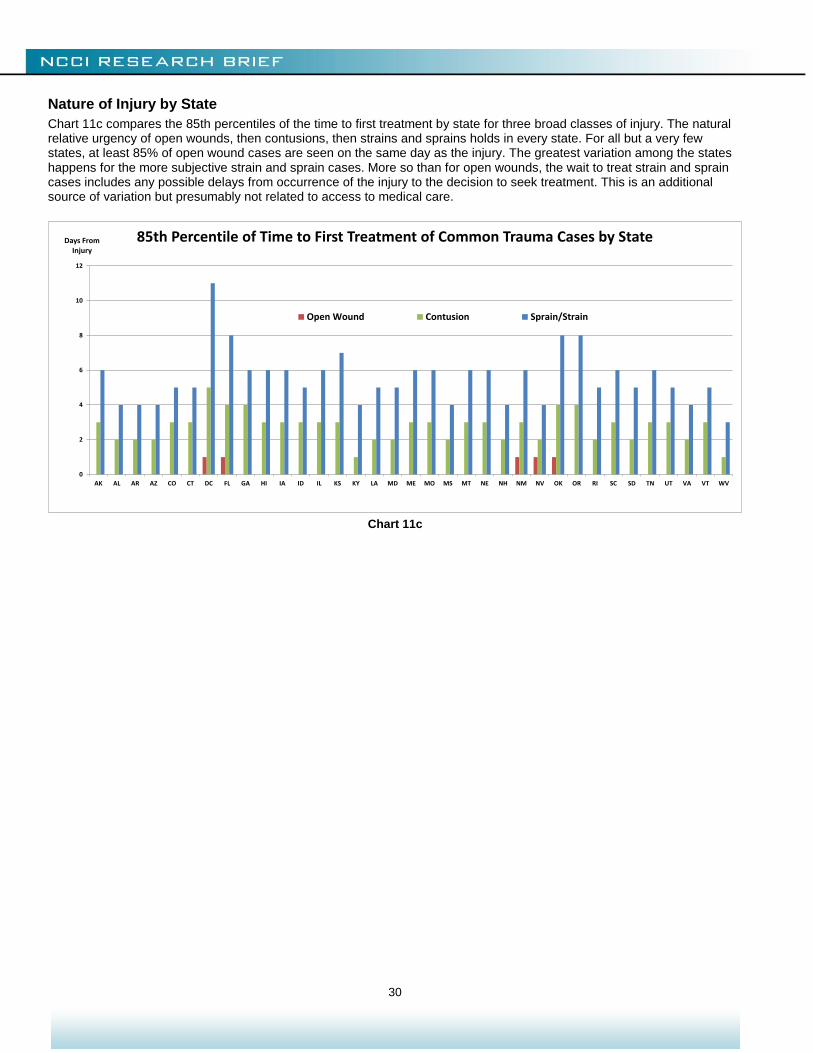
Nature of Injury by State
Chart 11c compares the 85th percentiles of the time to first treatment by state for three broad classes of injury. The natural relative urgency of open wounds, then contusions, then strains and sprains holds in every state. For all but a very few states, at least 85% of open wound cases are seen on the same day as the injury. The greatest variation among the states happens for the more subjective strain and sprain cases. More so than for open wounds, the wait to treat strain and sprain cases includes any possible delays from occurrence of the injury to the decision to seek treatment. This is an additional source of variation but presumably not related to access to medical care.
Chart 11c
0
2
4
6
8
10
12
AK AL AR AZ CO CT DC FL GA HI IA ID IL KS KY LA MD ME MO MS MT NE NH NM NV OK OR RI SC SD TN UT VA VT WV
Days From Injury
85th Percentile of Time to First Treatment of Common Trauma Cases by State
Open Wound Contusion Sprain/Strain
31
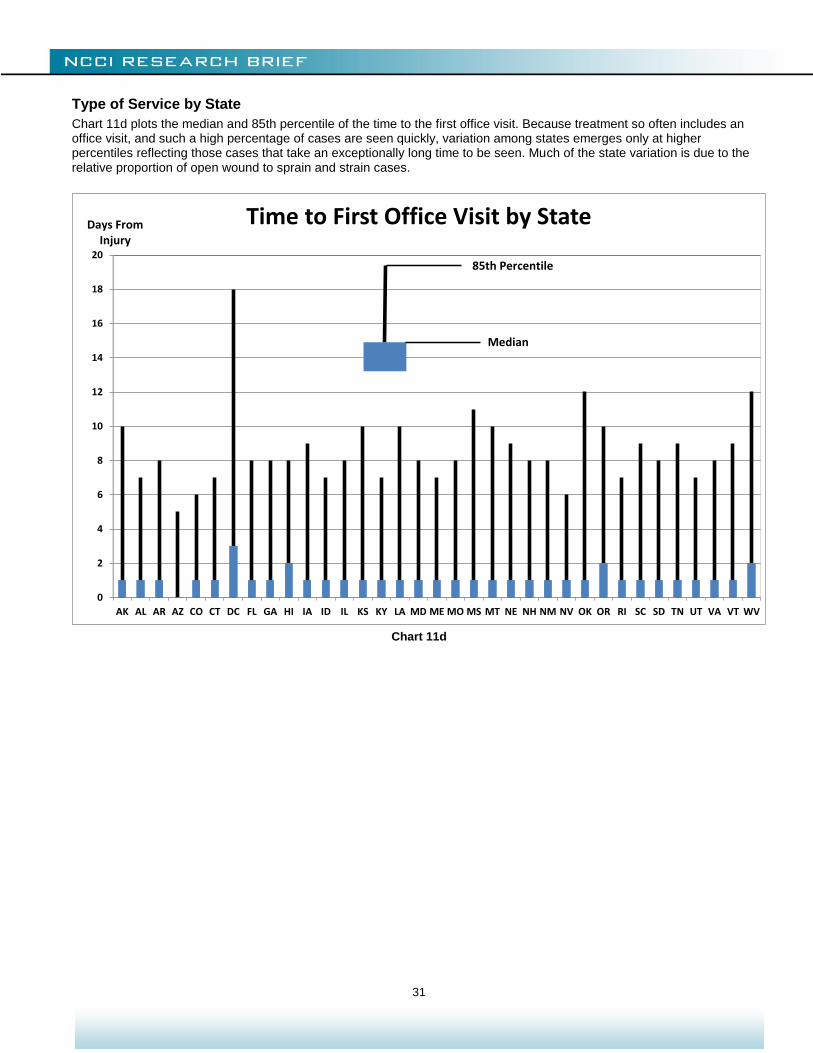
Type of Service by State
Chart 11d plots the median and 85th percentile of the time to the first office visit. Because treatment so often includes an office visit, and such a high percentage of cases are seen quickly, variation among states emerges only at higher percentiles reflecting those cases that take an exceptionally long time to be seen. Much of the state variation is due to the relative proportion of open wound to sprain and strain cases.
Chart 11d
0
2
4
6
8
10
12
14
16
18
20
AK AL AR AZ CO CT DC FL GA HI IA ID IL KS KY LA MD ME MO MS MT NE NH NM NV OK OR RI SC SD TN UT VA VT WV
Time to First Office Visit by State
Median
85th Percentile
Days FromInjury
32
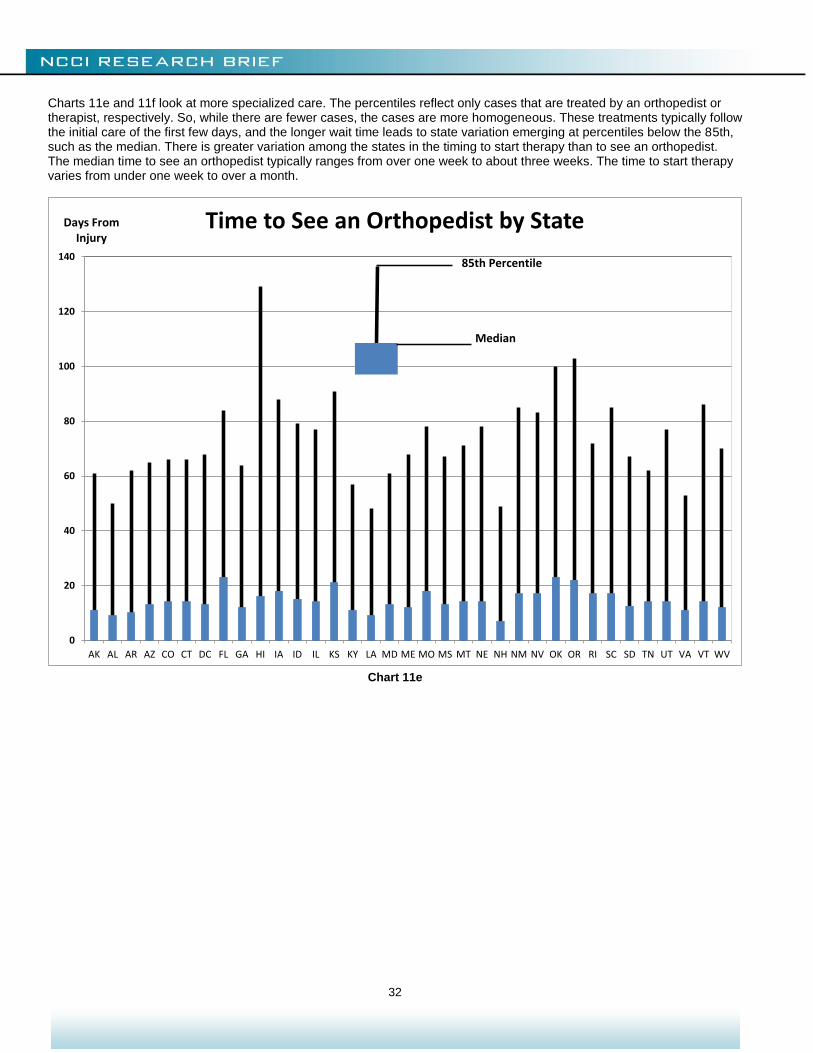
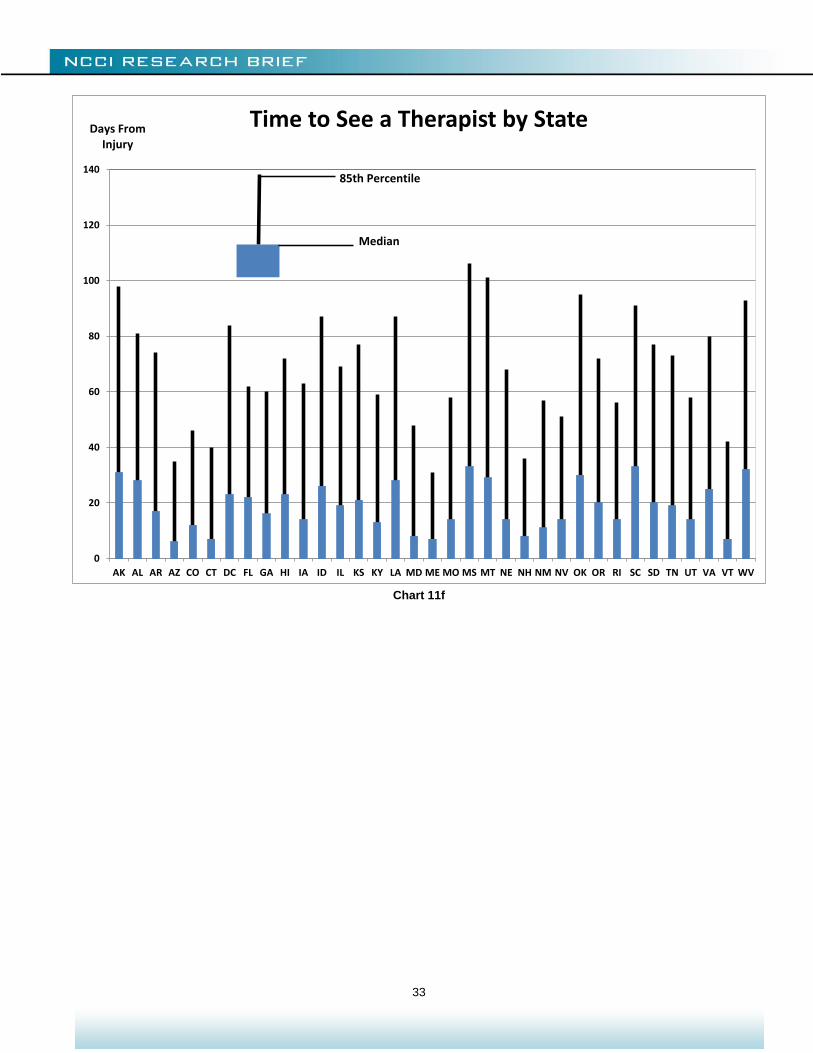
Charts 11e and 11f look at more specialized care. The percentiles reflect only cases that are treated by an orthopedist or therapist, respectively. So, while there are fewer cases, the cases are more homogeneous. These treatments typically follow the initial care of the first few days, and the longer wait time leads to state variation emerging at percentiles below the 85th, such as the median. There is greater variation among the states in the timing to start therapy than to see an orthopedist. The median time to see an orthopedist typically ranges from over one week to about three weeks. The time to start therapy varies from under one week to over a month.
Chart 11e
0
20
40
60
80
100
120
140
AK AL AR AZ CO CT DC FL GA HI IA ID IL KS KY LA MD ME MO MS MT NE NH NM NV OK OR RI SC SD TN UT VA VT WV
Time to See an Orthopedist by State
85th Percentile
Median
Days FromInjury
33
Chart 11f
0
20
40
60
80
100
120
140
AK AL AR AZ CO CT DC FL GA HI IA ID IL KS KY LA MD ME MO MS MT NE NH NM NV OK OR RI SC SD TN UT VA VT WV
Time to See a Therapist by State
Median
Days FromInjury
85th Percentile
34
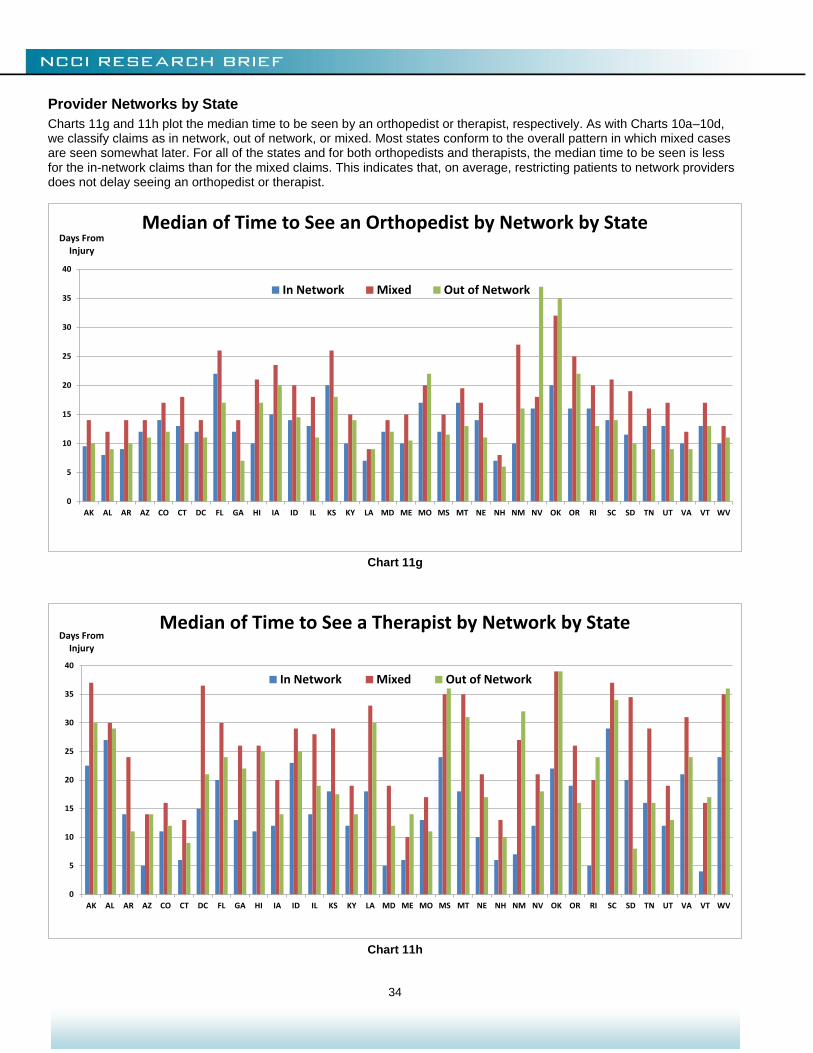
Provider Networks by State
Charts 11g and 11h plot the median time to be seen by an orthopedist or therapist, respectively. As with Charts 10a–10d, we classify claims as in network, out of network, or mixed. Most states conform to the overall pattern in which mixed cases are seen somewhat later. For all of the states and for both orthopedists and therapists, the median time to be seen is less for the in-network claims than for the mixed claims. This indicates that, on average, restricting patients to network providers does not delay seeing an orthopedist or therapist.
Chart 11g
Chart 11h
0
5
10
15
20
25
30
35
40
AK AL AR AZ CO CT DC FL GA HI IA ID IL KS KY LA MD ME MO MS MT NE NH NM NV OK OR RI SC SD TN UT VA VT WV
Days From Injury
Median of Time to See an Orthopedist by Network by State
In Network Mixed Out of Network
0
5
10
15
20
25
30
35
40
AK AL AR AZ CO CT DC FL GA HI IA ID IL KS KY LA MD ME MO MS MT NE NH NM NV OK OR RI SC SD TN UT VA VT WV
Days From Injury
Median of Time to See a Therapist by Network by State
In Network Mixed Out of Network
35
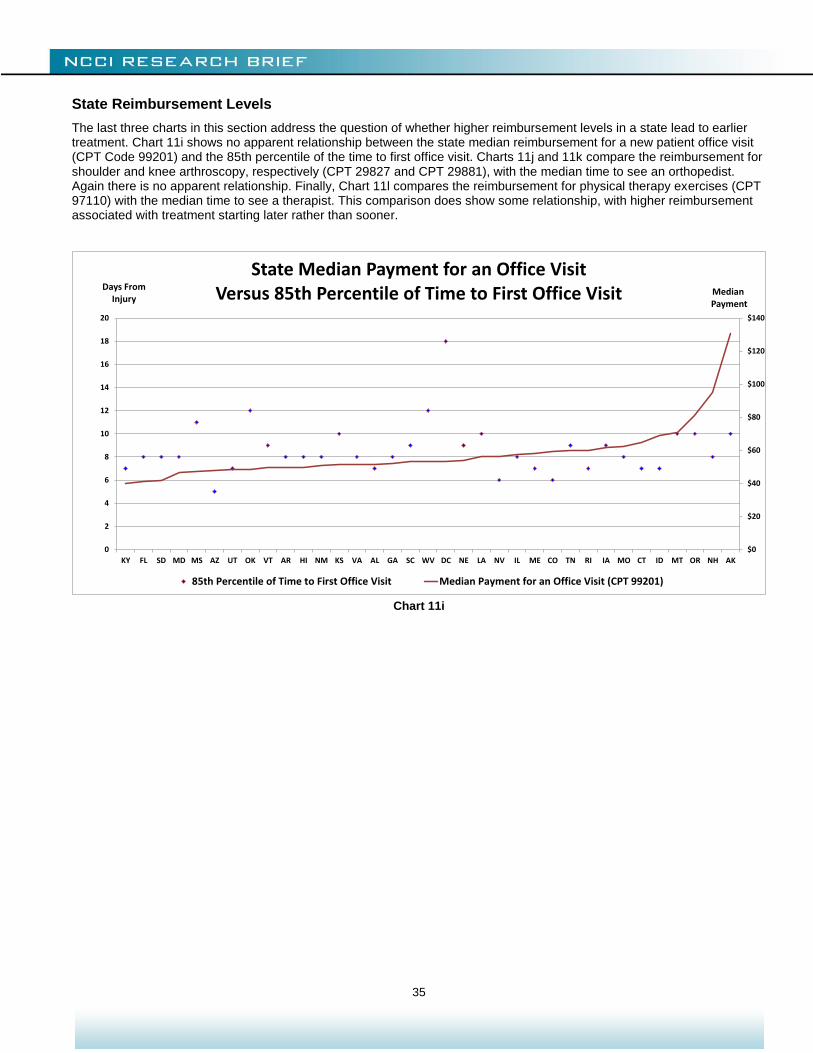
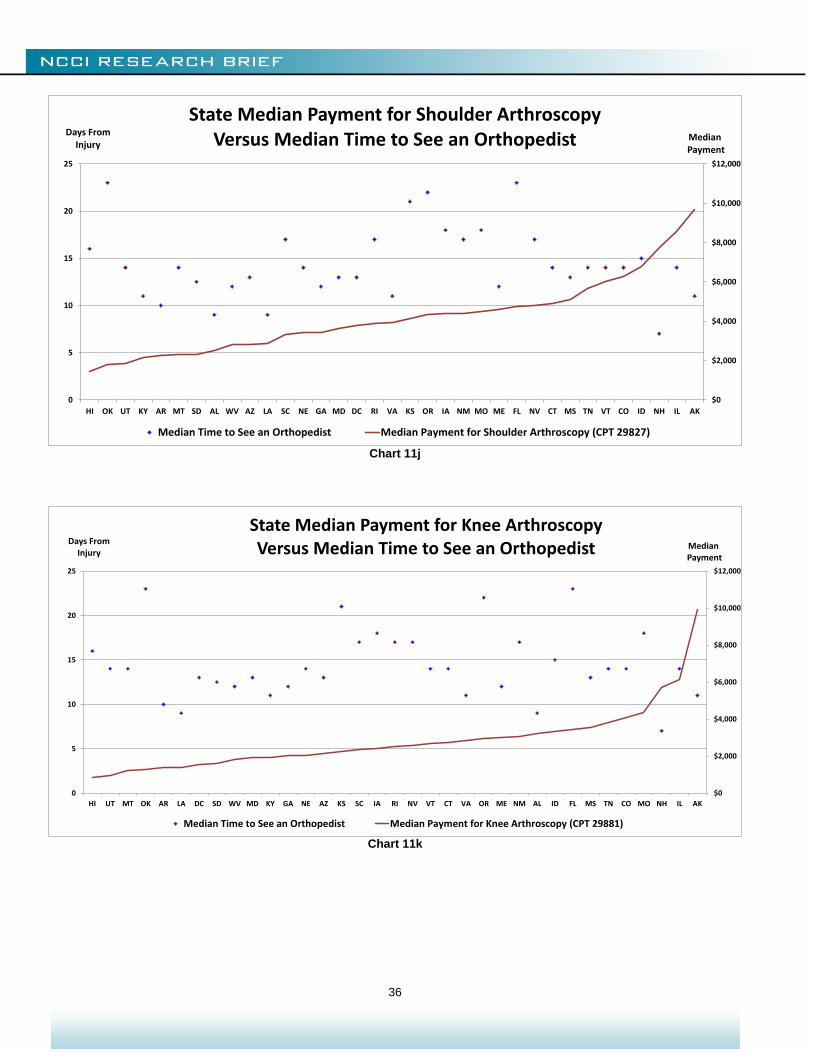
State Reimbursement Levels
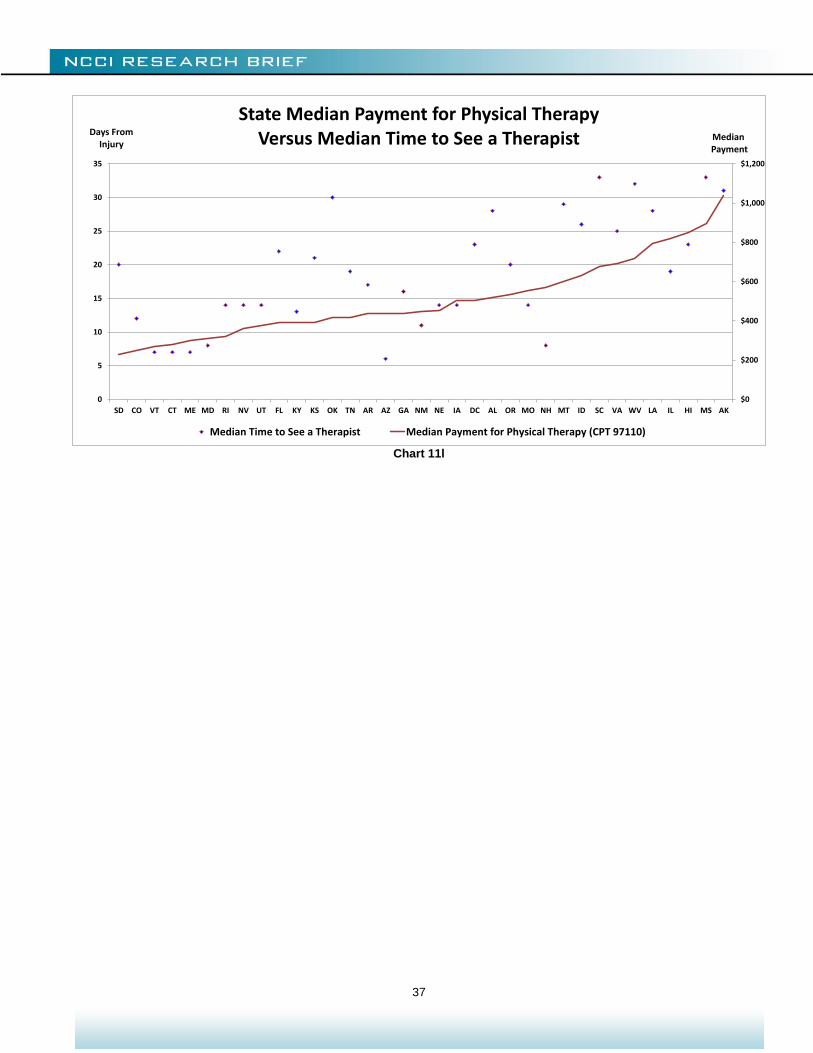
The last three charts in this section address the question of whether higher reimbursement levels in a state lead to earlier treatment. Chart 11i shows no apparent relationship between the state median reimbursement for a new patient office visit (CPT Code 99201) and the 85th percentile of the time to first office visit. Charts 11j and 11k compare the reimbursement for shoulder and knee arthroscopy, respectively (CPT 29827 and CPT 29881), with the median time to see an orthopedist. Again there is no apparent relationship. Finally, Chart 11l compares the reimbursement for physical therapy exercises (CPT 97110) with the median time to see a therapist. This comparison does show some relationship, with higher reimbursement associated with treatment starting later rather than sooner.
Chart 11i
$0
$20
$40
$60
$80
$100
$120
$140
0
2
4
6
8
10
12
14
16
18
20
KY FL SD MD MS AZ UT OK VT AR HI NM KS VA AL GA SC WV DC NE LA NV IL ME CO TN RI IA MO CT ID MT OR NH AK
MedianPayment
Days From Injury
State Median Payment for an Office VisitVersus 85th Percentile of Time to First Office Visit
85th Percentile of Time to First Office Visit Median Payment for an Office Visit (CPT 99201)
36
Chart 11j
Chart 11k
$0
$2,000
$4,000
$6,000
$8,000
$10,000
$12,000
0
5
10
15
20
25
HI OK UT KY AR MT SD AL WV AZ LA SC NE GA MD DC RI VA KS OR IA NM MO ME FL NV CT MS TN VT CO ID NH IL AK
MedianPayment
Days From Injury
State Median Payment for Shoulder Arthroscopy Versus Median Time to See an Orthopedist
Median Time to See an Orthopedist Median Payment for Shoulder Arthroscopy (CPT 29827)
$0
$2,000
$4,000
$6,000
$8,000
$10,000
$12,000
0
5
10
15
20
25
HI UT MT OK AR LA DC SD WV MD KY GA NE AZ KS SC IA RI NV VT CT VA OR ME NM AL ID FL MS TN CO MO NH IL AK
MedianPayment
Days From Injury
State Median Payment for Knee Arthroscopy Versus Median Time to See an Orthopedist
Median Time to See an Orthopedist Median Payment for Knee Arthroscopy (CPT 29881)
37
Chart 11l
$0
$200
$400
$600
$800
$1,000
$1,200
0
5
10
15
20
25
30
35
SD CO VT CT ME MD RI NV UT FL KY KS OK TN AR AZ GA NM NE IA DC AL OR MO NH MT ID SC VA WV LA IL HI MS AK
MedianPayment
Days From Injury
State Median Payment for Physical TherapyVersus Median Time to See a Therapist
Median Time to See a Therapist Median Payment for Physical Therapy (CPT 97110)
38
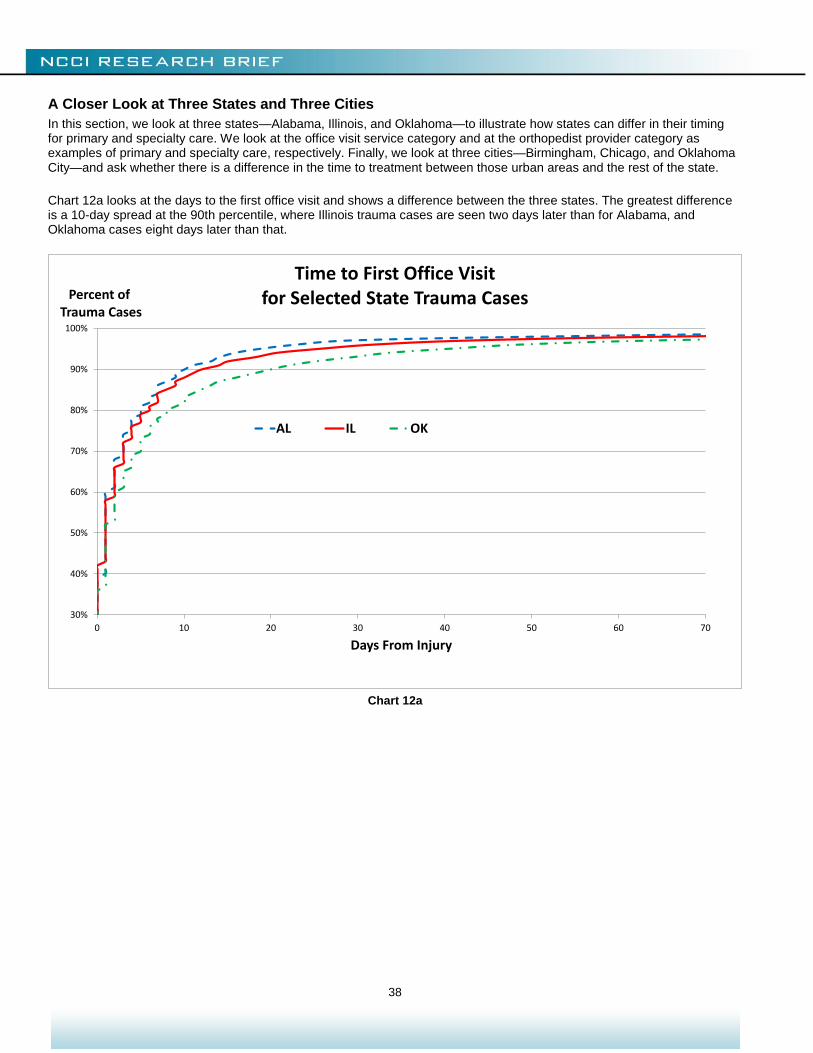
A Closer Look at Three States and Three Cities
In this section, we look at three states—Alabama, Illinois, and Oklahoma—to illustrate how states can differ in their timing for primary and specialty care. We look at the office visit service category and at the orthopedist provider category as examples of primary and specialty care, respectively. Finally, we look at three cities—Birmingham, Chicago, and Oklahoma City—and ask whether there is a difference in the time to treatment between those urban areas and the rest of the state. Chart 12a looks at the days to the first office visit and shows a difference between the three states. The greatest difference is a 10-day spread at the 90th percentile, where Illinois trauma cases are seen two days later than for Alabama, and Oklahoma cases eight days later than that.
Chart 12a
30%
40%
50%
60%
70%
80%
90%
100%
0 10 20 30 40 50 60 70
Percent ofTrauma Cases
Days From Injury
Time to First Office Visit for Selected State Trauma Cases
AL IL OK
39
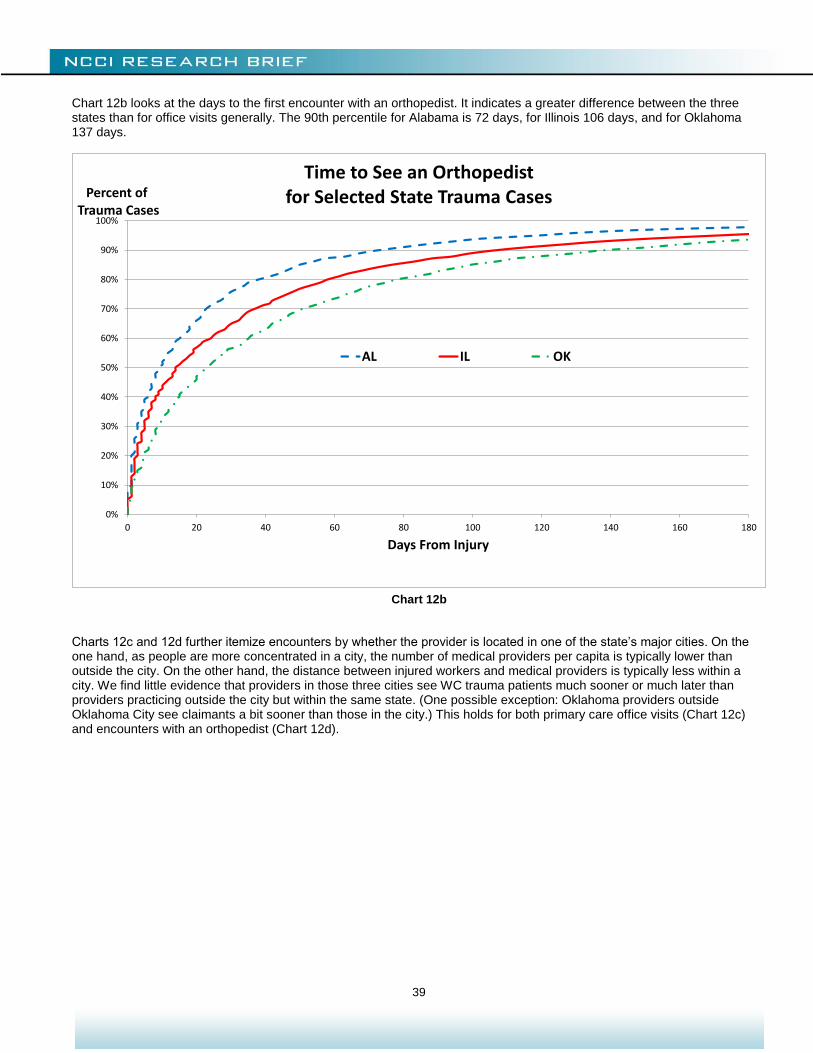
Chart 12b looks at the days to the first encounter with an orthopedist. It indicates a greater difference between the three states than for office visits generally. The 90th percentile for Alabama is 72 days, for Illinois 106 days, and for Oklahoma 137 days.
Chart 12b
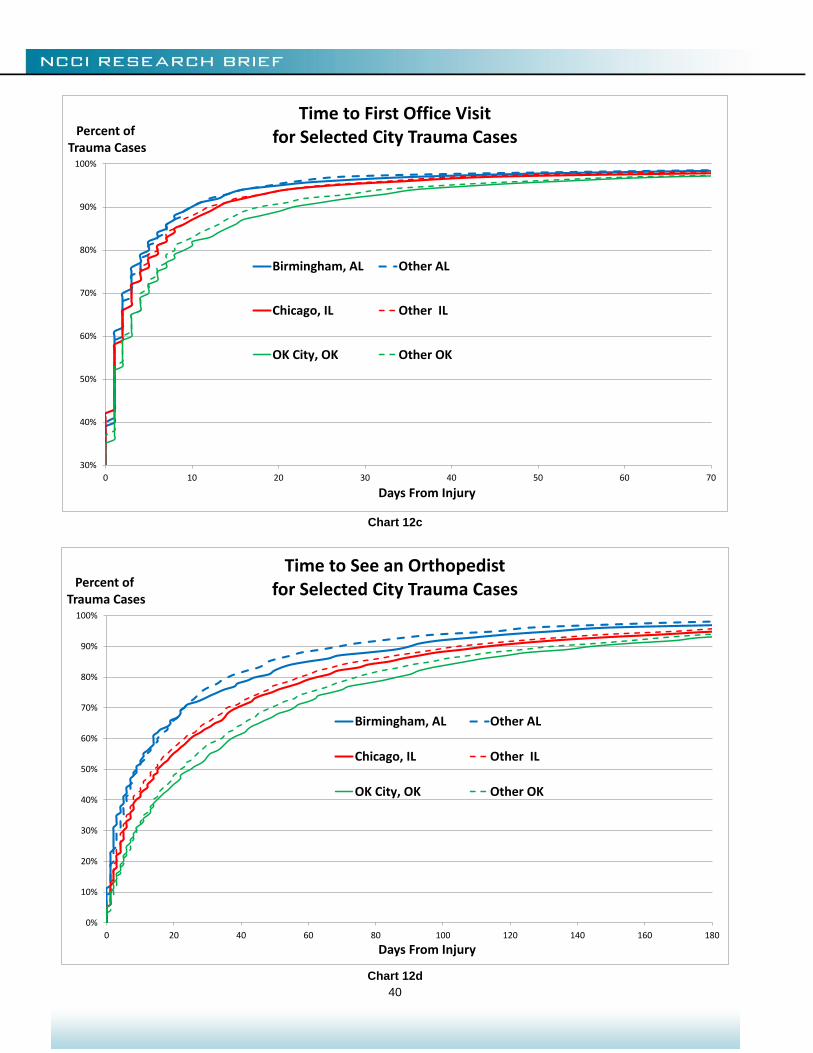
Charts 12c and 12d further itemize encounters by whether the provider is located in one of the state’s major cities. On the one hand, as people are more concentrated in a city, the number of medical providers per capita is typically lower than outside the city. On the other hand, the distance between injured workers and medical providers is typically less within a city. We find little evidence that providers in those three cities see WC trauma patients much sooner or much later than providers practicing outside the city but within the same state. (One possible exception: Oklahoma providers outside Oklahoma City see claimants a bit sooner than those in the city.) This holds for both primary care office visits (Chart 12c) and encounters with an orthopedist (Chart 12d).
0%
10%
20%
30%
40%
50%
60%
70%
80%
90%
100%
0 20 40 60 80 100 120 140 160 180
Percent ofTrauma Cases
Days From Injury
Time to See an Orthopedist for Selected State Trauma Cases
AL IL OK
40
Chart 12c
Chart 12d
30%
40%
50%
60%
70%
80%
90%
100%
0 10 20 30 40 50 60 70
Percent ofTrauma Cases
Days From Injury
Time to First Office Visit for Selected City Trauma Cases
Birmingham, AL Other AL
Chicago, IL Other IL
OK City, OK Other OK
0%
10%
20%
30%
40%
50%
60%
70%
80%
90%
100%
0 20 40 60 80 100 120 140 160 180
Percent ofTrauma Cases
Days From Injury
Time to See an Orthopedist for Selected City Trauma Cases
Birmingham, AL Other AL
Chicago, IL Other IL
OK City, OK Other OK
41
CONCLUSION
In general terms, the study indicates that the healthcare system currently has sufficient capacity reserve so that provider availability plays a secondary role to claimant behavior in driving the time to treatment. One takeaway from this is how, in a changing healthcare environment, educating workers about accessing the WC system becomes increasingly important.
We saw that the use of provider networks can influence the timing of care, especially toward making use of physical and occupational therapy sooner. Conversely, looking at office visits and arthroscopies, we found no relationship between higher reimbursement levels and a shorter time to begin treatment. Future studies may help determine the impact of an increase in the number of patients on the ability of the healthcare system to handle the caseload.
We note several areas of research to better understand the baseline and subsequent experience:
Treatment guidelines
Providers per capita
Population density
Change in the uninsured population
Claimant attorney involvement
WC fee schedules versus Medicare/Medicaid
This investigation also shows that claimant age and gender as well as nature of injury affect time to treatment. And research is ongoing on building models for time to treatment that control for injury mix and claimant demographics. In closing, we also note that emerging technologies, such as the introduction of medical triage via telephone or Internet, will surely add challenges to future research that seeks to isolate the impact of ACA on the access to medical care—inside and outside of workers compensation.
ACKNOWLEDGMENTS
While many NCCI employees helped with this study, the authors would like to single out Chun Shyong and Miguel Henry, who worked on the analysis and exhibits, and David Colón and Natasha Moore, who reviewed prior drafts and made several suggestions that have been incorporated here.
We also thank healthcare consultant Dr. David Deitz of David Deitz and Associates, LLC, for his valuable contributions. Finally, we thank the many NCCI-affiliated insurance companies that shared their insights on the topics discussed in this study.
© Copyright 2016 National Council on Compensation Insurance, Inc. All Rights Reserved. THE RESEARCH ARTICLES AND CONTENT DISTRIBUTED BY NCCI ARE PROVIDED FOR GENERAL INFORMATIONAL PURPOSES ONLY AND ARE PROVIDED “AS IS.” NCCI DOES NOT GUARANTEE THEIR ACCURACY OR COMPLETENESS NOR DOES NCCI ASSUME ANY LIABILITY THAT MAY RESULT IN YOUR RELIANCE UPON SUCH INFORMATION. NCCI EXPRESSLY DISCLAIMS ANY AND ALL WARRANTIES OF ANY KIND INCLUDING ALL EXPRESS, STATUTORY AND IMPLIED WARRANTIES INCLUDING THE IMPLIED WARRANTIES OF MERCHANTABILITY AND FITNESS FOR A PARTICULAR PURPOSE.